Supporting Information
1 Synthetic details
The details of the synthetic procedures for 2ThDp, 2ThDpF, 3ThDp and 3ThDpF are
listed in Scheme S1. Thiophene-2-carbaldehyde, thiophene-3-carbaldehyde, carbon
tetrabromide and triphenylphosphine were purchased from SigmaAldrich Chemical
Co.. Phenylboronic acid, (4-fluorophenyl)boronic acid, Pd(PPh3)4, and K2CO3 were
purchased from Aladdin Chemical Co.. All chemicals were of analytical grade and used
as received. Compound 2-(2,2-dibromovinyl)thiophene and 3-(2,2-
dibromovinyl)thiophene was synthesized according to previous reports.[1] All the final
compounds were characterized by 1H NMR spectroscopy, high-resolution EI mass
spectroscopy and elemental analysis. All solvents were distilled and purified according
to standard procedures before use.S
R RBr Br
S
O
SCBr4, PPh3
CH2Cl2, 0oC Pd(PPh3)4, K2CO3
B(OH)2R 2ThDp : R = H;2ThDpF : R = F;
S
R RBr Br
S
O
S CBr4, PPh3
CH2Cl2, 0oC Pd(PPh3)4, K2CO3
B(OH)2R 3ThDp : R = H;3ThDpF : R = F;
(a)
(b)
Scheme S1 (a) Synthetic routes for compounds 2ThDp and 2ThDpF; (b) Synthetic
routes for compounds 3ThDp and 3ThDpF.
S
2-(2,2-diphenylvinyl)thiophene (2ThDp) To a mixture of 2-(2,2-
dibromovinyl)thiophene (1.34 g, 5.0 mmol) and phenylboronic acid (1.83 g 15.0 mmol)
in degassed THF (30 ml) was added 2M K2CO3 aqueous solution (10 ml). After
degassing for 20 minutes, Pd(PPh3)4 (100mg, 0.10 mmol) was added to the mixture.
The resulting mixture was stirred at reflux for 24 hours under an argon atmosphere.
Electronic Supplementary Material (ESI) for Journal of Materials Chemistry C.This journal is © The Royal Society of Chemistry 2018

After cooling down to room temperature, the mixture was filtered and the filtrate was
purified by column chromatography with hexane as eluent. The residue was purified by
recrystallization by CH2Cl2-hexane mixed solvent system. Colorless oil was achieved.
Yield: 0.76 g (58 %). 1H NMR (500 MHz, CDCl3, 298 K): δ = 7.437.49 (m, 3H),
7.287.34 (m, 7H), 7.227.24 (m, 1H) 7.037.04 (m, 1H), 6.916.92 (m,
1H6.866.87 (m, 1H; High solution EIMS: m/z 262.0809 [M]+; calcd for C18H14S:
262.0816. Elemental analyses (%) calcd for C18H14S: C 82.40, H 5.38; found: C 82.12,
H 5.77.
S
F F
2-(2,2-bis(4-fluorophenyl)vinyl)thiophene (2ThDpF) This compound was prepared
according to the aforementioned procedure for 2ThDp except that phenylboronic acid
(1.83 g 15.0 mmol) was replace with (4-fluorophenyl)boronic acid (2.10 g 15.0 mmol).
A white solid was achieved. Yield: 1.15 g (77 %). 1H NMR (500 MHz, deutered
DMSO, 298 K): δ = 7.50 (s, 1H), 7.317.38 (m, 5H, 7.257.28 (m, 2H 7.147.19 (m,
3H, 6.946.96 (m, 1H. High solution EIMS: m/z found: 298.0620 [M]+; calcd for
C18H12F2S: 298.0628. Elemental analyses (%) calcd for C18H12F2S: C 72.46, H 4.05;
found: C 72.12, H 4.32.
S
3-(2,2-diphenylvinyl)thiophene (3ThDp) This compound was prepared according to
the aforementioned procedure for 2ThDp except that 2-(2,2-dibromovinyl)thiophene
(1.34 g, 5.0 mmol) was replace with 3-(2,2-dibromovinyl)thiophene (1.34 g, 5.0 mmol).
A white solid was achieved. Yield: 0.95 g (72 %). 1H NMR (500 MHz, deutered
DMSO, 298 K): δ = 7.427.49 (m, 3H), 7.267.35 (m, 6H), 7.187.21 (m, 3H)
7.137.14 (m, 1H), 6.326.33 (m, 1H; High solution EIMS: m/z 262.0809 [M]+;
calcd for C18H14S: 262.0816. Elemental analyses (%) calcd for C18H14S: C 82.40, H
5.38; found: C 81.97, H 5.59.

S
F F3-(2,2-bis(4-fluorophenyl)vinyl)thiophene (3ThDpF) This compound was prepared
according to the aforementioned procedure for 2ThDp except that 2-(2,2-
dibromovinyl)thiophene (1.34 g, 5.0 mmol) and phenylboronic acid (1.83 g 15.0 mmol)
were replace with 3-(2,2-dibromovinyl)thiophene (1.34 g, 5.0 mmol) and (4-
fluorophenyl)boronic acid (2.10 g 15.0 mmol) respectively. Yield: 1.21 g (81 %). 1H
NMR (500 MHz, deutered DMSO, 298 K): δ = 7.297.34 (m, 5H), 7.207.24 (m, 2H)
7.167.19 (m, 4H), 6.356.36 (m, 1H; High solution EIMS: m/z found: 298.0624
[M]+; calcd for C18H12F2S: 298.0628. Elemental analyses (%) calcd for C18H12F2S: C
72.46, H 4.05; found: C 72.21, H 4.17.
Instrument:MAT 95XP(Thermo)D:\DATA-HR\17\062005-sf-2p-c1 6/22/2017 11:43:24 AM SF-2P
062005-sf-2p-c1 #15 RT: 0.56 AV: 1 NL: 4.68E4T: + c EI Full ms [ 252.50-271.50]
262.00 262.02 262.04 262.06 262.08 262.10 262.12 262.14m/z
0.00
0.05
0.10
0.15
0.20
0.25
0.30
0.35
0.40
0.45
0.50
0.55
0.60
0.65
0.70
0.75
0.80
0.85
0.90
Rel
ativ
e A
bund
ance
262.0809
Figure S1 High Resolution EI mass spectrum of compound 2ThDp.

Instrument:MAT 95XP(Thermo)D:\DATA-HR\17\062003-sf-2f-c1 6/22/2017 11:29:30 AM SF-2F
062003-sf-2f-c1 #6 RT: 0.25 AV: 1 NL: 3.58E4T: + c EI Full ms [ 290.50-307.50]
298.02 298.03 298.04 298.05 298.06 298.07 298.08 298.09 298.10m/z
0
5
10
15
20
25
30
35
40
45
50
55
60
65
70
75
80
85
90
95
100
Rel
ativ
e A
bund
ance
298.0620
Figure S2 High Resolution EI mass spectrum of compound 2ThDpF.
Instrument:MAT 95XP(Thermo)D:\DATA-HR\17\091105-3-sf-2p-c3 9/11/2017 12:21:14 PM 3-sf-2p
091105-3-sf-2p-c3 #8 RT: 0.31 AV: 1 NL: 1.46E5T: + c EI Full ms [ 252.50-271.50]
262.01 262.02 262.03 262.04 262.05 262.06 262.07 262.08 262.09 262.10 262.11 262.12 262.13 262.14 262.15m/z
0
5
10
15
20
25
30
35
40
45
50
55
60
65
70
75
80
85
90
95
100
Rel
ativ
e A
bund
ance
262.0813
Figure S3 High Resolution EI mass spectrum of compound 3ThDp.

Instrument:MAT 95XP(Thermo)D:\DATA-HR\17\091103-3-sf-2f-c3 9/11/2017 12:08:25 PM 3-sf-2F
091103-3-sf-2f-c3 #3 RT: 0.13 AV: 1 NL: 4.90E4T: + c EI Full ms [ 290.50-307.50]
298.01 298.02 298.03 298.04 298.05 298.06 298.07 298.08 298.09 298.10 298.11m/z
0
5
10
15
20
25
30
35
40
45
50
55
60
65
70
75
80
85
90
95
100
Rel
ativ
e A
bund
ance
298.0624
Figure S4 High Resolution EI mass spectrum of compound 3ThDpF.
2 Physical measurements and instrumentations1H NMR spectra were obtained using a Bruker Avance III 500 NMR (Nuclear Magnetic
Resonance Spectrometer) with chemical shifts recorded relative to tetramethylsilane
(TMS). 1H1H COSY spectra were measured with a Bruker AVANCE 600 Nuclear
Magnetic Resonance Spectrometer. Positive ion EI mass spectra were performed using
a Thermo MAT95XP high resolution mass spectrometer. The elemental analysis was
performed using a Vario EL analyzer. Single-crystal X-ray data for 3ThDpF was
determined on an Oxford Diffraction Germini S Ultra X-ray Single Crystal
Diffractometer using a (Cu) X-ray source. UV-vis reflectance spectra were recorded
using an Ocean Optic Maya2000PRO spectrometer with Ocean Optic reflection probes
R600-125F. Steady state fluorescence studies were conducted using a Horiba Scientific
Fluorolog-3 spectrofluorometer.

3 Photophysical data and spectra
400 450 500 550 6000.0
0.2
0.4
Abs
orpt
ion
Wavelength/ nm
0 s 50 s 100 s 150 s 200 s 250 s 300 s 350 s 400 s 450 s 500 s 550 s 600 s 650 s 700 s 750 s 800 s 850 s 900 s 950 s 1000 s 1050 s
Figure S5 Time-dependent UV-vis absorption spectra of 2ThDpF during the
photochromic bleaching process (in degassed THF solution, with concentration of
1.0×10⁻³ M).
400 450 500 550 6000.00
0.05
0.10
0.15
0.20
Abs
orpt
ion
Wavelength/ nm
0 s 25 s 50 s 75 s 100 s 125 s 150 s 175 s 200 s 225 s 250 s 275 s 300 s 325 s 350 s 375 s 400 s 425 s 450 s 475 s 500 s
Figure S6 Time-dependent UV-vis absorption spectra of 3ThDpF during the
photochromic bleaching process (in degassed THF solution, with concentration of
1.0×10⁻³ M).

400 450 500 5500.0
0.2
0.4A
bsor
ptio
n
Wavelength/ nm
0h 3h 6h 9h 12h 15h 18h 21h 24h 27h 42h
Figure S7 Time-dependent UV-vis absorption spectra of ring-closure state of
2ThDpF in dark at 303 K (in degassed THF solution, with concentration of 1.0×10⁻³
M).
400 450 500 550 6000.0
0.1
0.2
0.3
Abs
orpt
ion
Wavelength/ nm
0h 3h 6h 9h 12h 15h 18h 21h 24h 27h 30h
Figure S8 Time-dependent UV-vis absorption spectra of ring-closure state of
3ThDpF in dark at 303 K (in degassed THF solution, with concentration of 1.0×10⁻³
M).
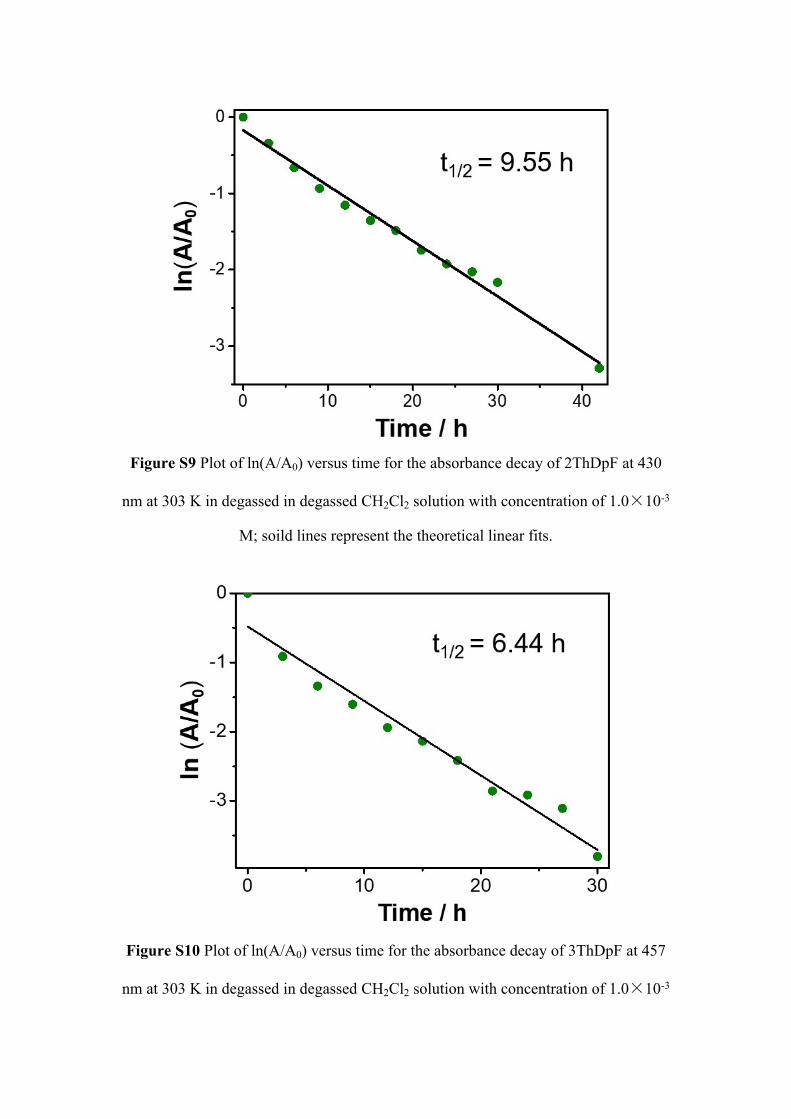
Figure S9 Plot of ln(A/A0) versus time for the absorbance decay of 2ThDpF at 430
nm at 303 K in degassed in degassed CH2Cl2 solution with concentration of 1.0×10⁻³
M; soild lines represent the theoretical linear fits.
Figure S10 Plot of ln(A/A0) versus time for the absorbance decay of 3ThDpF at 457
nm at 303 K in degassed in degassed CH2Cl2 solution with concentration of 1.0×10⁻³

M; soild lines represent the theoretical linear fits.
Figure S11 Time dependent UV-vis reflectance spectra of compound 3ThDpF in
solid state during the photochromic process.
Figure S12 Time dependent UV-vis reflectance spectra of compound 3ThDpF in
solid state during the photochromic bleaching process.
0 5 10 15 20
0.0
0.1
0.2
0.3
0.4
0.5
0.6
Vis 15min
Abs
orpt
ion
at 4
68 n
m
Repeat times
UV 15s
Figure S13 Recycling of the photochromic process of compound 3ThDpF in solid
state as a function of exposure to UV-light (365 nm) and white-light for 15 seconds
and 15 minutes, respectively.
400 450 500 550 6000
2x10⁴
4x10⁴
6x10⁴
8x10⁴
1x10⁵
1x10⁵
Emiss
ion
Inte
nsity
Wavelength/ nm
Before Irradiation After Irradiation
Figure S14 The emission spectra for 2ThDpF in solid state before and after UV-light
irradiation.

350 400 450 5000
1x10⁴
2x10⁴
3x10⁴
4x10⁴
5x10⁴
Emiss
ion
Inte
nsity
Wavelength/ nm
Before Irradiation After Irradiation
Figure S15 The emission spectra for 3ThDpF in solid state before and after UV-light
irradiation.
10 20 30 40 502 / Degree
3ThDpF 2ThDpF
Figure S16 pXRD spectra of 2ThDpF and 3ThDpF powders.

Figure S17 Time dependent UV-vis reflectance spectra of 2ThDpF in single-crystal
state during the photochromic process.
. Figure S18 Time dependent UV-vis reflectance spectra of 2ThDpF in single-crystal
state during the photochromic bleaching process.

Figure S19 Photos of 2ThDpF: (a) Before UV-irradiated observed under daylight; (b)
After UV-irradiated observed under daylight; (c) Before UV-irradiated observed
under Uv-light; (d) After UV-irradiated observed under Uv-light.

Figure S20 Illustration of the photopatterning processes for polymer films containing
2ThDpF: (a) Before UV-irradiated; (b) After UV-irradiated; (c) After UV-irradiated
with mask (observed under daylight); (d) After UV-irradiated with mask (observed
under UV-light); (e) The UV-irradiated film further irradiated with white-light with
mask (observed under daylight); (f) The UV-irradiated film further irradiated with
white-light with mask (observed under UV-light).
400 450 500 550 6000.00
0.02
0.04
0.06
0.08
0.10
0.12
0.14 0 min 5 min 10 min 15 min 20 min 25 min 30 min 35 min 40 min 45 min 50 min 55 min 60 min 65 min 70 min 75 min 80 min 85 min 90 min 95 min 100 min
Abs
orpt
ion
Wavelength/ nm
Figure S21 Time dependent UV-vis reflectance spectra of polymer films containing 5
wt% 2ThDpF during the photochromic bleaching process.

400 450 500 550 600 6500.00
0.05
0.10
0.15
0.20
0.25
0.30A
bsor
ptio
n
Wavelength/ nm
0 min 10 min 20 min 30 min 40 min 50 min 60 min 70 min 80 min 90 min 100 min 110 min 120 min 130 min 140 min
Figure S22 Time dependent UV-vis reflectance spectra of polymer films containing 5
wt% 3ThDpF during the photochromic bleaching process.
0 5 10 15 20
0.00
0.05
0.10
0.15
Vis 100minAbs
orpt
ion
at 4
46 n
m
Repeat times
UV 3min
Figure S23 Recycling of the photochromic process of polymer films containing 5 wt%
2ThDpF as a function of exposure to UV-light (365 nm) and white-light for 3 minutes
and 100 minutes, respectively.

0 5 10 15 20
0.00
0.05
0.10
0.15
0.20
0.25
0.30
0.35
Vis 140minAbs
orpt
ion
at 4
61 n
m
Repeat times
UV 3min
Figure S24 Recycling of the photochromic process of polymer films containing 5 wt%
3ThDpF as a function of exposure to UV-light (365 nm) and white-light for 3 minutes
and 140 minutes, respectively.
4 Demonstration of the photochromic mechanism
(1) 2ThDpFS
F F F F F Fvis
S SHH
I2
2ThDpF 2ThDpF(C) 2ThDpF(O)
UVUV
Photochemical reaction procedure of 2ThDpF: A mixture of 2-(2,2-bis(4-
fluorophenyl)vinyl)thiophene (30.0 mg, 0.1 mmol) and iodine (51.0 mg, 0.4 mmol) in
degassed cyclohexane (5 ml) was irradiated with UV-light in a photochemical reactor
(Rayonet RPR200) for 12 h. The mixture was dissolved in 20 ml dichloromethane and
washed with Na2SO3 aqueous solution for 3 times. The mixture was further purified by
column chromatography with hexane as eluent. A white solid named 2ThDpF(O) was
obtained. Yield: 26.1 mg (86.6 %).

Charactriztion of 2ThDpF(O): 1H NMR (500 MHz, deutered DMSO, 298 K): δ =
8.43 (dd, 10.6 Hz, 2.7 Hz, 1H), 8.28 (d, 5.0 Hz, 1H) 7.97 (s, 1H), 7.95 (d, 5.4 Hz, 1H),
7.82 (dd, 9.2 Hz, 5.8Hz, 1H), 7.537.56 (m, 2H7.407.44 (m, 1H7.357.39 (m,
2H; High solution EIMS: m/z found: 296.0467 [M]+; calcd for C18H10F2S: 296.0471.
Elemental analyses (%) calcd for C18H10F2S: C 72.96, H 3.40; found: C 72.65, H 3.60.Instrument:MAT 95XP(Thermo)D:\DATA-HR\17\081401-sf-c1 8/14/2017 3:53:28 PM SF-2F-R
081401-sf-c1 #17 RT: 0.66 AV: 1 NL: 1.10E5T: + c EI Full ms [ 290.50-307.50]
295.70 295.75 295.80 295.85 295.90 295.95 296.00 296.05 296.10 296.15 296.20 296.25 296.30 296.35m/z
0
5
10
15
20
25
30
35
40
45
50
55
60
65
70
75
80
85
90
95
100
Rel
ativ
e A
bund
ance
296.0467
Figure S25 High Resolution EI mass spectrum of compound 2ThDpF(O).
Figure S26. 1H1H COSY NMR spectrum of 2ThDpF(O) in deutered DMSO solution.
(2) 3ThDpF

S
F F F F F F
Uv
vis
S SHH
I2Uv
3ThDpF 3ThDpF(C) 3ThDpF(O)
Photochemical reaction procedure of 3ThDpF: This compound was prepared
according to the aforementioned procedure for 2ThDpF(O) except that 3-(2,2-bis(4-
fluorophenyl)vinyl)thiophene (30.0 mg, 0.1 mmol) were used in place of 2-(2,2-bis(4-
fluorophenyl)vinyl)thiophene (30.0 mg, 0.1 mmol). A white solid named 2ThDpF(O)
was obtained. Yield: 25.7 mg (85.3 %).
Charactriztion of 3ThDpF(O): 1H NMR (500 MHz, deutered DMSO, 298 K): δ =
7.99 (dd, 9.9 Hz, 2.6 Hz, 1H), 7.96 (d, 5.3 Hz, 1H) 7.837.86 (m, 2H), 7.64 (d, 5.3 Hz,
1H), 7.547.57 (m, 2H), 7.437.46 (m, 1H7.377.41 (m, 2H; High solution EIMS:
m/z found: 296.0464 [M]+; calcd for C18H10F2S: 296.0471. Elemental analyses (%)
calcd for C18H10F2S: C 72.96, H 3.40; found: C 72.77, H 3.51.Instrument:MAT 95XP(Thermo)D:\DATA-HR\17\091104-3-sf-r-c1 9/11/2017 12:12:46 PM 3-sf-r
091104-3-sf-r-c1 #14 RT: 0.55 AV: 1 NL: 7.99E4T: + c EI Full ms [ 290.50-307.50]
295.75 295.80 295.85 295.90 295.95 296.00 296.05 296.10 296.15 296.20 296.25 296.30m/z
0
5
10
15
20
25
30
35
40
45
50
55
60
65
70
75
80
85
90
95
100
Rel
ativ
e A
bund
ance
296.0464
Figure S27 High Resolution EI mass spectrum of compound 3ThDpF(O).

Figure S28. 1H1H COSY NMR spectrum of 3ThDpF(O) in deutered DMSO solution.
Figure S29 SEM image for the cross sections of surface-2ThDpF.
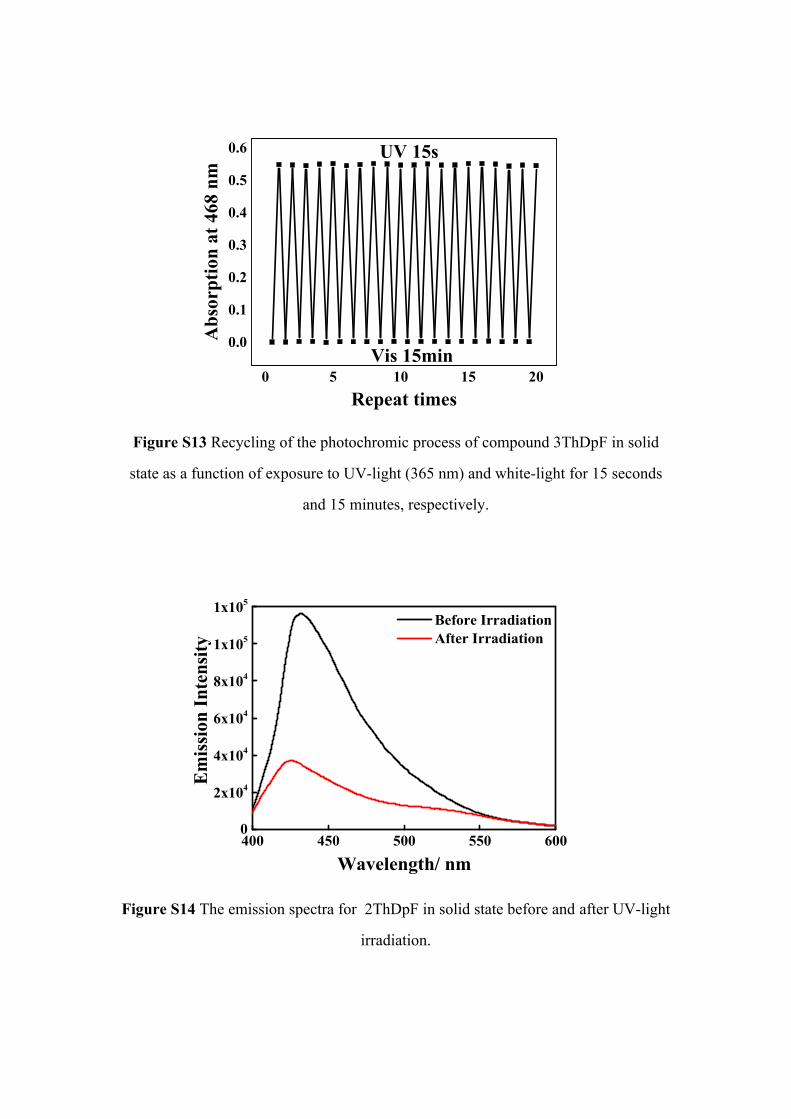
Figure S30 SEM image for the cross sections of surface-3ThDpF.
Figure S31 AFM images and contact angles for the surface-3ThDpF before, after
UV-light irradiation (1 minute) and further white-light irradiation for 15 minutes.
5. Single crystal data of 2ThDpF
Single-crystal X-ray analyses for 2ThDpF were performed on an Oxford Diffraction
Gemini S Ultra X-ray single-crystal diffractometer with graphite-monochromatized
Cu-Kα radiation (λ = 1.54184 Å). The structure was solved with Olex2 v1.2 program
and expanded using Fourier techniques. Non-H atoms of this compound was further
refined with anisotropic thermal parameters. The hydrogen atoms were added in
idealized positions and refined with fixed geometry according to their carrier atoms.
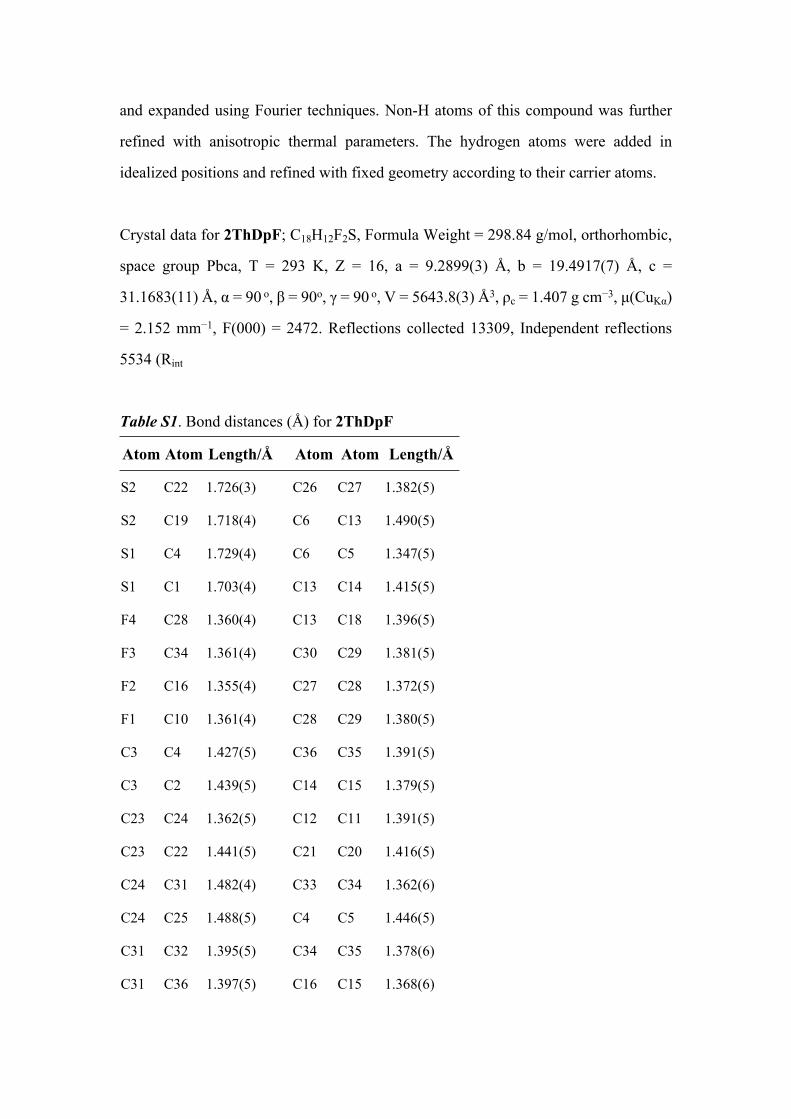
Crystal data for 2ThDpF; C18H12F2S, Formula Weight = 298.84 g/mol, orthorhombic,
space group Pbca, T = 293 K, Z = 16, a = 9.2899(3) Å, b = 19.4917(7) Å, c =
31.1683(11) Å, α = 90 o, β = 90o, γ = 90 o, V = 5643.8(3) Å3, ρc = 1.407 g cm−3, μ(CuKα)
= 2.152 mm−1, F(000) = 2472. Reflections collected 13309, Independent reflections
5534 (Rint
Table S1. Bond distances (Å) for 2ThDpF
Atom Atom Length/Å Atom Atom Length/Å
S2 C22 1.726(3) C26 C27 1.382(5)
S2 C19 1.718(4) C6 C13 1.490(5)
S1 C4 1.729(4) C6 C5 1.347(5)
S1 C1 1.703(4) C13 C14 1.415(5)
F4 C28 1.360(4) C13 C18 1.396(5)
F3 C34 1.361(4) C30 C29 1.381(5)
F2 C16 1.355(4) C27 C28 1.372(5)
F1 C10 1.361(4) C28 C29 1.380(5)
C3 C4 1.427(5) C36 C35 1.391(5)
C3 C2 1.439(5) C14 C15 1.379(5)
C23 C24 1.362(5) C12 C11 1.391(5)
C23 C22 1.441(5) C21 C20 1.416(5)
C24 C31 1.482(4) C33 C34 1.362(6)
C24 C25 1.488(5) C4 C5 1.446(5)
C31 C32 1.395(5) C34 C35 1.378(6)
C31 C36 1.397(5) C16 C15 1.368(6)

C25 C26 1.398(5) C16 C17 1.375(5)
C25 C30 1.389(5) C10 C11 1.392(6)
C32 C33 1.397(5) C10 C9 1.345(6)
C22 C21 1.390(5) C19 C20 1.350(6)
C7 C6 1.501(5) C2 C1 1.351(5)
C7 C12 1.393(5) C8 C9 1.391(5)
C7 C8 1.385(5) C17 C18 1.389(6)
Table S2. Bond Angles (o) for 2ThDpF
Atom Atom Atom Angle/˚ Atom Atom Atom Angle/˚
C19 S2 C22 92.43(18) C27 C28 C29 122.9(3)
C1 S1 C4 92.54(18) C35 C36 C31 120.9(3)
C4 C3 C2 110.0(3) C15 C14 C13 120.7(4)
C24 C23 C22 129.1(3) C11 C12 C7 120.2(4)
C23 C24 C31 119.7(3) C22 C21 C20 113.5(3)
C23 C24 C25 122.4(3) C34 C33 C32 118.4(4)
C31 C24 C25 118.0(3) C28 C29 C30 118.4(3)
C32 C31 C24 121.9(3) C3 C4 S1 110.8(3)
C32 C31 C36 118.2(3) C3 C4 C5 122.3(3)
C36 C31 C24 119.9(3) C5 C4 S1 126.7(3)
C26 C25 C24 119.2(3) F3 C34 C33 119.0(4)
C30 C25 C24 121.5(3) F3 C34 C35 118.3(4)
C30 C25 C26 119.3(3) C33 C34 C35 122.7(3)
C31 C32 C33 121.2(4) C6 C5 C4 130.2(3)
C23 C22 S2 127.3(3) F2 C16 C15 119.1(3)
C21 C22 S2 109.5(2) F2 C16 C17 118.7(4)
C21 C22 C23 123.1(3) C15 C16 C17 122.3(4)
C12 C7 C6 120.1(3) C34 C35 C36 118.6(4)
C8 C7 C6 120.1(3) F1 C10 C11 117.2(4)
C8 C7 C12 119.7(3) C9 C10 F1 120.1(4)
C27 C26 C25 120.7(3) C9 C10 C11 122.7(3)
C13 C6 C7 116.8(3) C20 C19 S2 112.1(3)
C5 C6 C7 121.5(3) C1 C2 C3 114.1(3)
C5 C6 C13 121.6(3) C16 C15 C14 119.4(3)
C14 C13 C6 120.2(3) C7 C8 C9 120.1(4)
C18 C13 C6 122.1(3) C12 C11 C10 117.9(4)
C18 C13 C14 117.8(3) C19 C20 C21 112.5(4)
C29 C30 C25 120.6(3) C10 C9 C8 119.4(4)
C28 C27 C26 118.2(3) C2 C1 S1 112.5(3)
F4 C28 C27 118.2(3) C16 C17 C18 118.5(4)
F4 C28 C29 118.9(3) C17 C18 C13 121.4(3)
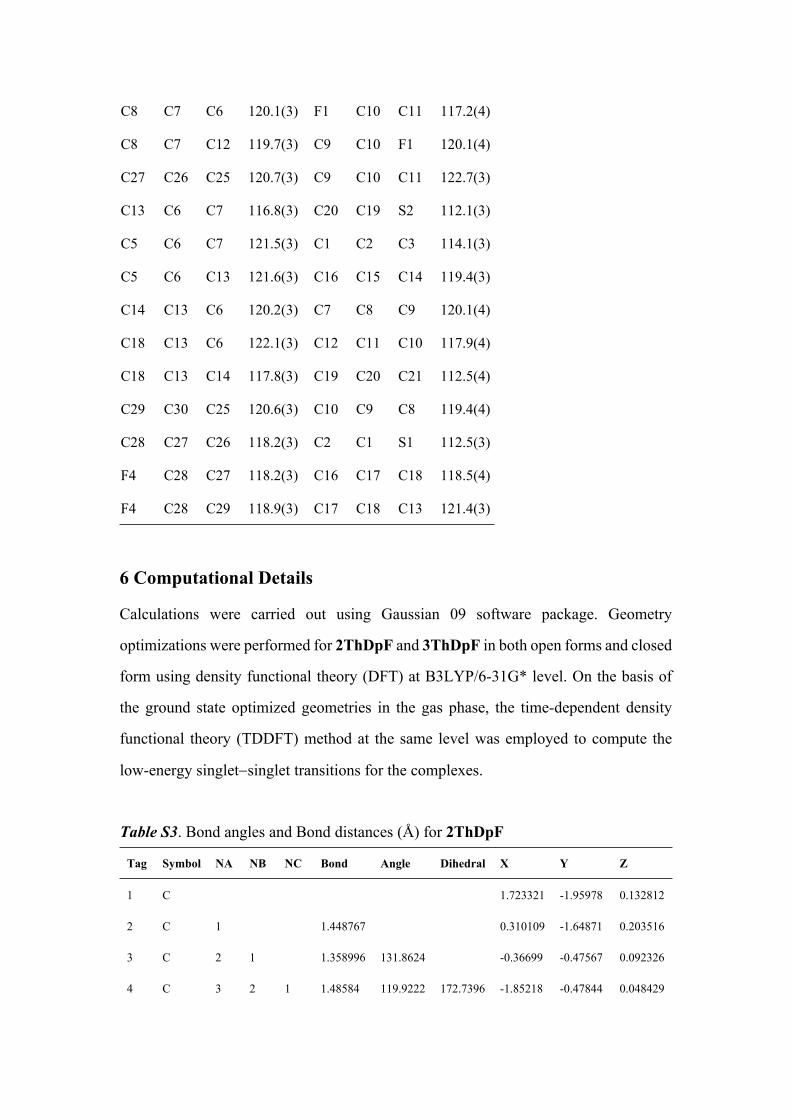
6 Computational Details
Calculations were carried out using Gaussian 09 software package. Geometry
optimizations were performed for 2ThDpF and 3ThDpF in both open forms and closed
form using density functional theory (DFT) at B3LYP/6-31G* level. On the basis of
the ground state optimized geometries in the gas phase, the time-dependent density
functional theory (TDDFT) method at the same level was employed to compute the
low-energy singletsinglet transitions for the complexes.
Table S3. Bond angles and Bond distances (Å) for 2ThDpF
Tag Symbol NA NB NC Bond Angle Dihedral X Y Z
1 C 1.723321 -1.95978 0.132812
2 C 1 1.448767 0.310109 -1.64871 0.203516
3 C 2 1 1.358996 131.8624 -0.36699 -0.47567 0.092326
4 C 3 2 1 1.48584 119.9222 172.7396 -1.85218 -0.47844 0.048429

5 C 3 2 1 1.493414 123.1905 -8.48409 0.307625 0.855494 0.035789
6 C 5 3 2 1.404421 120.7899 -65.1531 1.031341 1.342018 1.136665
7 C 6 5 3 1.394258 121.1713 -178.225 1.633483 2.599171 1.105878
8 C 7 6 5 1.389391 118.6228 -0.10888 1.506968 3.369789 -0.04327
9 C 8 7 6 1.390748 121.9969 0.518122 0.792075 2.928391 -1.15155
10 C 9 8 7 1.393045 118.6308 -0.02994 0.188077 1.674155 -1.10004
11 C 4 3 2 1.408228 120.7679 147.7888 -2.59091 0.590836 0.590678
12 C 11 4 3 1.392329 121.5054 -178.579 -3.98322 0.59054 0.584034
13 C 12 11 4 1.389786 118.8055 -0.51701 -4.64995 -0.48929 0.017506
14 C 13 12 11 1.390062 121.7 -0.41899 -3.96267 -1.55781 -0.54657
15 C 14 13 12 1.392231 118.7745 0.351865 -2.5706 -1.54139 -0.53305
16 F 13 12 11 1.34966 119.1776 -179.673 -5.9995 -0.49424 0.001035
17 F 8 7 6 1.349317 119.0335 -179.881 2.088442 4.58674 -0.08296
18 S 1 2 3 1.759003 126.4491 -8.05636 3.014124 -0.85769 -0.32906
19 C 18 1 2 1.733888 91.83231 -176.313 4.202646 -2.11539 -0.21965
20 C 19 18 1 1.368515 111.986 -0.22252 3.650724 -3.31083 0.153366
21 C 1 2 3 1.383495 123.8716 176.1337 2.246636 -3.22233 0.347652
22 H 2 1 21 1.088543 111.7109 -5.31856 -0.29207 -2.54309 0.353151
23 H 6 5 3 1.085351 119.2423 1.70013 1.12074 0.726666 2.026235
24 H 7 6 5 1.084457 121.683 179.8078 2.191578 2.98428 1.952204
25 H 9 8 7 1.084483 119.6488 179.7803 0.714807 3.562911 -2.02763
26 H 10 9 8 1.08562 119.4945 179.4399 -0.38106 1.319518 -1.95379
27 H 11 4 3 1.084667 119.363 0.561597 -2.06527 1.428367 1.036483
28 H 12 11 4 1.084587 121.5507 179.3202 -4.55296 1.408628 1.011193
29 H 14 13 12 1.084608 119.6393 -178.431 -4.51662 -2.37128 -1.00239
30 H 15 14 13 1.085082 118.9804 -177.576 -2.03061 -2.35422 -1.00753
31 H 19 18 1 1.081348 119.6961 -179.654 5.239752 -1.89207 -0.42905
32 H 20 19 18 1.083831 123.5911 -179.693 4.224031 -4.22136 0.283542
33 H 21 1 2 1.084719 121.9901 -2.94665 1.622304 -4.0623 0.632742

Table S4. Bond angles and Bond distances (Å) for 2ThDpF(C)
Tag Symbol NA NB NC Bond Angle Dihedral X Y Z
1 C -1.44047 -1.78184 0.003935
2 C 1 1.348696 -0.1192 -1.61035 0.213266
3 C 2 1 1.460358 120.5217 0.481368 -0.28294 0.113576
4 C 3 2 1 1.487647 116.4021 -166.596 1.966924 -0.2318 0.053572
5 C 3 2 1 1.377651 119.5153 14.65594 -0.33008 0.830354 0.106732
6 C 5 3 2 1.543789 118.2068 7.391215 -1.83714 0.636523 0.379656
7 C 6 5 3 1.509778 114.0999 -169.157 -2.6768 1.859443 0.098813
8 C 7 6 5 1.338002 120.6383 -12.1365 -2.10061 3.048575 -0.11148
9 C 8 7 6 1.445549 123.6261 5.365903 -0.67063 3.240739 -0.20006
10 C 9 8 7 1.356911 119.7488 1.963281 0.159468 2.171409 -0.1069
11 C 4 3 2 1.40624 121.908 -127.294 2.719058 0.570104 0.930357
12 C 11 4 3 1.393744 121.3517 178.1784 4.112138 0.580691 0.888687
13 C 12 11 4 1.389624 118.7459 -0.39848 4.759211 -0.22848 -0.03738
14 C 13 12 11 1.390062 121.814 -0.35126 4.055725 -1.04808 -0.91239
15 C 14 13 12 1.393019 118.6772 0.265856 2.663857 -1.04758 -0.85578
16 F 13 12 11 1.34936 119.0972 -179.921 6.107802 -0.22497 -0.08279
17 F 8 7 6 1.353486 120.7939 -176.93 -2.85154 4.158356 -0.3023
18 S 1 2 3 1.771062 126.9681 -178.147 -2.35016 -3.29663 0.124624
19 C 18 1 2 1.7826 90.3099 166.2456 -3.88377 -2.38807 0.109949
20 C 19 18 1 1.335538 114.794 5.524811 -3.75459 -1.07444 -0.09341
21 C 20 19 18 1.510426 114.7373 3.542739 -2.3412 -0.61167 -0.35716
22 H 6 5 3 1.110083 106.1022 72.49583 -1.92708 0.407887 1.46221
23 H 21 20 19 1.109725 107.9643 103.3233 -2.24139 -0.41974 -1.44559
24 H 2 1 21 1.085602 121.2088 -179.024 0.525497 -2.44948 0.455683
25 H 7 6 5 1.084234 119.3774 172.2243 -3.75761 1.783127 0.13856
26 H 9 8 7 1.08436 118.2349 178.8043 -0.29837 4.240845 -0.39253
27 H 10 9 8 1.083821 119.2358 175.0864 1.223821 2.313095 -0.25436
28 H 11 4 3 1.085177 119.3578 -0.51561 2.205575 1.177455 1.668646
29 H 12 11 4 1.084549 121.6034 -179.533 4.696424 1.19188 1.567881
30 H 14 13 12 1.084538 119.6588 -179.87 4.596514 -1.66717 -1.61984
31 H 15 14 13 1.08586 119.2888 179.6623 2.104211 -1.67989 -1.53847
32 H 19 18 1 1.083106 118.0513 -175.516 -4.80494 -2.94146 0.245296
33 H 20 19 18 1.084264 122.635 177.8897 -4.6061 -0.40649 -0.1597
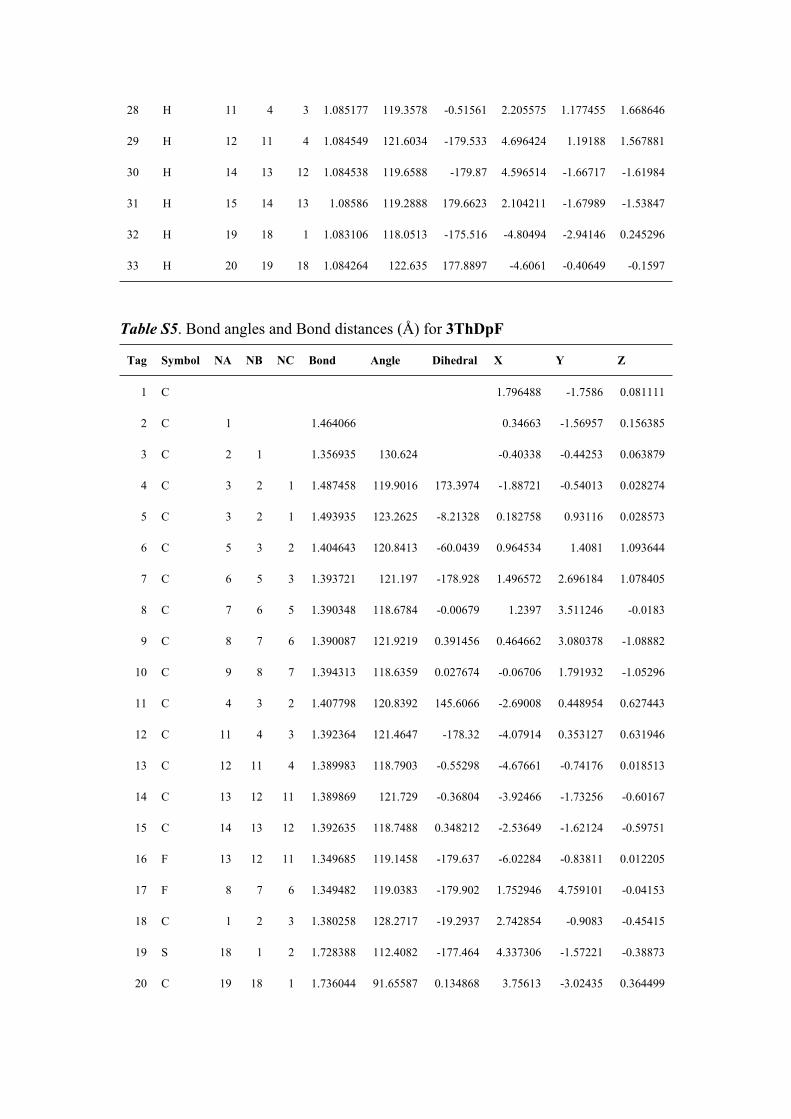
Table S5. Bond angles and Bond distances (Å) for 3ThDpF
Tag Symbol NA NB NC Bond Angle Dihedral X Y Z
1 C 1.796488 -1.7586 0.081111
2 C 1 1.464066 0.34663 -1.56957 0.156385
3 C 2 1 1.356935 130.624 -0.40338 -0.44253 0.063879
4 C 3 2 1 1.487458 119.9016 173.3974 -1.88721 -0.54013 0.028274
5 C 3 2 1 1.493935 123.2625 -8.21328 0.182758 0.93116 0.028573
6 C 5 3 2 1.404643 120.8413 -60.0439 0.964534 1.4081 1.093644
7 C 6 5 3 1.393721 121.197 -178.928 1.496572 2.696184 1.078405
8 C 7 6 5 1.390348 118.6784 -0.00679 1.2397 3.511246 -0.0183
9 C 8 7 6 1.390087 121.9219 0.391456 0.464662 3.080378 -1.08882
10 C 9 8 7 1.394313 118.6359 0.027674 -0.06706 1.791932 -1.05296
11 C 4 3 2 1.407798 120.8392 145.6066 -2.69008 0.448954 0.627443
12 C 11 4 3 1.392364 121.4647 -178.32 -4.07914 0.353127 0.631946
13 C 12 11 4 1.389983 118.7903 -0.55298 -4.67661 -0.74176 0.018513
14 C 13 12 11 1.389869 121.729 -0.36804 -3.92466 -1.73256 -0.60167
15 C 14 13 12 1.392635 118.7488 0.348212 -2.53649 -1.62124 -0.59751
16 F 13 12 11 1.349685 119.1458 -179.637 -6.02284 -0.83811 0.012205
17 F 8 7 6 1.349482 119.0383 -179.902 1.752946 4.759101 -0.04153
18 C 1 2 3 1.380258 128.2717 -19.2937 2.742854 -0.9083 -0.45415
19 S 18 1 2 1.728388 112.4082 -177.464 4.337306 -1.57221 -0.38873
20 C 19 18 1 1.736044 91.65587 0.134868 3.75613 -3.02435 0.364499

21 C 20 19 18 1.362672 111.2201 0.200383 2.405796 -2.98133 0.542324
22 H 2 1 18 1.088355 113.1465 160.1202 -0.19909 -2.49985 0.302269
23 H 6 5 3 1.085099 119.1991 1.267001 1.158331 0.758077 1.940611
24 H 7 6 5 1.08454 121.6676 179.7441 2.097744 3.07364 1.898373
25 H 9 8 7 1.084536 119.668 179.7439 0.284099 3.748294 -1.92398
26 H 10 9 8 1.08569 119.419 179.4243 -0.68203 1.445661 -1.87797
27 H 11 4 3 1.084795 119.3727 0.866117 -2.21737 1.298798 1.108155
28 H 12 11 4 1.08458 121.5731 179.3026 -4.69894 1.108441 1.10275
29 H 14 13 12 1.084598 119.645 -178.508 -4.42693 -2.5599 -1.09115
30 H 15 14 13 1.085118 119.102 -177.79 -1.94526 -2.37233 -1.11112
31 H 18 1 21 1.078974 128.0745 178.5575 2.58968 0.063856 -0.89645
32 H 20 19 18 1.080737 120.2919 -179.765 4.444404 -3.81479 0.628094
33 H 21 20 19 1.084719 123.3094 179.8918 1.838524 -3.78777 0.994507
Table S6. Bond angles and Bond distances (Å) for 3ThDpF(C)
Tag Symbol NA NB NC Bond Angle Dihedral X Y Z
1 C -1.32713 -1.9393 0.012913
2 C 1 1.359007 0.004052 -1.72085 0.177642
3 C 2 1 1.451401 121.6049 0.571393 -0.38722 0.099412
4 C 3 2 1 1.488807 116.6479 -169.234 2.056485 -0.29528 0.048477
5 C 3 2 1 1.381425 119.7496 11.96755 -0.26291 0.713811 0.101036
6 C 5 3 2 1.543854 118.4851 8.149043 -1.76628 0.498044 0.378165
7 C 6 5 3 1.509349 114.2008 -168.009 -2.62917 1.699939 0.079829
8 C 7 6 5 1.337885 120.5272 -13.2041 -2.07486 2.899701 -0.12812
9 C 8 7 6 1.445453 123.5313 5.546648 -0.64787 3.118171 -0.20088
10 C 9 8 7 1.357469 119.8015 2.368783 0.201895 2.064139 -0.10269
11 C 4 3 2 1.405999 121.8544 -126.451 2.782027 0.501422 0.951635
12 C 11 4 3 1.393766 121.3506 178.0769 4.174617 0.549011 0.9198
13 C 12 11 4 1.389661 118.7362 -0.33933 4.847888 -0.21684 -0.02431

14 C 13 12 11 1.389969 121.8192 -0.32252 4.171149 -1.02866 -0.92707
15 C 14 13 12 1.393208 118.6717 0.227582 2.779238 -1.06557 -0.87966
16 F 13 12 11 1.34936 119.0947 -179.948 6.196165 -0.17705 -0.06087
17 F 8 7 6 1.352794 120.8701 -176.765 -2.844 3.993795 -0.33168
18 C 1 2 3 1.439957 129.2511 -176.757 -2.06841 -3.16932 0.117969
19 C 18 1 2 1.353236 113.6866 168.5031 -3.41032 -2.99552 0.135644
20 S 19 18 1 1.761009 115.4791 -0.33842 -3.95923 -1.32514 0.03736
21 C 1 2 3 1.518718 118.758 3.59063 -2.22211 -0.76441 -0.34082
22 H 21 1 2 1.102257 109.1328 83.75066 -2.19007 -0.60106 -1.43044
23 H 6 5 3 1.110878 106.3835 73.4526 -1.85674 0.280662 1.463805
24 H 2 1 18 1.086281 120.067 3.012743 0.671763 -2.55419 0.376931
25 H 7 6 5 1.085056 119.1125 171.2773 -3.70876 1.594884 0.108315
26 H 9 8 7 1.084368 118.2202 179.1608 -0.29218 4.125537 -0.38677
27 H 10 9 8 1.083807 119.2314 175.0292 1.264696 2.226602 -0.23942
28 H 11 4 3 1.08525 119.3548 -0.68024 2.248279 1.075825 1.701929
29 H 12 11 4 1.084545 121.6096 -179.538 4.738773 1.156335 1.619175
30 H 14 13 12 1.084542 119.6504 -179.956 4.732106 -1.6123 -1.64882
31 H 15 14 13 1.085848 119.2996 179.609 2.239943 -1.69137 -1.58436
32 H 18 1 2 1.08471 123.0153 -8.82416 -1.59305 -4.13902 0.219503
33 H 19 18 1 1.08341 126.125 -179.162 -4.15466 -3.77807 0.221447
Table S7. Calculated HOMO, LUMO distributions, energy levels, energy gap and vertical excitation wavelengths for 2ThDpF, 2ThDpF(C), 3ThDpF and 3ThDpF(C).
Sample LUMO HOMOELUMO
(eV)
EHOMO
(eV)
Eg
(eV)
Vertical excitation
wavelength
(nm)
2ThDpF -1.91 -5.82 3.91 338
2ThDpF(C) -2.32 -5.31 2.99 480

3ThDpF -1.76 -5.94 4.18 323
3ThDpF(C) -2.51 -5.29 2.78 512
Reference:
[1] T. Gibtner, F. Hampel, J.-P. Gisselbrecht, A. Hirsch, Chem. Eur. J., 2002, 8, 408.
Recommended


![SUPPORTING INFORMATION Tailoring Porosity and Rotational … · 2017-03-09 · bis(ethoxycarbonyl)phenylboronic acid, 2,3,6,7-tetraiodonaphthalene and dibenzo[b,e][1,4]dioxine-2,3,7,8-tetraamine](https://img.pdfslide.net/doc/110x75/5e47f6cd8cc10b60d310c386/supporting-information-tailoring-porosity-and-rotational-2017-03-09-bisethoxycarbonylphenylboronic.jpg)
![Nucleic Acid Sensing onto Peptide Nucleic Acid (PNA ... · transduction [6,10], another approach for sensitivity enhancement, i.e. by application of synthetic nucleic acid analogues](https://img.pdfslide.net/doc/110x75/5ed928146714ca7f47694042/nucleic-acid-sensing-onto-peptide-nucleic-acid-pna-transduction-610-another.jpg)