Disclosures and Disclaimer : This report must be read with the disclosures in the Disclosure appendix, and with the Disclaimer, which forms part of it. This document does not contain any investment views or opinions.
Comfort Securities Limited
Daily Research Reports
You will enjoy all the comforts of financial world when you alight with us.

Comfort
Flows From
WISDOM…
Welcome to
The world out there is uncertain. On this backdrop, the market volatility is bound to increase. Believe us, even the big
investors’ sentiment will oscillate—and that is why it is important for us to safely navigate these difficult times.
To do so, Comfort Securities Ltd. brings you this daily market commentary which will help you to sharpen your instincts
on investments in equity markets, gold, silver, crude-oil, USD/INR, the Dow Jones index, Hang Seng index, Euro-Dollar,
etc. On the next few pages, you can learn more about the same. We would love to answer any further questions you may
have in a one-one discussion.
We are pleased to inform you that this report features contributions from the finest analytical minds in the business and
are distinguished by our proactive consulting approach, timely advice, and specific recommendations. We take
satisfaction in seeing clients realize their dreams.
The Comfort Securities team would like to take this opportunity to thank our readers for their support and feedback over
the years. We hope you enjoyed reading this daily newsletter. Above all, we wish that this experience is both
professionally and personally rewarding.
If you have any queries please do contact me or any member of Comfort Securities Ltd. team and we would be glad to
assist.
Best Regards,
Comfort Securities Ltd.Call Us: Tel: 91-22-28811259
Comfort Securities Ltd.
Comfort Securities Limited
Enjoy Your Comfort Zone.
Invest Smart. Build Wealth.
Welcome Note
Wednesday26th September, 2018

Stock Of The Day: (F & O)
Forecast and Analysis
CONTENTSCONTENTS
Enjoy Your Comfort Zone.
Invest Smart. Build Wealth.
Title Page No.
'30,000 feet view’: The big picture of Dalal Street 04-07
Stock Of The Day: (F & O) 08-09
Equity Derivatives 10
Daily Pivot Table (Equities) 11
Forecast and Analysis 12-14
Daily Pivot Table (Commodities) 15
Disclaimer 16
'30,000 feet view’:
The big picture of Dalal Street
'30,000 feet view’:
The big picture of Dalal Street

Enjoy Your Comfort Zone.
Invest Smart. Build Wealth.
'30,000 feet view’: newsletter provides insights and themes for Indian equity markets. We also try and cover international themes for the day. This newsletter is quite popular with traders as it covers the most preferred trading strategy for Sensex/Nifty for the day.
In Chart of the day section, we recommend a stock which is likely to move significantly in the short term, clearly defining the supports, the resistances and bias for the stock.
In a nutshell, '30,000 feet view’: covers themes and insights for the day.
‘30,000 feet view’: The big picture of Dalal Street

www.comfortsecurities.co.inEnjoy Your Comfort Zone.
Invest Smart. Build Wealth.
Nifty Outlook
Intraday
Medium Term
Long Term
Key Levels to Watch
Nifty Support
Nifty Resistance
Pivot Level
Nifty
Outlook for the Day
INDICES
Nifty
Bank Nifty
Nifty Auto Index
Nifty FMCG Index
Nifty Infra Index
Nifty IT Index
Nifty Media Index
Nifty Midcap Index
Nifty Metal Index
Nifty Pharma Index
Nifty Reality Index
Nifty Smallcap Index
Sensex
SGX Nifty
‘30,000 feet view’: The big picture of Dalal Street
Good Morning & Welcome to Wednesday's trading action at Dalal Street, dated
26th of September 2018.
Our call of the day suggests that the benchmark Nifty may trade with positive bias in
today's trade; and most importantly, Dalal Street likely to see smooth sailing!
Having said that, the big investors camp unlikely to make big bets as focus primarily turns
to Federal Reserve’s monetary policy meeting outcome, which wraps today at 11.30 PM
IST.
The Fed is widely expected to result in a 25 basis point interest-rate increase. The meeting
will be followed by Fed Chairman Jerome Powell’s news conference during which investors
are expected to seek further insight into the state of the economy, the impact of trade
issues, and the path of future rate moves.
The other catalysts that could cap Dalal Street's upside in today's trade are:
1. Concerns about lingering U.S-China trade tensions.
2. Oil prices at 4-year high as producers rebuff Trump’s demand to keep crude prices
low.
3. The Indian Rupee getting hammered amidst soaring crude oil prices and
strengthening of the US dollar overseas. In yesterday's trade, the rupee had closed
at 72.63 against the greenback.
4. The street will spy with one big eye on the Rafale saga as that's getting intense.
STOCKS TO WATCH:
• Our chart of the day suggests establishing long positions in stocks like BAJAJ
FINANCE, BRITANNIA and MINDTREE with interweek perspective.
• Bullish stocks: BAJAJ FINANCE, HAVELLS, MARUTI, HINDUSTAN ZINC, SUN
PHARMA, MINDTREE, KPIT, BIOCON.
• Bearish stocks: HEROMOTO CORP, CANFINA HOMES, INDIAN OIL
CORPORATION, PNB, OBC, NALCO, ICICI BANK.
• Show Me the Money: Buy BAJAJ FINANCE (2299): The stock is signalling a
major rebound from an oversold conditions on daily charts. Interweek Strategy:
Establish long positions between 2245-2275 zone, targeting 2375 and then
aggressive targets located at 2425-2453 zone. Stop below 2201.
• Stocks banned in F&O segment for today: ADANI POWER, DHFL.
• YES BANK will request the Reserve Bank of India (RBI) to extend Rana Kapoor’s
term as the CEO up to September 30, 2019, considering the challenges in finding a
successor within a short period and to complete the annual general meeting (AGM)
process in his presence.
Outlook for Wednesday: Positive session quite likely.
At the time of writing, SGX Nifty is indicating a positive start for our stock markets, up
around 54 points at 11,176. Bargain hunting could be the theme, but any upside
likely to be capped and it appears that Nifty may consolidate, may trade subdued in today's
trading session, though much will depend on how crude-oil prices and the Indian Rupee
pans out in today's trading.
We still suspect, selling on any early excessive strength should continue to be the preferred
trading strategy.
11067 0.91%
25330 1.44%
10100 0.99%
30124 1.26%
3075 -0.25%
16235 0.37%
2521 0.02%
4808 0.58%
3632 0.00%
10245 2.51%
232 -1.72%
6642 -1.19%
36652 0.96%
11129 0.46%
Consolidation day likely.
Neutral (10971-11221)
Neutral (10500-11701)
Neutral (12001)
10971 & 10845
11221 & 11501
11575

www.comfortsecurities.co.inEnjoy Your Comfort Zone.
Invest Smart. Build Wealth.
Technical Strategy
‘30,000 feet view’: The big picture of Dalal Street
FII/DII & OPTIONS DATA:
• As per Tuesday’s Provisional Data available on the NSE, FII’s sold shares worth Rs.
1231.70 crores in the Indian Equity Market. DIIs on the other hand bought shares
worth Rs. 2284.26 crores in the Indian Equity market.
• As per option data, key resistance level for the September series for Nifty are at
11,500 strike price as maximum call open interest (OI) of 31.70 lakh contracts were
seen at the 11,500 strike price. While support for Nifty are seen at 11,000 strike
price as maximum put open interest seen at 11,000 strike price.
In the last week, FIIs sold equities worth Rs 2,674.12 crore, while domestic
institutions bought equities worth of Rs 1,782.63 crore.
GLOBAL CUES:
• Wall Street ended mostly lower in Tuesday's tirade as the Dow Jones Industrial
Average fell 69.84 points. The Dow has closed lower in back-to-back sessions, while
the S&P 500 has fallen for three straight days.
COMMODITY CUES:
• Crude Oil prices trade firm in Tuesday's trade, at four-year highs. MCX Oil futures
too flared up in Monday's trade despite Trump demand to OPEC to ‘get prices
down’. Positive bias to continue. At a meeting over the weekend, a committee made
up of some members of the Organization of the Petroleum Exporting Countries and
some allied oil producers did not commit to an additional increase in crude output to
help offset expected supply disruptions from U.S. sanctions on Iranian oil.
• In line with our positive bias, Copper prices stayed firm in Tuesday's trade. Bias
continues to be positive. MCX COPPER (460): Interweek strategy: Establish long
positions on dips between 445-449 zone, targeting 461 and then finally at 475-475
zone with stop at 429.50.
• Gold futures were seen struggling for direction in Tuesday's trade, but the yellow
metal ended above the psychological $1200 mark. Intraday Strategy: Establish
short positions between 1217-1223 zone, targeting 1198 zone and then aggressive
targets at 1175-1179 zone with stop at 1235.
CURRIENCIES & BONDS:
• In Tuesday's trade, the Indian Rupee weakend further by 6 paise to close at 72.69
against the US dollar. The latest bout of weakness in the rupee came a day after the
Reserve Bank of India said the central bank along with market regulator Sebi were
watching market developments closely and would act if required.
At the current level, the rupee has declined around 13% against the greenback so
far this year. Data shows the RBI spent $6.2 billion defending the rupee in June. This
eased to $1.8 billion in July when markets stabilised, and is estimated to have
remained around $2 billion in August despite renewed market volatility.
MACRO WATCH:
• The policy-setting Federal Open Market Committee is slated to convene
its two-day gathering on Sept. 26. The U.S job growth in August was strong
and topped analysts' expectations. The strong U.S jobs report is seen as supporting
the Federal Reserve’s intention to hike rates at least once more in September, and
possibly once more in December. The market is pricing in over a 90% chance of a
quarter-point rate hike then. The Fed has penciled in four moves in total this year.
INDIAN OIL CORPORATION (IOC)
Action
Target
Support
Resistance
Holding Period
154.15
SELL ON STRENGTH
137.5
147.50/135
161/167.50
9 Days.
In yesterday's trade, Indian Oil Corporation
ended on a negative note and was seen
attempting a breakdown from a lower
consolidation zone on the daily charts, down
0.52%.
Technically, the stock is in consolidation mode at
lower levels and the momentum oscillators are
signaling a major breakdown. Any move above
147.50 zone will confirm weakness which also
needs to be backed by increases in volumes. The
stock is seen moving down on daily charts,
backed by negative divergences.
Key support to watch in near term is at 147.50
zone. Medium term supports seen at 135-137.50
zone.
We expect INDIAN OIL CORPORATION to
underperform the benchmark Nifty and the BSE
Oil & Gasl index in a big way from here on.
Establishing short positions between 157-159
zone, as the stock is likely to stage steep declines
towards 147.50 and then aggressive targets seen
at 135-137.50 zone. Place stops above 163.50.
Holding Period: 9 days.

www.comfortsecurities.co.inEnjoy Your Comfort Zone.
Invest Smart. Build Wealth.
‘30,000 feet view’: The big picture of Dalal Street
Higher rates can hurt the appeal of gold and strengthen the U.S. dollar.
• As per Finance Minister Arun Jaitley's statement on September 25; Banks expect to recover about Rs 1.80 lakh crore from overall non-
performing assets (NPAs) through insolvency and other resolution mechanisms.
IPO NOTE:
• This week three IPO's worth Rs. 2,264 crore will hit Dalal Street. The three IPO's are: Garden Reach Shipbuilders and Engineers; AAVAS
Financiers and Dinesh Engineers.
What Technical Tells Us on Nifty:
Nifty ended with modest gains in yesterday's trade, up 0.91% at 11,067 mark.
The market breadth, indicating the overall health of the market, was weak. Broader markets were weak as the the BSE Mid-Cap index rose 0.36%.
The BSE Small-Cap index fell 0.74%. Both these indices underperformed the Sensex.
Technically speaking, key support for the day on Nifty is at 10,971 mark. The technical landscape will worsen further if Nifty closes below the
10,845 mark as that would open the door to massive technical selling, possibly quickly towards the 10,650-10,751 zone.
The intraday bias is neutral/negative and selling on any corrective strength should be the preferred strategy.
For the day, we believe, Nifty will drift after a higher open with intraday downside targets at 10,971. The make or break hurdles are at 11,521
mark. Intraday hurdles at 11,221 mark.
The price action for Nifty is suggesting that we are likely to see an 10,750-11,451 range in near term with neutral bias.
Bulls Vs. Bears: Time to Pick a Side!!
Volatility likely to be the hallmark of today's trade. Short covering could be the theme ahead of September series expiry on Thursday,
27th September.
Dalal Street will become the poster boy of short-squeeze only if Nifty moves above 11,501 mark.
Negative: Preferred trade on Nifty: Nifty (11067): Buy between 10967-11000 zone, targeting 11221 zone and then aggressive targets at
11401-11451 zone with stop at 10845.
Preferred trade on Bank Nifty: Bank Nifty (25330): Buy at CMP, targeting 25751-25901 zone and then at 26251 zone with stop at 24751.
Daily Chart of the day

Enjoy Your Comfort Zone.
Invest Smart. Build Wealth.
Comfort stock of the day
Stock Of The Day: (F & O)
When we want to see what's happening far off, we will reach for the binoculars. The binocular helps us to steer out of danger and also accurately spots our targets.
When it comes to trading / investing, that's exactly how Stock Of The Day: (F & O) introduces to the momentum stocks from the list of Future & Option segment, defining their support and resistance levels, and attempts to forecast their movement with a short /medium term perspective.
Stock Of The Day: (F & O)

R2STOCKS LTP S1 S2 R1 TRADING STRATEGYBIAS
Enjoy Your Comfort Zone.
Invest Smart. Build Wealth. www.comfortsecurities.co.in
Stock Of The Day: (F & O)
The stock is signalling a major rebound from an oversold conditions on daily charts. Interweek Strategy: Establish long positions between 2245-2275 zone, targeting 2375 and then aggressive targets located at 2425-2453 zone. Stop below 2201.
Britannia ended on a strong note in yesterday's trade, up 3.07%. The stock is signalling a major rebound from an oversold conditions on daily charts. Interweek Strategy: Establish long positions between 5675-5725 zone, targeting 5951 and then aggressive targets located at 6100-6145 zone. Stop below 5445.
Extremely oversold conditions prevail. Major support seen at 251 mark. Interweek Strategy: Buy between 275-285 zone, targeting 325 and then aggressive targets at 361-369 zone. Stop below 249.
MINDTREE enjoyed a strong session in Tuesday's trade, up 1.30%. Key intraday support seen at 1067. Interweek Strategy: Buy between 1067-1075 zone, targeting 1109 and then at 1121-1125 zone. Stop below 1045.
VEDANTA is signaling a major rebound from an oversold zone on the daily charts. Key intraday support seen at 217.50 zone. Key hurdles seen at 237.50. Interweek Strategy: Buy between 223-227.50 zone, targeting 237.50 and then at 247.50-251 zone. Stop below 215.
Positive interweek bias on Bajaj Finance as long as 2071 support is held.
BAJAJ FINANCE
BRITANNIA
DHFL
MINDTREE
VEDANTA
2299 2205 2071 2453 2557 Positive
5774 5482 5375 5951 6145 Positive
299.45 271 251 325 369 Positive
1086.85 1067 1013 1125 1185 Positive
230.4 221 215.05 237.5 251 Positive

www.comfortsecurities.co.inEnjoy Your Comfort Zone.
Invest Smart. Build Wealth.
EQUITY DERIVATIVESLooking into the future from present.
Changes in Open Interest (OI) in yesterday’s trade.
Nifty Spot
Bank Nifty Future
VIX
Premium
Nifty Future OI
Bank Nifty Spot OI
BSE Cash Vol. (Rs. in Cr)
NSE Cash Vol.(Rs. in Cr)
NSE Derivative Vol. (Rs. in Cr)
Index Future Volumes
Stock Future Volumes
Index Option Volumes
Stock Option Volumes
Total
Cash Volumes (INR in Cr.)
YesterdayDay Before Yesterday
Derivatives Vol.(INR in Cr.)
No of contracts
Turnover (Rs. In cr.)
Major Changes in Nifty Options (OI)
Market Summary: Buoyed by enthusiasm in global stocks, the benchmark Nifty returned to positive territory for the first
time in last six trading days. Bargain hunting was the preferred theme at our stock markets after steep
losses in past few trading sessions.
That said, the market breadth, indicating the overall health of the market, was negative. The BSE Mid-
Cap index rose 0.36%. The BSE Small-Cap index fell 0.74%. Both these indices underperformed the
Sensex.
Going forward, the biggest catalyst for worldwide stock markets would be the Federal Open Market
Committee (FOMC) two-day meeting which concludes on Wednesday 11.30 PM IST. Investors widely
expect policymakers to set in motion another increase to short-term interest rates. Investors and
economists will also be watching Fed Chairman Jerome Powell press conference, as that is likely to
offer a better picture of officials’ plans heading into 2019 and potential concerns over the economic
impact of new import tariffs.
Caution should be the buzzword for traders; with hurdles on Nifty at 11,221 and then at 11475 mark.
Downside support seen at 10,875 and then at 10,650.
The oil prices shooting to its highest in four years is the biggest headwind for our stock markets. Stay
Light, trade light is the gyan mantra.
Amongst the sectoral indices, outperforming the Sensex/Nifty was BSE Healthcare Index (up 1.75%),
BSE Bankex Index (up 1.39%), BSE FMCG Index (up 1.16%).
Amongst the sectoral indices, underperforming the Sensex/Nifty were BSE Realty Index (down
1.67%), BSE India Infrastructure Index (down 0.51%), BSE Oil & Gas Index (down 0.44%)
Amongst stock specific action, positive bias was seen in stocks like KOTAK BANK (up 3.26%), HDFC
(up 3.18%), SBIN (up 3.08%)
Among stocks drifting down were: IBHSGFIN (down 5.60%), INFRATEL (down 2.83%), GAIL (down
2.61%)
Maximum Call Open Interest (OI) stands at 11500 Strike Price, followed by 11200 Strike Price for
October Series. Long build up in calls was seen at 11200-11650 strike prices for October Series.
Maximum Put Open Interest (OI) was seen at strike price 11000 followed by 11200 strike price for
October series. Put writing was seen at various strike prices especially between 10800-10900 strike
prices for October Series.
As per Tuesday’s Provisional Data available on the NSE, FII’s sold shares worth Rs. 1231.70 crores in
the Indian Equity Market. DIIs on the other hand bought shares worth Rs. 2284.26 crores in the Indian
Equity market.
Highest OI Nifty: Calls 11500: 16.72 L - Puts 11000: 34.00Highest OI Bank Nifty: Calls 26500: 2.68 L - Puts 26500: 3.44 L
Change in Stock Open Interest (OI) in previous day’s trade.
Long Buildup: JSW STEEL, VEDL, HINDALCO, SAIL, SUN PHARMA.
Short Buildup: IDFC, POWER GRID, YES BANK, DLF, INFIBEAM.
Short Covering: PFC, BANK OF BARODA, ICICI BANK, BHARTI AIRTEL, AXIS BANK.
Long Unwinding: IDEA, GRANULES.
Stocks banned in F&O segment for today: ADANI POWER, DHFL.
New In Ban: DHFL.Out of Ban: ADANI ENT.
Future Call: BUY PFC SEPTEMBER FUTURES at CMP 81.05. Targets
at 84 and then at 89. Stop: 79.20. Holding Period: Intraday. Analyst’s
Remark: Rebound Play (PFC September Futures CMP 81.05).
Option Call: SELL NIFTY SEPTEMBER PE strike price 10900 at CMP
17.00. Maximum Profit: Rs. 1,275. Loss: Unlimited. Stop: Hold Put
Option till expiry (Nifty September Futures CMP 11097.20).
11067.45 (+0.91%)
25330.35 (+1.44%)
16.6825 (-4.27%)
+71 vs 0
6.88 crores (+69.20%)
5.63 lakhs (+59.85%)
4252.04 3772.3
45802.91 42195.77
1366255 1047636
576030 51814
2064676 131080
12017911 1112624
1004472 70737
15663089 1366255
Calls in lakhs (% Change)
11500 16.72 (+12%)
11600 8.38 (+20%)
11900 4.66 (+9%)
Puts in lakhs (% Change)
11000 17.64 (+18%)
10900 9.82 (+12%)
10800 11.97 (+31%)
Wednesday26th September, 2018

www.comfortsecurities.co.in
DAILY PIVOT TABLE
Enjoy Your Comfort Zone.
Invest Smart. Build Wealth.
Instrument Close S1 S2 R1 R2 200 Day SMA Reversal Point Trend
All level indicated above are based on cash market prices.
Pivot Point
PP : Pivot Point : This is trigger point for weekly buy/sell based on the price range of the previous week.R1 : Resistance one : 1st Resistance over PP. R2 : Resistance two : 2nd Resistance over R1.S1 : Support one : 1st support after PP. S2 : Support Two : 2nd support after S1.
As per the tool, the trader should take BUY position just above PP and keep the stop loss of PP and the first target would be R1.If R1 is crossed then R2 becomes the next target with the stop loss at R1.
Similarly if price goes below PP the trader should SELL and keep the PP as Stop loss and the first target would be S1.
If S1 is crossed then S2 becomes the next target with the stop loss at S1.This is a trading tool. The key to use of this tool is the use of STOP LOSS.
Wednesday26th September, 2018
NIFTY 11067.45 10940 10812.55 11137.75 11208.05 11010.3 10757.59 UP
BANKNIFTY 25330.35 24870.08 24409.82 25598.78 25867.21 25138.52 26107.56 DOWN
NIFTYMID50 4807.95 4729.77 4651.58 4859.17 4910.38 4780.98 5152.78 DOWN
ACC 1563.8 1519.6 1475.4 1589.4 1615 1545.2 1548.21 UP
ADANIENT 138.35 128.53 118.72 145.28 152.22 135.47 128.29 UP
ADANIPORTS 337.95 325.02 312.08 350.17 362.38 337.23 389.22 DOWN
AJANTPHARM 1109.45 1083.78 1058.12 1126.83 1144.22 1101.17 1252.85 DOWN
ALBK 37.75 36.35 34.95 38.7 39.65 37.3 51.24 DOWN
AMARAJABAT 768 752 736 778.5 789 762.5 810.83 DOWN
ANDHRABANK 30.6 28.75 26.9 31.8 33 29.95 41.48 DOWN
APOLLOTYRE 231.1 223.8 216.5 236.75 242.4 229.45 268.32 DOWN
ARVIND 344.75 334.17 323.58 358.07 371.38 347.48 410.59 DOWN
ASHOKLEY 121.9 118.72 115.53 124.27 126.63 121.08 134.26 DOWN
ASIANPAINT 1289.9 1263.08 1236.27 1310.78 1331.67 1283.97 1237.37 UP
AUROPHARMA 761.05 738.75 716.45 777.15 793.25 754.85 628.04 UP
AXISBANK 614.35 596 577.65 626.25 638.15 607.9 553.7 UP
BAJAJ-AUTO 2788.7 2743.25 2697.8 2818 2847.3 2772.55 2940.71 DOWN
BAJAJFINSV 6185.65 5995.13 5804.62 6313.08 6440.52 6122.57 5717.37 UP
BAJFINANCE 2299.2 2209.75 2120.3 2359.5 2419.8 2270.05 2084.14 UP
BALKRISIND 1094 1073.95 1053.9 1116.4 1138.8 1096.35 1171.4 DOWN
BALRAMCHIN 82.25 78.67 75.08 84.42 86.58 80.83 90.45 DOWN
BANKBARODA 109.45 105.85 102.25 111.75 114.05 108.15 143.47 DOWN
BANKINDIA 84.25 81.57 78.88 85.82 87.38 83.13 115.47 DOWN
BATAINDIA 960.85 937.98 915.12 978.73 996.62 955.87 809.51 UP
BEL 76.2 74.17 72.13 78.32 80.43 76.28 135.51 DOWN
BEML 646.45 623.93 601.42 673.93 701.42 651.42 1086.47 DOWN
BERGEPAINT 298.5 285.9 273.3 306.05 313.6 293.45 278.58 UP
BHARATFIN 1056.35 1025.88 995.42 1076.93 1097.52 1046.47 1109.01 DOWN
BHARATFORG 616.6 605.93 595.27 624.48 632.37 613.82 690.83 DOWN
BHARTIARTL 360.5 348.45 336.4 368.1 375.7 356.05 411.5 DOWN
BHEL 71.65 69.8 67.95 73.1 74.55 71.25 83.6 DOWN
BIOCON 701.55 671.42 641.28 720.27 738.98 690.13 603.28 UP
BPCL 364.2 357.72 351.23 368.07 371.93 361.58 422.77 DOWN
BRITANNIA 5773.85 5566.83 5359.82 5896.08 6018.32 5689.07 5498.99 UP
CANBK 233.5 224.23 214.97 239.93 246.37 230.67 286.9 DOWN
CANFINHOME 253.8 234.8 215.8 270.65 287.5 251.65 411.26 DOWN
CAPF 510.6 496.02 481.43 524.17 537.73 509.58 625.88 DOWN
CASTROLIND 151.2 149.43 147.67 152.58 153.97 150.82 181.39 DOWN
CEATLTD 1230.65 1207.1 1183.55 1257.1 1283.55 1233.55 1527.92 DOWN
CENTURYTEX 864.45 840.73 817.02 883.93 903.42 860.22 1109.23 DOWN
CESC 891.55 873.42 855.28 906.07 920.58 887.93 996.69 DOWN
CHENNPETRO 279.8 263.8 247.8 288.35 296.9 272.35 338.98 DOWN
CHOLAFIN 1230.4 1170.8 1111.2 1263.25 1296.1 1203.65 1454.03 DOWN
CIPLA 661.75 647.9 634.05 670.7 679.65 656.85 600.29 UP
COALINDIA 275.25 270.28 265.32 283.08 290.92 278.12 281.23 DOWN
COLPAL 1097.2 1081.77 1066.33 1112.77 1128.33 1097.33 1123.86 DOWN
CONCOR 612.7 599.35 586 629.85 647 616.5 657.44 DOWN
CUMMINSIND 692.6 685.73 678.87 698.73 704.87 691.87 764.22 DOWN
DABUR 437.5 425.85 414.2 445.3 453.1 433.65 375.4 UP
DALMIABHA 2421.65 2372.2 2322.75 2455.55 2489.45 2406.1 2761.8 DOWN
DCBBANK 150.2 145.27 140.33 155.07 159.93 150.13 176.77 DOWN
DHFL 299.45 238.18 176.92 378.58 457.72 317.32 591.29 DOWN
DISHTV 59.25 57.9 56.55 60.3 61.35 58.95 72.98 DOWN
DIVISLAB 1388.4 1363.67 1338.93 1404.57 1420.73 1379.83 1118.21 UP
DLF 177.6 166.65 155.7 187.95 198.3 177 214.97 DOWN
DRREDDY 2611.7 2568.22 2524.73 2637.22 2662.73 2593.73 2236.79 UP
EICHERMOT 25599.7 25093.3 24586.9 26048.05 26496.4 25541.65 28768.79 DOWN
ENGINERSIN 119.95 116.78 113.62 122.73 125.52 119.57 152.37 DOWN
EQUITAS 130.05 124.9 119.75 133.6 137.15 128.45 147.83 DOWN
ESCORTS 661.45 641.47 621.48 673.37 685.28 653.38 856.9 DOWN
EXIDEIND 257.35 250.35 243.35 265.75 274.15 258.75 243.78 UP
FEDERALBNK 71.85 70.22 68.58 73.07 74.28 71.43 91.96 DOWN
FORTIS 136.35 134.3 132.25 138.6 140.85 136.55 145.39 DOWN
GAIL 369.9 362.13 354.37 379.08 388.27 371.32 351.67 UP
GLENMARK 634.55 619.83 605.12 648.43 662.32 633.72 576.12 UP
GMRINFRA 16.85 16.35 15.85 17.35 17.85 16.85 18.63 DOWN
GODREJCP 782.4 768.92 755.43 796.97 811.53 783.48 792.61 DOWN
GODREJIND 540.2 530.58 520.97 548.28 556.37 538.67 589.38 DOWN
GRANULES 100.3 95.23 90.17 105.48 110.67 100.42 108.51 DOWN
GRASIM 1039.1 1016.93 994.77 1052.33 1065.57 1030.17 1077.66 DOWN
GSFC 98.9 94.07 89.23 103.22 107.53 98.38 124.88 DOWN
HAVELLS 628.1 610.37 592.63 640.87 653.63 623.13 563.91 UP
HCC 11.25 10.47 9.68 12.12 12.98 11.33 23.51 DOWN
HCLTECH 1116.35 1098.75 1081.15 1129.5 1142.65 1111.9 958.33 UP
HDFC 1773.35 1730.1 1686.85 1800.3 1827.25 1757.05 1853.88 DOWN
HDFCBANK 1952.4 1924.27 1896.13 1971.27 1990.13 1943.13 1981.6 DOWN
HDIL 21.9 21.42 20.93 22.82 23.73 22.33 37.9 DOWN
HEROMOTOCO 3112.6 3088.07 3063.53 3131.07 3149.53 3106.53 3527.83 DOWN
HEXAWARE 443.75 430.77 417.78 455.27 466.78 442.28 410.08 UP
HINDALCO 243.05 236.97 230.88 246.97 250.88 240.88 236.13 UP
HINDPETRO 243.15 239.47 235.78 246.37 249.58 242.68 331.77 DOWN
HINDUNILVR 1630.85 1591.93 1553.02 1654.88 1678.92 1615.97 1500.92 UP
HINDZINC 303.8 295.37 286.93 309.02 314.23 300.58 299.19 UP
IBREALEST 110.7 97.93 85.17 119.73 128.77 106.97 186.21 DOWN
IBULHSGFIN 929.65 815.77 701.88 1013.77 1097.88 899.88 1236.55 DOWN
ICICIBANK 311.1 302.93 294.77 316.38 321.67 308.22 304.63 UP
ICICIPRULI 349.1 331.92 314.73 360.02 370.93 342.83 396.83 DOWN
IDBI 51.9 49.47 47.03 53.57 55.23 51.13 63.21 DOWN
IDEA 40.5 39.4 38.3 41.7 42.9 40.6 71.02 DOWN
IDFC 41.85 40.47 39.08 43.42 44.98 42.03 52.33 DOWN
IDFCBANK 37.95 36.8 35.65 39.05 40.15 37.9 47.49 DOWN
IFCI 12.65 11.7 10.75 14 15.35 13.05 20.4 DOWN
IGL 264.75 258.2 251.65 268.7 272.65 262.15 289.13 DOWN
INDIACEM 106.4 103.03 99.67 108.63 110.87 105.27 140.46 DOWN
INDIANB 236.3 218.9 201.5 254.05 271.8 236.65 336.61 DOWN
INDIGO 852.75 828.95 805.15 868.6 884.45 844.8 1178.38 DOWN
INDUSINDBK 1696.75 1657.98 1619.22 1726.53 1756.32 1687.77 1823.87 DOWN
INFIBEAM 214.5 200.2 185.9 227.6 240.7 213.3 168.59 UP
INFRATEL 269.35 264.93 260.52 276.88 284.42 272.47 320.92 DOWN
INFY 726.2 716.8 707.4 735.8 745.4 726.4 608.29 UP
IOC 154.15 151.48 148.82 156.33 158.52 153.67 174.85 DOWN
IRB 137.4 131.28 125.17 143.38 149.37 137.27 221.82 DOWN
ITC 301.15 294.88 288.62 304.88 308.62 298.62 276.35 UP
JETAIRWAYS 192.45 183.4 174.35 206.6 220.75 197.55 532.98 DOWN
JINDALSTEL 225.65 216.93 208.22 231.13 236.62 222.42 228.39 DOWN
JISLJALEQS 75.05 73.17 71.28 77.17 79.28 75.28 104.69 DOWN
JPASSOCIAT 7.2 6.78 6.37 7.73 8.27 7.32 16.99 DOWN
JSWENERGY 64.75 63.3 61.85 66.2 67.65 64.75 76.23 DOWN
JSWSTEEL 403.65 392.77 381.88 410.77 417.88 399.88 315.68 UP
JUBLFOOD 1260.05 1237.87 1215.68 1289.37 1318.68 1267.18 1208.57 UP
JUSTDIAL 492.2 472.93 453.67 511.58 530.97 492.32 512.16 DOWN
KOTAKBANK 1183.35 1138.63 1093.92 1209.58 1235.82 1164.87 1182.21 UP
KPIT 267.6 259.45 251.3 278.4 289.2 270.25 245.73 UP
KSCL 602.05 593.55 585.05 610.6 619.15 602.1 540.87 UP
KTKBANK 101.75 98.23 94.72 104.13 106.52 100.62 126.55 DOWN
L&TFH 132.1 123.62 115.13 137.47 142.83 128.98 167.27 DOWN
LICHSGFIN 436.45 421.73 407.02 446.28 456.12 431.57 522.71 DOWN
LT 1319.05 1307.13 1295.22 1331.83 1344.62 1319.92 1318.24 UP
LUPIN 882.55 864.12 845.68 894.37 906.18 875.93 840.4 UP
M&M 893 872.17 851.33 906.92 920.83 886.08 834.41 UP
M&MFIN 414.1 393.8 373.5 427.2 440.3 406.9 470.93 DOWN
MANAPPURAM 78.6 76.32 74.03 80.22 81.83 77.93 108.1 DOWN
MARICO 331.65 327.37 323.08 336.07 340.48 331.78 328.55 UP
MARUTI 7999.45 7780.22 7560.98 8118.47 8237.48 7899.23 9030.46 DOWN
MCDOWELL-N 530.1 512.87 495.63 541.17 552.23 523.93 652.6 DOWN
MCX 730.65 710.18 689.72 751.13 771.62 730.67 808.16 DOWN
MGL 822.4 811.92 801.43 828.77 835.13 818.28 937.49 DOWN
MOTHERSUMI 263.95 256.2 248.45 268.85 273.75 261.1 327.92 DOWN
MRF 65780.65 63570.43 61360.21 67545.43 69310.22 65335.21 73278.66 DOWN
MUTHOOTFIN 427.65 414.18 400.72 439.93 452.22 426.47 416.5 UP
NATIONALUM 65.85 64.73 63.62 67.13 68.42 66.02 71.77 DOWN
NBCC 63.85 61.38 58.92 66.33 68.82 63.87 94.41 DOWN
NCC 79.7 77.5 75.3 81.3 82.9 79.1 113.35 DOWN
NMDC 113.3 111.45 109.6 114.45 115.6 112.6 121.21 DOWN
NTPC 170 166.1 162.2 172.2 174.4 168.3 166.48 UP
OFSS 4101.95 4019.6 3937.25 4154.1 4206.25 4071.75 4009.52 UP
OIL 219.85 215.18 210.52 223.43 227.02 218.77 224.66 DOWN
ONGC 182.3 179.58 176.87 184.83 187.37 182.12 178.38 UP
ORIENTBANK 66.7 64.42 62.13 68.22 69.73 65.93 93.04 DOWN
PCJEWELLER 69.85 67.2 64.55 73.15 76.45 70.5 257.95 DOWN
PEL 2518.75 2414.88 2311.02 2594.03 2669.32 2490.17 2648.29 DOWN
PETRONET 223.5 218.67 213.83 228.67 233.83 223.83 232.22 DOWN
PFC 80.85 78.77 76.68 82.22 83.58 80.13 92.88 DOWN
PIDILITIND 1100.2 1082.47 1064.73 1115.47 1130.73 1097.73 1011.78 UP
PNB 66.95 63.85 60.75 69.85 72.75 66.75 108.88 DOWN
POWERGRID 192.6 189.97 187.33 196.92 201.23 194.28 196.48 DOWN
PTC 68.6 66.48 64.37 71.23 73.87 69.12 92.2 DOWN
PVR 1253.65 1222.32 1190.98 1289.27 1324.88 1257.93 1340.18 DOWN
RAMCOCEM 649.5 632.1 614.7 662.1 674.7 644.7 738.41 DOWN
RAYMOND 721.25 706.27 691.28 732.62 743.98 717.63 951.7 DOWN
RBLBANK 521.2 507.7 494.2 536.25 551.3 522.75 528.93 DOWN
RCOM 11.5 11.08 10.67 12.03 12.57 11.62 19.81 DOWN
RECLTD 100.7 97.33 93.97 102.93 105.17 99.57 126.85 DOWN
RELCAPITAL 316.05 304.47 292.88 325.77 335.48 314.18 439.74 DOWN
RELIANCE 1230.6 1202.07 1173.53 1252.07 1273.53 1223.53 1005.68 UP
RELINFRA 318.35 303.43 288.52 333.78 349.22 318.87 443.29 DOWN
REPCOHOME 451.2 430.57 409.93 463.52 475.83 442.88 593.31 DOWN
RPOWER 27 26.13 25.27 27.98 28.97 27.12 38.39 DOWN
SAIL 75 73.07 71.13 76.17 77.33 74.23 80.29 DOWN
SBIN 270.9 263.48 256.07 275.63 280.37 268.22 277.86 DOWN
SHREECEM 17129 16836.02 16543.03 17485.96 17842.93 17192.98 17076.06 UP
SIEMENS 941.75 917.07 892.38 959.92 978.08 935.23 1093.77 DOWN
SOUTHBANK 14.35 14 13.65 14.7 15.05 14.35 24.6 DOWN
SREINFRA 40.2 38.6 37 41.8 43.4 40.2 75.75 DOWN
SRF 1899.7 1864.72 1829.73 1931.82 1963.93 1896.83 1913.62 DOWN
SRTRANSFIN 1176.85 1120.4 1063.95 1217.65 1258.45 1161.2 1398.2 DOWN
STAR 464.65 447.6 430.55 480.1 495.55 463.05 580.37 DOWN
SUNPHARMA 641.1 628.43 615.77 649.38 657.67 636.72 551.64 UP
SUNTV 639.9 626.3 612.7 649.2 658.5 635.6 878.05 DOWN
SUZLON 6.2 5.95 5.7 6.5 6.8 6.25 10.52 DOWN
SYNDIBANK 33.45 32.42 31.38 34.12 34.78 33.08 55.53 DOWN
TATACHEM 710.8 693.48 676.17 722.88 734.97 705.57 718.63 DOWN
TATACOMM 502.9 495.43 487.97 511.68 520.47 504.22 613.29 DOWN
TATAELXSI 1233.9 1204.15 1174.4 1264.3 1294.7 1234.55 1173.66 UP
TATAGLOBAL 236.1 233.15 230.2 237.9 239.7 234.95 269.01 DOWN
TATAMOTORS 240.8 236.33 231.87 244.38 247.97 239.92 328.95 DOWN
TATAMTRDVR 127.05 124.8 122.55 129.05 131.05 126.8 186.52 DOWN
TATAPOWER 70.3 68.43 66.57 71.73 73.17 69.87 81.43 DOWN
TATASTEEL 601 581 561 615 629 595 614.45 DOWN
TCS 2183.2 2154.03 2124.87 2212.13 2241.07 2182.97 1687.56 UP
TECHM 758.75 745 731.25 772.6 786.45 758.85 639.58 UP
TITAN 796.85 778.57 760.28 814.72 832.58 796.43 882.24 DOWN
TV18BRDCST 38.3 36.53 34.77 39.98 41.67 38.22 55.94 DOWN
TVSMOTOR 592.65 575.37 558.08 603.67 614.68 586.38 629.94 DOWN
UBL 1385.15 1335.27 1285.38 1415.02 1444.88 1365.13 1143.05 UP
UJJIVAN 278.55 263.85 249.15 287.55 296.55 272.85 375.2 DOWN
ULTRACEMCO 4028.7 3969.47 3910.23 4068.47 4108.23 4009.23 4080.73 DOWN
UNIONBANK 70.15 67.62 65.08 72.87 75.58 70.33 102.78 DOWN
VEDL 230.4 227.1 223.8 233.3 236.2 230 273.99 DOWN
VGUARD 182.1 178.83 175.57 185.68 189.27 182.42 221.78 DOWN
VOLTAS 577.25 563.13 549.02 586.38 595.52 572.27 595.09 DOWN
WIPRO 328.3 324.73 321.17 333.38 338.47 329.82 288.17 UP
WOCKPHARMA 563.5 538.48 513.47 581.23 598.97 556.22 728.6 DOWN
YESBANK 219.7 198.35 177 239.95 260.2 218.6 335.42 DOWN
ZEEL 449.4 439.78 430.17 456.23 463.07 446.62 555.72 DOWN

Enjoy Your Comfort Zone.
Invest Smart. Build Wealth.
Comfort ‘Forecast and Analysis’
Forecast and Analysis is a daily newsletter that provides technical update on all the major instruments of the world like Gold, Silver, Crude Oil, US Dollar Index and USD/INR. We define their support and resistance levels and attempt to forecast their movement with a short / medium term perspective. Also in the report, a trader will find bias for the mentioned instruments.
This newsletter is also quite popular with a market participant who loves to have insight & theme on MCX Gold, MCX Silver as well MCX Crude-Oil.
Forecast and Analysis
Instrument TRADING STRATEGYLTP S1 S2 R1 R2 Bias
www.comfortsecurities.co.in
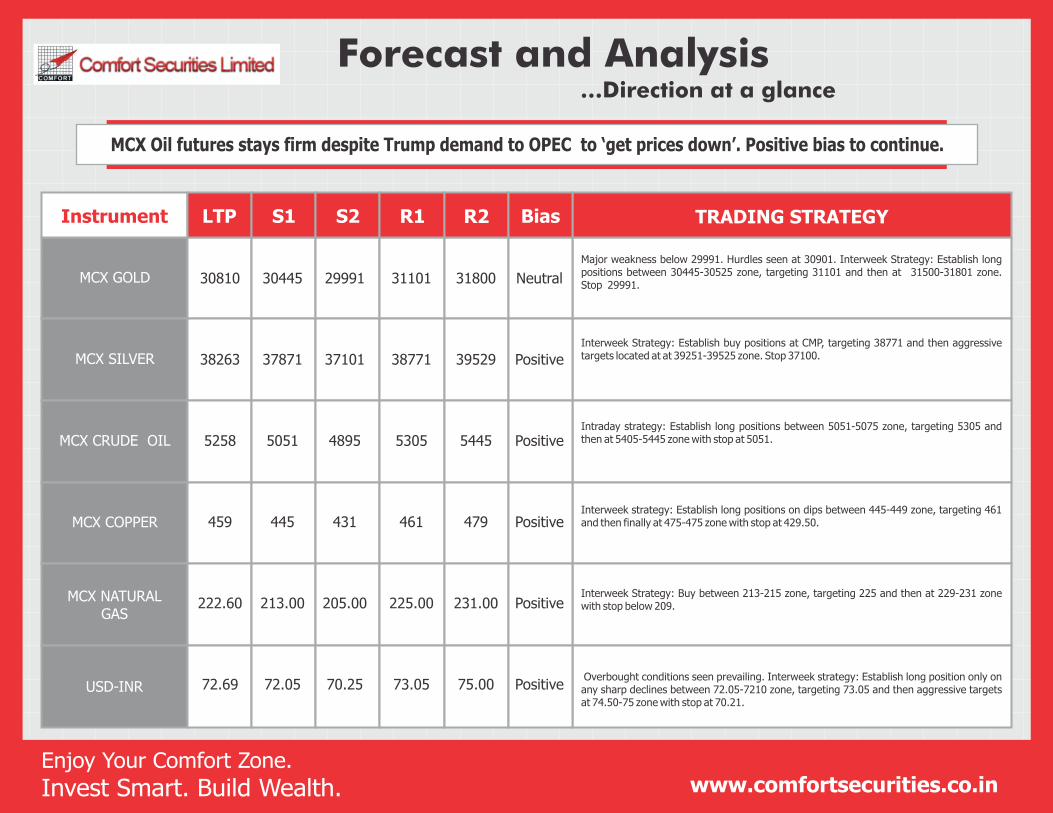
MCX GOLD
MCX SILVER
MCX CRUDE OIL
MCX COPPER
MCX NATURAL GAS
USD-INR
Forecast and Analysis …Direction at a glance
Enjoy Your Comfort Zone.
Invest Smart. Build Wealth.
Major weakness below 29991. Hurdles seen at 30901. Interweek Strategy: Establish long positions between 30445-30525 zone, targeting 31101 and then at 31500-31801 zone. Stop 29991.
Interweek Strategy: Establish buy positions at CMP, targeting 38771 and then aggressive targets located at at 39251-39525 zone. Stop 37100.
Intraday strategy: Establish long positions between 5051-5075 zone, targeting 5305 and then at 5405-5445 zone with stop at 5051.
Interweek strategy: Establish long positions on dips between 445-449 zone, targeting 461 and then finally at 475-475 zone with stop at 429.50.
Interweek Strategy: Buy between 213-215 zone, targeting 225 and then at 229-231 zone with stop below 209.
Overbought conditions seen prevailing. Interweek strategy: Establish long position only on any sharp declines between 72.05-7210 zone, targeting 73.05 and then aggressive targets at 74.50-75 zone with stop at 70.21.
30810 30445 29991 31101 31800 Neutral
38263 37871 37101 38771 39529 Positive
5258 5051 4895 5305 5445 Positive
459 445 431 461 479 Positive
222.60 213.00 205.00 225.00 231.00 Positive
72.69 72.05 70.25 73.05 75.00 Positive
MCX Oil futures stays firm despite Trump demand to OPEC to ‘get prices down’. Positive bias to continue.

Instrument TRADING STRATEGYLTP S1 S2 R1 R2
www.comfortsecurities.co.in
GOLD $
SILVER ($)
WTI CRUDE OIL ($ )
EUR/USD
Forecast and Analysis …Sailing global trend
Bias
DOW JONES
US Dollar Index
Enjoy Your Comfort Zone.
Invest Smart. Build Wealth.
Crude-Oil prices at 4-year high after OPEC refuses Trump demand to lower oil prices.
Intraday Strategy: Establish short positions between 1217-1223 zone, targeting 1198 zone and then aggressive targets at 1175-1179 zone with stop at 1235.
Intraday Strategy: Establish short positions between 14.75-14.89 zone, targeting 14.05 zone and then aggressive targets at 13.45-13.55 zone with stop at 15.39.
Intraday Strategy: Establish long positions between 70.45-71.05 zone, targeting 73.05 zone and then at 75 with stop at 68.21.
The EUR/USD was seen drifting in Tuesday's trade. Technically, the bias continues to be neutral with initial downside risk at 1.1501. Hurdles continue to be at 1.1900. Selling on strength should be the preferred trading strategy.
The U.S Dollar was seen attempting a rebound in Tuesday's trade. We shift our bias to neutral on the US Dollar Index. Hurdles at 97.50. Downside well supported at 92.50. Major weakness now only below 92.50.
Wall Street was attempting to stay in green in yesterday's trade as investors held off on making big bets ahead of a closely watched meeting by the Federal Reserve. Concerns about continuing trade tensions also lingered. The near term bias continues to be positive.
1206 1189 1175 1223 1233 Neutral
14.51 14.05 13.45 15.27 15.95 Neutral
72.2 70.45 68.25 73.05 75 Positive
1.1749 1.1501 1.1215 1.1801 1.1900 Neutral
94.22 92.50 90.00 97.50 99.00 Neutral
26577 25445 23501 27001 27901 Positive

www.comfortsecurities.co.in
DAILY PIVOT TABLE
Enjoy Your Comfort Zone.
Invest Smart. Build Wealth.
CommodityExchange Close S1 S2 R1 R2200 Day
SMA Reversal
Point Trend
MCX ALUMINUM
MCX CARDAMOM
NCDEX CASTOR
NCDEX CHANA
MCX COPPER
MCX COTTON
MCX CRUDE-OIL
MCX GOLD
NCDEX GAUR GUM
NCDEX GAUR SEED
NCDEX JEERA
MCX LEAD
MCX MENTHA OIL
MCX NATURAL GAS
MCX NICKLE
NCDEX RM SEED
MCX SILVER
NCDEX SUGAR
NCDEX SOYA BEAN
MCX ZINC
147.2 146.12 145.03 149.22 151.23 144.56 150.55 DOWN
1429.7 1413.77 1397.83 1451.97 1474.23 1077.78 1360.7 DOWN
4729 4713.67 4698.33 4751.67 4774.33 4270.72 4645 UP
3925 3902 3879 3949 3973 3833.5 3809 UP
459.1 456.12 453.13 462.67 466.23 445.92 443.6 UP
22340 22256.67 22173.33 22486.67 22633.33 21376.95 22620 UP
5273 5179.67 5086.33 5336.67 5400.33 4435.26 4832.5 UP
30842 30660.67 30479.33 30957.67 31073.33 30326.66 30346 UP
9152 9019 8886 9337 9522 8870.88 9617 UP
4249.5 4197.67 4145.83 4319.67 4389.83 4112.79 4405 DOWN
18965 18746.67 18528.33 19336.67 19708.33 17700.85 20670 DOWN
147.3 145.95 144.6 149.55 151.8 157.27 142.65 DOWN
1663.4 1642.43 1621.47 1698.53 1733.67 1473.24 1820.8 UP
221 216.3 211.6 223.5 226 189.91 203.5 UP
929.8 919.53 909.27 947.53 965.27 910.87 871 UP
4214 4196.67 4179.33 4237.67 4261.33 4021.49 4121 UP
37867 37499.66 37132.33 38109.66 38352.33 38732.98 36820 UP
3050 3050 3050 3050 3050 3614.83 3015 UP
3303 3266 3229 3364 3425 3490.58 3157 UP
183.8 180.53 177.27 186.93 190.07 202.66 169.5 UP
Wednesday26th September, 2018

Comfort Securities Ltd.
DISCLAIMER: This is solely for information of clients of Comfort Securities Ltd. and does not construe to be an investment advice. It is also not intended as an offer or solicitation for the purchase and sale of any financial instruments. Any action taken by you on the basis of the information contained herein is your responsibility alone and Comfort Securities Ltd. its subsidiaries or its employees or associates will not be liable in any manner for the consequences of such action taken by you. We have exercised due diligence in checking the correctness and authenticity of the information contained in this recommendation, but Comfort Securities Ltd. or any of its subsidiaries or associates or employees shall not be in any way responsible for any loss or damage that may arise to any person from any inadvertent error in the information contained in this recommendation or any action taken on basis of this information.
Technical analysis studies market psychology, price patterns and volume levels. It is used to forecast future price and market movements. Technical analysis is complementary to fundamental analysis and news sources. The recommendations issued herewith might be contrary to recommendations issued by Comfort Securities Ltd. in the company research undertaken as the recommendations stated in this report is derived purely from technical analysis. Comfort Securities Ltd. has based this document on information obtained from sources it believes to be reliable but which it has not independently verified; Comfort Securities Ltd. makes no guarantee, representation or warranty and accepts no responsibility or liability as to its accuracy or completeness. The opinions contained within the report are based upon publicly available information at the time of publication and are subject to change without notice. The information and any disclosures provided herein are in summary form and have been prepared for informational purposes. The recommendations and suggested price levels are intended purely for trading purposes. The recommendations are valid for the day of the report however trading trends and volumes might vary substantially on an intraday basis and the recommendations may be subject to change. The information and any disclosures provided herein may be considered confidential. Any use, distribution, modification, copying, forwarding or disclosure by any person is strictly prohibited. The information and any disclosures provided herein do not constitute a solicitation or offer to purchase or sell any security or other financial product or instrument. The current performance may be unaudited. Past performance does not guarantee future returns. There can be no assurance that investments will achieve any targeted rates of return, and there is no guarantee against the loss of your entire investment.
POTENTIAL CONFLICT OF INTEREST DISCLOSURE (as on date of report)Disclosure of interest statement – • Analyst interest of the stock /Instrument(s): - No. • Firm interest of the stock / Instrument (s): - No.
Enjoy Your Comfort Zone. Invest Smart. Build Wealth. www.comfortsecurities.co.in
Registered Office Mumbai:
Comfort Securities Ltd.
A-301, Hetal Arch, S.V. Road,
Opp. Natraj Mkt., Malad (W),
Mumbai 400 064
Phone: 91-22-28811259,
28449765, 28825509
Fax: 91-22-28892527
Email: [email protected]
Comfort Securities
605, 6th Floor,
DDA2 Building,
New Delhi 110058,
Janakpuri District Center,
Janakpuri, Delhi, 110058
Phone: 011 4568 0560
Ltd. Comfort Securities
2nd Floor, Shop No S14,
T 14, Friends Tower,
Sanjay Place, Agra
Phone: 0562-4218950
Ltd.Comfort Securities
227-228, 2nd Floor,
Natraj Market,
S.V Road, Malad (W),
Mumbai 400 064
Phone:
(Natraj) 022-42733000
Ltd. Comfort Securities
Krishna Niwas,
Office No. 14, 2nd Floor,
Shahid Bhagat Singh Road,
Ballard Estate, Fort,
Mumbai 400001
Phone: 022-49091000
Ltd.
Recommended