Competition between Railway Operators and Low Cost Carriers in Long-Distance Passenger Transport
ESMT Competition Analysis
Hans W. Friederiszick
December
3, 2009, ZEW
Dec 3, 2009 Mannheim Competition Policy Forum 1
Background and Motivation
•
The EU Commission’s “Third Railways Package”
foresees market opening of the European long-distance passenger rail sector after 2010
•
European rail operators initiated or plan co-operations on long distance passenger transport•
There was concern that this co-operation would be anti-competitive•
DB argued that this concern was unfounded because inter-modal competition from low-cost airlines (“LCAs”) servicing long-distance destinations provided sufficient competitive pressure
Dec 3, 2009 Mannheim Competition Policy Forum 2
Background and Motivation
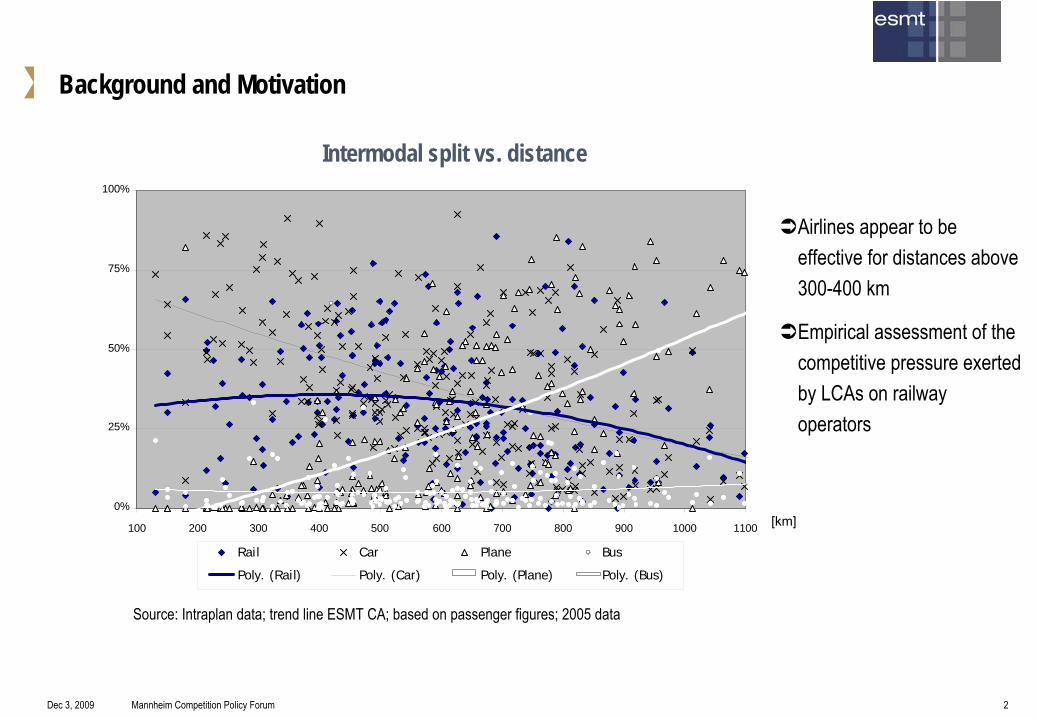
Source: Intraplan
data; trend line ESMT CA; based on passenger figures; 2005 data
Airlines appear to be effective for distances above 300-400 km
Empirical assessment of the competitive pressure exerted by LCAs
on railway operators
[km]
Intermodal split vs. distance
0%
25%
50%
75%
100%
100 200 300 400 500 600 700 800 900 1000 1100
Rail Car Plane Bus
Poly. (Rail) Poly. (Car) Poly. (Plane) Poly. (Bus)
Dec 3, 2009 Mannheim Competition Policy Forum 3
We find evidence of significant intermodal competition between low cost airlines (LCAs) and rail operators:
Passengers
-
A rail operator loses at least 7% of its passengers and 8% of its passenger km due to entry by LCAs.
Prices-
Strategic entry is important-
After
accounting for strategic entry (endogeneity), LCA entry results
in significantly lower prices.-
Price effects vary between 16% and 27%
Second/ first class
Affects both first and second class tariffs
Negative effects on passenger numbers are less pronounced for the first class
Main Findings
Dec 3, 2009 Mannheim Competition Policy Forum 4
Background and Motivation
Related Literature
Panel Data Analysis of Intermodal Competition in Long-Distance Rail Passenger Transport
Policy Conclusions and Open Issues
Overview
Dec 3, 2009 Mannheim Competition Policy Forum 5
Literature - Case Studies/ Simulations/ Scenario Analysis on Intermodal Competition
Friebel and Niffka
(2005) / Antes, Friebel, Niffka
and Rompf
(2004)
-
price rigidity of incumbent rail operator gives LCAs
and incumbent airline strategic advantages
-
inter-modal price elasticities in the relevant literature might underestimate the actual degree of substitutability
Ivaldi
and Vibes (2005) –
Cologne-Berlin
-
low cost train entry affects LCA more than rail incumbent
-
already a small number of competitors is sufficient to create strong competition on an intermodal level
Lopez-Pita and Robuste-Anton (2005) –
Madrid-Barcelona
-
high-speed trains likely to succeed planes as the dominant means of transportation on the route, with a market share increasing from currently 11% to 50-60%

Dec 3, 2009 Mannheim Competition Policy Forum 6
This Paper
Examine effect of LCA entry and operation on DB−
Prices−
Passenger numbers
Large, representative panel data set−
With a rich set of controls
Grapple with endogeneity−
Standard panel data methods−
IV methods accounting for the possibility that LCA entry is a strategic response to DB pricing
Dec 3, 2009 Mannheim Competition Policy Forum 7
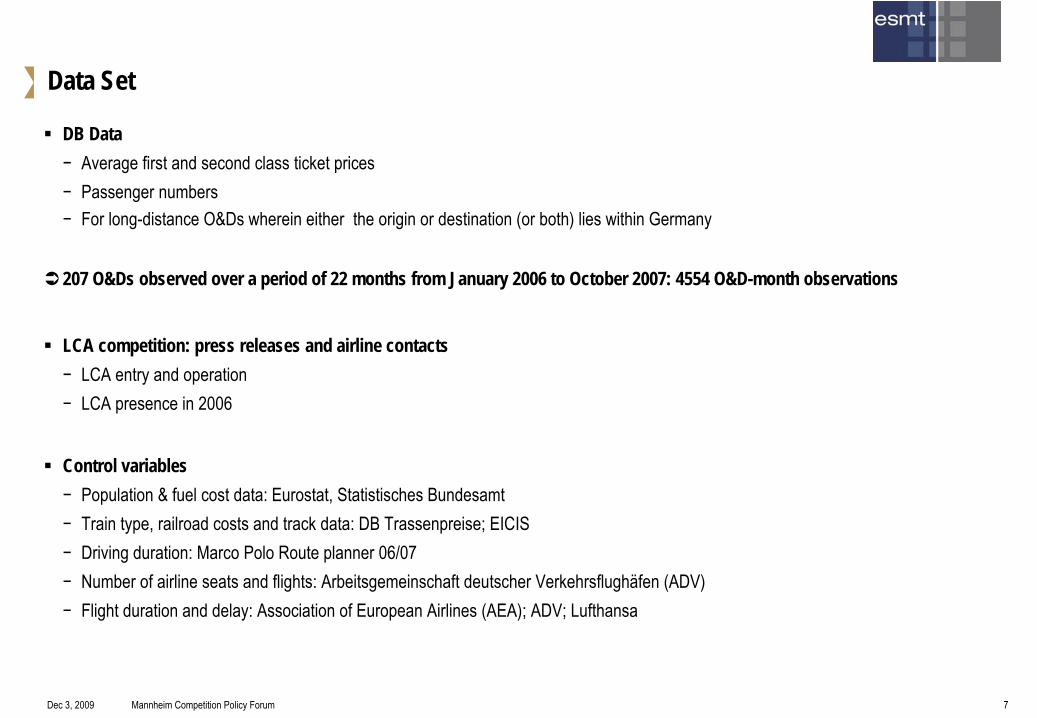
Data Set
DB Data−
Average first and second class ticket prices−
Passenger numbers −
For long-distance O&Ds wherein either the origin or destination (or both) lies within Germany
207 O&Ds observed over a period of 22 months from January 2006 to October 2007: 4554 O&D-month observations
LCA competition: press releases and airline contacts−
LCA entry and operation−
LCA presence in 2006
Control variables−
Population & fuel cost data: Eurostat, Statistisches
Bundesamt−
Train type, railroad costs and track data: DB Trassenpreise; EICIS−
Driving duration: Marco Polo Route planner 06/07−
Number of airline seats and flights: Arbeitsgemeinschaft
deutscher
Verkehrsflughäfen
(ADV) −
Flight duration and delay: Association of European Airlines (AEA); ADV; Lufthansa
Dec 3, 2009 Mannheim Competition Policy Forum 8
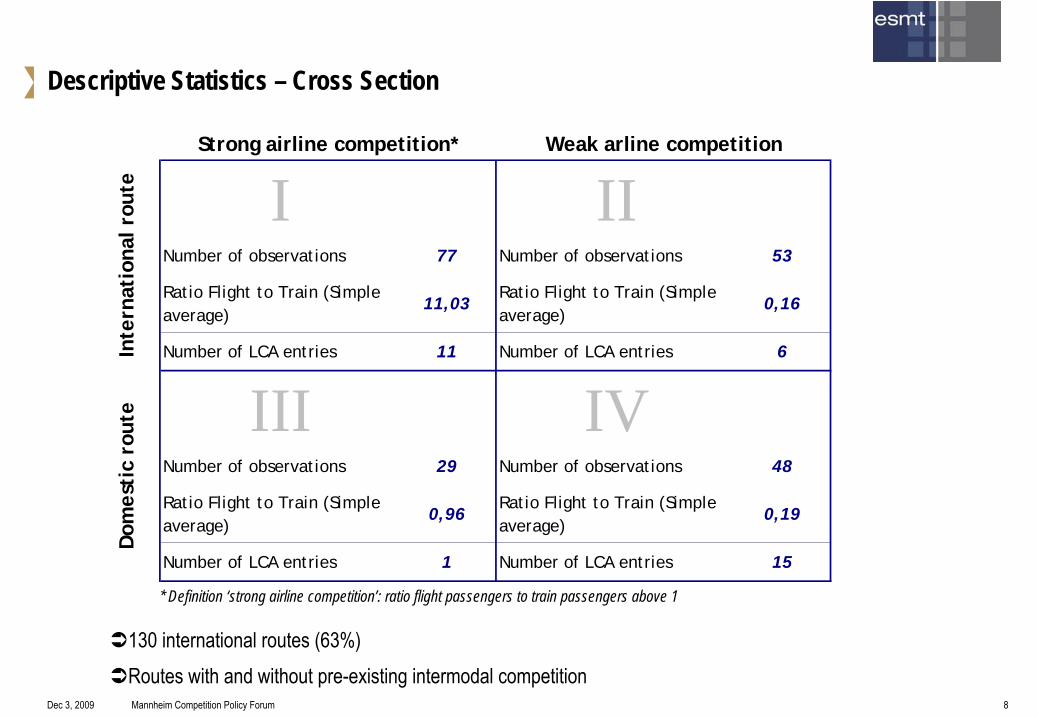
Descriptive Statistics – Cross Section
* Definition ‘strong airline competition’: ratio flight passengers to train passengers above 1
I IINumber of observations 77 Number of observations 53
Ratio Flight to Train (Simple average)
11,03Ratio Flight to Train (Simple average)
0,16
Number of LCA entries 11 Number of LCA entries 6
III IVNumber of observations 29 Number of observations 48
Ratio Flight to Train (Simple average)
0,96Ratio Flight to Train (Simple average)
0,19
Number of LCA entries 1 Number of LCA entries 15
Inte
rnat
iona
l rou
teD
omes
tic
rout
eStrong airline competition* Weak arline competition
130 international routes (63%)Routes with and without pre-existing intermodal competition
Dec 3, 2009 Mannheim Competition Policy Forum 9
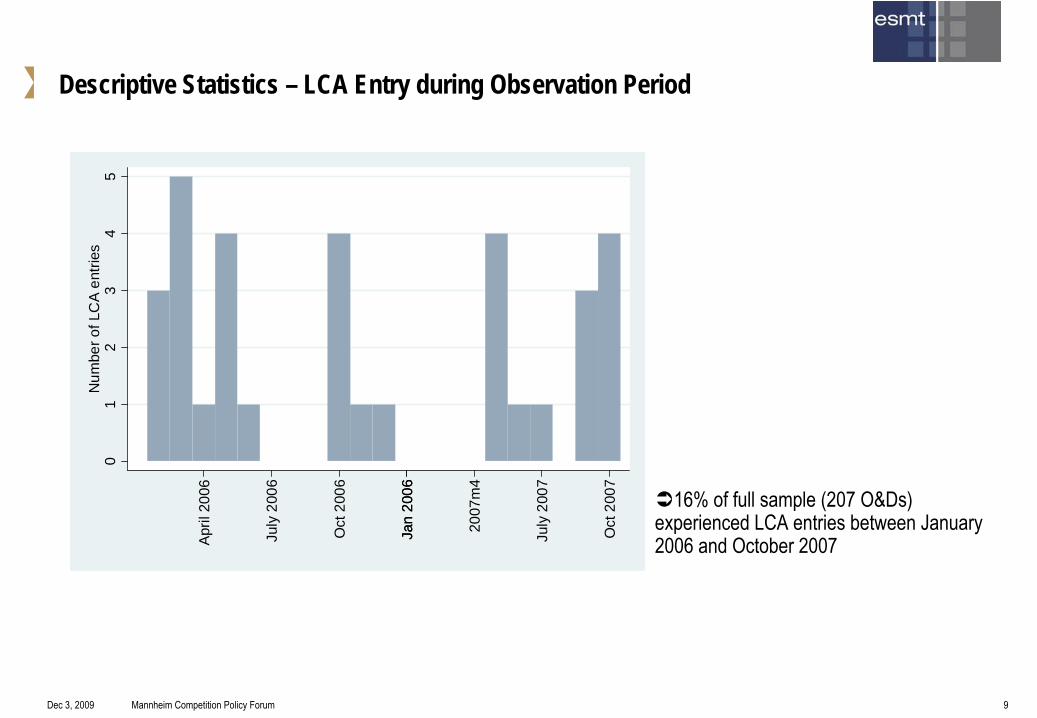
Descriptive Statistics – LCA Entry during Observation Period0
12
34
5N
umbe
r of L
CA
ent
ries
2007
m4
April
200
6
July
200
6
Jan
2006
July
200
7
Oct
200
6
Oct
200
7
Jan
2006 16% of full sample (207 O&Ds)
experienced LCA entries between January 2006 and October 2007
Dec 3, 2009 Mannheim Competition Policy Forum 10
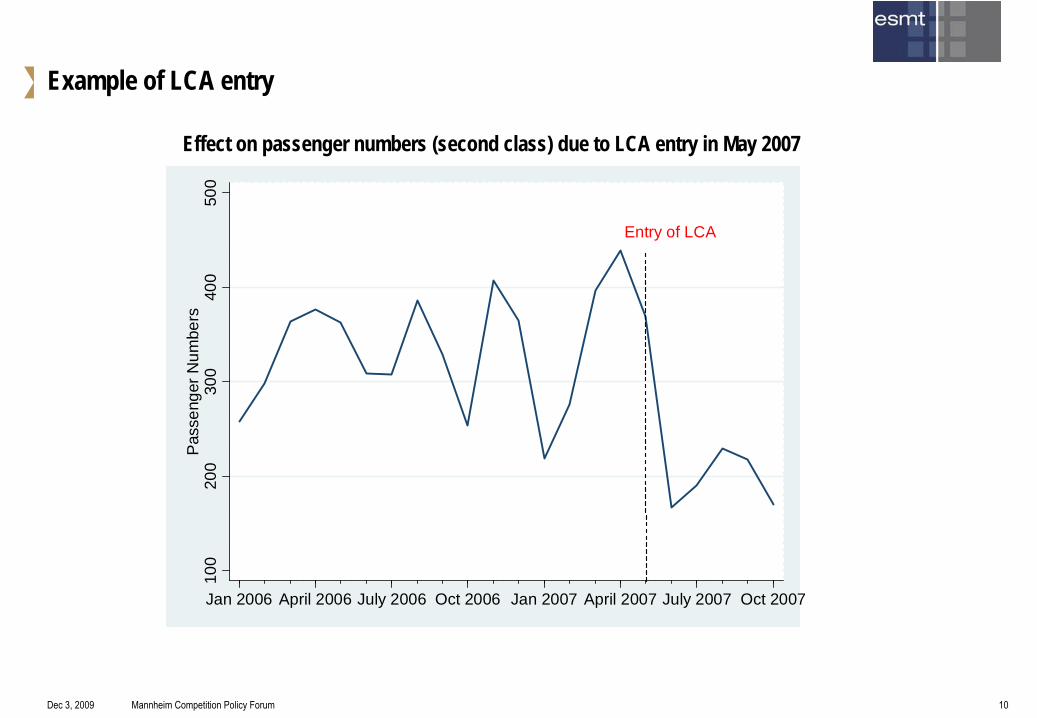
Example of LCA entry
Effect on passenger numbers (second class) due to LCA entry in May 2007
Entry of LCA10
020
030
040
050
0P
asse
nger
Num
bers
Jan 2006 April 2006 July 2006 Oct 2006 Jan 2007 April 2007 July 2007 Oct 2007
Dec 3, 2009 Mannheim Competition Policy Forum 11
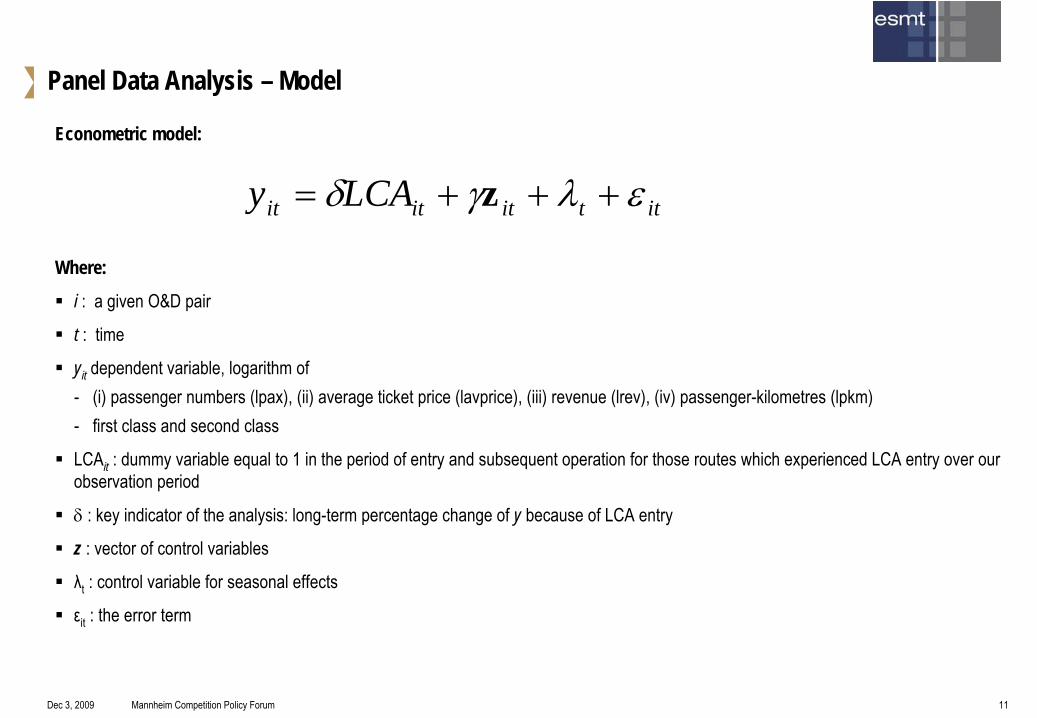
Panel Data Analysis – Model
Econometric model:
Where:
i : a given O&D pair
t : time
yit dependent variable, logarithm of -
(i) passenger numbers (lpax), (ii) average ticket price (lavprice), (iii) revenue (lrev), (iv) passenger-kilometres
(lpkm)-
first class and second class
LCAit : dummy variable equal to 1 in the period of entry and subsequent operation for those routes which experienced LCA entry over our observation period
: key indicator of the analysis: long-term percentage change of y because of LCA entry
z : vector of control variables
λt
: control variable for seasonal effects
εit
: the error term
ittititit LCAy z

Dec 3, 2009 Mannheim Competition Policy Forum 12
Panel Data Analysis – Endogeneity of Entry
LCA entry is a strategic decision
1. Entry lower price (negative relation/correlation between entry and prices)
2.
High price entry of LCA (positive relation/correlation between entry and prices)
We are interested to identify effect 1
In order to correctly support an antitrust analysis, the empirical methodology must account for this endogeneity and separate the effects!
We use instrumental variables (instruments are LCAs
operating to another destination)
Dec 3, 2009 Mannheim Competition Policy Forum 13
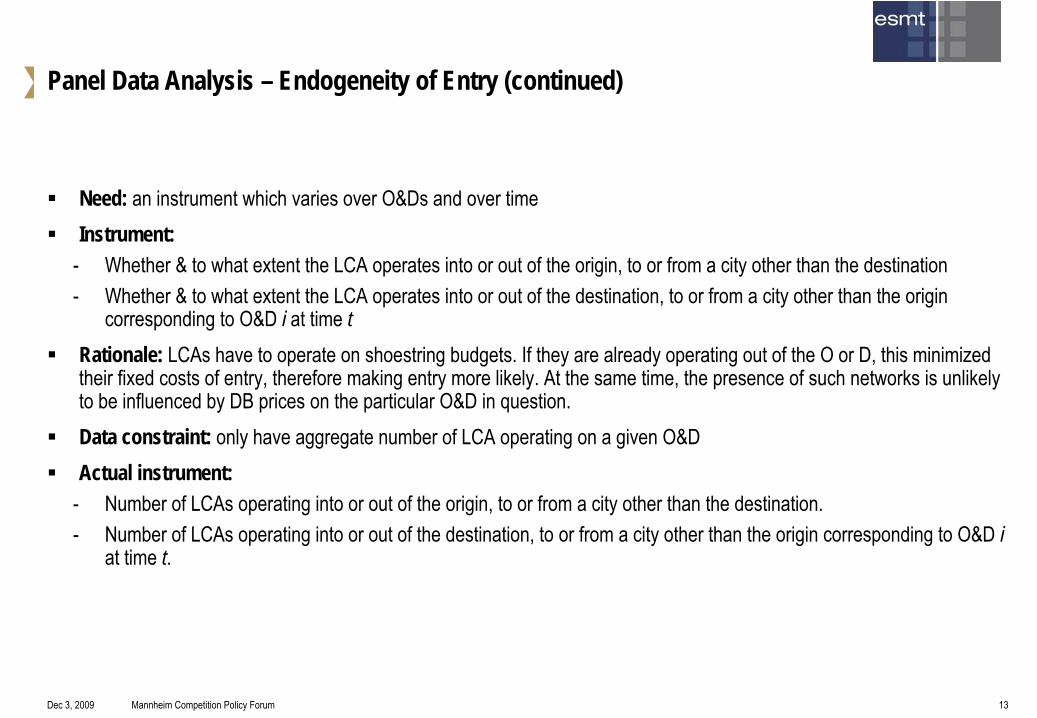
Panel Data Analysis – Endogeneity of Entry (continued)
Need: an instrument which varies over O&Ds and over time
Instrument:-
Whether & to what extent the LCA operates into or out of the origin, to or from a city other than the destination-
Whether & to what extent the LCA operates into or out of the destination, to or from a city other than the origin corresponding to O&D i at time t
Rationale: LCAs have to operate on shoestring budgets. If they are already
operating out of the O or D, this minimized their fixed costs of entry, therefore making entry more likely. At the same time, the presence of such networks is unlikely to be influenced by DB prices on the particular O&D in question.
Data constraint: only have aggregate number of LCA operating on a given O&D
Actual instrument:-
Number of LCAs
operating into or out of the origin, to or from a city other than the destination.-
Number of LCAs
operating into or out of the destination, to or from a city other than the origin corresponding to O&D i at time t.
Dec 3, 2009 Mannheim Competition Policy Forum 14
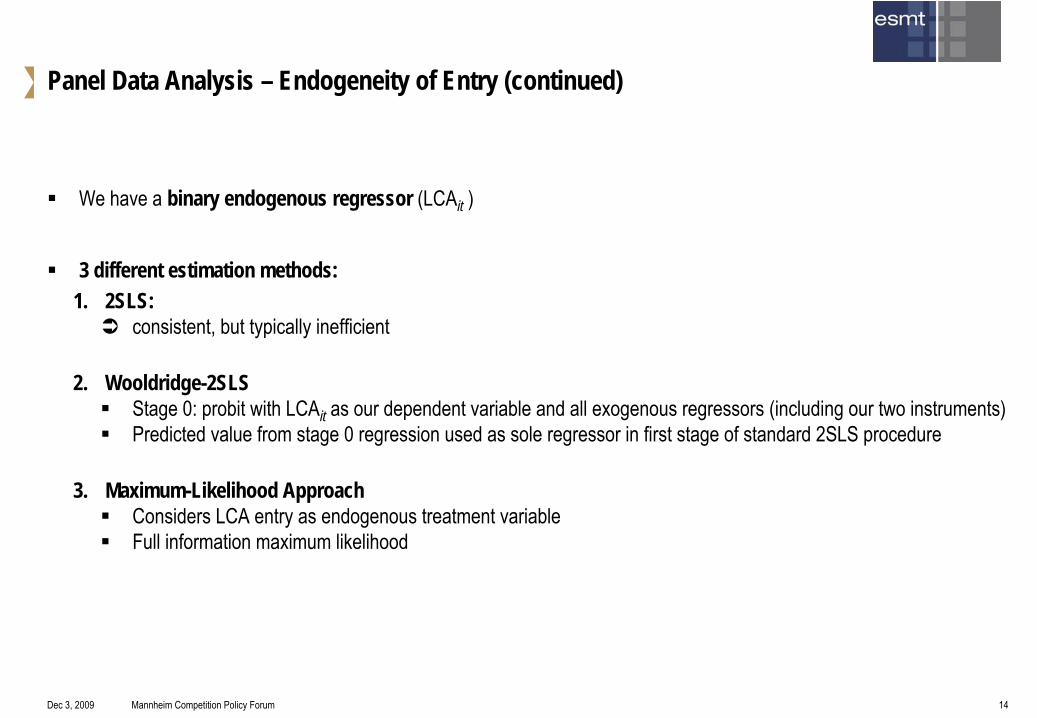
Panel Data Analysis – Endogeneity of Entry (continued)
We have a binary endogenous regressor (LCAit )
3 different estimation methods:1. 2SLS:
consistent, but typically inefficient
2. Wooldridge-2SLS
Stage 0: probit
with LCAit as our dependent variable and all exogenous regressors
(including our two instruments)
Predicted value from stage 0 regression used as sole regressor
in first stage of standard 2SLS procedure
3. Maximum-Likelihood Approach
Considers LCA entry as endogenous treatment variable
Full information maximum likelihood

Dec 3, 2009 Mannheim Competition Policy Forum 15
Results – Second Class log(Average Ticket Price)
Dep. Var. lavprice2 LCA
1 3 8 9 10 11
Expl. Var. pooled OLS RE 2SLS W-2SLS
LCA -0.00153 0.0241 -1.292*** -0.825*** -0.314**
(0.0237) (0.0262) (0.241) (0.202) (0.129)
lairlines_orig 0.720***
(0.0645)
lairlines_dest 0.128**
(0.0497)
Constant -0.350** 0.112 -1.057 -1.068* -0.212 -2.594***
(0.175) (0.561) (0.727) (0.559) (0.177) (0.149)
Controls YES YES YES YES YES
Time dummies YES YES YES YES YES
No. Obs 4415 4415 4415 4415 4415
No. O&Ds 207 207 207 207 207
R-squared 0.451 0.45 -0.142 0.207
Note: Robust standard errors in parentheses. *** p<0.01, ** p<0.05, * p<0.1.
ML

Dec 3, 2009 Mannheim Competition Policy Forum 16
Results – First Class log(Average Ticket Price)Dep. Var. lavprice2 LCA
1 3 8 9 10 11
Expl. Var. Pooled OLS RE 2SLS W-2SLS
LCA 0.0337* 0.0245 -1.356*** -0.989*** -0.170***
(0.0189) (0.0176) (0.313) (0.279) (0.0511)
lairlines_orig 0.674***
(0.079)
lairlines_dest 0.140***
(0.0433)
Constant -0.905*** -1.226** -0.0275 -0.224 -0.766*** -2.602***
(0.173) (0.522) (0.882) (0.741) (0.174) (0.14)
Controls YES YES YES YES YES
Time dummies YES YES YES YES YES
Fuel costs YES YES YES YES YES
No.Obs 3886 3886 3886 3886 3886No. O&Ds 201 201 201 201 201
R-squared 0.59 0.588 -0.0428 0.248
Note: Robust standard errors in parentheses. *** p<0.01, ** p<0.05, * p<0.1.
ML
Note: Full sample. controls include presence06, domestic, lorig_pop, ldest_pop, lauto_km, ICE
Dec 3, 2009 Mannheim Competition Policy Forum 17
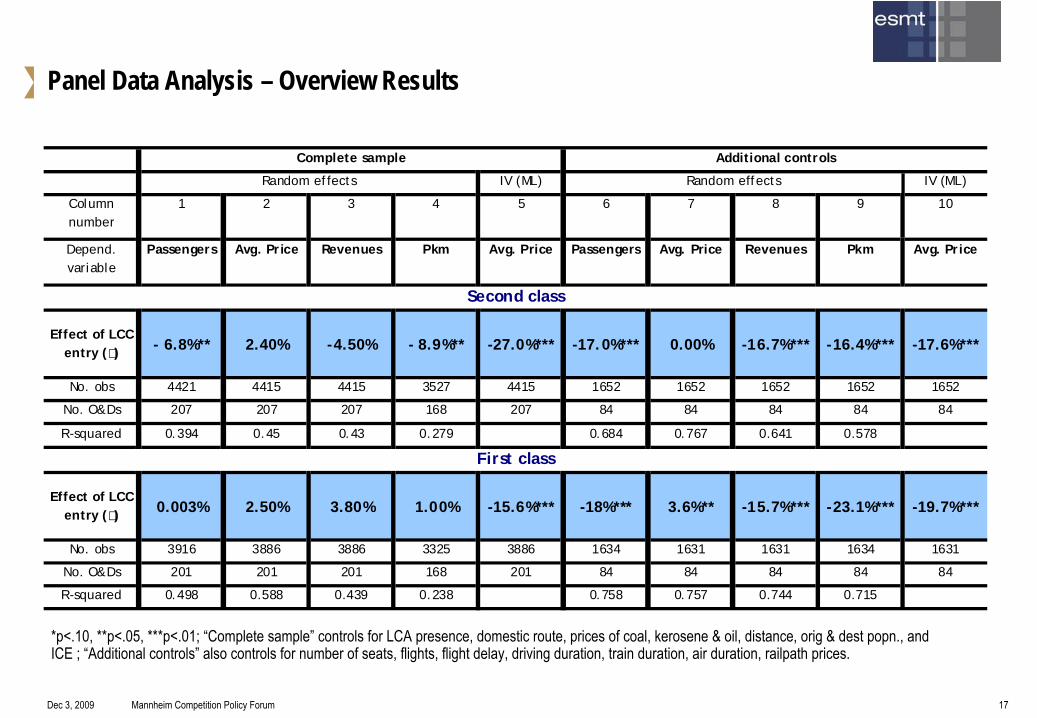
Panel Data Analysis – Overview Results
*p<.10, **p<.05, ***p<.01; “Complete sample”
controls for LCA presence, domestic route, prices of coal, kerosene & oil, distance, orig
& dest
popn., and ICE ; “Additional controls”
also controls for number of seats, flights, flight delay, driving duration, train duration, air duration, railpath
prices.
IV (ML) IV (ML)
Column number
1 2 3 4 5 6 7 8 9 10
Depend. variable
Passengers Avg. Price Revenues Pkm Avg. Price Passengers Avg. Price Revenues Pkm Avg. Price
Effect of LCC entry ( ) - 6.8%** 2.40% -4.50% - 8.9%** -27.0%*** -17.0%*** 0.00% -16.7%*** -16.4%*** -17.6%***
No. obs 4421 4415 4415 3527 4415 1652 1652 1652 1652 1652
No. O&Ds 207 207 207 168 207 84 84 84 84 84
R-squared 0.394 0.45 0.43 0.279 0.684 0.767 0.641 0.578
Effect of LCC entry ( ) 0.003% 2.50% 3.80% 1.00% -15.6%*** -18%*** 3.6%** -15.7%*** -23.1%*** -19.7%***
No. obs 3916 3886 3886 3325 3886 1634 1631 1631 1634 1631
No. O&Ds 201 201 201 168 201 84 84 84 84 84
R-squared 0.498 0.588 0.439 0.238 0.758 0.757 0.744 0.715
Second class
First class
Complete sample Additional controls
Random effects Random effects
Dec 3, 2009 Mannheim Competition Policy Forum 18
Passengers - second class−
Statistically and economically significant negative effect on passenger numbers−
7%-17% decrease of passenger numbers, depending on dataset
Passengers - first class−
Negative effect on passenger numbers less pronounced−
Up to 18%, depending on dataset
Prices-
Strategic entry is important-
After
accounting for strategic entry (endogeneity), LCA entry results
in significantly lower prices in both the first and second class. Price effects vary between 16% and 27%
Effect of LCA Entry – Summary of Results

Dec 3, 2009 Mannheim Competition Policy Forum 19
Policy conclusion
LCAs
induce substantial competitive pressure
Competitive pressure can be observed in first and second class and has an effect on both passenger numbers and prices
Intermodal competition has to be part of a competitive assessment of future rail alliances
Open Issues
Can we more directly assess the impact of threat of entry vs. factual entry
Time varying effects of entry and its implications for entry strategies
Relationship between travelling distance and price impact
Policy Conclusions and Open Issues
ESMT White Paper series
http://www.esmt.org/eng/faculty-research/white-papers/
Railway Alliances in EC Long-Distance Passenger Transport: A Competitive Assessment Post-Liberalization 2010
Downloadable from:
http://www.esmt.org/eng/faculty-research/white-papers/WP-109-01.pdf
Dec 3, 2009 Mannheim Competition Policy Forum 21
Annex
•
Descriptive
statistics•
Scenario
analysis
Dec 3, 2009 Mannheim Competition Policy Forum 22
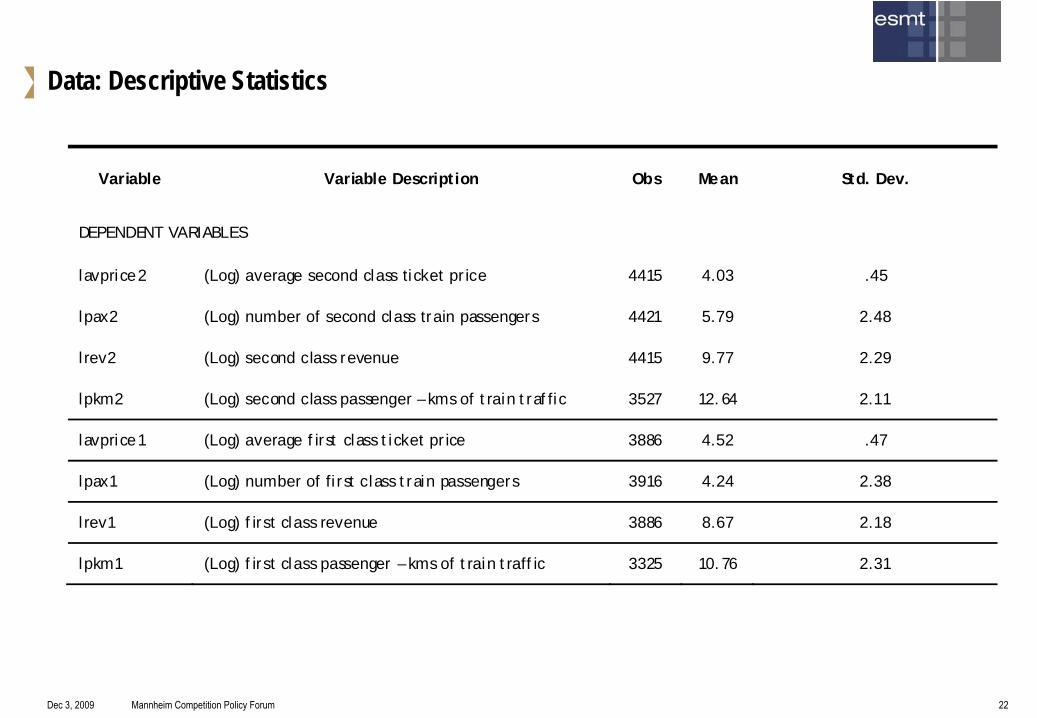
Variable Variable Description Obs Mean Std. Dev.
DEPENDENT VARIABLES
lavprice2 (Log) average second class ticket price 4415 4.03 .45
lpax2 (Log) number of second class train passengers 4421 5.79 2.48
lrev2 (Log) second class revenue 4415 9.77 2.29
lpkm2 (Log) second class passenger – kms of train traffic 3527 12.64 2.11
lavprice1 (Log) average first class ticket price 3886 4.52 .47
lpax1 (Log) number of first class train passengers 3916 4.24 2.38
lrev1 (Log) first class revenue 3886 8.67 2.18
lpkm1 (Log) first class passenger – kms of train traffic 3325 10.76 2.31
Data: Descriptive Statistics
Dec 3, 2009 Mannheim Competition Policy Forum 23
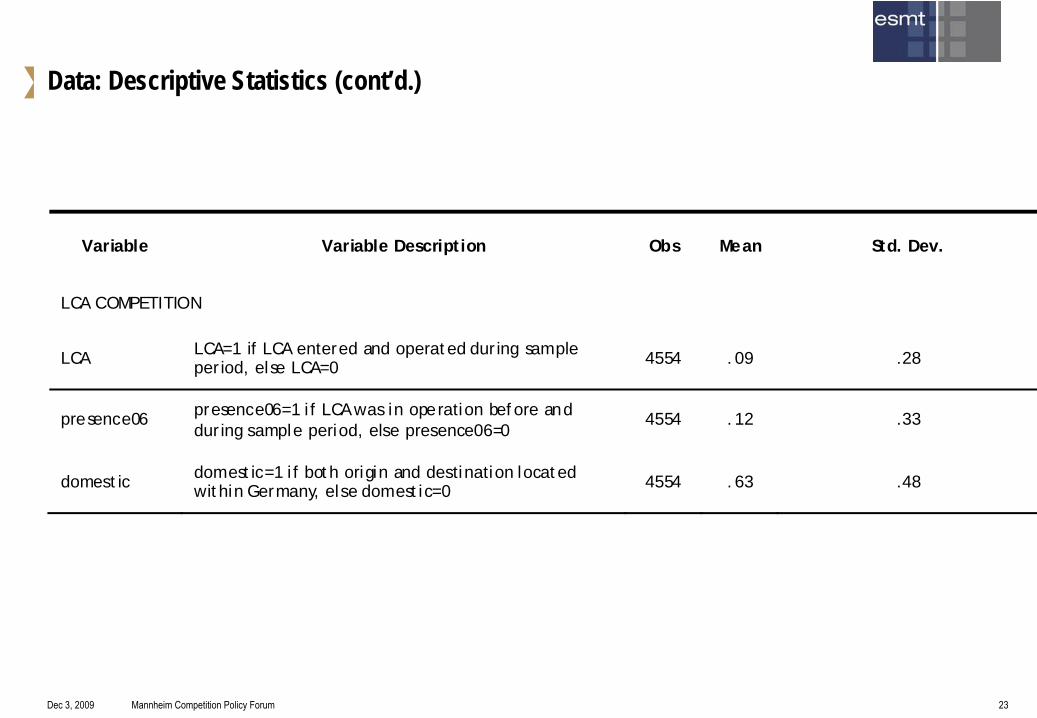
Data: Descriptive Statistics (cont’d.)
Variable Variable Description Obs Mean Std. Dev.
LCA COMPETITION
LCA LCA=1 if LCA entered and operated during sample period, else LCA=0 4554 .09 .28
presence06 presence06=1 if LCA was in operation before and during sample period, else presence06=0
4554 .12 .33
domestic domestic=1 if both origin and destination located within Germany, else domestic=0 4554 .63 .48
Dec 3, 2009 Mannheim Competition Policy Forum 24
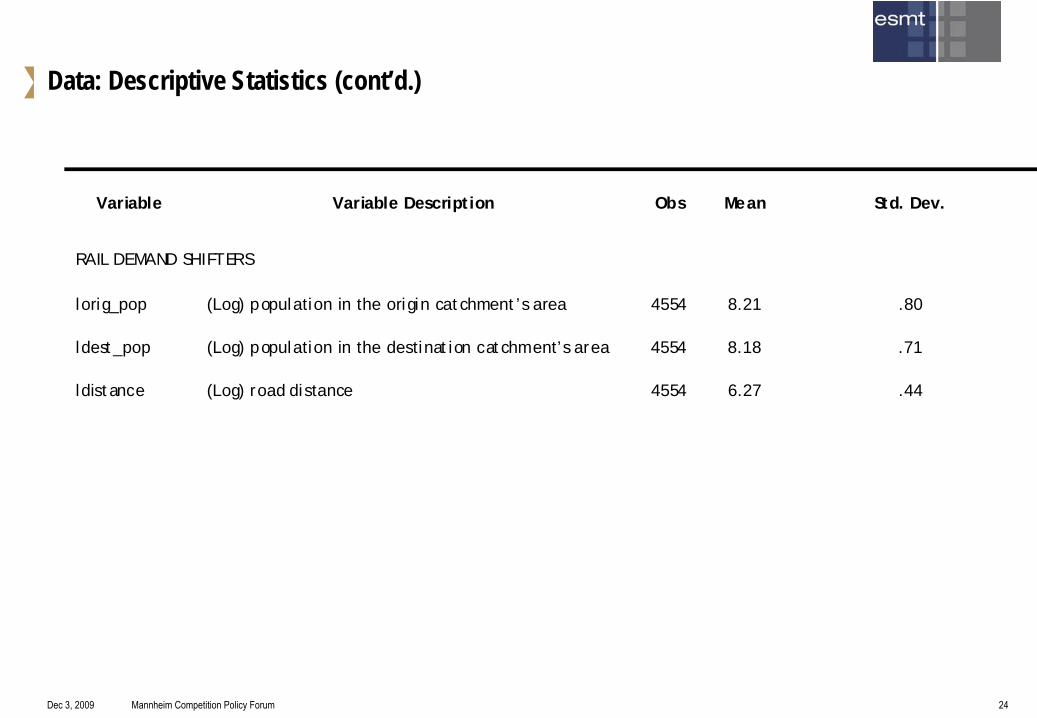
Data: Descriptive Statistics (cont’d.)
Variable Variable Description Obs Mean Std. Dev.
RAIL DEMAND SHIFTERS
lorig_pop (Log) population in the origin catchment’s area 4554 8.21 .80
ldest_pop (Log) population in the destination catchment’s area 4554 8.18 .71
ldistance (Log) road distance 4554 6.27 .44

Dec 3, 2009 Mannheim Competition Policy Forum 25
Data: Descriptive Statistics (cont’d.)
Variable Variable Description Obs Mean Std. Dev.
AIRLINE SUPPLY & QUALITY
lseats (Log) number of seat, e.g. capacity 3328 4.24 1.55
lflights (Log) number of flights 3328 .81 .51
lagldelay (Log) lagged flight delay on route 3192 3.39 .16
lair_dur (Log) flight duration (min) 3066 4.78 .59
Dec 3, 2009 Mannheim Competition Policy Forum 26
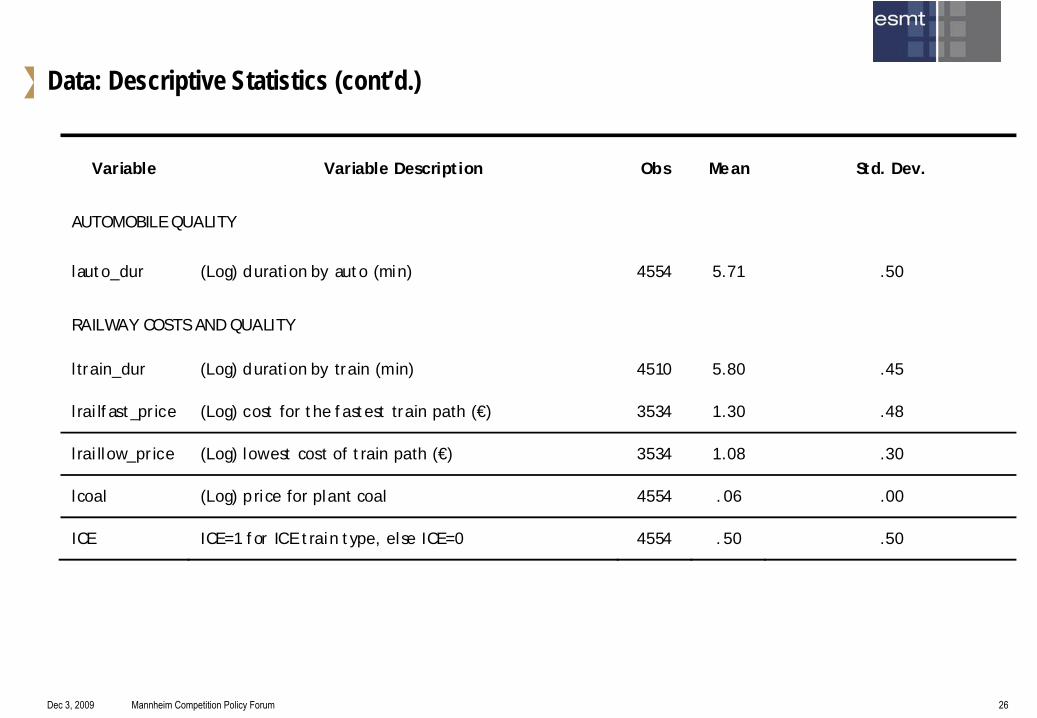
Data: Descriptive Statistics (cont’d.)
Variable Variable Description Obs Mean Std. Dev.
AUTOMOBILE QUALITY
lauto_dur (Log) duration by auto (min) 4554 5.71 .50
RAILWAY COSTS AND QUALITY
ltrain_dur (Log) duration by train (min) 4510 5.80 .45
lrailfast_price (Log) cost for the fastest train path (€) 3534 1.30 .48
lraillow_price (Log) lowest cost of train path (€) 3534 1.08 .30
lcoal (Log) price for plant coal 4554 .06 .00
ICE ICE=1 for ICE train type, else ICE=0 4554 .50 .50
Dec 3, 2009 Mannheim Competition Policy Forum 27
Article 81 - assessment of the Railteam alliance
Before 2010: no competition that could be harmed
Railteam enhances passenger comfort and service quality without interference in the process of operators independently determining the existence, the extent, and the frequency of individual train services
Given its scope and existing levels of competition in the long-distance passenger transport segment, Railteam is currently pro-competitive
Question: Will the assessment change when market entry will de jure be possible and when deeper alliances emerge?
ESMT study:-
Assess the extent and magnitude of intermodal competition from aviation
-
Assess the intensity of intramodal competition post-liberalization absent any co-operation (i.e. the intramodal counterfactual)
Dec 3, 2009 Mannheim Competition Policy Forum 28
LCAs
induce substantial competitive pressure
Competitive pressure can be observed in first and second class and has an effect on both passenger numbers and prices
Intermodal competition has to be part of a competitive assessment of future rail alliances
Results of analysis of intermodal competition
Dec 3, 2009 Mannheim Competition Policy Forum 29
Objective
−
Assessing the post-2010 counterfactual, i.e. the competitive situation that would prevail absent any co-operation
Methodology
−
Base pre-entry profitability on costs (with and without capital costs) und revenues for each O&D
−
Pre-entry
profitability provides upper bound of post-entry
profitability for entrants
−
Various entry scenarios for entrants-
top-down
(ICE technology) vs. bottom-up
(Intercity technology)
Three additional effects are part of the analysis
−
Impact of intermodal competition
−
Network effects
−
Public service operator levy
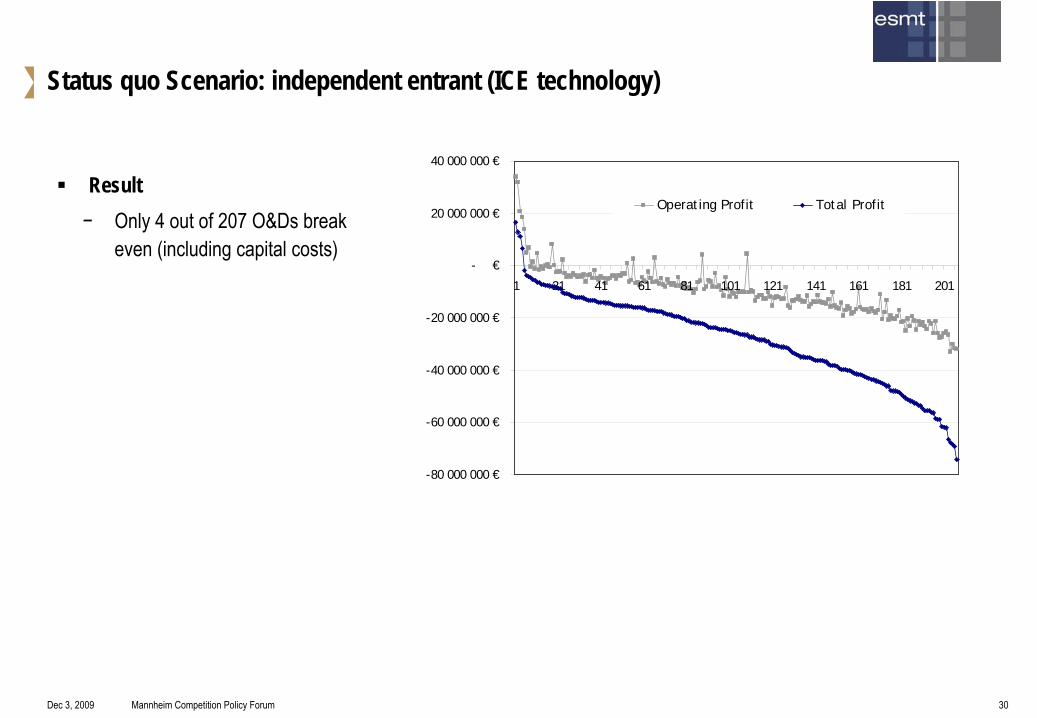
Scenario analysis: profitability of individual O&Ds in long-distance rail passenger transport
Dec 3, 2009 Mannheim Competition Policy Forum 30
Result−
Only
4 out of 207 O&Ds break even
(including
capital
costs)
Status quo Scenario: independent entrant (ICE technology)
-80 000 000 €
-60 000 000 €
-40 000 000 €
-20 000 000 €
- €
20 000 000 €
40 000 000 €
1 21 41 61 81 101 121 141 161 181 201
Operating Profit Total Profit

Dec 3, 2009 Mannheim Competition Policy Forum 31
Scenario 2010: independent entrant (intercity technology)
-50,000,000 €
-40,000,000 €
-30,000,000 €
-20,000,000 €
-10,000,000 €
- €
10,000,000 €
20,000,000 €
1 21 41 61 81 101 121 141 161 181 201
Operating Profit Total Profit
Assumptions−
Entrant takes over only the slower intercity connections −
Frequency of intercity trains is reduced to correspond to the actual load factor, i.e. load factor = 100%, no demand effect −
Reduction of operating costs by 10-20% (but higher energy costs)−
Possibility of cabotage, no transfer passengers, public service levy imposed over total distance−
Reduced capital costs (approx. 50% of costs of ICE)
Result−
16 out of 207 O&Ds break even−
59 O&Ds show positive operating profit
Dec 3, 2009 Mannheim Competition Policy Forum 32
Results of analysis of intramodal competition
Expansion in the
high-speed
rail
passenger
transport
segment
does
not
appear
profitable on
most
O&Ds
-
the
very
few profitable routes are domestic and high frequency services
Highest
likelihood
of entry
in the
intercity
segment
on longer
O&Ds
with
slower, but
cheaper
services
over
longer
distances
-
only under rather optimistic assumptions
Dec 3, 2009 Mannheim Competition Policy Forum 33
O&Ds with low likelihood of intramodal entry−
Relevant for most of the international O&Ds in the sample
Alliances unlikely to have anti-competitive effects
O&Ds with limited likelihood of intramodal entry−
Intercity segment with independent entrants
Alliances may have anticompetitive effects in these segments
In order to counterbalance potential anticompetitive effects, alliances would have to
prove the existence of significant intermodal competitive pressures
induce and show significant efficiency gains
Antitrust assessment of alliances post-2010
Dec 3, 2009 Mannheim Competition Policy Forum 34
Intermodal competition
−
Intermodal competition is a significant competitive restrain on long distance passenger rail services
Antitrust assessment needs to take this into account
Efficiencies of rail alliances
−
Joint ticketing and “hop on the next train”
are in line with the European Commission’s policy to create a integrated and efficient rail market for passengers
−
More efficiencies may be reaped by future alliances, such as through flexible pricing schemes, eliminating double-marginalization and coordination of services
Experience with alliances in other industries (airlines) suggests that alliances in transport industries may lead to lower prices and better customer service
Antitrust assessment of alliances post-2010: two building blocks
Recommended