Compliance with the Minimum Wage: Can Government Make a Difference?
David Weil Associate Professor of Economics Boston University School of Management Research Fellow Taubman Center for State and Local Government John F. Kennedy School of Government Boston University School of Management 595 Commonwealth Avenue, Room 520A Boston, MA 02215 Email: [email protected]
Version: May 2004
COMMENTS WELCOME—Not for quotation or copying without permission of the author. Acknowledgements: This research was supported by the Alfred P. Sloan Foundation and by the U.S. Department of Labor. I am grateful to Rae Glass, Jerry Hall, and Skarleth Kozlo of the U.S. Department of Labor, Wage and Hour Division for their guidance and provision of data for this paper, Carlos Mallo for research assistance on this paper and to seminar participants at the John F. Kennedy School of Government, Harvard University, Case Western Reserve University, and Boston University for comments on earlier versions of this research.
Compliance with Minimum Wage Laws: Can Government Make a Difference?
Abstract
This paper examines compliance with federal minimum wage laws in the U.S. apparel industry
and analyzes the impact of new methods of intervention designed to improve regulatory
performance. Drawing on data from a randomized survey of apparel contractors, we evaluate
the impact of agreements between manufacturers and the government used to monitor
contractor behavior as a means of improving compliance outcomes. Non-compliance is
significantly correlated with characteristics predicted by theory including employer size, skill
content, and the elasticity of labor and product demand. Nonetheless, stringent forms of
contractor monitoring are associated with significant reductions in violations of minimum
wage standards. The results suggest that well-designed private / public monitoring efforts can
lead to significant improvements in regulatory performance.
Compliance with Minimum Wage Laws: Can Government Make a Difference?
The economics of minimum wage has been an area of intense academic interest over the
past decade (e.g. Card and Krueger 1995). Relative to this large and growing literature on the
employment effects of minimum wage, comparatively little attention has been paid to the
compliance behavior of employers subject to the minimum wage since the seminal article by
Ashenfelter and Smith (1979). Yet there are strong reasons to believe that many employers will
choose to violate minimum wage standards when evaluating the benefits and costs of compliance
(Stigler 1970; Shavell and Polinsky 2000). In general, the incentives not to comply grow with
the divergence between the wage that employers desire to pay their workforce and the mandated
minimum wage. This divergence, in turn, is a function of features of the labor and product
market facing the employer.
Workers in low wage industries are particularly likely to receive wages below the
statutory level to which they are entitled. One such industry is apparel, which has long
exemplified the problem of enforcing minimum labor standards and more generally the
“sweatshop” problem. In 1893, The Committee on Manufactures of the House of Representatives
released a report regarding their investigations of the sweating system of production. Among
other findings, the Committee concluded that 80 percent of production originated in sweatshop
production.1 Several years later, President McKinley appointed a commission made up of
members of Congress and private citizens to study the problem. Arising from their study
1 See U.S. Congress, House of Representatives, Committee on Manufactures, “The Sweating System,” House Reports, 52nd Congress, 2nd Session, Vol. 1, no. 2309, 1893, pp. iv-viii.
Version: May 2004 1
running from 1898-1901, the commission documented extensive abuses including long hours,
low pay, and unsanitary conditions.2
This article examines the broader issue of compliance with minimum wage laws by
empirically examining microdata from the U.S. apparel industry today. We first review the
literature on the economics of minimum wage compliance. We then analyze product and labor
market conditions and regulatory interventions to predict employer behavior in the industry.
Using a unique set of data from random inspection-based surveys of apparel contractors in Los
Angeles, we examine correlates of employer compliance as well as other regulatory performance
measures. We then analyze the impact of a novel regulatory strategy that creates agreements
between the government and manufacturers requiring the latter to monitor labor standards among
their contractors. We model the determinants of minimum wage performance in order to
measure the impact of those agreements and to explain how new monitoring arrangements
change employer compliance behavior. The paper concludes with a discussion of the
implications of these findings to the regulation of labor standards domestically and
internationally and on other public policies.
II. Background
A. Economics of minimum wage compliance
A series of articles beginning with Ashenfelter and Smith (1979) analyze the economic
calculus of compliance as it applies to minimum wage. In their article, Ashenfelter and Smith
show that a profit maximizing firm selling output at price (p) and able to employ workers (L) at a
2 Reports of the Industrial Commission on Immigration and on Education. Washington, D.C.: Government Printing Office, 1901, vol. XV. A discussion of the history of regulating labor standards in the apparel industry can be found in Abernathy, Dunlop, Hammond, and Weil (1999), Chapters 2, 10, and 15.
Version: May 2004 2
wage rate (w), an elasticity of demand for labor (η) and other factors of production at price (r)
will decide whether to comply with the minimum wage by balancing the expected costs of
complying with the law and paying the mandated wage (M) against the expected cost of non-
compliance. The latter reflects the probability of being caught (λ) and incurring a penalty (D)
against the chance of not being caught and paying wages below the mandated minimum wage
(w). Ashenfelter and Smith show that an employer will choose non-compliance in the case that:
0)],,(),,()[1(),,()( >−Π−Π−=Π−Π DprMprwprME λλ (1)
In (1), the employer balances the expected profit from not complying (E(Π)) against the profit
known with certainty if the firm chooses to comply with the standard ( Π(M,r,p)). Equation (1)
predicts that noncompliance will rise with the divergence between the mandated wage and the
market wage and fall with either increased probability of detection or higher penalty levels.
Given the tradeoff between compliance and noncompliance portrayed in (1), Ashenfelter
and Smith show that an employer will choose not to comply with the law if the cost of non-
compliance, being the chance of caught (λ) and assessed the penalty (D) is less than the benefit
of not complying, being the chance of not being detected (1- λ ) multiplied by the total labor cost
saved by paying workers below the statutory minimum plus the additional savings arising from
incremental labor added because of paying below minimum wage, or:
DwMwLwML ληλ >−−−− ]])(5)[./()()[1( 2 (2)
The estimated benefit of not complying grows with the amount of under payment, both
because of the labor savings from the underpayment of a work force of a given size [L(M-w)]
and the growing benefits arising from underpayments because of its effect on employment (the
second term in the benefit side of equation (2)). In particular, the incentive not to comply grows
as a function of the following employer characteristics:
Version: May 2004 3
• Correlates that would lead the market wage to be substantially below the statutory wage (M-
w>0) such as low skill requirements for the required labor;
• Increases in the absolute value of the elasticity of labor demand (η), as measured by factors
such as skill content, capital intensity, and other Marshallian factors of derived demand;
• Employer business characteristics that lower the probability of detection of noncompliance
(λ), such as high levels of industry exit and entry; small average establishment size; and an
ability to evade public scrutiny by operating in the underground economy.
Conversely, government regulators can raise the incentives for employers to comply (holding
constant the characteristics of contractors listed above) by:
• Increasing the probability of violation detection (λ) either from increasing the probability of
inspection and / or the chance that those inspections uncover violations;
• Increase the expected penalty levied for non-compliance with the law (D).3
B. Apparel industry dynamics and employer compliance
Product and labor markets in the apparel industry have many of the features that would
lead one to predict high rates of noncompliance with minimum wage standards. In particular,
the women’s segment of the industry has been characterized by a more splintered production
system where different enterprises carry out the design, cutting, and sewing and pressing /
3 Grenier (1982) modifies the Ashenfelter and Smith analysis by noting that under the Fair Labor Standards Act, the government does not levy penalties for first time violators, nor typically assess high penalties for repeat offenders. Instead, the Wage and Hour Division (the arm of the U.S. Department of Labor with authority for enforcing FLSA) requires offending employers to pay back wages to employees who have been underpaid during the period of time covered by the inspection (that is an amount equal to M-w). Grenier points out that since the typical “penalty” facing a firm is a fraction of the underpayment in wages, the penalty effect is far less than implied by the Ashenfelter and Smith model (which assumed a lump sum penalty of “D”). Chang and Erlich (1985) modify the penalty function by allowing it to grow with the degree to which the actual total wages paid by the contractor are lower than the mandated wages for that workforce. This modification in the model (which brings it closer to the actual penalty policy pursued by WHD) leads them to conclude that a “minimum wage enforcement policy requiring
Version: May 2004 4
packaging of apparel products (see Figure 1).4 For example, a “jobber” may sell a design to
retailer, and then contract with a manufacturer for delivery of the product. Manufacturers
typically purchase and cut garment fabrics, but then contract out sewing to one or more
companies (which may, in turn further contract out sub-assembly). Contractors compete to
preassemble bundles of cut garment pieces in a market where there is little ability to differentiate
services (i.e. sewing and associated assembly) except for some operations requiring higher levels
of skill content.
In general, as one goes to “lower” levels of apparel production (going from the top to
bottom of Figure 1) the level of competition intensifies and profit margin per garment diminish.
Sewing contractors compete in a market with large numbers of small companies, low barriers to
entry, and limited opportunities for product differentiation. This creates classic conditions for
intense price-based competition. Labor market conditions also tend to push wages towards the
legal minimum or below. Entry-level sewers can typically reach the standard rate for sewing in a
matter of months, making it relatively easy to substitute workers in the event of turnover
(Abernathy et. al. 1999). The apparel industry and sewing has always been attractive to
immigrants given its low skill barriers (e.g. Slovaks, Germans, and Jews at turn of century;
Hispanic, Chinese and Asian workers today (Kwong 1997)).5 The consequent elastic supply of
workers and the relatively low skill level demands for them keep wage levels low and the
incentive to work long hours--even in inhospitable work environments--high. Given these
the violating firm to pay only a fraction of the difference between the statutory minimum and the market wage per unit labor will not constitute an effective deterrent” (p. 87). 4 In the U.S., men’s clothing--from the 1920s onward—is primarily produced in factory-type settings, with manufacturers designing, cutting, sewing, pressing, and packaging products. 5 See Commons (1901) in Part III of the Industrial Commission report entitled “Immigration and Its Economic Effects.”
Version: May 2004 5
market features, non-compliance has historically been a problem among the large number of
contractors and subcontractors that assemble apparel products.
Regulatory attention has historically been focused at the contractor-level of the industry.6
Table 1 presents characteristics of FLSA enforcement in the apparel industry since 1996 that can
be used to assess the economics of compliance for the typical contractor. The WHD conducted a
total of 3,226 investigations in the garment industry between the final two quarters of 1996 and
the fourth quarter of 2000, or about 200 inspections in a typical 3-month period. This inspection
activity translates into an annual probability that a given contract shop will receive an inspection
(λ) below 0.10.7 Penalties under FLSA are the civil penalties levied by WHD inspectors based
on the scale and severity of non-compliance detected as well as the past history of the contractor.
Applying the enforcement outcomes in Table 1 to the employer trade-off depicted in
equation (2) the values for the above equation can be roughly estimated for an apparel contractor
with 35 workers. Given an average annual underpayment per worker ((M-w)) of $3388 a median
civil penalty (D) of $1,086, an average annual likelihood of inspection (λ) of .1, and assuming a
relatively high labor demand elasticity (η) of -1.5, the potential cost of not complying is $121
6 Minimum wages (as well as regulation of overtime compensation beyond 40 hours in a work week and child labor) are set out in the Fair Labor Standards Act (FLSA) of 1938. Enforcement of FLSA is carried out by investigators of the Wage and Hour Division (WHD), located in 400 offices around the country. 7 This is based on the following calculation: There were roughly 10,000 establishments in the segments of the apparel industry that are the focus of WHD regulation. Given that there were about 800 investigations conducted annually by WHD investigators, the annual probability of inspection is about .08. Focusing on one particular city yields similar estimates: there were a total of 260 investigations in New York City in 1998. Given that there were about 2600 apparel establishments, the probability of inspection in that year was .10. 8 This estimate of underpayments is based on the randomly selected set of first-time violators used for the empirical portion of this paper (see below). We do not use the back wage information from Table 1 because they are based on contractors that have been the target of enforcement actions, and therefore do not represent a typical contractor in the industry.
Version: May 2004 6
versus a benefit of $12,205, implying that an apparel employer should clearly choose not to
comply.9
The incentives for noncompliance are further compounded by two factors: (1) contractors
are not subject to civil penalties the first time they are found out of compliance with the law,
thereby setting the value of D essentially to zero for first time offenders; and (2) a high
proportion of contractors do not stay in business for more than two years. We can do a simple
simulation for an employer facing the compliance decision for two time periods, where the
employer faces an initial chance of detection, λt1=0.1. If a contractor is inspected in the first
period and is found in violation of minimum wage, we assume that the chance of an inspection in
the second period doubles (λt2=0.2); if the contractor is caught out of compliance in the first
period, it must pay the back wages to underpaid workers, but no penalty. If caught a second time
(and assuming the same average underpayment), the contractor must pay back wages plus the
average expected civil penalty. Finally, we assume that in each period, a contractor faces a 0.80
probability of surviving to the next period. Under these conditions, a contractor should choose to
underpay workers and violate minimum wage standards in periods 1 and 2. In fact, the
incentives facing contractors are such that an employer will choose non-compliance even when
found in violation of minimum wage requirements in the first period and facing a higher
inspection probability and civil penalty in the second period.10
9 Given the above and assuming annual wages (w) of $8000, the first term in left hand part of the equation is $11,830 and the second term is -$375 (given the elasticity of -1.5); subtracting the second (negative) term from the first leads to an estimated benefit of not complying of $12,205. The estimate is an approximation because it uses observed levels for several key factors—in particular back wages owed to estimate (M-w) and the annual probability of inspection rather than the perceived inspection probabilities, both of which are not directly observable. 10 Contractors will also choose not to comply in a three-period model even with similar escalation of inspection probabilities and penalties. These results are available from the author.
Version: May 2004 7
C. New methods of regulatory enforcement
Product market forces have been modified in recent years by a new dynamic in the
channel of relations between retailers-apparel manufacturers-and textile producers. A new model
of retailing--“lean retailing”-- takes advantage of information technologies such as bar codes and
scanners, electronic data interchange, and industry-wide product identification standards to align
more closely real-time sales data collected by retailers with the orders they place with suppliers.
This system reduces the need for retailers to stockpile large inventories by improving their
information about the underlying state of consumer demand, thereby lowering the costs
associated with stock-outs, markdowns, and inventory, as well as reducing their overall exposure
to inventory risk. The companies that have adopted lean retailing principles now dominate major
retail segments (Abernathy, Dunlop, Hammond, and Weil 1999).
Retailers using these systems require suppliers to provide more frequent and smaller
orders of products than under the traditional retail system. They also require apparel suppliers to
meet rigorous logistic standards concerning delivery times, order completeness, and shipment
accuracy. Lean retailing therefore changes the problem faced by an apparel supplier: Suppliers
must replenish products on an ongoing basis, with some retailers now requiring replenishment of
electronic orders in as little as 3 days. The change in retailer-supplier relations makes anything
that disrupts the ongoing replenishment of retailers a major problem for apparel suppliers:
replenishment interruptions lead to penalties, cancellation of orders, and even loss of retail
customers for those suppliers. Given that retailers drive the dynamics of the apparel markets
depicted in Figure 1, the increasing importance of time translates into a potential tool of
regulatory enforcement.
Version: May 2004 8
Beginning in 1996, the WHD shifted its enforcement focus in response to these new
relations in the apparel channel. Rather than regulating labor standards one contractor at a time,
the WHD employed time sensitivity of lean retailers as a means of exerting regulatory pressure
by invoking a long ignored provision of the FLSA, Section 15(a). Under Section 15(a) (the “hot
cargo” provision), WHD can embargo goods that have been manufactured in violation of the
Act. Although this provision had limited impact in the traditional retail-apparel relationships
given the long delays in shipments and the presence of large retail inventories, invocation of the
hot goods provision now raises the costs to retailers and their manufacturers of lost shipments
and lost contracts.
In addition to ensuring that back wage claims are resolved, the new WHD policy uses the
threat of embargoing goods to persuade manufacturers to augment the regulatory activities of the
WHD. It does so by making the release of embargoed goods contingent on the manufacturer’s
agreement to create a compliance program for all contractors that it subcontracts work. This
entails the manufacturer agreeing to sign two types of agreements: an agreement between the
manufacturer (or jobber) and the Department of Labor that stipulate the basic components of a
monitoring system that will be operated by the manufacturer11; and an agreement that the
manufacturer signs with its contractors that set out how contractors will seek to comply with the
labor standards (U.S. DOL, 1998; 1999; Ziff and Trattner 1999; Weil 2002).
For the economics of compliance arising from this new regulatory approach to change
behavior, manufacturer monitoring would need to substantially change the chances of detection
(λ) and penalties (D) for contractors. For example, if manufacturer monitoring arrangements
11 These agreements, however, are entered in voluntarily by the manufacturer and their terms are therefore negotiated out between the government and the manufacturer / jobber. The terms described here are taken from the
Version: May 2004 9
doubled the annual expected probability of detecting violations to .2, the effective penalty facing
a contractor would need to be $48,819 to induce compliance for the median contractor; if the
chance of detection rose to .33, the penalty would still need to be $24,780, more than twenty
times the current level. We study whether the behavior of contractors under monitoring imply
such dramatic changes in the underlying incentives to comply with minimum wage standards.
III. Data and Descriptive Statistics
A. Data source
The data for this study arise from surveys conducted by the U.S. Department of Labor
Wage and Hour Division (WHD) of randomly selected apparel contractors in the Los Angeles
area garment industry. The universe for the 2000 random survey was comprised of all apparel
industry firms appearing on the California manufacturing registration list for that year.12 Using
this comprehensive list of apparel manufacturers and contractors as the sampling universe, the
WHD randomly selected establishments representing contractors operating in 2000.
Because of the high rate of turnover of contractors, a separate sub-sample was created to
represent contractors that had been previously inspected and found in violation of the Act. A list
of all contractors that found in FLSA violation in the prior 2 years was assembled and a random
sample of these contractors was selected for similar investigation-based surveys, resulting in a
total of 30 contractors. The group of prior violators is over-sampled as a result of this procedure.
Department of Labor’s model agreement language specified in formal policy documents (see Wage and Hour Division, 1998). 12 The California registration list for apparel consists of “…all persons or firms engaged in the business of apparel manufacturing…” where apparel manufacturing is defined as “…sewing, cutting, making, processing, repairing, finishing, assembling, or otherwise preparing any garment or any article of wearing apparel or accessories designed or intended to be worn by any individual…”
Version: May 2004 10
In order to deal with this problem, the sample is re-weighted according to the expected
percentage of prior violators that should be present in a randomly selected sample given an
underlying level of non-compliance at 55%, an annual level of inspections of 10% and annual
contractor turnover of 25%.13 Based on this, we re-weight the data in the regression analysis so
that about 17% of the sample consists of observations for the prior violators.
Contractors selected from both lists received an “inspection-based survey” by WHD
investigators that included a review of all payroll records for the prior 12-week period. The
payroll review is similar to that conducted by WHD in regular inspection activities. In addition,
the investigators collect information on other aspects of the contractors business, including
employer size, years of operation, business structure (e.g. corporation or partnership), and types
of products assembled. Information on the number of manufacturers that the contractor worked
for over the past 6 months and whether or not those manufacturers had monitoring programs are
also collected.
B. Compliance measures and descriptive statistics
Table 2 provides descriptive statistics regarding different measures of minimum wage
compliance for the sample as a whole and split out by those contractors that had never received
prior inspections and those with prior violations. In terms of overall compliance, 54% of
contractors surveyed were not in compliance with minimum wage provisions of the FLSA, with
an average of 8 employees per contractor were underpaid in some way. A typical contractor
owed about $3700 in back wages for the time period under study. These estimates can be
standardized given that contractors in the sample differ in size and that there is some variation in
13 These are based on estimated levels of non-compliance and contractor turnover from the sample of non-violators and an estimated inspection probability from industry data as set out in footnote 7.
Version: May 2004 11
the period of time of payroll review. One standardized measure used throughout this study is the
average number of workers that were underpaid per 100 production workers employed. A
second standardized measure is the average back wage owed per week per employee. These
estimates are provided in the final two rows of Table 2.14 With respect to these standardized
measures of compliance, the differences in levels are not statistically significant between
contractors that had no prior violations and those with prior violations.
The measure of performance typically employed in regulatory evaluations is employer
compliance with promulgated standards. In the case of minimum wage, a contractor is
considered as being out of compliance if one or more employees are found to have been
underpaid during the investigation period. The obvious problem with this approach is that it
does not delineate between employers who underpaid a small fraction of their workforce from
those who underpaid a large proportion or between cases where employees experience gross
underpayment in wages from cases where the typical infraction is minor.
The economics of minimum wage compliance and the impact of government
interventions may differ dramatically according to what measure one employs. For example, it is
possible that government interventions may have limited impact on the overall likelihood of
violations (measured as one or more violations of the Act) even though it might substantially
lower the number of violations per contractor, or the average severity of those violations.
Accordingly, we measure contractor compliance behavior in terms of (1) overall likelihood of
compliance (traditional measure of compliance); (2) the incidence of violation (measured as the
number of violation per 100 workers employed); and (3) the severity of violation (measured as
14 The comparatively large size of back wages owed per contractor among prior violators relative to first time violators reflects a longer investigation period used by the WHD when surveying prior violators. For this reason, we use back wages owed per worker per week to provide a standardized measure of regulatory performance.
Version: May 2004 12
the back wage owed per week per worker). Table 3 provides all three measures of compliance,
and compares them across contractors with different characteristics. The overall extent of
minimum wage violations is significant across all three measures: about 46% of employers
comply with minimum wage; more than 27 of every 100 workers has experienced some degree
of underpayment, and the seriousness of violations is equivalent to underpaying every worker on
the employer by about $5.00 per week (in an industry where average hourly earnings were
approximately $8.00 in 2000).
Table 3 also provides evidence consistent with the predictions of the minimum wage
literature surveyed above. For example, theory would predict that firms that have less elastic
demand for labor--either because of the skill content of the work or of its labor force--would be
less likely to violate minimum wage. One proxy for skill content is the product produced by a
firm: T-shirts require low levels of skill (i.e. short periods of time for sewers to achieve desired
levels of productivity). In contrast, dresses and jeans require higher degrees of sewing skill (with
the time required to hitting desired productivity standards from six to eight months). Consistent
with this skill content, compliance performance (as measured in all three dimensions) is lowest
for T-shirts in all three dimensions than for jeans and dresses.
Similarly, theory would predict that the more elastic the demand for the product (sewing
services), the more likely that firms will violate minimum wage standards. One proxy for price
elasticity is pricing power—here measured as the self-reported ability of a contractor to
renegotiate price if the delivery time for a product is moved up by their manufacturer customer.
Contractors who report an ability to change prices have a far lower likelihood to be in violation
of minimum wage (.176 vs. .616), a far lower incidence of violations (7.2 vs. 31.1) and
significantly less severity than contractors lacking this ability (0.56 vs. 6.02). The relation of
Version: May 2004 13
contractor size and age are also generally consistent with that predicted by theory: larger
contractors have a lower likelihood of being out of compliance with minimum wage and have
correspondingly lower incidence and severity levels than small contractors. Similar relations are
found for older businesses and compliance, reflecting that enterprises that have survived longer
are more likely to comply with the minimum wage (perhaps reflecting a desire of those
employers to retain their workforce). The mean values of these contractor characteristics are
provided in the first column of Table 5 and discussed in greater detail below.
IV. The impact of contractor monitoring on compliance
A. Incidence of monitoring
The frequency of different types of monitoring arrangements between contractors and
manufacturers is presented in Table 4.15 The upper part of the table indicates the presence of
seven different monitoring features by at least one of the manufacturers for whom the contractors
worked in the past 6 months. For example, 59 percent of all Los Angeles contractors surveyed
did work for at least one manufacturer that conducted unannounced visits.
Although there are many potential combinations of the different monitoring activities,
certain combinations of activities have potentially larger impacts on contractor behavior than
others. We focus below on specific combinations of monitoring activities, grouped into two
categories, “low” and “high” monitoring, which indicate the stringency of monitoring
arrangements under which a contractor operates. The category low monitoring is assigned to
15 In the random surveys, contractors are asked to specify the names of manufacturers and / or jobbers for whom the contractor provided services over a specified time period, and the monitoring activities (if any) that were conducted
Version: May 2004 14
contractors who report that at least one of their manufacturers is conducting at least one of the
seven monitoring activities. It therefore represents the presence of any monitoring activity.
About 74 percent of the contractors in Los Angeles could be classified as operating under Low
monitoring.
High monitoring is defined according to the presence of two specific monitoring features:
payroll review and unannounced inspections. This combination of monitoring activities provides
manufacturers with the means of assessing the presence of possible minimum wage or overtime
violations (payroll review) and a way of gaining a more realistic assessment of contractor
operations (unannounced visits). We focus on these features because of their consistently
significant impact on performance and complementary nature to one another.16 High monitoring
occurs when all of a contractor’s manufacturing customers have both payroll review and
unannounced visits in place. As a result, this very high level of oversight of a contractor by all
of its customers represents the most stringent case of monitoring. The frequency of high
monitoring was about 30 percent in 2000.
B. Statistical model of compliance
Given the economics of minimum wage compliance and the expected impact of
monitoring, the overall likelihood, incidence, and severity of minimum wage compliance
observed at contractor i can be modeled as:
),,,( iiiii XPdctLaborMonitoringfMWPERF = Where:
by those manufacturers. We use this information to create the different categories of monitoring discussed in the text. 16 We arrive at this particular combination of monitoring activities as the focus of subsequent empirical analysis through a factor analysis of the seven monitoring activities as predictors of compliance behavior. These results are available from the author. The importance of the two attributes is also supported by discussions with WHD investigators.
Version: May 2004 15
MWPERF: Minimum wage performance of contractor i (likelihood, incidence, and severity); Monitoring: Presence and stringency of monitoring by manufacturers; Labor: Elasticity of labor demand and average wage level of the contractor, as characterized by the average skill level drawn upon by a contractor; Product: Elasticity of product demand (i.e. sewing services) for the contractor, as characterized by its ability to affect the price of services it provides to manufacturers; X: Vector of other employer characteristics that are correlated with minimum wage performance, including size, age of the business, and prior inspections by WHD. The effects of labor and product market characteristics have been discussed above. We
capture contractor features associated with labor demand elasticity by including a variable for T-
shirts that have the lowest skill content relative to other products. For product market, we use
the response to survey questions regarding the ability of the contractor to change price in the
event that a manufacturer moves up the delivery date of a product (“pricing power”).17
We use the above definitions of monitoring to estimate the incremental effects of having
no monitoring, some (“low”) monitoring or stringent (“high”) monitoring.18 As a result, the
coefficient on the low monitoring variable can be interpreted as the marginal effect of any
monitoring relative to no monitoring and the high monitoring variable as equaling the marginal
effect of that more stringent method relative to having any monitoring present.19 Finally, we
17 Contractors are coded as having an ability to influence price if they answered “yes” to the following: “If manufacturers change the due date (move it up), do you renegotiate the contract cost with the manufacturer to adjust for any added expenses” and indicated that they renegotiate such costs “sometimes,” “50/50,” “frequently,” “always.” 18 In the data, low monitoring is therefore always equal to 1 if high monitoring is equal to 1. 19 The estimated monitoring effects should be considered carefully. Because the agreement to monitor contractors is made between the manufacturer and the WHD, coverage is not directly determined by the contractor. Because a typical contractor works for multiple manufacturers, some under requiring monitoring and some not, a monitoring effect on compliance cannot simply be regarded as an artifact of self-selection by contractors. At the same time, one cannot regard monitoring as completely exogenous: manufacturers wary of future embargos who enter into contractor monitoring agreements will engage in two types of activities: attempting to change the behavior of contractors and selecting contractors that have a higher probability of paying their workers the minimum wage. Because of the latter activity, monitoring—although not chosen by the contractor—is endogenous in that the
Version: May 2004 16
include variables for contractor size, age (measured as a dummy for those contractors that have
been in business for more than 2 years), and a dummy for prior citations by the WHD for
violations of the FLSA.
C. Likelihood of non-compliance
In order to gauge the impact of monitoring on the likelihood of overall non-compliance
(measured as the presence of any violation of minimum wage by the contractor) we estimate a
logit regression for monitoring, holding constant the other variables discussed above. The logit
estimates are presented in Table 5 along with their implied marginal effects on compliance.
The presence of monitoring is associated with a statistically significant reduction in the
probability that contractors will be in violation of minimum wage standards. The logit
coefficient for “low” monitoring implies that the presence of any monitoring feature by any
manufacturer reduces the likelihood of noncompliance by 0.32, all other factors held constant at
their means. Non-compliance probability declines by an additional .31 given the presence of
high monitoring features. These represent substantial improvement in compliance, implying that
the presence of monitoring significantly raises the costs to contractors of failing to pay the
minimum wage.
The variables controlling for other contractor characteristics included in the model also
have their expected effects on compliance and are statistically significant and imply relatively
large impacts on contractor behavior. In particular, a contractor’s ability to negotiate price with
selection criteria used by the manufacturer (reduce the chance of goods embargo) is correlated with contractor compliance. We attempt to decompose these effects in the next section. It should be noted that in the case of measuring the overall impact of monitoring, both effects can be attributed to the intervention. Thus, although endogeneity of monitoring cannot be ruled out, both manufacturer effects are relevant to the question of whether monitoring improves contractor behavior.
Version: May 2004 17
manufacturers (Pricing power) substantially reduces the likelihood of non-compliance in all four
equations by an estimated 0.42. As predicted, producing a product with low-skill content (T-
Shirt) raises the predicted level of non-compliance by 0.26 relative to producing garments with
medium- or higher-skill content.
D. Incidence and severity of violations: Tobit Results
As discussed above, one limitation of using non-compliance as a measure of contractor
behavior is that it tells little about the incidence or severity of minimum wage violations. That
is, an employer will be classified as not complying with the law whether a small or large fraction
of employees are underpaid or whether a typical worker has been grossly underpaid versus
receiving very slight underpayments.
Ordinary Least Squares (OLS) regression estimates of the determinants of minimum
wage incidence (violations per 100 employees) or severity (back wages owed per worker per
week) will be biased because of the substantial number of contractors who have not committed
any minimum wage violations. As a result, the dependent variables are left-censored and
therefore subject to bias in estimates of the various independent variables. We correct for this
problem by estimating a series of Tobit regressions for the two measures of minimum wage
compliance.20
The estimated coefficients obtained from running a Tobit model are shown in Table 6.
Since by construction, the dependent variables can never be negative, we also present the
marginal effect of monitoring and other factors conditional on the dependent variable being
uncensored. These coefficients more accurately depict the marginal effect of the independent
Version: May 2004 18
variables on the dependent variable, both because we are interested in the change in behavior of
those who do not comply (dependent variable greater than zero), and also because the dependent
variables cannot have a negative value.
The results indicate that the presence of any monitoring (Low) is associated with lower
incidence and severity of minimum wage violations, although the coefficients are not statistically
significant. However, the marginal effect of more stringent monitoring (High) is large, lowering
the incidence of violations by 16.9 per 100 workers and reducing severity by $4.90. Minimum
wage performance improves markedly with the stringency of monitoring.
The coefficients for pricing power are large (similar in magnitude to high monitoring)
and statistically significant. The negative coefficient implies that contractors with an ability to
affect the price of their products are more likely to comply with minimum wage than those
lacking such ability. The variables for contractor size, age of business, and type of garment all
have the expected sign but are not statistically significant in the regressions.
V. Interpreting the monitoring effect
There are several possible sources of the association between monitoring and regulatory
performance. A “direct” impact of monitoring arises when manufacturer (or third-party) review
of contractor payrolls, wage policies, and related activities during unannounced visits lead
contractors to change their levels of compliance with FLSA. As mentioned above, however, this
is not the only way that monitoring might affect performance.
20 Tobit models for an alternative severity measure, back wages per affected worker per week were also run. The sign and significance of monitoring and other key independent variables were similar for this measure of severity and are therefore not reported here. The results are available from the author.
Version: May 2004 19
Manufacturers that sign monitoring agreements might also seek out contractors that are
more likely to comply with FLSA as a means of lowering risks of future embargoes. If many of
the manufacturers with monitoring agreements in place undertake this kind of activity,
contractors with higher compliance rates will end up sorting themselves with manufacturers that
undertake monitoring while less-compliant contractors will end up with non-monitoring
contractors.21 Sorting effects still lead to real changes in the overall level of regulatory
performance if an increasing percentage of manufacturers in the market undertake monitoring
over time. In fact, this has happened over time in Los Angeles as the WHD has expanded the
number of manufacturers that have agreed to undertake monitoring of their contractors (WHD
2001). Nonetheless, both the direct and sorting effects could contribute to the results depicted in
Tables 5 and 6.
Because the survey data pertain to a group of randomly selected contractors in one year
rather than the same set of companies followed over time, it is not possible to directly observe
whether the measured effect arises from behavior changes induced via monitoring or sorting
behavior. However, we can compare cases where manufacturers have different amounts of
information about a contractor’s likelihood of violating minimum wage provisions as a means of
gauging direct versus sorting effects.
21 In an extreme case of pure selection, this sorting could lead to the appearance of monitoring effects, even though contractors did not change their behavior at all, but simply sorted themselves between monitored and non-monitored contractors. For example, imagine that there are 30 compliant contractors and 70 non-compliant contractors. The 100 contractors work for two manufacturers, so the overall percent of compliance is 30%. Prior to the imposition of monitoring, assume that compliers and non-compliers are distributed equally between the two manufacturers. Now imagine that one of the manufacturers signs a monitoring agreement with the government and the other does not. If there is pure sorting, all 30 compliers will end up pairing with the monitoring manufacturer while the 70 non-compliers will pair with the non-monitoring manufacturer. After sorting, the overall percent of compliance will still be 30%. However, if one measured the impact of monitoring, monitored contractors would have far better compliance performance than non-monitored contractors. In this pure selection case, a program effect would be incorrectly ascribed to monitoring.
Version: May 2004 20
An obvious test for the importance of sorting involves comparing the incidence of
monitoring among contractors with prior WHD violations versus those without prior violations.
Information on a contractor’s prior violations of FLSA is public and published in the WHD’s
quarterly Garment Enforcement Report.22 A manufacturer concerned about past behavior of
contractors has ready access to this report and could use the information in selecting firms. If
sorting was predominately driving the measured effect of monitoring, we would expect that
contractors without a prior violation history would have a higher probability of being monitored
(because they would be selected by manufacturers with monitoring) than contractors possessing
a prior violation history.
In fact, the incidence of high monitoring among contractors with prior violations is about
the same as the incidence of high monitoring among contractors without prior violations: the
probability of high monitoring is .31 among contractors without prior violations versus .29
among contractors with a prior violation (the small difference is not statistically significant). This
lack of association between a contractor’s prior history of violation and the probability of being
monitored therefore runs counter to the sorting story as an explanation of the monitoring effects
in Tables 5 and 6.23
A second approach for examining direct and sorting effects involves separating the
sample between recent industry entrants and established contractors. New contractors (defined
in our analysis as those that had been in business less than two years) have no real track record
22 The Garment Enforcement Report provides the name, location, and violation details found for garment contractors inspected in the prior three-month period and found to owe back wages above $1000. The reports were first published in 1996 and released quarterly throughout the study period in Los Angeles. 23 We further tested the sorting story by separating the sample into a “non-violator” and “prior violator” group and running the Tobit models in Table 6 on the two sub-samples. If the primary effect arose from sorting, we would predict that the monitoring coefficients would be small for the sub-samples. In regressions for both sub-samples, the high monitoring coefficient remains large and statistically significant, consistent with the direct effect story dominating the sorting effects. These model results are available from the author.
Version: May 2004 21
and because of this lack of information, manufacturer matching is less likely. An association
between monitoring and performance among this group would therefore arise primarily from
direct monitoring effects on behavior.24
For this analysis, we look solely at the randomly chosen sample of contractors and
exclude the contractors from the violator sample entirely. We then separate the remaining
random sample into older contractors (defined as those that had operated for more than two
years) and new contractors. Sorting takes time, partially because it requires manufacturers to
find contractors that comply with minimum wage but also because the process itself is based on
reputation, which may take time for contractors to establish. Given the high rate of turnover in
the industry, manufacturers will have comparatively little information about new contractors
relative to older contractors. As a result, new contractors are much more likely to be paired with
manufacturers for reasons other than matching.
Table 7 presents Tobit estimates for the non-violator sample only, further separated
between “new” and “old” contractor sub-samples. Once again, we find significant evidence of
an association between monitoring and performance after separating by the contractors’ years in
operation. Among contractors that had been in business less than 2 years, the estimated marginal
effect for high on incidence is –22.3 and -$5.80 for severity for new contractors. In addition, the
coefficients are similar to the values obtained in Table 6 for the whole sample, indicating that
changes in behavior seem to prevail over sorting.
24 For sorting to operate, contractors must have characteristics that are observable at relatively low cost by manufacturers which, in turn, are correlated with probable FLSA performance. This may include the reputation of established contractors available from other manufacturers, the type of work (skill and quality level) it is engaged, the nature of it work force (skill, tenure, training), or the particular production system it employs (e.g. progressive bundle; modular production; Toyota system). Even though these are not direct measures of pay practices, they may be highly correlated with them.
Version: May 2004 22
In contrast, the empirical results are consistent with a sorting story among older
contractors. Coefficients for high monitoring are not significantly different than zero, implying
that there is no incremental effect of monitoring in this subgroup. Equally interesting, however,
is the large and significant effects of low monitoring for older contractors (with predicted
impacts on incidence of –26.1 and severity of -$12.1). These results imply that the presence of
any monitoring features leads to large and significant reductions in performance. One
interpretation of this result is that if manufacturers have significant information on prior
contractor behavior, only threshold levels of monitoring are necessary to induce changes in
behavior. That is, given prior information on contractor behavior, intensive monitoring implied
is not required to elicit relatively large changes in contractor behavior. For this subgroup,
sorting might be a more important part of monitoring effects because of the additional
information manufacturers may have about these contractors.
VI. Conclusion
The literature on the economics of minimum wage going back to Ashenfelter and Smith
(1979) predict that employers in certain industries will face significant incentives to violate those
laws. In addition, subsequent literature (e.g. Grenier 1982; Chang and Erlich 1985; Yaniv 2001)
predicts that the traditional structure of government enforcement creates insufficient regulatory
incentives to overcome these behaviors because of the low expected penalties for violation and
the correspondingly small probability of being detected out of compliance.
This paper provides strong empirical evidence to support the predictions of the minimum
wage literature on the incentives for non-compliance in an industry like apparel that has
conditions tailor-made for wide-scale non-compliance. Although the results of the study are
consistent with the notion that traditional tools of regulation will not provide sufficient incentives
Version: May 2004 23
to improve labor standards, we find very strong evidence that new forms of regulation that draw
on supply chain dynamics can have a substantial impact on improving labor standards outcomes.
Government, it seems, can make a difference.
The use of supply chain pressure to create monitoring systems leads to changes in
contractor behavior by altering the basic regulatory calculus facing those contractors. In
particular it introduces substantial private penalties (D) that easily swamp in magnitude the civil
penalties available to the government as well as appreciably increase the implicit probability of
inspection (λ) facing contractors. We can roughly estimate the magnitude of those implicit
penalties. Section II showed that the level of penalties required to tip contractors towards
compliance given the amount of back wages owed by a typical contractor would be about
$49,000 if that monitoring also led to a doubling of the de facto probability of detection (to
λ=.2). This level of implicit private penalty is plausible given that a typical contractor in our
sample has approximate annual sales of $1.0 million, and works for an average of 8-10
manufacturers in the course of a year. If being caught in violation of minimum wage leads to the
loss by the contractor of one of its manufacturer’s business, roughly equivalent to $100,000, the
implied penalties arising under the new monitoring system could indeed induce substantial
change in regulatory performance.25
Improved regulatory performance, however, will also impact overall employment in the
industry. We do not estimate here the probable size of employment effects of improved
regulatory performance. In general, to the extent that improved compliance leads to higher
wages on the margin, there will be some employment loss associated with improved minimum
25 Figures based on data from Current Industrial Reports—Apparel (U.S. Department of Commerce, MQ315a(02), February 2002) and survey data regarding the number of manufacturers.
Version: May 2004 24
wage compliance.26 As a result, the overall social welfare implications of these findings--
weighing both the benefits of improved compliance for employed workers and the costs arising
from employment reductions--raise the larger debate on the net benefits of minimum wage
policies discussed extensively elsewhere (e.g. Card and Krueger 1995).
Using supply chain dynamics as a regulatory lever has a number of implications beyond
its direct use by the WHD in the domestic apparel market. Supply chains link the U.S. retail
market with international sources of apparel production, thereby providing potential analogs for
those considering international labor standards regulation (Elliott and Freeman 2003; Sabel,
O’Rourke, and Fung 2000). Monitoring is an important component of many of the international
labor standards systems currently in place (for example the Fair Labor Association’s
arrangement for monitoring apparel companies). Many of those systems have been criticized for
their inability to induce changes in supplier behavior. The domestic monitoring system studied
here demonstrates the critical role played by embargo authority created by the FLSA in making
such a private system of monitoring effective.
Retail restructuring and the growing compression of time in supply chain relations
characterizes a growing set of industries, from food to computers to home building supplies. At
the same time (and in some cases related to the diffusion of information technologies) many
companies are spinning off parts of their production process and ceding them to networks of
contractors and subcontractors. This trend is well known in the manufacturing sector, for
example the spinning off of suppliers formerly owned by the major car companies. Creation of
multiple layers of subcontracting relationships has also become common in service sectors, from
the health care industry to the provision of janitorial services in commercial building.
26 Yaniv’s model of minimum wage compliance (2001) suggests a more complicated picture in regard to the relation
Version: May 2004 25
Understanding developments in industry supply chains in this way may provide new
opportunities to use private incentives to achieve public ends. Establishing where these
dynamics are occurring across different industries and harnessing them to serve public policy
objectives therefore may prove a fertile means for achieving public purposes in a wide variety of
regulatory arenas.
of compliance and employment levels.
Version: May 2004 26
References
Abernathy, Frederick, John T. Dunlop, Janice H. Hammond, David Weil. 1999. A Stitch
In Time: Lean Retailing and the Transformation of Manufacturing—Lessons from the Apparel
and Textile Industries. (New York: Oxford University Press).
Ashenfelter, Orley and Robert Smith. 1979. “Compliance with the Minimum Wage
Law.” Journal of Political Economy, v. 87, no. 2, pp. 333-350.
Card, David and Alan Krueger. 1995. Myth and Measurement: The New Economics of
the Minimum Wage. (Princeton, NJ: Princeton University Press).
Chang, Yang-Ming and Isaac Erlich. 1985. “On the Economics of Compliance with the
Minimum Wage Law.” Journal of Political Economy, v. 93, no. 1, pp. 84-91.
Commons, John R. and John Andrews. 1936. Principles of Labor Legislation. Fourth
edition. (New York: Augustus Kelley—Reprint of Economic Classics).
Elliot, Kimberly and Richard Freeman. 2003. Can Labor Standards Improve Under
Globalization? (Washington, D.C.: Institute for International Economics).
Grenier, Gilles. 1982. “On Compliance with the Minimum Wage Law.” Journal of
Political Economy, v. 90, no. 1, pp. 184-187.
Industrial Commission on Immigration and Education. 1901. Reports of the Industrial
Commission on Immigration and Education. Washington, D.C.: Government Printing Office,
Volume XV.
Kwong, Peter. 1997. Forbidden Workers: Illegal Chinese Immigrants and American
Labor. New York: The New Press.
Polinsky, Mitchell and Steve Shavell. 2000. “The Economic Theory of Public
Enforcement of Law.” Journal of Economic Literature, v.39, no.1, pp. 45-76.
Version: May 2004 27
Sabel, Charles, Dara O’Rourke, and Archon Fung. 2000. “Ratcheting Labor Standards.”
Social Protection Paper 11. Washington, D.C.: World Bank.
Stigler, George. 1970. “The Optimum Enforcement of Laws.” Journal of Political
Economy, v.78, no.3, pp. 526-536.
U.S. Department of Labor. 1998. “Protecting America’s Garment Workers: A
Monitoring Guide.” Washington, D.C.: Department of Labor. October.
U.S. Department of Labor. 1999a. “1999 New York City Garment Compliance Survey
Fact Sheet.” October.
U.S. Department of Labor. 1999b. “NO SWEAT Strategy.” Washington, D.C.:
Department of Labor, June.
Wage and Hour Division. 1998. “Full ‘Hot Goods’ Compliance Program Agreements.”
Form FCPA(AB).CP1. Washington, D.C.: Department of Labor.
Wage and Hour Division. 1999. “Garment Enforcement Report.” Quarterly reports,
1996-1999.
Wage and Hour Division. 2001. 1999-2000 Report on Initiatives. Washington, D.C.:
Department of Labor, February.
Weil, David. 2002. “Regulating Compliance with Labor Standards: New Tools for an Old
Problem.” Challenge. v. 45, no.1, pp.47-74.
Yaniv, Gideon. 2001. “Minimum Wage Noncompliance and the Employment
Decision.” Journal of Labor Economics, v. 19, no.3, pp. 596-603.
Ziff, Laura and John Trattner. 1999. “Shutting Down Sweatshops.” in Donahue, John,
ed. Making Washington Work: Tales of Innovation in the Federal Government. Washington,
D.C.: Council for Excellence in Government / Brookings Institution Press, pp. 47-58.
Version: May 2004 28
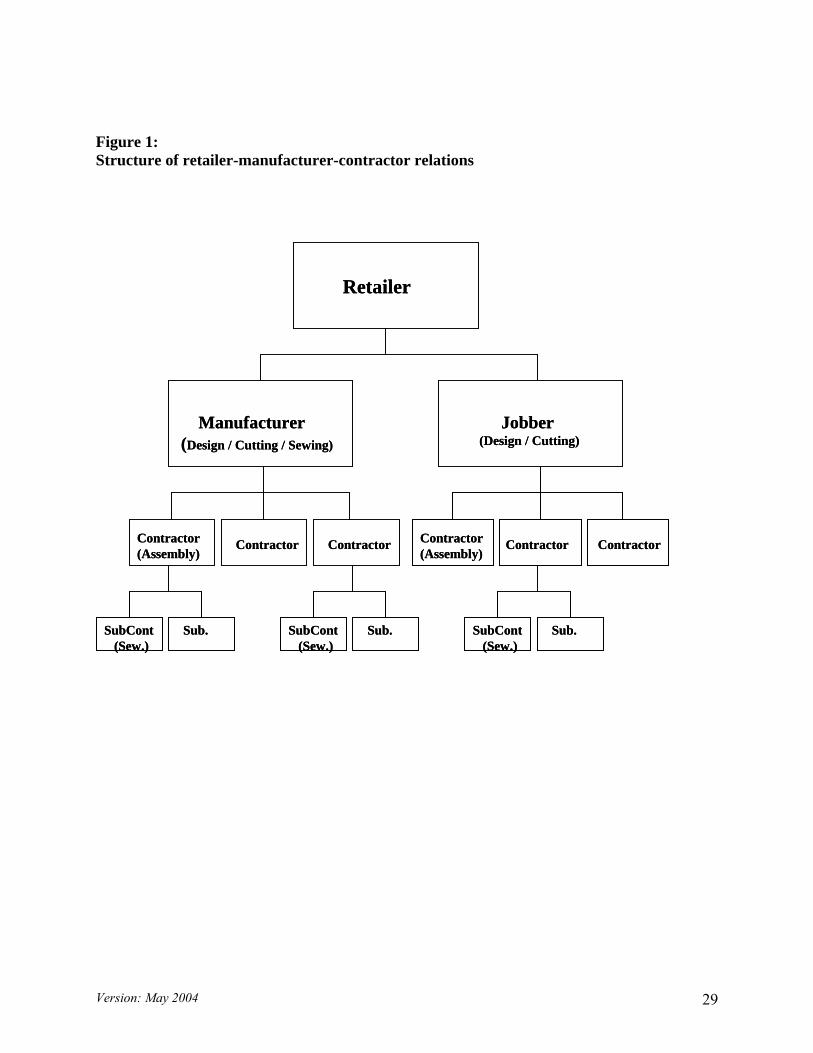
Figure 1: Structure of retailer-manufacturer-contractor relations
Retailer
Jobber(Design / Cutting)
Manufacturer(Design / Cutting / Sewing)
Contractor(Assembly)
Contractor Contractor Contractor Contractor
Sub.SubCont(Sew.)
Sub. Sub.
Contractor(Assembly)
SubCont(Sew.)
SubCont(Sew.)
Retailer
Jobber(Design / Cutting)
Manufacturer(Design / Cutting / Sewing)
Contractor(Assembly)
Contractor Contractor Contractor Contractor
Sub.SubCont(Sew.)
Sub. Sub.
Contractor(Assembly)
SubCont(Sew.)
SubCont(Sew.)
Version: May 2004 29
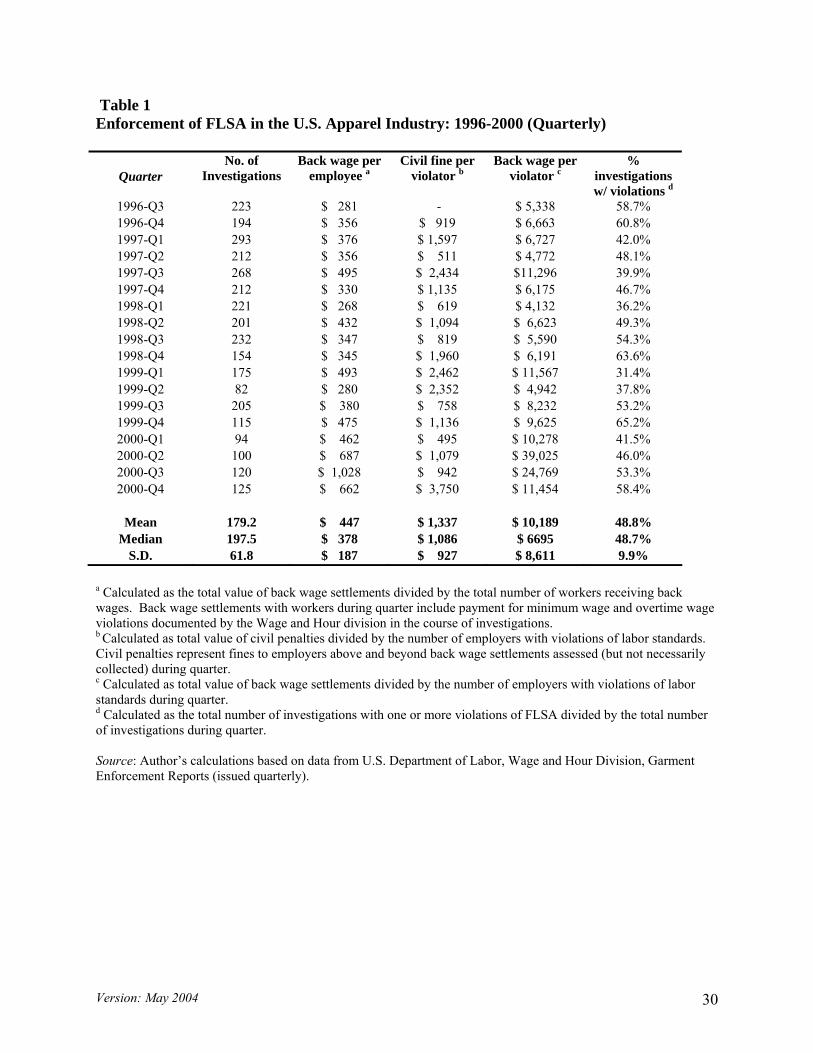
Table 1 Enforcement of FLSA in the U.S. Apparel Industry: 1996-2000 (Quarterly)
Quarter No. of
Investigations Back wage per
employee aCivil fine per
violator bBack wage per
violator c%
investigations w/ violations d
1996-Q3 223 $ 281 - $ 5,338 58.7% 1996-Q4 194 $ 356 $ 919 $ 6,663 60.8% 1997-Q1 293 $ 376 $ 1,597 $ 6,727 42.0% 1997-Q2 212 $ 356 $ 511 $ 4,772 48.1% 1997-Q3 268 $ 495 $ 2,434 $11,296 39.9% 1997-Q4 212 $ 330 $ 1,135 $ 6,175 46.7% 1998-Q1 221 $ 268 $ 619 $ 4,132 36.2% 1998-Q2 201 $ 432 $ 1,094 $ 6,623 49.3% 1998-Q3 232 $ 347 $ 819 $ 5,590 54.3% 1998-Q4 154 $ 345 $ 1,960 $ 6,191 63.6% 1999-Q1 175 $ 493 $ 2,462 $ 11,567 31.4% 1999-Q2 82 $ 280 $ 2,352 $ 4,942 37.8% 1999-Q3 205 $ 380 $ 758 $ 8,232 53.2% 1999-Q4 115 $ 475 $ 1,136 $ 9,625 65.2% 2000-Q1 94 $ 462 $ 495 $ 10,278 41.5% 2000-Q2 100 $ 687 $ 1,079 $ 39,025 46.0% 2000-Q3 120 $ 1,028 $ 942 $ 24,769 53.3% 2000-Q4 125 $ 662 $ 3,750 $ 11,454 58.4%
Mean 179.2 $ 447 $ 1,337 $ 10,189 48.8%
Median 197.5 $ 378 $ 1,086 $ 6695 48.7% S.D. 61.8 $ 187 $ 927 $ 8,611 9.9%
a Calculated as the total value of back wage settlements divided by the total number of workers receiving back wages. Back wage settlements with workers during quarter include payment for minimum wage and overtime wage violations documented by the Wage and Hour division in the course of investigations. b Calculated as total value of civil penalties divided by the number of employers with violations of labor standards. Civil penalties represent fines to employers above and beyond back wage settlements assessed (but not necessarily collected) during quarter. c Calculated as total value of back wage settlements divided by the number of employers with violations of labor standards during quarter. d Calculated as the total number of investigations with one or more violations of FLSA divided by the total number of investigations during quarter. Source: Author’s calculations based on data from U.S. Department of Labor, Wage and Hour Division, Garment Enforcement Reports (issued quarterly).
Version: May 2004 30
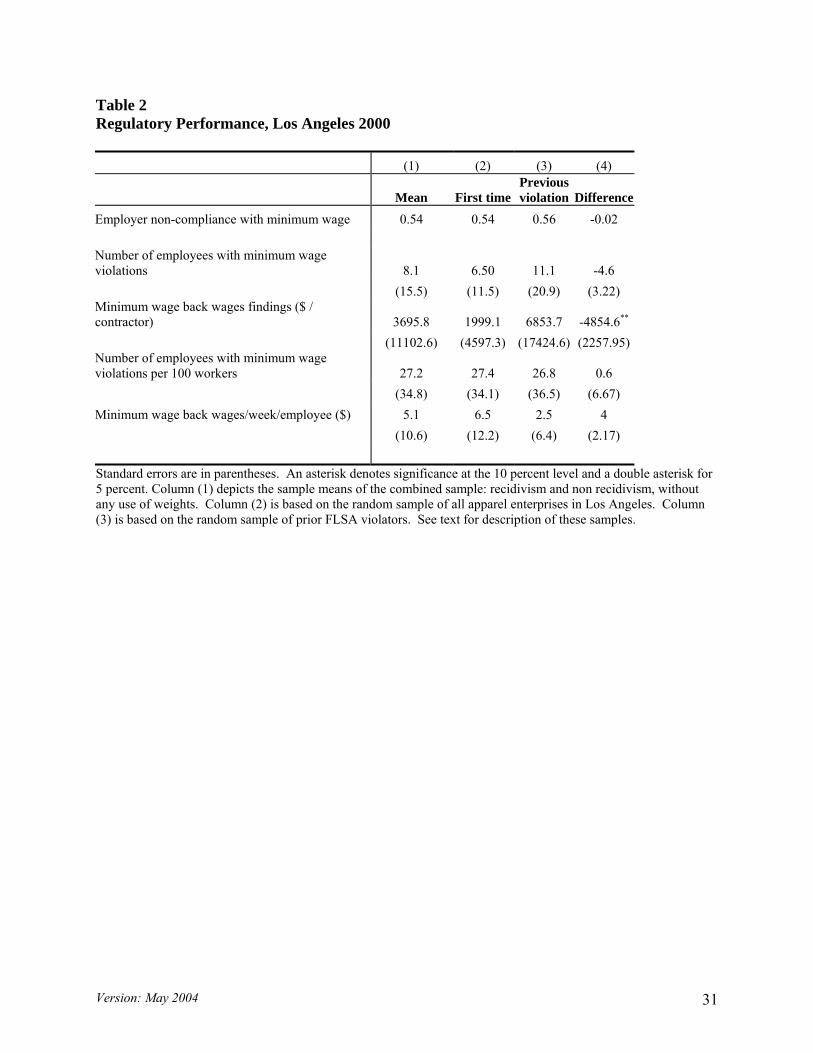
Table 2 Regulatory Performance, Los Angeles 2000 (1) (2) (3) (4)
Mean First timePrevious violation Difference
Employer non-compliance with minimum wage 0.54 0.54 0.56 -0.02 Number of employees with minimum wage violations 8.1 6.50 11.1 -4.6 (15.5) (11.5) (20.9) (3.22) Minimum wage back wages findings ($ / contractor) 3695.8 1999.1 6853.7 -4854.6**
(11102.6) (4597.3) (17424.6) (2257.95) Number of employees with minimum wage violations per 100 workers 27.2 27.4 26.8 0.6 (34.8) (34.1) (36.5) (6.67) Minimum wage back wages/week/employee ($) 5.1 6.5 2.5 4 (10.6) (12.2) (6.4) (2.17) Standard errors are in parentheses. An asterisk denotes significance at the 10 percent level and a double asterisk for 5 percent. Column (1) depicts the sample means of the combined sample: recidivism and non recidivism, without any use of weights. Column (2) is based on the random sample of all apparel enterprises in Los Angeles. Column (3) is based on the random sample of prior FLSA violators. See text for description of these samples.
Version: May 2004 31
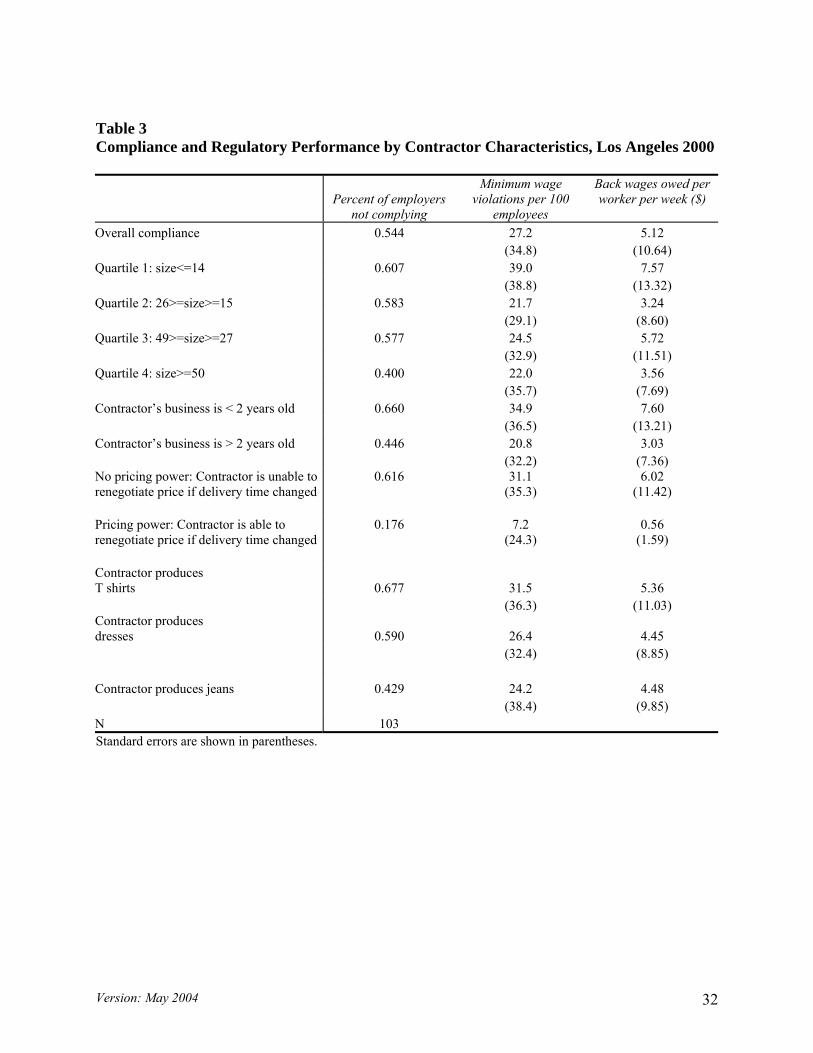
Table 3 Compliance and Regulatory Performance by Contractor Characteristics, Los Angeles 2000
Percent of employers
not complying
Minimum wage violations per 100
employees
Back wages owed per worker per week ($)
Overall compliance 0.544 27.2 5.12 (34.8) (10.64) Quartile 1: size<=14 0.607 39.0 7.57 (38.8) (13.32) Quartile 2: 26>=size>=15 0.583 21.7 3.24 (29.1) (8.60) Quartile 3: 49>=size>=27 0.577 24.5 5.72 (32.9) (11.51) Quartile 4: size>=50 0.400 22.0 3.56 (35.7) (7.69) Contractor’s business is < 2 years old 0.660 34.9 7.60 (36.5) (13.21) Contractor’s business is > 2 years old 0.446 20.8 3.03 (32.2) (7.36) No pricing power: Contractor is unable to renegotiate price if delivery time changed
0.616
31.1 (35.3)
6.02 (11.42)
Pricing power: Contractor is able to renegotiate price if delivery time changed
0.176
7.2 (24.3)
0.56 (1.59)
Contractor produces T shirts 0.677 31.5 5.36 (36.3) (11.03) Contractor produces dresses 0.590 26.4 4.45 (32.4) (8.85) Contractor produces jeans 0.429 24.2 4.48 (38.4) (9.85) N 103 Standard errors are shown in parentheses.
Version: May 2004 32
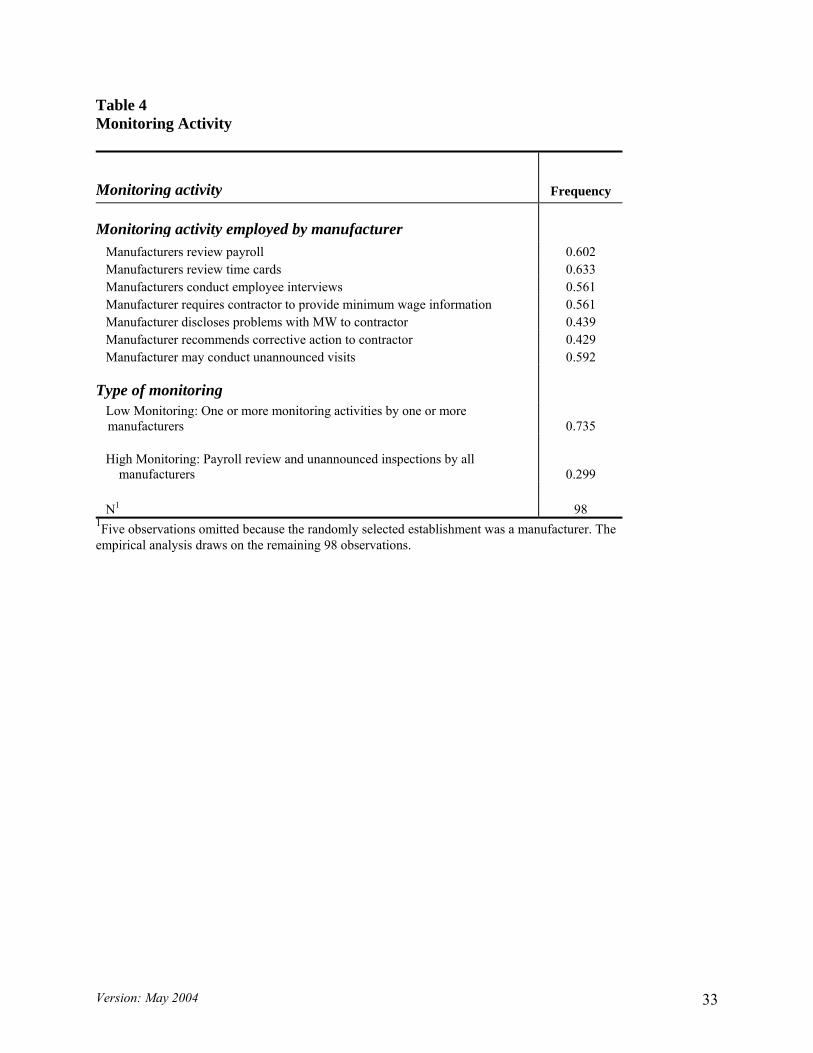
Table 4 Monitoring Activity
Monitoring activity Frequency
Monitoring activity employed by manufacturer Manufacturers review payroll 0.602 Manufacturers review time cards 0.633 Manufacturers conduct employee interviews 0.561 Manufacturer requires contractor to provide minimum wage information 0.561 Manufacturer discloses problems with MW to contractor 0.439 Manufacturer recommends corrective action to contractor 0.429 Manufacturer may conduct unannounced visits 0.592
Type of monitoring Low Monitoring: One or more monitoring activities by one or more
manufacturers 0.735 High Monitoring: Payroll review and unannounced inspections by all
manufacturers 0.299 N1 98 1Five observations omitted because the randomly selected establishment was a manufacturer. The empirical analysis draws on the remaining 98 observations.
Version: May 2004 33
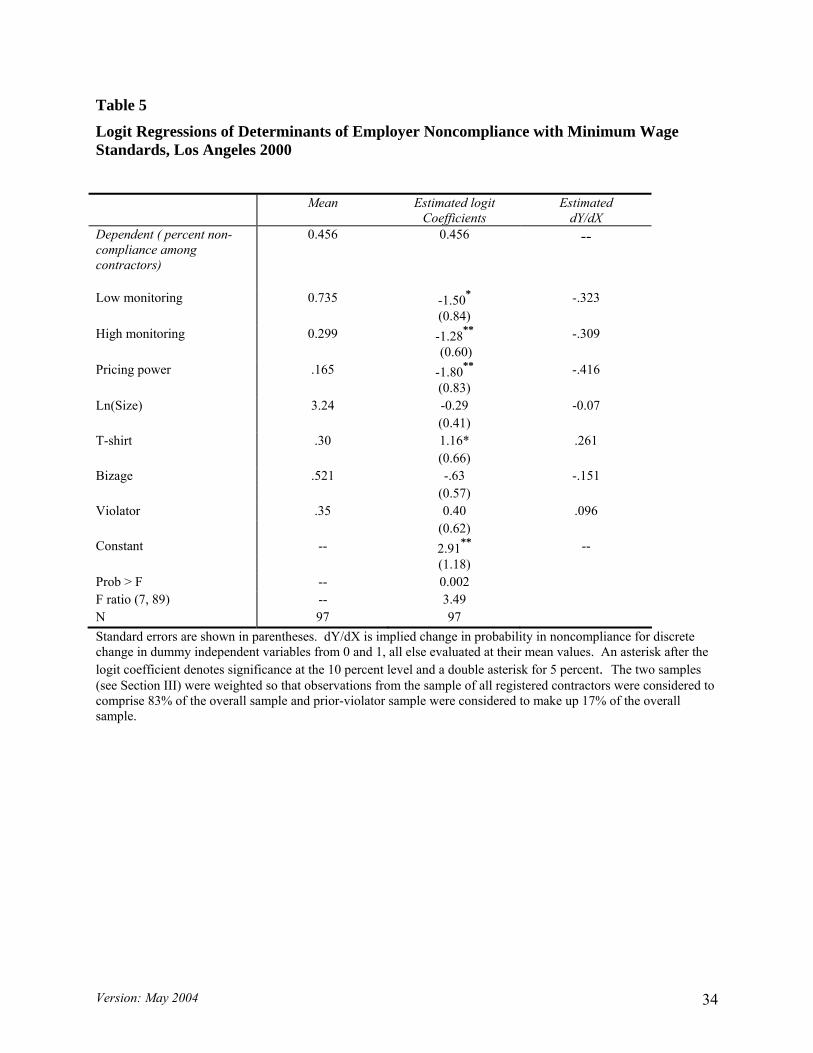
Table 5
Logit Regressions of Determinants of Employer Noncompliance with Minimum Wage Standards, Los Angeles 2000 Mean Estimated logit
Coefficients Estimated
dY/dX Dependent ( percent non-compliance among contractors)
0.456 0.456 --
Low monitoring 0.735 -1.50* -.323 (0.84) High monitoring 0.299 -1.28** -.309 (0.60) Pricing power .165 -1.80** -.416 (0.83) Ln(Size) 3.24 -0.29 -0.07 (0.41) T-shirt .30 1.16* .261 (0.66) Bizage .521 -.63 -.151 (0.57) Violator .35 0.40 .096 (0.62) Constant -- 2.91** -- (1.18) Prob > F -- 0.002 F ratio (7, 89) -- 3.49 N 97 97 Standard errors are shown in parentheses. dY/dX is implied change in probability in noncompliance for discrete change in dummy independent variables from 0 and 1, all else evaluated at their mean values. An asterisk after the logit coefficient denotes significance at the 10 percent level and a double asterisk for 5 percent. The two samples (see Section III) were weighted so that observations from the sample of all registered contractors were considered to comprise 83% of the overall sample and prior-violator sample were considered to make up 17% of the overall sample.
Version: May 2004 34
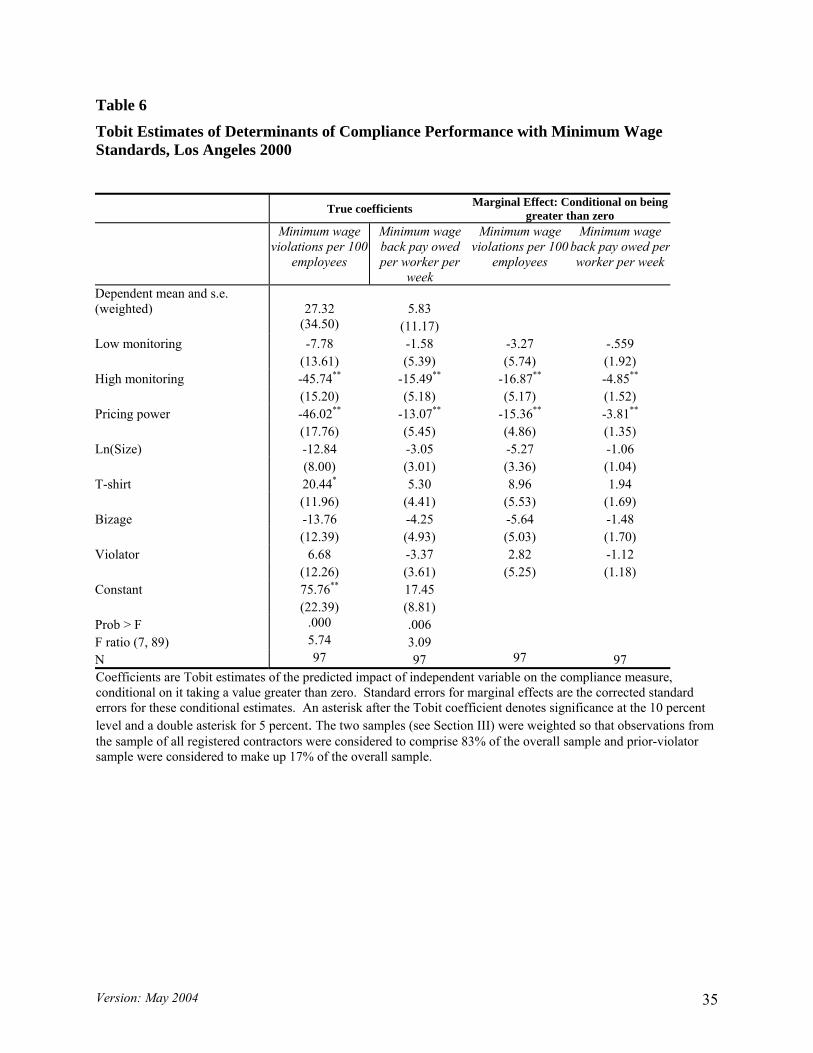
Table 6
Tobit Estimates of Determinants of Compliance Performance with Minimum Wage Standards, Los Angeles 2000
True coefficients Marginal Effect: Conditional on being greater than zero
Minimum wage violations per 100
employees
Minimum wage back pay owed per worker per
week
Minimum wage violations per 100
employees
Minimum wage back pay owed per worker per week
Dependent mean and s.e. (weighted)
27.32 5.83
(34.50) (11.17) Low monitoring -7.78 -1.58 -3.27 -.559 (13.61) (5.39) (5.74) (1.92) High monitoring -45.74** -15.49** -16.87** -4.85**
(15.20) (5.18) (5.17) (1.52) Pricing power -46.02** -13.07** -15.36** -3.81**
(17.76) (5.45) (4.86) (1.35) Ln(Size) -12.84 -3.05 -5.27 -1.06 (8.00) (3.01) (3.36) (1.04) T-shirt 20.44* 5.30 8.96 1.94 (11.96) (4.41) (5.53) (1.69) Bizage -13.76 -4.25 -5.64 -1.48 (12.39) (4.93) (5.03) (1.70) Violator 6.68 -3.37 2.82 -1.12 (12.26) (3.61) (5.25) (1.18) Constant 75.76** 17.45 (22.39) (8.81) Prob > F .000 .006 F ratio (7, 89) 5.74 3.09 N 97 97 97 97 Coefficients are Tobit estimates of the predicted impact of independent variable on the compliance measure, conditional on it taking a value greater than zero. Standard errors for marginal effects are the corrected standard errors for these conditional estimates. An asterisk after the Tobit coefficient denotes significance at the 10 percent level and a double asterisk for 5 percent. The two samples (see Section III) were weighted so that observations from the sample of all registered contractors were considered to comprise 83% of the overall sample and prior-violator sample were considered to make up 17% of the overall sample.
Version: May 2004 35
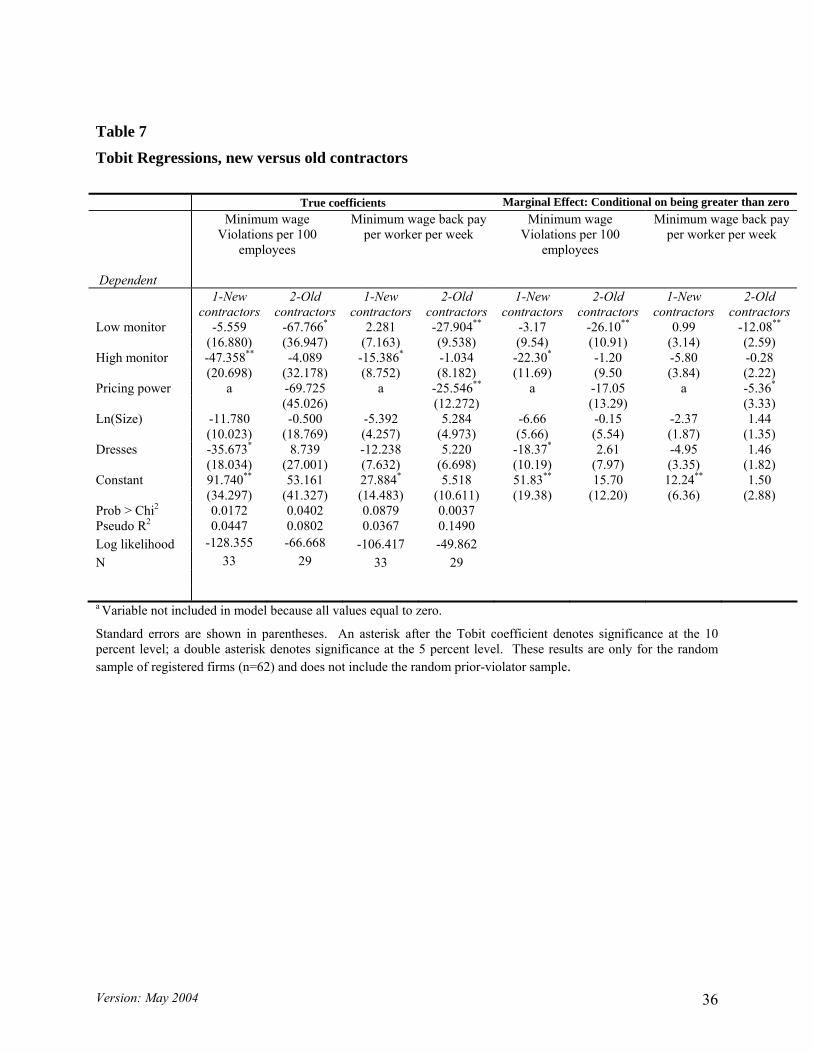
Table 7
Tobit Regressions, new versus old contractors True coefficients Marginal Effect: Conditional on being greater than zero
Dependent
Minimum wage Violations per 100
employees
Minimum wage back pay per worker per week
Minimum wage Violations per 100
employees
Minimum wage back pay per worker per week
1-New
contractors 2-Old
contractors 1-New
contractors 2-Old
contractors 1-New
contractors 2-Old
contractors 1-New
contractors 2-Old
contractors Low monitor -5.559 -67.766* 2.281 -27.904** -3.17 -26.10** 0.99 -12.08**
(16.880) (36.947) (7.163) (9.538) (9.54) (10.91) (3.14) (2.59) High monitor -47.358** -4.089 -15.386* -1.034 -22.30* -1.20 -5.80 -0.28 (20.698) (32.178) (8.752) (8.182) (11.69) (9.50 (3.84) (2.22) Pricing power a -69.725 a -25.546** a -17.05 a -5.36*
(45.026) (12.272) (13.29) (3.33) Ln(Size) -11.780 -0.500 -5.392 5.284 -6.66 -0.15 -2.37 1.44 (10.023) (18.769) (4.257) (4.973) (5.66) (5.54) (1.87) (1.35) Dresses -35.673* 8.739 -12.238 5.220 -18.37* 2.61 -4.95 1.46 (18.034) (27.001) (7.632) (6.698) (10.19) (7.97) (3.35) (1.82) Constant 91.740** 53.161 27.884* 5.518 51.83** 15.70 12.24** 1.50 (34.297) (41.327) (14.483) (10.611) (19.38) (12.20) (6.36) (2.88) Prob > Chi2 0.0172 0.0402 0.0879 0.0037 Pseudo R2 0.0447 0.0802 0.0367 0.1490 Log likelihood -128.355 -66.668 -106.417 -49.862 N 33 29 33 29 a Variable not included in model because all values equal to zero.
Standard errors are shown in parentheses. An asterisk after the Tobit coefficient denotes significance at the 10 percent level; a double asterisk denotes significance at the 5 percent level. These results are only for the random sample of registered firms (n=62) and does not include the random prior-violator sample.
Version: May 2004 36
Recommended