INFORMATION TO USERS
This manuscript has been rePfOduced from the microfilm master. UMI films
the text directly from the original or copy subrnitted. Thus. some thesis and
dissertation copies are in typewriter face, while others may be from any type cf
computer printer.
The quailly of thls Nproductlon la dependent upon the quality of the
copy IUbmitted. Broken or indistinct print. coIored or poor quality illustrations
and photographs, print bleedthrough. substandard margins. and improper
alignment can adversely affect reproduction.
ln the unlikely event that the author dicl not send UMI a complete manuscript
and there are missing pages. the.. will be noted. AllO, if unauthorized
copyright material had to be removed. a note will indicate the deletion.
Oversize materials (e.g., maps, drawings, chans) are reproduced by
S8Ctioning the original. begiMing al the upper Ieft-hand corner and continuing
from 18ft ta right in equal sections with small overtaps.
Photographs included in the original manuscript have been reproduced
xerographically in thil copy. Higher quality 8- x 9" black and white
photographie ponts are available for any photographs or illustrations appearing
in this copy for an additional charge. Contact UMI directly to arder.
Bell & Howell Information and Luming300 North Z8eb ROIId. AnnArbor. MI 481(&1348 USA
800-521-0800


'.
DEVELOPMENT AND APPLICATION OFNOVEL NMR TECHNIQUES FOR THE
STUDY OF LIGNIN
by
Behzad c. Abvazi
A thesis submitted to the Faculty of Graduate Studies and Researcbin partial fultilment of the requirements for the degree of Doctor of
Philosophy
Department of ChemistryMcGill University
Montréal, Québec, Canada
April 1998
<CBehzad C. Abvazi, 1998

1.1 National Libraryof Canada
Acquisitions andBibliographie services
395 Wellington StreetOttawa ON K1A 0N4canada
Bibliothèque nationaledu Canada
Acquisitions etservices bibliographiques
395. rue WellingtonOttawa ON K1A 0N4canada
The author bas granted a 000
exclusive licence allowing theNational Library of Canada toreproduce, 1030, distribute or sellcopies ofthis thesis in microform,paper or electronic formats.
The author retains ownership of thecopyright in this thesis. Neither thethes'is oor substantial extracts from itmay be printed or otherwisereproduced without the author'spemusslon.
L'auteur a accordé une ücence nonexclusive permettant à laBibliothèque nationale du Canada dereproduke,prête~msbibuerou
vendre des copies de cette thèse sousla forme de microfiche/film, dereproduction sur papier ou sur fonnatélectronique.
L'auteur conserve la propriété dudroit d'auteur qui protège cette thèse.Ni la thèse ni des extraits substantielsde celle-ci ne doivent être imprimésou autrement reproduits sans sonautorisation.
0-612-44342-6
Canadrt

•
•
The essential is10 meel the challenge
Primo Levi
Dedicated to my wonder/lIlfamily

•
•
ABSTRACT
Solid-state and solution NMR techniques were used in order to study the
transformation of various functional groups present in lignin and cellulose when wood
is exposed to a wide range of pH's and pulping reagents.
Solid-state proton spin-Iattice relaxation times (Tnd allowed the determination of
the molecular mobilities of carbohydrates and Iignin as a funCtioD of pH for black spruce
softwood. Similar measurements on isolated cellulose and cuoxam lignin were also
conducted. These studies showed that the mobilities of the polymerie eonstituents of
wood are affected by ionization processes occurring on the various functional groups
present in Iignin and cellulose.
Quantitative 31p NMR spectroscopy was also used to derive the fondamental
thermodynamic parameters that are involved in the stereoselective degradation of the two
diastereomeric fonns of the Most abundant structural (arylglycerol-l3-aryl ether) uoits of
Iignin under kraft pulping conditions. It was shown that the erythro isomers of the
arylglycerol-l3-aryl ether units in softwood milled wood Iignin eleave faster tban their
threo counterparts. The general stability of the threo diastereomers toward kraft pulping
seems to he the manifestation of a considerably slower reaction of the pulping reagents
with the threo diastereomers ofarylglycerol-p-aryl ethers. Quantitative 31p NMR was also
used for the identification and quantification of accumulated condensed diphenylmethane
(DPM) moieties during conventional kraft, extended modified continuous cooking
(EMCCj and soda pulping processes.
A novel method that permits the quantitative detection and classification ofvarious
carbonyls in lignin was also developed. The ~roposed selective fluoride-induced
trifluoromethylation method. was optimized for a series of carbonyl-containing lignin-like
model compounds. This was followed by 19f NMR spectral analyses of the resulting
fluorine derivatives allowing for thorough understanding of their structure/ l 9p NMR
chemical shift relationships. Our studies demonstrated that the proposed method is a new
analytical tool for the classification and quantification of various carbonyl groups that
may he present in soluble lignins.
i

•
•
Des techniques RMN d'analyse à l'état solide et liquide ont été utilisées pour
étudier la transformation de divers groupements fonctionnels présents dans la lignine et
la cellulose lorsque le bois est exposé à divers degrés de pH et à divers réactifs pour la
cuisson.
Des temps de relaxation spin·milieu de protons à l'état solide (T1ft> ont permis de
détenniner les mobilités moléculaires des hydrates de carbone et de la lignine en tant que
fonction du pH pour l'épinette noire. Des mesures similaires ont aussi été effectuées sur
de la lignine de cuoxam et de cellulose isolées. Ces études ont démontré que les
processus d'ionisation survenant avec les divers groupements fonctionnels présents dans
la lignine et la cellulose avaient un effet sur les mobilités des composants polymériques
du bois.
La spectroscopie quantitative RMN 31p a aussi été utilisée pour déterminer les
paramètres thermodynamiques fondamentaux impliqués dans la dégradation
stéréosélective des deux formes diasteréomériques des unités structurales (éther
arylglycérol·lj-aryle) de lignine les plus abondantes dans des conditions de mise en pâte
kraft. Il a été démontré que les isomères érythro des unités d'éther arylglycérol-p-aryle
dans la lignine de bois de résineux broyé se clivent plus rapidement que les thréo. La
stabilité générale des diastéréomères thréo lors de la mise en pâte kraft semble être la
manifestation d'une réaction considérablement plus lente des réactifs dans la pâte avec
les diastéréomères thréo des éthers arylglycérol-Ij-aryle. La RMN 31p quantitative a aussi
été utilisée pour identifier et quantifier les groupes de diphénylméthane (DPM) condensés
accumulés lors de la mise en pâte kraft, la cuisson en continu modifiée prolongée
(EMCCj, et la mise en pâte à la soude.
Une nouvelle méthode permettant la détection quantitative et la classification de
divers carbonyles dans la lignine a aussi été mise au point. La méthode de la
tritluorométhylation sélective provoquée par du fluor a été optimisée pour une série de
composés modèles de type lignine contenant des carbonyles. Cette analyse a été suivie
d'analyses spectrales RMN 19p des dérivés de fluor apparus, ce qui a permis de bien
comprendre les relations entre leur structure et le déplacement chimique en RMN 19p•
ii

•
•
Nos études ont démontré que la méthode proposée est un nouvel outil d'analyse pour la
classification et la quantification de divers groupes carbonyles qui pourraient être présents
dans les lignines solubles.
üi

FOREWARD
This thesis was prepared in a manuscript-based structure, as described in section
3 of the McGill University, Faculty of Graduate Studies and Research Guidelines for
Thesis Preparation, September 1994 revision. This section states:
Candidates have the option of including, as pan of the thesis, the text of apaper(s) submitted or to he submitted for publication. or the c1earlyduplicated text of a published paper(s). These text must he hound as anintegral pan of the thesis.
If this option is chosen, connecting texts that provide logical bridgesbetween the different papers are mandatory. The thesis must he written insuch a way that is more than a mere collection of manuscripts; in otherwords, results of a series of papers must he integrated.
The thesis must still confonn to ail other requirements of the "Guidelines forThesis Preparation" . The thesis must include: A Table of Contents, anabstract in English and French, an introduction which clearly states therationale and objectives of the study, a comprehensive review of theliterature, a final conclusion and summary, and a thorough bibliography orreference Iist.
Additional materia! must he provided where appropriate (e.g. in appendices)and in sufficient detail to allow a clear and precise judgement to he made ofthe imponance and originality of the research reported in the thesis.
In the case of manuscripts co-authored by the candidate and others, tbecandidate is required to make an expUcit statement in the tbesis as to whocontributed to suth work and to wbat extent. Supervisors must attest to theaccuracy of such statements at the doctoral oral defence. Since the task of theexaminers is made more difficult in tbese cases, it is in the candidate'sinterest to malee perfectly clear the responsibilities of ail the authors of theco-authored papen. Under no circumstances cau a co-autbor of anycomponent of 5uch a tbesis sene as an examiner for tbat tbesis.
This dissertation is presented in six chapters. Chapter 1 is a general introduction
to the chemistry of lignin and its structural elucidation by application of NMR
spectroscopy other than the investigation reponed berein. The intervening chapters
present the principle results of the research conducted. Each bas been written in a paper
iv
•format, with an abstract, an introduction to the specifie field discussed in the chapter, an
experimental section, results and discussion, conclusions, acknowledgements when
appropriate, and references. Tables and figures have been interleaved as near as possible
to their mention in the text, mostly on separate pages.
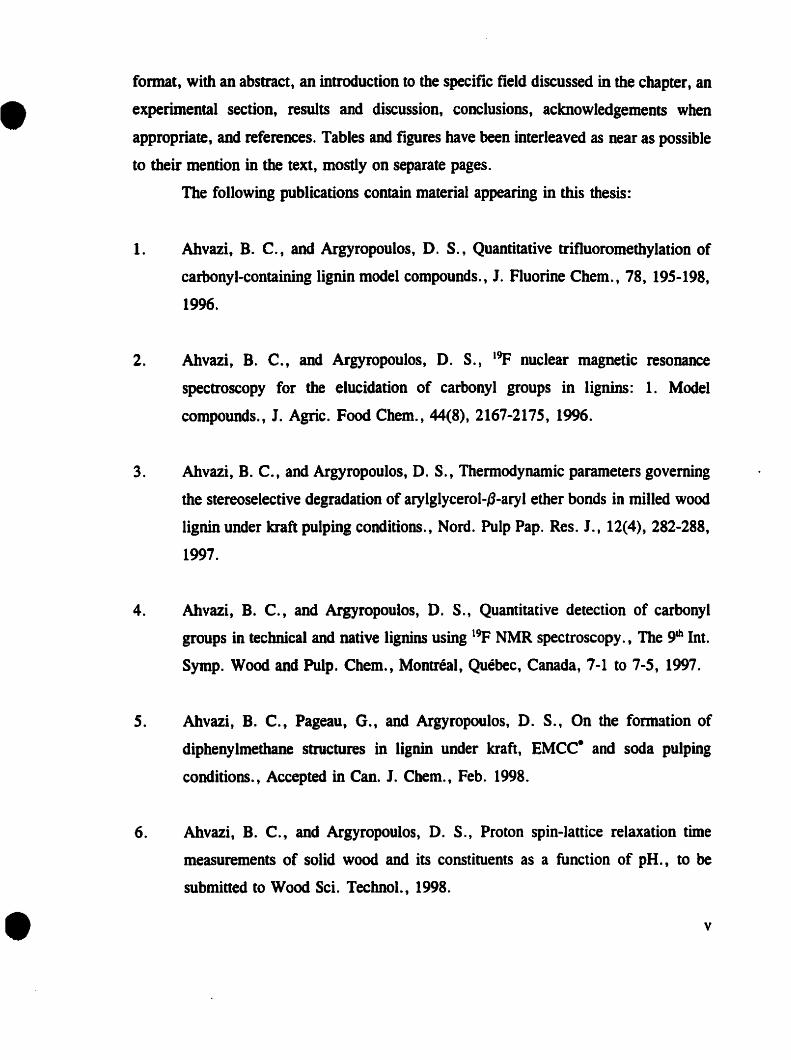
The following publications contain material appearing in this thesis:
•
1.
2.
3.
4.
5.
6.
Ahvazi, B. C., and Argyropoulos, D. S., Quantitative trifluoromethylation of
carbonyl-containing lignin model compounds., J. Fluorine Chem., 78, 195-198,
1996.
Ahvazi, B. C., and Argyropoulos, D. S., 19p nuclear magnetic resonance
spectroscopy for the elucidation of carbonyl groups in lignins: 1. Model
compounds., J. Agric. Food Chem., 44(8), 2167-2175, 1996.
Ahvazi, B. C., and Argyropoulos, D. S., Thermodynamic parameters governing
the stereoselective degradation of arylglycerol-l3-aryl ether bonds in milled wood
lignin under kraft pulping conditions., Nord. Pulp Pap. Res. J., 12(4), 282-288,
1997.
Ahvazi, B. C., and Argyropoulos, D. S., Quantitative detection of carbonyl
groups in technical and native lignins using 19p NMR spectroscopy., The 9th Int.
Symp. Wood and Pulp. Chem., Montréal, Québec, Canada, 7-1 to 7-5, 1997.
Ahvazi, B. C., Pageau, G., and Argyropoulos, D. S., On the formation of
diphenyimethane structures in lignin under kraft, EMCC· and soda pulping
conditions., Accepted in Cano J. Chem., Feb. 1998.
Ahvazi, B. C., and Argyropoulos, D. S., Proton spin-lattice relaxation time
measurements of saUd wood and its constituents as a function of pH., ta he
submitted ta Wood Sei. Technol., 1998.
v

7. Ahvazi, B. C., Crestini, C., and Argyropoulos, D. S., 19p nuclear magnetic
resonance spectroscopy for the quantitative detection and classification ofcarbonyl
groups in lignins., to he submitted to J. Agric. Food Chem.• 1998.
CONTRIBUTIONS OF AUTHORS
Each of the above publications was written by the author of this dissertation under
the supervision of Dr. D. S. Argyropoulos; the only exception being publication #7. The
latter publication was written jointly with Dr. C. Crestini (visiting Postdoctoral Fellow)
and adapted for inclusion in this thesis. The contribution of Dr. D. S. Argyropoulos to
this thesis beyond the conception of the original objectives and the major experimental
routes to he applied, included continuous guidance and in depth discussions on problems
encountered. The contribution of Dr. Crestini to this effon was carrying out the 20
NMR spectra of Figure 6.7 and the selective Dakin and hydrosulphite reactions. The
contribution of Mr. G. Pageau in publication #S was in developing a sampling protocol
under real industrial conditions.
The material in Chapter 2 is to be submined as publication #6; Dr. F. Morin
contributed sorne of the T1H measurements reponed in this chapter. Chapters 3 and 4
have been published as publications #3 and #5, respectively. Chapter 5 is an expanded
version of publications #1 and #2. Key results from Chapter 6 were reponed in
publication #4, with complete results to he submitted as publication #7.
vi
•
•
ACKNOWLEDGEMENTS
1 would like to express my deepest gratitude towards my thesis supervisor, Dr.
D. S. Argyropoulos, for the immeasurable interest and numerous invaluable comments
he contributed to this work. His enthusiasm, devotion to scientific inquiry and
professional and personal generosity have ail been inspiring. [t bas been a great pleasure
to leam from a true E1rLO'njIJ.W". 1 would also like to thank him for accommodating my
often unusual working schedule.
1 would like to extend my appreciation to ail those professors in the depanment
of Chemistry, Pulp and Paper Research Centre and PAPRICAN from whom [ gained the
knowledge and background to carry out this research. [n particular, Dr. C. Langford, my
fust academic supervisor for showing me the "way", Dr. D. F. R. Gilson, Dr. L.
Reven, and specially Dr. F. Morin and Dr. F. Sounal for their patience and great
kindness in teaching me the concept and the operation of bath soUd and solution NMR
spectrometers. Thanks are also due to Dr. R. Brown, Dr. D. Patterson, Dr. A.
Eisenberg, Dr. T. G. M. van de Ven, Dr. R. H. Marchessault and Dr. D. G. Gray. 1
also wish to thanle Dr. R. St. John Manley and Dr. C. Heitner. [t has been a privilege
to work, and learn among people who are, not ooly knowledgable in their respective
field, but also enjoy their work and the company of their colleagues. Thank you for
making these years happy and memorable ones.
Thanks are also due to ail my colleagues, co-workers and group members for
their helpful and valuable discussions. Special thanks are expressed to both technical
specialists Mr. G. Suranyi and Mrv Y. J. Sun for providing MOSt of the lignins and also
for their continuous encouragement during the course of this research. 1am very greatful
to Mr. P. Halevy and 1. De Souza for thier great friendship, and timeless assistance in
preparing this thesis.
1 would also like ta acknowledge my very special friends: Dr. G. Michalakis
(1/!ci'Àrqç), H. A. Kyriazopoulos, Dr. A. Spyros, Dr. C. M. P. Crestini, A. Taghizadeh,
S. Fardad, for their endless support, love and encouragement.
Finally, 1 would like to thank ail my wonderful family members: Dad and Mom
for their unconditional love. My brothers: Dr. Bijan Ahvazi, Dr. Behrouz Ahvazi, and
vii

•
•
Dr. Bahman Ahvazi for their guidance, and for their ability to inspire me through all the
tough times. Thanks to ail my lovely sisters, Mitra, Mina, Mehrnoosh and Lori Sohel
Ahvazi for their patience, and their everlasting love and support; even tbough 1 was a
. '"parn.....
This research was supported by the Canadian Pulp and Paper Industry and a
National Network Centres of Excellence Grant that was provided by the Natural Science
and Engineering Research Council (NSERC).
viii

TABLE OF CONTENTS
Page
ABSTRACT i
RÉSUMÉ ii
FOREWARD . . . . . . . . . . . . . . . . . . . . . . . . . . . . . iv
CONTRIBUTIONS OF AUTHORS . . . . . . . . . . . . . . . . . . . . . . . . . . . . . vi
ACKNOWLEDGEMENTS vii
UST Of TABLES xiv
LIST Of FIGURES . . . . . . . . . . . . . . . . . . . . . . . . . . . . . . . . . . . . . . xvii
LIST OF ABBREVIATIONS AND SYMBOLS xxi
Chapter 1: General Introduction
1.0. INTRODUCTION . . . . . . . . . . . . . . . . . . . . . . . . . . . . . . . . . . . .. 1
1.1. The MACROSCOPIC STRUCTURE of WOOD 1
1.1.1. The cell wall 31.1.2. Gymnosperm wood 41.1.3. Angiospenn wood . • . . . . . . . . . . . . . . . . . .. S
1.2. CHEMICAL COMPOSITION of WOOD 6
1.2.1. Extractives. . . . . . . . . . . . . . . . . . . . . . . . . . . . . . . . . . . . 71.2.2. Hemicelluloses . . . . . . . . . . . . . . . . . . . . . . . . . . . . . . . . . 71.2.3. Cellulose . . . . . . . . . . . . . . . . . . . . . . . . . . . . . . . . . . . . . 91.2.4. Lignin Il
1.3. NUCLEAR MAGNETIC RESONANCE SPECTROSCOPY 16
1.3.1. Solid State NMR Spectroscopy 16
1.3.2. Solution NMR Specuoscopy 18
ix
e
e.-
1.3.2.1. lB NMR Spectroscopy 181.3.2.2. 13e NMR Spectroscopy 201.3.2.3. 3
1p NMR Spectroscopy 241.3.2.4. Other NMR Spectroscopies 24
1.4. SCOPE and AIM of this THESIS 26
1.5. REFERENCES 28
Cbapter 2: Proton Spin-Lattice Relaxation Time Measurements ofSolid Wood andit's Constituents as a Function of pH
2.0. ABSTRACT : 38
2.1. INTRODUCTION 39
2.1.1. Effect of Moisture on Tl Parameters of Wood 422.1.2. Effect of Paramagnetic Metals on Tl Parameters of Wood 432.1.3. Effect of Static Magnetic Field 00 Tl Parameters of Wood 432.1.4. Effect of Temperature on Tl Parameters of Wood 44
2.2. EXPERIMENTAL 45
2.2.1. Materials and Methods 45
2.2.1.1. Preparation 452.2.1.2. Reactions 462.2.1.3. Instrumentation . . . . . . . . . .. . . 47
2.3. RESULTS and DISCUSSION 49
2.3.1. Cellulose (Q90) 542.3.2. Cuoxam Lignin 582.3.3. Correlation to the Softwood Measuremeots . . . . . . . . . . . . . . . . 60
2.4. CONCLUSIONS . . . . . . . . . . . . . . . . . . . . . . . . . . . . . . . . . . . . . .63
2.5. REFERENCES 64
x

Chapter 3: Determination of Thermodynamic Parameters Goveming theStereoselective Degradation of Arylglycerol-l3-aryl Ether Bonds inMilled Wood Lignin Under Kraft Pulping Conditions
3.0. ABSTRACT 74
3.1. INTRODUCTION . . . . . . . . . . . . . . . . . . . . . . . . . . . . . . . . . . . . . 75
3.2. EXPERIMENTAL 82
3.2.1. Materials and Methods 82
3.2.1.1. Preparation 823.2.1.2. Reactions 823.2.1.3. Instrumentation . . . . . . . . . . . . . . . . . . . 84
3.3. RESULTS and DISCUSSION 85
3.4. CONCLUSIONS 99
3.5. REFERENCES 100
Chapter 4: On the Formation of Diphenylmethane Structure in Lignin UnderKraft, EMCC· and Soda PulpiDg Conditions
4.0. ABSTRACT 1<l6
4.1. INTRODUCTION . . . . . . . . . . . . . . . . . . . . . . . . . . . . . . . . . . .. 107
4.2. EXPERIMENTAL 110
4.2.1. Materials and Methods . . . . . .. 110
4.2.1.1. Preparation . . . . . . . . . . . . . . . . . . . . . . . . . . . .. 1104.2.1.2. Reactions . . . . . . . . . . . . . . . . . . . . . . . . . . . . .. III4.2.1.3. Instrumentation . . . . . . . . . . . . . . . . . .. 112
4.3. RESULTS and DISCUSSION . . . . . . . . . . . . . . . . . . . . . . . . . . . .. 114
4.4. CONCLUSIONS 121
xi

•
•
4.5. REFERENCES 122
Cbapter S: l'F Nuclear Magnetic Resonance (NMR) Spectroscopy for theElucidation of Carbonyl Groups in Lignin Model Compounds
5.0. ABSTRACT 127
5.1. INTRODUCTION . . . . . . . . . . . . . . . . . . . . . . . . . . . . . . . . . . . . 128
5.1.1. The Chemistry of Carbonyl Compounds . . . . . . . . . . . . . . . . . 135
5.1.1.1. For particularly strong nucleophiles . . . . . . . . . . . . . . 1375.1.1.2. An acid-catalyzed mechanism 137
5.1.2. Fluorine-19 NMR Spectroscopy 139
5.1.2.1. Fluorine Shielding Constant .. . . . . . . . . . . . . . . . . 1405.1.2.2. Fluorine Coupling Constants 1425.1.2.3. Relaxation and 19p-NMR Linewidths 142
5.2. EXPERIMENTAL 146
5.2.1. Materials and Methods 146
5.2.1. 1. Reactions . . . . . . . . . . . . . . . . . . . . . . . . . . . . . . 1465.2.1.2. Instmmentation . . . . . 1465.2.2.3. CharacterlZation of derivatized compounds 148
5.3. RESULTS and DISCUSSION 153
5.3.1. Aromatic Carbonyl Compounds 155
5.3.1.1. Salient Features of the Reaction 156
5.3.2. Quinones 157
5.3.3. Lignin Model Compounds 163
5.4. CONCLUSIONS 173
5.5. REFERENCES 174
xii

•
•
Cbapter 6: 19F Nuclear Magnetic Resonance (NMR) Spectroscopy for tbeQuantitative Detection and Classification of Carbonyl Groups inLignins
6.0. ABSTRACT 181
6.1. INTRODUCTION 182
6.2. EXPERIMENTAL 185
6.2.1. Materials and Methods 185
6.2.1.1. Reactions 1856.2.1.2. Instrumentation 1876.2.1.3. Characterization . . . . . . . . . . . . . . . . . . . . . . . . . . 188
6.2.2.3.1. Characterization of derivatized compounds 1886.2.2.4. Characterization of derivatized Lignin 192
6.3. RESUI;.TS and DISCUSSION 194
6.3.1. Signal assignment 1996.3.2. Quantification of carbonyls in lignins 210
6.4. CONCLUSIONS 212
6.5. REFERENCES 213
Original Contribution to Knowledge and Ideas for Continued Research . . . . 219
xiii
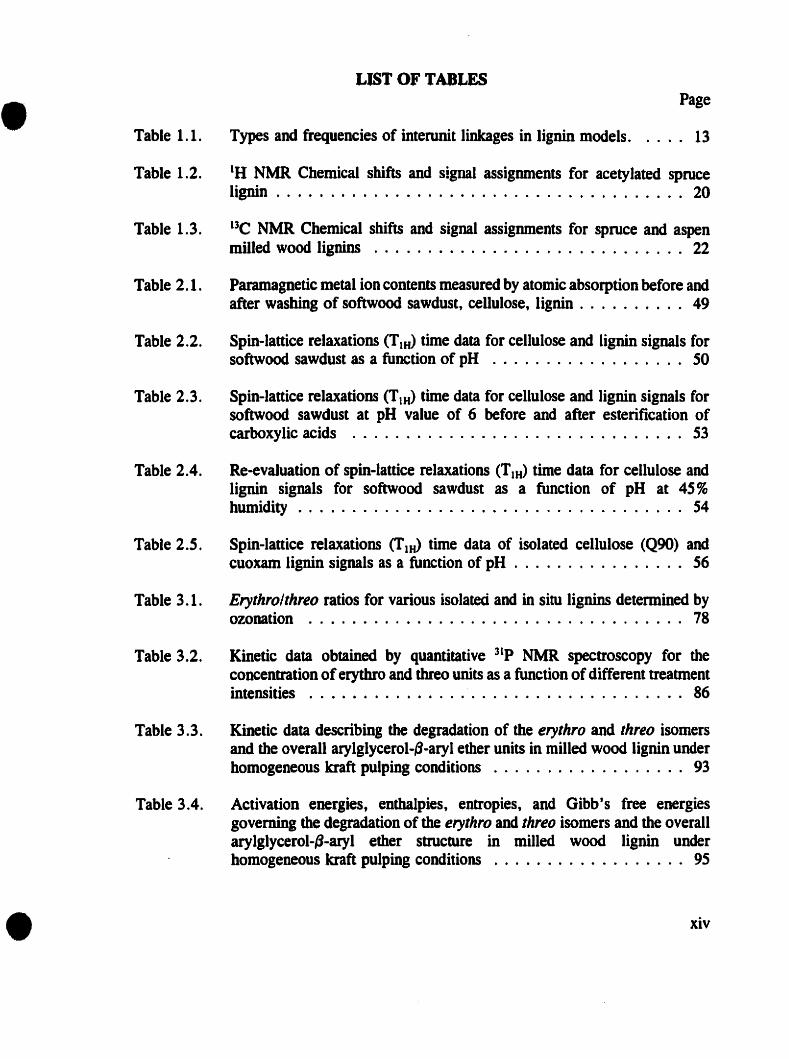
•LIST OF TABLES
Page
Table 1.1. Types and frequencies of interunit linkages in Iignin models. .... 13
Table 1.2. IH NMR Chemical shifts and signal assignments for acetylated sprucelignin . . . . . . . . . . . . . . . . . . . . . . . . . . . . . . . . . . . . . . 20
Table 1.3. I3C NMR Chemical shifts and signal assignments for spruce and aspenmilled wood lignins 22
Table 2.1. Paramagnetic metal ion contents measured by atomic absorption before andafter washing of softwood sawdust, cellulose, lignin . . . . . . . . . . 49
Table 2.2. Spin-lanice relaxations (TIH) time data for cellulose and lignin signais forsoftwood sawdust as a fonction of pH 50
Table 2.3. Spin-lanice relaxations (T1H) time data for cellulose and lignin signais forsoftwood sawdust at pH value of 6 before and after esterification ofcarboxylic acids 53
Table 2.4. Re-evaluation of spin-lattice relaxations (TIH) lime data for cellulose andlignin signais for softwood sawdust as a fonction of pH at 4S%humidity . . . . . . . . . . . . . . . . . . . . . . . . . . . . . . . . . . .. 54
Table 2.5. Spin-lanice relaxations (TI~ time data of isolated cellulose (Q90) andcuoxam lignin signais as a function of pH . . . . . . . . . . . . . . . . 56
Table 3.1. Erythrolthreo ratios for various isolated and in situ lignins determined byozonation 78
Table 3.2. Kinetic data obtained by quantitative 31p NMR spectroscopy for theconcentration oferythro and threo uoits as a fonction of different treatmentintensities 86
Table 3.3. Kinetic data describing the degradation of the erythro and threo isomersand the overall arylglycerol-~-aryl ether uoits in milled wood Iignin underhomogeneous kraft pulping conditions ..... . . . . . . . . . . . . . 93
Table 3.4. Activation energies, enthalpies, entropies, and Gibb's free energiesgoverning the degradation of the erythro and threo isomers and the overallarylg1ycerol-~-aryl ether structure in milled wood lignin underhomogeneous kraft pulping conditions 95

•Table 4.1. Showing the actual amounts of DPM structures present in MWL before
and after the addition of formaldehyde under homogeneous kraft pulpingconditions . . . . . .. ll5
Table 4.2. Showing the actual amounts of DPM structures present in MWL underhomogeneous kraft and soda pulping conditions 117
Table 4.3. Showing the actual distribution of condensed and diphenylmethanestructures present in conventional and EMCC kraft pulps of similar Kappanomber . . . . . . . . . . . . . . . . . . . . . . . . . . . . . . . . . . .. 119
Table 5.1. Pr0Perties of sorne common elem~nts 132
Table 5.2. NMR properties of sorne common magnetic nuclei 133
Table 5.3. Sorne 19p NMR reference standards . . . . . . . . . . . . . . . . . .. 143
Table 5.4. Fluorine coupling constants. . . . . . . . . . . . . . . . . . . . . . .. 144
Table 5.5. Contributions of dipolar interactions and chemical shift anisotropy tofluorine relaxation ..... . . . . . . . . . . . . . . . . . . . . . . .. 145
Table 5.6. 19p NMR signaIs of some monofluorinated organic compounds .. 154
Table 5.7. Fluoride ion induced trifluoromethylation of carbonyl compounds ofketones with trifluoromethyltrimethylsilane 158
Table 5.8. Fluoride ion induced trifluoromethylation of carbonyl compounds ofaldehydes with trifluoromethyltrimethylsilane . . . . . . . . . . . .. 159
Table 5.9. Fluoride ion induced trifluorometbylation of carbonyl compounds ofquinones with trifluoromethyltrimethylsilane 164
Table 5.10. Fluoride ion induced trifluorometbylation of carbonyl groups withtrifluoromethyltrimethylsilane 169
Table 5.11. Qualitative C-13 NMR chemical shifts ofdimeric lignin model compoundsbefore trifluoromethylation . . . . . . . . . . . . . . . . . . . . . . .. 170
Table 5.12. Qualitative C-13 NMR chemical shifts ofdimeric lignin model compoundsafter trifluoromethylation . . . . . . . . . . . . . . . . . . . . . . . .. 171
Table 6.1. Fluoride ion induced trifluoromethylation of carbonyl compounds ofketones with trifluoromethyltrimethylsilane 195
• n
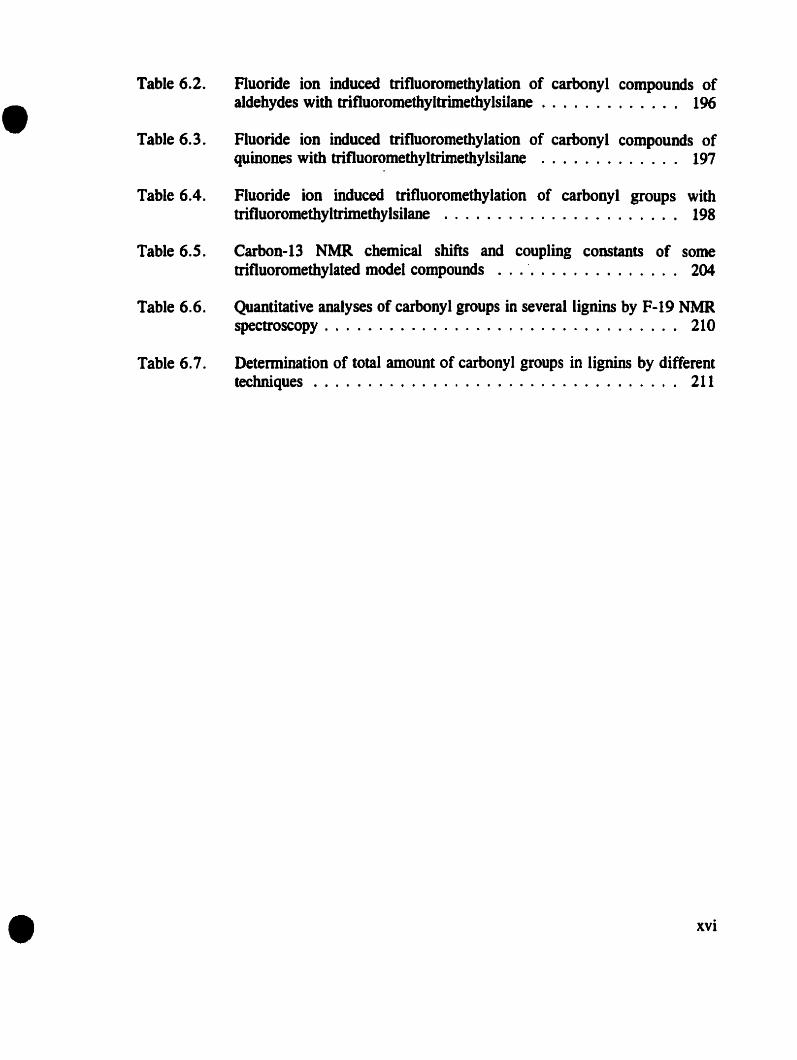
•Table 6.2. Fluoride ion induced trifluoromethylation of carbonyl compounds of
aldehydes with trifluoromethyltrimethylsilane . . . . . . . . . . . .. 196
Table 6.3. Fluoride ion induced trifluoromethylation of carbonyl compounds ofquinones with trifluoromethyltrimethylsilane 197
Table 6.4. Fluoride ion induced trifluoromethylation of carbonyl groups withtrifluoromethyltrimethylsilane 198
Table 6.S. Carbon-13 NMR chemical shifts and coupling constants of sornetrifluoromethylated model compounds 204
Table 6.6. Quantitative analyses of carbonyl groups in severallignins by F-19 NMRspectroscopy . . . . . . . . . . . . . . . . . . . . . . . . . . . . . . . .. 210
Table 6.7. Detennination of total amount of carbonyl groups in lignins by differenttechniques . . . . . . . . . . . . . . . . . . . . . . . . . . . . . . . . .. 211
• ~
• Figure l.l.
Figure l.2.
Figure 1.3.
Figure 1.4.
Figure 1.5.
Figure 1.6.
Figure l.7.
Figure l.8.
Figure 1.9.
Figure 2.1.
Figure 2.2.
LIST OF FIGURESPage
Representation of a tree cross section eut to reveal the three majorstructural planes of wood . . . . . . . . . . . . . . . . . . . . . . . . . . . 2
Schematic stnlctural diagram of a lypical softwood tracheid . . . . . . 4
Monomeric components of hemicelluloses . . . . . . . . . . . . . . . . . 8
Principal structure of galactoglucomannans 9
Partial molecular structure of cellulose in the l ,4-~-glucopyranosestructures 10
The elementary phenylpropane building blacks of various lignins .. 12
Softwood lignin model designed by computerized evaluation according toGlasser and Glasser 15
IR NMR (270 MHz) sPectrum of acetylated milled wood lignin from blackspruce 19
13C NMR (50.13 MHz) spectra of a: Aspen and b: Spruce milled woodlignin . . . . . . . . . . . . . . . . . . . . . . . . . . . . . . . . . . . . .. 21
The dependence of proton spin-lanice relaxation times for lignin andcarbohydrates in softwood sawdust as a fonction of pH . . . . . . .. 51
The dependence of proton spin-lanice relaxation times for lignin andcarbohydrates in softwood sawdust before and after esterification ofcarboxylics at pH 6 . . . . . . . . . . . . . . . . . . . . . . . . . . . .. 53
Figure 2.3. The dependence ofproton spin-lanice relaxation limes for isolated celluloseas a function of pH 56
Figure 2.4. Percent ionization of overall cellulose, glucose, primary and secondaryhydroxyl groups in cellulose . . . . . . . . . . . . . . . . . . . . . . .. 57
Figure 2.5. The dependence of proton spin-lanice relaxation limes for isolated ligninas a fonction of pH 58
Figure 2.6. Percent ionization of carboxylic acids and free phenolic hydroxyls groupsin lignin . . . . . . . . . .. 59• ~
•Figure 2.7. The behaviour ofproton spin-Iattice relaxation times for carbohydrates and
couxam Iignin as a fonction of pH 60
Figure 2.8. The simulated behaviour of overall proton spin-lanice relaxation times ofcuoxam Iignin and carbohydrates as a fonction of pH . . . . . . . . . 62
Figure 3.1. Reaction sequences operating during the ozonation of arylglycerol-p-O-4structure. The amount of erythronic and threon;c acids on the abundanceof the two diastereomers in the sample . . . . . . . . . . . . . . . . .. 77
Figure 3.2. The derivatization of 1,3,2,-dioxaphospholanyl chloride (1) with~ompounds containing labile hydrogens 79
Figure 3.3. Quantitative 31p NMR spectra and signal assignment of softwood milledwood Iignin after derivatization of 1,3,2,-dioxaphospholanyl chloride (l)with labile hydrogens . . . . . . . . . . . . . . . . .. 80
Figure 3.4. The plot of concentration vs. time describing the degradation of erythro(e) and threo (.) isomers, and the overaU arylglycerol-p-ether (+)structures in milled wood lignin under homogeneous kraft pulpingconditions at 100 oC . . . . . . . . . . . . . . . . . . . . . . . . . . . . . 87
Figure 3.S. Arrhenius (.) and Erying (e) plots for the determination of the energyof activation, enthalpy of activation, and entropy of activation govemingthe cleavage of erythro (E) and threo (T) isomers, and the overallarylglycerol-~-ether structures (B) in MWL under homogeneous kraftpulping conditions during the bulk phase 89
Figure 3.6. The various reactions that are thought to occur in phenolic and nonphenolic Iignin arylglycerol-fj-aryl ether units onder kraft pulpingconditions . . . . . . . . . . . . . . . . 90
Figure 3.7. The possible confonnations of fj-O-4 ether structures . . . . . . . . . 94
Figure 3.8. Arylglycerol-~-aryl ether model compounds containing free phenolichydroxyl groups examined by Miksche . . . . . . . . . . . . . . . . . . 97
Figure 3.9. Quantitative 31p NMR spectra of erythro ratios of MWL at various timesand temperatures under homogeneous kraft pulping conditions ... 98
Figure 4.1. Formation of typical diphenylmethane moiety . . . . . . . . . . . .. 107
•Figure 4.2. Cbemicai structure of diphenylmetbane moieties in Iignin 108
xviii

•Figure 4.3. The derivatizatioD of 2-Chloro-4,4,5,5,-tetramethyl-l,3,2,-
dioxaphospholanyl chloride (1) with compounds containing labilehydrogens . . . . . . . . . . . . . . . . . . . . . . . . . . . . . . . . .. 109
Figure 4.4. Quantitative 3lp NMR spectra of MWL before and after being subjectedto isothermal homogeneous kraft pulping conditions of a blank, controlkraft pulp, with 50% and 100% formaldehyde .. . . . . . . . . .. 116
Figure 4.5. The cleavage of {j-aryl ether bonds in kraft and soda pulping ... 118
Figure 4.6. Kinetic data showing the development of the actual amounts of 4-0-5',5,5'biphenolïc and diphenylmethane phenolic hydroxyl structures onsoftwood MWL under homogeneous kraft pulping conditions at 120 oC forin the presence and absence of formaldehyde . . . . . . . . . . . .. 120
Figure 5.1. Structures of lignin moieties with carbonyl groups . . . . . . . . .. 129
Figure 5.2. The mechanistic reaction pathway for trifluoromethylation of carbonylgroups 134
Figure 5.3. Electronic structure of the carbonyl group. . . . . . . . . . . . . .. 135
Figure 5.4. Geometrie structure of the carbonyl group . . . . . . . . . . . . . .. 136
Figure 5.5. The addition of a nucleophile to a ketone or aldehyde . . . . . . .. 138
Figure 5.6. 19p NMR spectra of trifluoromethylated quinones before and afterhydrolysis . . . . . . . . . . . . . . . . . . . . . . . . . . . . . . . . .. 162
Figure 5.7. lB NMR spectra of lignin model compounds, before and aftertrifluoromethylaûoD . . . . . . . . . .. 166
Figure 5.8. 13e NMR spectra of lignin model compounds, before and aftertrifluoromethylation . . . . . . . . . .. 167
Figure 5.9. Chemical structure of lignin model compounds . . . . . . . . . . .. 168
Figure 6.1. Trifluoromethylation of carbonyl-containing (including quinones) lignin-likemodel compounds 194
Figure 6.2. Quantitative 19p NMR spectra of steam explosion yellow poplar (top) andblack spruce milled wood (bottom) lignins 200

••Figure 6.3. Quantitative 19p NMR spectra of milled straw (top) and sucrolin (bottom)
lignins 201
Figure 6.4. Quantitative 19p NMR spectra ofkraft (top) and Alcell organosolv (bottom)lignins 202
Figure 6.5. Quantitative 19p NMR spectra of kraft lignin before (top) and after(bottom). reduction of carbonyls with sodium borohydride 203
Figure 6.6. 19p_13C coupling constant for different classes of carbonyls . . . .. 205
Figure 6.7. 19p..13C HMQC spectraoftrifluoromethylated 3,4'-dimethoxybenzaldehydeacquired by selecting different J values 206
Figure 6.S. 19p NMR spectra of trifluoromethylated dioxane lignin (A), after Dakinreaction (8) and reduction (C) with sodium hydre .. ~,. 'rite ..... 20S
• n

Sl, S2, S3
NMR
6
J
DD
CP
MAS
NOE
INEPT
TI
Tlp
Tl
CMP, CTMP
RMP,TMP
DTPA
Ka,pKa
(3-0-4
INADEQUATE
k
A
R
~G
Ml
~S
LIST OF ABBREVIATIONS AND SYMBOLS
outer, Middle and innennost layer of the secondary wall
nuclear magnetic resonance
chemical shifts
coupling constants
dipolar decoupling
cross polarization
magic angle spinning
nuclear Overhauser effect
insensitive nuclei enhanced by polarization transfer
spin-lanice relaxation time
spin-lanice relaxation lime in the rotating frame
spin-spin relaxation time
molecular rotational, angular momentum correlation lime
precessional frequency
chemimechanical, chemithennomechanical pulp
refiner mechanical, thermomechanical pulp
diethylenetriaminepentaacetic acid
dissociation constant, -log [Ka]
arylglycerol-l3-aryl ether stnlctural unit
incredible natural abundance double quantum transferexperiment
rate constant of a cbemical reaction
pre-exponential factor
activation energy
gas constant
Gibbs free energy
entbalpy
entropy
xxi

« Boltzmann's constant
• h Planck's constant
DPM diphenylmetbane
Mec modified continuous cooking
EMCC extended modified continuous cooking
RDH rapid displacement heating
ECF elemental chlorine free
"Y gyromagnetic ratio
H Hamiltonian
1 spin angular momentum
r vector distance
T rotational correlation time
J(w) specttal density function
TI asymmetry chemical shift tensor
TBAF tetra-n-butylammonium fluoride
TMAF tetramethylammonium t1uoride
THF tetrahydrofuran
HMQC heteronuclear multiple quantum correlation
• xxii

•
•
Cbapter 1General Introduction
1.0. INTRODUCTION
Wood is a naturally occurring material familiar in at least sorne way to everyone.
Wood bas always held a significant place within the human economy. It represents one
of the most important renewable natural resources, and its annual growth is sufficient to
satisfy many essential needs indefmitely into the future. Wood bas served man as a
stmctural material for bis buildings, fumishings, tools, weapons, and until recendy as
bis only readily available fuel1• Wood is obtained from three main parts of a tree, namely
the stem, the roots and the branches of the crown. Generally, trees belong to seed
bearing plants (spermatophytes) subdivided into two broad categories of plants known
commercially as softwoods and hardwoods. Softwoods are tree species of a class of
plants called gymnosperms (seeds are borne naked), and hardwoods are woody,
dicotyledonous (two seed leaves) angiosperms (seeds are borne in a fruit structure). Bath
softwoods and hardwoods contain various fibrous and nonfibrous ceIlS2 • They grow and
develop in various geometrical shapes and in different manners3•
1.1. The MACROSCOPIC STRUCTURE of WOOD
In order ta obtain the proper spatial concept for the stmcture of wood the stem
from the trees must be considered. A log may he pictured with good approximation, as
a tmncated cone through wbich three sections may, he eut perpendicular to each other.
These are the transverse (T), or cross section, at right angles to the stem axis; the radial
section (R), parallel to the axis on a radius of the stem; and the tangential section,
parallel to the axis and perpendicular to the radius. Examination of three cutting planes
of a stem (Figure 1.1) suggests2 the processes of formation of wood cells and their rmal
transformation into wood tissues. In Figure 1.1 the centrally located pith represent the
growth of the plant. Ten growth rings represent the growth of the plant in each year.
Bach ring is composed of earlywood and latewood.
1

•
•
OUT'•• AII•
INN,II'AIIIC
WOOD..~~"A'
.A""WOODLAT.WOOD
Figure 1.1. Representation of a ttee cross section eut to reveal the three majorstnlctural planes of wood. This particular stem was cut in the spring of its1()lb growing season2
•
The rings accumulated during the course of years collectively constitute the wood or
xylem. To the outside of the wood lies the cambium, inner bark (phloem), and outer
bark. Cambium is a very thin layer of living cells lying between wood (xylem) and inner
bark (phloem). It is in this layer that the vital actions of cell division and radial growth
of the ttee proceed. Each cell fonned thraugh the division of a mother cell (in cambium),
aCter growth and development, becomes part of the wood xylem. The division of phloem
cells is less frequent than that of xylem cells and tberefore they do not significantly
contribute to the total volume of wood. But they do become incorporated into the outer
bark, which acts as a protective shield and is important to the survival and growth of the
plant.
2

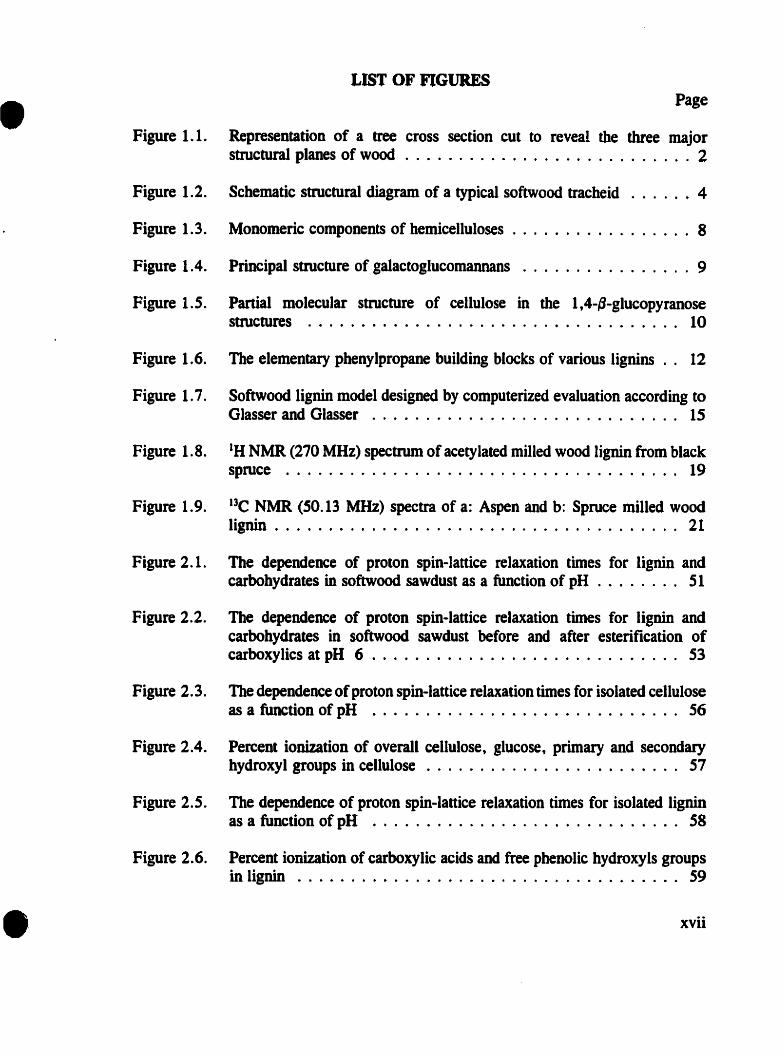
1.1.1. The ceU wall
Plant cell walls are built up of cellulose microfibrils orientated at various
directions (Figure 1.2), and incrusted with a number of other compounds. They are
subdivided into primary walls and secondary walls according to the time of their
fonnation. The primary wall develops first and is often stretched during the
differentiation of the cell. It is the only wall found in some cells. The secondary wall is
laid down on the inside of the primary wall, usually after elongation of the cell bas
ceased, and is a characteristic feature of almost ail wood cells".
The primary or outer wall of a wood cell consists of a thin network of cellulose
microfibrils, irregularly and loosely arranged and incrusted with hemi-eellulose, lignin,
and other compounds. The secondary wall is laid down inside the primary wall and in
Most xylem5 cells is considerably the thicker of the two. It can be subdivided into three
layers according to the orientation of the microfibrils within it. The layer nearest the
primary wall is tenned the SI layer and the microfibrils in it are orientated ncarly
perpendicular to the long axis of the cell. The middle, or S2 layer is by far the thickest
and is built up of microfibrils running at a smaU angle to the long axis of the cell. The
S3 layer, Iying nearest to the cell lumen, is a thin layer with the microfibrils again
orientated in a nearly transverse direction. There may by a graduaI transition in
microfibril orientation from one layer to the next. The secondary wall is also incrusted
with hemicellulose, and deposits of Iignin and other substances. The 53 layer may he
overlaid inside the cell lumen by a covering termed the wany layer6. This layer when
present, sa named on account of its small protrusioDS, is laid down just prior to death of
the cell protoplast and covers the entire 83 layer, pit cavities and any other wall
scupturings.
Individual cells are joined together by intercellular material between their primary
walls. This Middle lamella is an amorphous mass, rich in Iignin and composed largely
of pectin substances. It is readily dissolved away by macerating solutions.
3
•Fibril angle --.....,..rH-fP7
Bord.redpit
Stcondarywall
•
Figure 1.2. Schematic structural diagram7 of a typical softwood tracheid8• SI, outerlayer of the secondary wall; S2, Middle layer of the secondary wall; 83,innennost layer of the secondary wall.
1.1.2. Gymnosperm wood
The secondary xylem of the gymnospenns, commonly called softwood, is simpler
and more homogeneous than that of the angiosperms. The main differences between the
two types of wood are the presence of vessels in the angiospenns and their absence in
the gymnosperms (with the exception of one small order of plants) and the relatively
small amount of axial parenchyma found in the gymnospenns. The axial system of the
gymnospennous wood is compose almost entirely of tracheids though small amounts of
axial parenchyma are found in sorne species9• The tracheids are long cells with severa!
ray contacts and tbeir ends overlapping each other. The cells are pined in an opposite or
alternate pattern, principally on their radial walls, and these pits in members of the
4

•
•
Coniferales and some other genera are of the conifer bordered pit tyPe where the pit
membranes possess tari. The pits are nonnally concen~ted at the ends of the tracheids
and on those portions of the walls adjacent to rays. Resin canals occur in a number of
gymnosPermslO• Growth rings are usually prominent, the latewood tracheids developing
thicker walls with reduced bordered pits. The ray system conducts materia! horizontally
across the stem. Il contains ray parenchyma and ray tracheids, the latter being
distinguished by their thicker walls, bordered pits and lack of a living protoplast at
maturity. In the majority of gymn0SPenns the rays are also uniseriated. Horizontal resin
canals may occur11•
Although the tracheids fulfil the double fonction of support and conducting, and
the wood lacks the apparent sophistication of vessels with open Perforations and other
modifications found in the angiosperms, the xylem of gymnosperms appears to he a
highly efficient system. The giant redwoods of North America (Sequioa sempervirens D.
Don.), for example, grow to more than 300 feet in height. The trunks of these giant
trees, therefore, act as water-conducting pathway for a remarkable distance when it is
remembered how comparatively small the cells of the xylem are. These trunks also hold
huge weights of branches and foliage against severe wind loads.
1.1.3. Angiosperm wood
A1though some monocotyledonous plants (e.g. the palms) do show sorne
secondary growth, they do not POssess a complete cylinder" of vascular cambium and
hence their stems do not contain wood in the usual sense of the ward. Many
dicotyledonous angiosperms, however, produce considerable amounts ofsecondary xylem
This wood, generally referred to as hardwood, is considerably more complex than that
found in the conifers since it contains a greater variety of cell types. Whereas in the
softwood the axial system is built up almost entirely of tracheids, hardwoods have
evolved two different cell types for conduction and support. Vessels, built up of
individual vessel members joined end to end, provide a very efficient pathway for the
ascent of sap up the tree. These vessels are variously distributed within the growth
rings12•
5
•
•
The fonction of rnechanical suppon in angiosperm wood is carried out by the
wood fibres. These extremely long ceIls with thick watls, arranged in various groupings
within the growth rings, act as reinforcing members within the axial system. Libriform
fibres are longer then fibre tracheids and have ooly simple pits. Fibre tracheids are
shorter and have reduced bordered pits. In sorne plants the fibres can occupy more than
half the volume of the wood and form the bulk of the fibrous mass obtained when the
wood is pulped. Axial parenchyma ceIls are more abundant in hardwoods than in
softwoods where they accur only rarelyl3.
It is generally accepted that vessel members and fibres in hardwoods bave evolved
from tracheids, so that two separate cell types have becorne spccialized to fulfil the two
functions undertaken by the tracheid in other plant. Primitive dicotyledonous woods
possess long vessel members with very oblique scalarifonn perforation plates while more
specialized woods contain short wide vessel members with transverse simple perforation
plates.
Rays occupy a higher proportion of the wood volume in angiosperms than in
gymnosperms. They are usually multiseriate and may contain both procumbent and
uprigbt cells14•
1.2. CIlEMlCAL COMPOSmONS of WOOD
The chemical composition of wood is complex. The woody tissue is made up of
many components which are distributed non-uniformly as a result of its anatomical
structure, and Dot present in simple physical admixture. Consequently, the chemical
behaviour of wood cannot be deduced in detail from the properties of the companent
substances.
The greater pan of the wood substance is composed of materials of high
molecular weight, and wood bas been aptly described as an interpenetrating system of
high molecular weight polymers. Although the separation and isolation of these polymers
without significant modification is a difficult task, the components that are generally
present in wood can he classified chemically in the following way.
6

•
•
1.2.1. Extractives
AIl wood species and other plant tissue contain small amounts, and in sorne cases
quite appreciable quantities, of substances in addition ta cellulose, hemicelluloses, and
lignine Ta distinguish them from the major cell wall components, these constituents are
known as the extraneous components. Many of these substances are extractable with
neutral organic solvents, and are referred to as extractives. The extractives can he
regarded as nonstructural wood components, constituting 4-10% of the dry weight of
normal wood species that grow in temperate climates. They could constitute as much as
20% of the wood of tropical species. The term extraneous components embraces a wide
range of chemicals and includes a very large number of individual extracellular and low
molecular-weight compoundslS• However, no single species contains ail the possible
compounds or even all the different classes of compounds.
The extractives occupy certain morphological sites in the wood structure. For
example, the resin acids are located in the resin canals, whereas the fats and waxes are
present in the ray parenchyma cells. Phenolic extractives are present mainly in the
heanwood and in bark. The extractives often play an important role in the utilization of
wood, and influence the physical properties of WOodI6• Different types of extractives are
necessary to maintain the diversified biological funetions of the tree. For example, fats
eonstitute the energy source of the wood cells, whereas lower terpenoids, resin acids, and
phenolic substances protect the wood against microbiological damage or insect attack.
Traces of certain Metal ions are present usually as functional parts of the enzymes which
are needed as catalysts for biosynthesis.
1.2.2. Hemicelluloses
The cellulose and lignin of plant cell walls are closely interpenetrated by a
mixture of polysaccharides called hemicelluloses. Hemicelluloses belong to a group of
heterogeneous polysaccbrides which are fonned through biosynthetic routes different
from that of cellulose. In contrast to cellulose which is a homopolysaccbaride,
hemicelluloses are heteropolysaccharides. The bemicelluloses are water-insoluble, alkali-
7

soluble substances which are more readily hydrolysed by acids to their monomeric
components consisting of D-glucose, D-mannose, D-galactose, D-xylose, L-arabinose,
and small amounts of L-rhamnose in addition to D-glucuronic acid, 4-0-methyl-D
glucuronic acid, and D-galacturonic acid17.
CH,ott CHaON CHaONt;t?œ ~ Rf=?œOH OHOH
~-o-Gluco.. ~-D"'nnOM a-D-G."ctou
q f4=?r ~œCt\
OH OH
p-o·Xylose a-L·Anbinopyrano•• a-L-Rh.mno..
CODH CODH CCX)H
~ Lt?œ Rf=?~P-D-Glucuronlc .cld a-D-4"O....thylglucuronic .cld a-D-G.lacturonlc .cid
Figure 1.3. Monomeric components of hemicelluloses17.
Generally, hemicellu.loses are of much lower molecular weigbt than cellulose. Sorne
wood polysaccharides are extensively branched (Figure 1.4) and are readily soluble in
water. Most hemicelluloses have a degree of polymerization of ooly 200. Like cellulose
most hemicelluloses function as supponing material for the cell wall. They are intimately
associated with cellulose and appear to he a structural companent of the plant. Some
hemicelluloses are present in abnormally large amounts when the plant is under stress.
For example, compression wood bas a higher than normal galactose content and a higher
Iignin content18•
8

• CHaQH
......~o, RO
HO~04OH 1 le
QH1
1 CHzQH
~O __RO-..:..t4..--- --
1
1
•
.... 4-p·D-Glcp-1.... 4-~·D-Manp-1.... 4-p·D·M.np-1....4-~·D.M.np-1-..G 2,3
t t1 Ac
a-D-Galp
Figure 1.4. Principal structure of galactoglucomannans. Sugar uoits: {j-Dglucopyranose (Glcp); I3-D-mannopyranose (Manp); {j-D-galactopyranose(Giap). R=CH3CO or H. Below is the abbreviated formula showing theproportions of the uoits (galactose-rich fraction)19.
1.2.3. Cellulose
Cellulose is the structural basis of the plant cells and bence it follows that it is the
most important natural substance produced by living organisms. It is distributed in ail
plants from highly developed trees to primitive organisms such as sea-weeds, tlagellates
and bacteria.
Cellulose is the main constituent of wood. Approximately 40-45% of the dry
substance in most wood species is cellulose, located predominantly in the secondary cell
wall. Cellulose is a homopolysaccharide composed of I3-D-glucopyranose unilS whicb are
linked together by (1--4)-glycosidic linkages (Figure 1.5)20. Two adjacent glucose uoits
are linked by elimination of one molecule of water between their bydroxyl groups at Cl
and 4. The repeating unit of the cellulose chain is the cellobiose unit (Figure 1.5).
Though there are OH-groups at bath ends of the cellulose chain, these OH-groups show
9

•different bebaviour. The Cl-OH is an aldebyde group resulting from the ring formation
by an intramolecular hemiacetallinkage. That is why the OH-group at the Cl-end bas
reducing properties, while the OH-group al the C4-end of the cellulose chain is an
alcoholic hydroxyl with no-reducing properties (Figure 1.5).
H
OH
Reduc:in.end group
Secondary bydroxyl
1H OH
Primary hydroxyl
1Ct\OH.A--O
H
OHH
~-o
HaOHNon-reduc:ing
end group
•..•••••.••••• Cellobiose units ••..•.•..•.•.• n
Figure 1.5. Partial molecular structure of cellulose in the 1,4·I3-D-glucopyranoseform20•
•
The number of glucose units in cellulose varies from 7,000 to 10,000. The
cellulose molecules are linked laterally by hydrogen bonds into tinear bundles. The
extremely large number of hydrogen bonds results in a strong lateral association of the
linear cellulose molecules. This strong association .and almost perfect alignment of the
cellulose molecules gives rise to crystallinity. X-ray measurements show that the
crystalline regions are interrupted every 600 Awith non-crystalline (amorphous) regions.
Whether this is due to minor imperfections in the crystalline lattice or a real structural
entity is not completely clear. The most widely held concepts is the latter in which the
cellulose Molecules are highly oriented (crystalline) for a distance of about 600 À, then
pass through an area of poor orientation (amorphous) and re-enter a crystalline region.
The pattern repeats throughout the length of the cellulose molecule.
10

•The chemical fonnula for cellulose is (CJI100 S)n' where n is the number of
repeating sugar units or the degree of polymerization. The value of n varies with the
different sources of cellulose and the treatment received. Most papermaking fibers have
a weight...averaged OP in the 6O()...1S00 range.
Cellulose is insoluble in most solvents including strong alkali. It is difficult to
isolate it from ~ood in pure fonn because it is intimately associated with the Iignin and
hemicelluloses.
1.2.4. Lignin
Next to cellulose lignin is the most abundant and impottant polymeric organic
substance in the plant kingdom. Lignin is a three-dimensional, highly branched, and
polyphenolic molecule of complex structure and of high molecular weight. Lignin is
frequently compared to an incrustant substance because it enjoys an essentially ubiquitous
distribution in fully mature wood tissue. It penneates bath cell walls and intercellular
regions, or middle lamella, and renders wood a hard, rigid material able to withstand
considerable mechanical stress. The middle lamella region (Figure 1.2) is composed of
70-80% lignin by weight and is the cementîng material that binds ail wood cells together.
Although the middle lamella region has a very high lignin content, about 70% or more
of the total wood lignin is located in the cell walls themselves. The amount of lignin
present in different plants is quite variable21-27•
Lignin is a mixture of macromolecules formed by an essentially random free...
radical polymerization of idealized phenylpropane monomer units and its average
structure is usually discussed in terms of its most pronounced repeat unit although its
structure in totality is of course extremely heterogeneous in nature28•
•
Where:
R = Another phenylpropane unitRI =Ht or OCR), or ORRI = Ht or RRJ =OR,orR
Il

Generally, there are tbree types of lignins. These are the Guaiacyl or (G) Iignins, the
Syringyl or (S) tignins and the para-hydroxyphenyl or (H) lignins depending on the
substitution patterns on the phenylpropanoids.
CHzOH CH20H CH2,OH1 1 1CHR CHR CHR1 1 1
chICHR:s
~c~$oc~OH OH OH
Guaiacyl(O) Syrlngyl(S) Para-Hydroxyphenyl (H)
Figure 1.6. The elementary phenylpropane building blocks of various Iignins.
Softwoods contain almost exclusively (G) whereas hardwoods contain bath (S) and
(0). Para-hydroxyphenyl or (H) are present in hardwoods and in vascular plants. For
the more complex hardwood lignins there are variations in the proponion of (S) to (0)
to (H) lignins even amongst the different cell wall layers. Because the guaiacyl unit bas
a greater number of potential reactive sites, a higher degree of crosslinking exists.
Funhermore lignin formed primarily from guaiacyl has, on the average, a higher
molecular weight. A typical hardwood Iignin is made up of an equal number of guaiacyl
and syringyl units, whereas in softwoods only guaiacyl unils exist. Therefore, bardwood
lignins are more easily degraded than softwood Iignins.
The building-up of the tignin macromolecules by the plant comprises complicated
biological, biochemical and chemical systems which have been extensively studied and
repeatedly reviewed29-34 • Methods based on classical organic chemistry led to the
conclusion that lignin is built up of phenylpropane uoits. These uoits are joined together
with a variety of both C-O-C (ether) and C-C linkages. The ether linkages dominate;
approximately two thirds or more are of this type, and the rest are of the carbon-carbon
type. Detailed knowledge about the cbaracteristics of these linkages is of great theoretical
12

and practical interest and necessary for a thorough insight into the degradation reactions
of lignin in technical processes, such as pulping and bleaching. The dominating bond
typeS3S-37 and their approximate proponions in lignin are shawn in Table 1. 1.
Table 1.1. Types and frequencies of interunit linkages in Iignin models (Number oflinkages per 100 C9-units)17.
Linkages Glasser, Glasser3' Erickson et al. J6 Nimz37
13-0-4 } SS49-S1
} 6Sa-O-4 6-8I3-S 16 9-1S 613-1 9 2 ISSeS 9 9.S 2.34-0-5 3 3.5 1.S13-13 2 2 S.S/3-13- 2al'Y-O-r 10a-fJ 11 2.S13-6, 6-5 2
} 4.S-S1-0-4, 1-5 Canly 1-S)
Total 117 85.5-96 99.8
* THF: Tetrahydrofuran structure
Based on the information obtained from studies of biosynthesis as weil as analysis
of the various linkages and functional groups, structural fonnulas for lignin have been
constructed. The first Iignin model was constructed by Freudenberg38.39 for spruce lignin
represented 18 phenylpropane (C9) units. The fonnula bas attained general acceptance
with an empirical formula of CJl7.950Z.<40(OMe)O.92 as a section of the total molecule
which was assumed to he. of more than 100 uoits in its native state. Adler's formula<40 for
sproce lignin consisted of 16 prominent pbenylpropane (~) uoits and it represents ooly
a segment of the lignin macromolecule. The empirical formula of softwood lignin was
proposed as C)l7.9S02.41(OMe)O.93 by Sakakibara41 in 1980. The description of softwood
lignin was demonstrated as a section of 28 ~·units with several alternative structural
elements. The most recent concept3! comprises 94 units, corresponding to a total
molecular weight of more than 17000 in milled wood Iignin from loblolly pine (Pinus
13

•
•
taeda) as shown in Figure 1.7.
Depite intensive studies and a large number of analytical data available today on
the composition of functional groups, this infonnation can not be summarized in a simple
way because of large individual variations among the wood species.
The intriguing macromolecular bebaviour of Iignin and its derivatives bas yielded
to ever greater measures of explicability; the properties of Iignin-based polymerie
materials have become amenable to modification over a considerable range, even in a
predictable fashion. Significant developments in bath macromolecular behaviour and
property modification owe a great deal to the application of physico-chemical techniques
that have been made accessible through profound improvements in commercially
available instrumentation and related supplies. However, no method of isolating Iignin
is known which does not, in sorne way, alter its chemical and physical structure, for
Iignin in its natural state is believed to he a high polymer or even an infmitly cross-Iinked
ge141• In connection with pulping and bleaching and new technologies of Iignin utilization
the analytical characterization of Iignins has become increasingly important. Sophisticated
analytical techniques have been developed for the determination of functional groups in
Iignin. Although the chemical methods are still important, much new infonnation bas
emerged from the application of physical spectroscopie methods, especially NMR
spectroscopy.
Advancement depends in pan on understanding the molecular ongln of
macroscopic behaviour; it is here that numerous nuclear magnetic resonance (NMR)
techniques make notable contributions toward comprehending the various morphological
domains and the way in which it influences the overall macroscopic properties of the
polymer. Indeed, recendy developed techniques give promise of an încreasing role for
NMR. Sînce the various functional groups present in lignin greatly affect its reactivity,
reHable and quantitative functional group infonnation is important.
The flexibility achieved in bath solution and soUd state nuclear magnetic
resonance spectroscopy by various spectroscopie techniques during the last 20 yearS has
been invaluable in documenting the macromolecular propenies of lignine
14

•
•Figure 1.7. Softwood Iignin model designed by computerized evaluation according to
Glasser and Glasser3s.
IS

•
•
1.3. NUCLEAR MAGNETIC RESONANCE SPECTROSCOPY
Nuclear magnetic resonance spectroscopy (NMR) bas progressed at a vigorous
pace since the introduction of the fmt commercial spectrometers in the early 196Os, in
part due to the introduction of superconducting magnets which can maintain stable fields
higher' than electromagnets. In parallel, microprocessor development for signal
acquisition and data manipulation, coupled with a deeper and evolving understanding of
magnetic resonance phenomena, have led to invaluable methods which spurred structural
determinations on numerous natural products and polymers43 • The Fourier transform
method applied to I3C NMR, in combinatioD with other spectrometric measurements, bas
increased our knowledge of the structure of organic molecules in general, and Iignins in
particular.
NMR parameters such as chemical shifts (<<5), coupling constants (1), relaxation
times, and signal intensities are closely related to electronic structure and chemical
enviromnents of nuclei involved in the resonance phenomenon. NMR is an appropriate
tool for structural investigation: it retlects with precision chemical structures,
functionalities, and the nature of chemical bonding within the lignin macromolecule.
Lignin analyses using cbemical methods often involve degradation of the polymer. These
methods suffer from the drawback that botb the lignin and resulting degradation products
May undergo stnlctural changes other than those generally associated with the procedure.
Furthermore, the isolation of degradation products is time-consuming and product yield
may he low. Thus, physical methods baving as bigh a sensitivity as possible are
preferred.
1.3.1. SoUd State NMR Spectroscopy
One of the most important chemical aspects of a solid is the structural
detennination of its molecules. There are dynamic as weil as statie aspects of solid-state
structures and NMR may he used ta study the motions of molecules in solids which may
he related to their mechanical and other physical properties. Solid state NMR can provide
chemical information on species which impossible to examine in solution. In addition,
16

•
•
the compounds may dissociate in solution in a low energy process, yielding only'
exchange average solution NMR SPectra but their structure may he weil defmed in the
soUd state. The development of metbodology to obtain high resolution sPectra of solids
bas greatly enhanced the range of potential NMR applications. Recently, techniques have
been developed which enable NMR sPeCtra of moderate resolution to he obtained from
completely soUd systems and tbese will undoubtedly prompt a resurgence of chemical
mterest in the solid state, panicularly, for studies of low natural abundance nuclei such
as 13C.
Under nonnal conditions used to obtain 13C NMR spectra of Iiquids, a solid
sample would yield only an extremely broad featureless sPectnlm. A large contribution
to the broadening arises from static dipolar interactions. 13C spectra of solids obtained
using high power proton irradiation (Dipolar Decoupling, DD) can have much of the
initial broadening removed, but still May have linewidths of 5-10 kHz or more. This
broadening is due to chemical shift anisotropy. The observed broad envelope is a result
of contributions from the Many individual chemical shifts of nuclei in molecules oriented
differently within the sample. The anisotropy can he effectively removed if the sample
is spun rapidly at an angle of 54.7 0 (Magic Angle Spinning, MAS) with respect to the
external magnetic field.
Using the techniques of dipolar decoupling and magic angle spinning, it is
possible to produce spectra in solids having nearly the same resolution as in liquids.
However, the low natural abundance of 13C nuclei, and their longer spin-lanice relaxation
limes (TI) in solids compared with liquids severely limits the signal-to-noise ratio that can
he obtained in a given time for a solid sample. This sensitivity problem can he overcome
using the technique of cross polarization (CP), which not only brings about an increase
in sensitivity, by allowing the magnetization from the abundant lH nuclear spins to he
transferred to the dilute 13C nuclei, but also allows signal accumulation to he repeated at
intervals related to the shorter 1H relaxation limes rather than the longer 13C relaxation
times. It is also usual to perform the unrelated MAS eXPeriment in conjunction with cross
polarization44• In fact, the fust CPIMAS spectra published45 included a spectrum of wood
in which bath the cellulose and the lignin components could be clearly identified. Solid-
17
•
•
state 13C CPIMAS NMR bas the potential advantage of detecting ail of the components
in a system in a non-invasive and completely non-destructive manner.
l3C CPIMAS bas been used to elucidate the chemical46, conformational47, and
even the effect of moisture conteot48 of some insoluble polysaccharides and Chitins49.50.
Similar techniques have been also implemeoted toward the study of lignins.
Maciel and coworkers51 have used solid-state 13C CP/MAS NMR to characterize
lignins extracted by various procedures while Schaefer, Stejskal and co-workers52
monitored the chemical transformation of lignin by fungal catabolism (degradatioo).
However, these measurements are made 00 only one part of the total lignin and they are
subject to the additional complications of materialloss and possible structural alterations
caused during the extraction pracess. The poteotial of the technique for the
characterization of intact lignins has not been fuUy exploited to date.
1.3.2. Solution NMR Spectroscopy
1.3.%.1. lH NMR Spectroscopy
IH NMR spectroscopy bas been used for the characterization and classification of
lignins and its structural determination. Most of the early work in this field was focused
on proton NMR spectroscopy53.54. The 100% Datural abundance of the IH nucleus,
resulting in high sensitivity during an NMR experlment, is among the advantages of
proton NMR spectroscopy. Ludwig55 reviewed the literature dealing with the IH NMR
spectroscopy of lignins and a comprehensive 1H NMR study of lignins and lignin model
compounds. In this study1 the lignins were analyzed as acetate derivatives using
deuteriocblorofonn as the solvent. The methodology developed by Ludwig et al.53. 54 has
been applied to numerous studies5~59. Several IH NMR studies of lignins have been
published in which conditions other than those used by Ludwig et al.54 (acetate
derivatives, chlorofonn solutions) have been employed. Acetylation or other
derivatization procedures may cause unwanted chemical modification of the lignin
samples. This complication is avoided when underivatized lignins are examined60-67.
18

•During the preferred method for 1H NMR analysis of lignins, the samples are examined
as acetate derivatives using chlorofonn as the solvent. In these respect, the conditions
used by Ludwig et al.53.54 have thus been retained. One advantage in doing this is that
a vast amount of the reponed 1H NMR spectral data for IigniDS and lignin mode1
compounds remains relevant for reference pUrposeS68-78. Nevenheless, there are some
essentiallimitations to IH NMR spectroscopy of lignins. These include the rather limited
range of chemical shifts (12 ppm), extensive signal overlapping and proton coupling
effects. The technique is only suitable for the qualitative study of the proton distribution
on Iignins, while carbon containing groups and labile proton functionalities (OH<COOR < SR) remain beyond the capabilities of the technique.
1
1
13 11 11
1 2
1 • , • 1 , z D
Figure 1.8. IH NMR (270 MHz) sPectnlm ofacetylated milled wood Iignin from blackspruce64
•
• 19

Table 1.2. IH Chemicalr . 64
• 19nms .
Signal No. "a in ppm
1 9.842 9.643 7.534 7.41
5 7.296 6.937 6.06
8 5.49
9 4.80b
10 4.65
11 4.39
12 4.2713 3.8114 2.62
IS 2.2816 2.0117 1.26
shifts and signal assignments for acetylated spruce
Assignments
Fonnyl protons in benzaldebyde unitsFonnyl protons in cinnamaldehyde unitsAromatic protons in benzaldehyde unitsAromatic protons in benzaldehyde units and viny1protons on the carbon atoms adjacent ta aromatic ringsin cinnamaldebyde unitsChlorofonn (CDCI3)
Aromatic protons (cenain vinyl protons)Hg in {j-O-4 structures (Har in fJ-l structures, H,8 incinnamyl alcohol units)Hg in {j-5 stnaetures (Hg in non-cyclic benzyl aryl ether,8,8 in 2-aryloxypropiophenones)Inflection possibly due to Hcr in pinoresinol units and8,8 in non-cyclic benzyl aryl ethers (Ihreo fonns).8,8 in {J-O-4 structures (methylene protons incinnamylalcohol units).H'Y in, primary {j-O-4 structures (erythro fonns) and{j-S structures.H'Y in several structuresProtons in methoxyl groupsBenzylic protons in {J-fj structures ofsecoisolariciresinol type, benzylic protons in 3-aryl-lpropanol units.Aromatic acetateAliphatic acetateHydrocarbon contaminant
•
a Values refer to the higbest point of the peak.b Inflection includes contributions from unidentified signals79.
1.3.%.%. 13C NMR Spectroscopy
Carbon-13 NMR spectrometry is one of the most powerful techniques available
for lignin analysis, in particular for determining minor structures not available by other
techniques. 13C NMR is a sensitive method for the qualitative structural analysis of
ligninllO-84. It provides detailed structural information on nearly ail types of carbons
including those present even in minor structuresSS•S9• This is an important advantage
compared ta Most other methods, which provide information ooly on specific groups.
20

•The capacity for producing reliable quantitative analyses of functional groups in Iignin
is another significant feature of Ile NMR90-92 spectrometry. Methods using new pulse
strategies in NMR spectrometry have opened new frontiers in the understanding of Iignin
structure. In the late 1970s, when 13e NMR became available, about 40 signais could he
distinguished in l3e NMR Iignin spectra using broad band proton decoupling which
collapses Ile multiplets and produces one sbarp signal for every chemically unique
carbon atom. Since carbon atoms from the backbone of organic molecules, 13e NMR
signal locations depend much more on the structural environment and substitution patterns
than those in IH NMR; the 13e spectrum contains more structural infonnation over a
much wider chemical shift range. The Ile NMR spectrum of Iignin can he divided into
three main segments: the first (200 to 165 ppm) contains signais assigned to carbonyl
carbons; the second (165 to 100 ppm) is assigned to aromatic and olefmic carbons; and
the third (100 to 10 ppm) is assigned to aliphatic carbon atoms93•
•1 2
26D IÎÔ
Figure 1.9. 13e NMR (50.13 MHz) spectra of a: Aspen and b: Spruce milled woodlignin93.
• 21
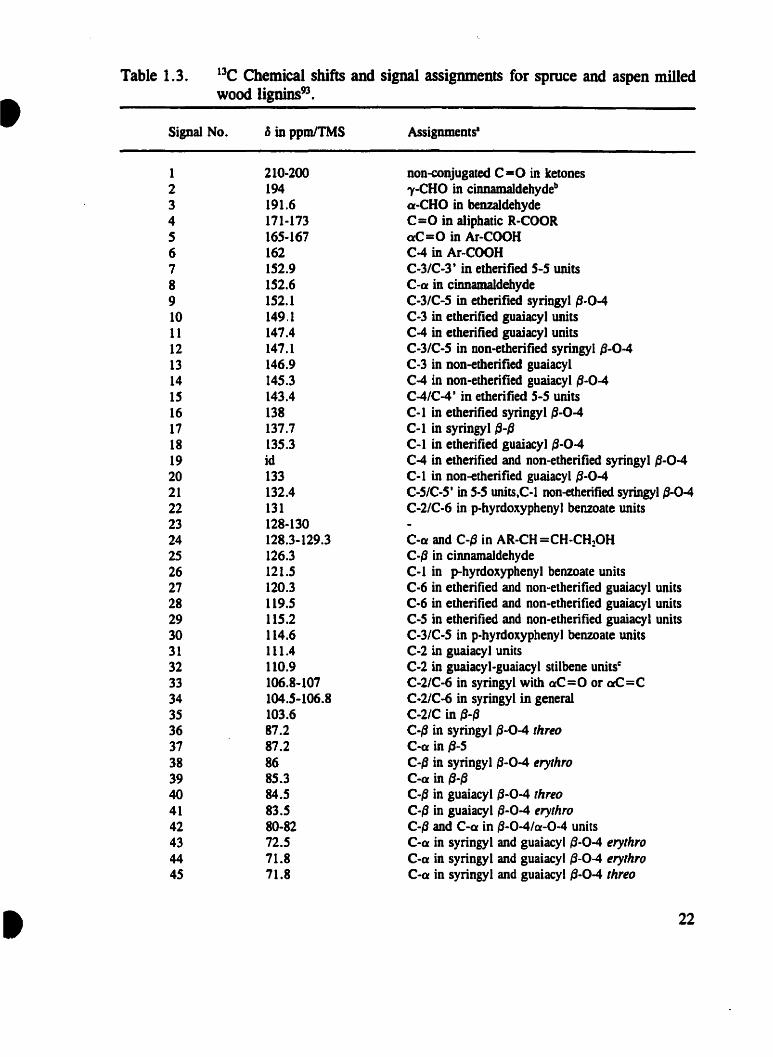
13C Chemical shifts and signal assignments for sproce and aspen milledwood lignins93.•
•
Table 1.3.
Signal No.
123456789101112131415161718192021222324252627282930313233343S36373839404142434445
"in ppmITMS
210-200194191.6171-173165-167162152.9152.6152.1149.1147.4147.1146.9145.3143.4138137.7135.3id133132.4131128-130128.3-129.3126.3121.5120.3119.5115.2114.6111.4110.9106.8-107104.5-106.8103.687.287.28685.384.583.580-8272.571.871.8
Assignments·
non-conjugated C=0 in ketones"Y-CHO in cinnamaIdehydeb
a-CHO in benzaldehydeC=O in a1iphatic R-COORaC=O in Ar-COOHC-4 in Ar-COOHC-3/C-3' in etherified 5-5 unitsC-a in cinnamaldehydeC-3/C-5 in etberified syringyl fj-O-4C-3 in etherified guaiacyl unitsC-4 in etherified guaiacyl unitsC-3/C-5 in non-etherified syringyl {j-O-4C-3 in non-etherified guaiacylC-4 in non-etherified guaiacyl {j-O-4C-4/C-4' in etherified S-S unitsC-l in etherified syringyl fj-O-4C-l in syringyl {j-{jC-l in etherified guaiacyl {j-O-4C-4 in etherified and non-etherified syringyl P-O-4C-l in non-etherified guaiacyl (j-O-4C-SIC-5' in 5-5 units,C-l non-etherified syringyl fJ-Q-4C-2/C-6 in p-hyrdoxyphenyl benzoate units
C-a and C-fj in AR-CH =CH-CH20HC-{j in cinnamaldehydeC-l in p-hyrdoxyphenyl benzoate unitsC-6 in etherified and non-etherified guaiacyl unitsC-6 in etherified and non-etherified guaiacyl unitsC-5 in etherified and non-etherified guaiacyl unitsC-3/C-5 in p-hyrdoxyphenyl benzoate unitsC-2 in guaiacyl unitsC-2 in guaiacyl-guaiacyl stilbene units~
C-2/C-6 in syringyl with aC=O or aC=CC-2/C-6 in syringyl in generalC-2/C in {j-fjC-fj in syringyl {j-O-4 threoC-a in {j-SC-{j in syringyl {j-O-4 erythroC-a in (j-fjC-fj in guaiacyl {j-O-4 IhreoC-{3 in guaiacyl {3-0-4 erythroC-{3 and C-a in (j-O-4/a-O-4 unitsC-a in syringyl and guaiacyll3-0-4 erythroC-a in syringyl and guaiacyl 13-0-4 erythroC-a in syringyl and guaiacyl 13-0-4 threo
22

Table 1.1. Continued• Signal No.
46474849505152535455565758
8 in ppm/TMS
71.471.26361.760.259.855.7-55.955.7-55.953.753.1
20-4020
Assignmentsa
C-a in syringyl and guaiacyl (1-0-4 threoC--y in (1-(1 unitsC--y in (1-5 and (j-O-4 with aC=OC--y in cinnamyl alcohol unitsC--y in syringyl and guaiacyll3-0-4 erythro and threoC--y in syringyl and guaiacyll3-0-4 erythro and IhreoAromatic OCR] in syringyl and guaiacyl unitsAromatic OCH] in syringyl and guaiacyl unitsC-(J in (j-{3C-(J in {3-5
-CH] and CHz in saturated aliphatic chain-CH] in acetyl groups
•
a Solvent: DMSO~bAr-CH =CH-COHC Guaiacyl-CH =CH-Guaiacyl
In 13C NMR studies, matching the chemical shift values of Iignio and model
compounds is done with spectra recorded under exactly the same conditions (solvent,
temperature, and setting of the TMS ô value) to ensure valid assignments. Nevenheless,
the matching technique is Dot completely satisfactory because the chemical shift for a
specific carbon atom in a dimeric model compound is not exactly identical ta those wben
present in a polymer83.
The accuracy of assignments is also limited by availability of relevant model
compounds for SPectral measurements and by SPectrometer resolution. Because of the
structural heterogeneity and complexity of lignin, numerous signais are hidden in
shoulders and often overlooked. In time, this difficulty can he minimized througb an
expanding data bank as more oligomeric lignin model compounds become available, by
applying labelling techniques to lignin synthesized in vitro, and by polymerization of
selectively 13C-enriched coniferyl alcobol and lignin polymer (DHP) models94• 9S •
23

•
•
1.3.%.3. 3.p NMR Spectroscopy
The development of a novel NMR technique capable of determining and
classifying various functional groups for both soluble96-I01 and solid lignocellulosic
materialslO2• 103 has been made possible by Argyropoulos et al. 96-103. The methodology
involves the selective phosphorous-tagging of a variety of functional groups present in
lignin and carbohydrates, followed by solution and solid state 31p NMR spectroscopies.
Solution 31p NMR have been used to examine soluble lignin and carbohydrate samples
after phosphitylation with 2-chloro-l,3,2-dioxaphospholane. This is a novel and powerful
means to determine the three principal fOnDS ofphenolic hydroxyls present in lignins i.e.
p-hydroxyphenyl, guaiacyl, and syringyl structures. In addition, primary hydroxyls,
carboxylic acids, and the two diastereomeric forms of arylglycerol-fj-aryl ether uoits (p
0-4 structures) present in lignins can also be detennined from a single 31p NMR
experiment. When applied to carbohydrates, the technique gave characteristic signais for
the alpha and be,a anomers and the epimeric fonns of monosaccharides. Completely
resolved 31p NMR spectra were also obtained when Iignin-carbohydrate mode1
compounds were examined.
Another phosphitylation reagent namely, 2-chloro-4,4,S,S-tetramethyl-l,3,2
dioxaphospholane, have been found panicularly good at resolving this region at the
expense of fine resolution between the primary and secondary hydroxylsl04-106, The 31p
NMR signaIs received due to free phenolic hydroxyls belonging to guaiacyl, syringyl, p
hydroxyphenyl unilS and most C-S and C-6 related condensed phenolic forms are very
weil resolved107. In addition signais due to carboxylic acids are weil separated from ail
other signais, allowing direct access ta this important information related to the
fundamental changes occuning within lignins during oxidative conditions108.
1.3.2.4. Other NMR Methods
Other NMR techniques that have been used for the structural elucidation of
lignins, are acetylation, silylation, and tluorination aimed at derivatizing the labile
protons in lignins, followed by 13C, 29Si, and 19F NMR spectroscopies, respectively.
Acetylation of Iignins is relatively simple to achieve under weil established and mild
24

•
•
conditioDS. It bave been used to estimate the total hydroxyl content in various lignin
preparatioDS from proton and l3e NMR spectra. The 13e NMR spectra may also reveal
other structural features of lignins. Tbese spectra permit the distinction to be made
between aromatic and alipbatic hydroxyls, and may reveal the primary and secondary
character of aliphatic hydroxyls.
Efforts to overcome sorne of the limitations imposed by proton and l3e NMR
spectroscopies have prompted the examination of other NMR-active nuclei which when
covalently linked to lignin by appropriate derivatization procedures may provide
additional structural information for these heterogeneous biopolymers. Early attempts
examined the potential of silylation followed by silicon NMR for the detennination of
hydroxyl groups in kraft Iignin and related model compounds109• 110. The 29Si NMR
spectra of silicon derivatives of lignins contain features that may distinguish between
aromatic and aliphatic hydroxyls and carboxylic protons. The method, however, requires
large sample concentrations and long instrument times. This is due to the relatively low
natural abundance of the silicon-29 nuclei (4.7%), their low magnetic moment, and their
high relaxation lime. In order 10 increase the sensitivity of the experiment, the INEPT
(lnsensitive Nuclei Enhanced by Polarization Transfer) Il 1-113 pulse sequence is used, and
introduces a variety of uncertainties in quantitatively interpretating the spectra.
19p NMR have also been proPOsed as a Mean of detecting different functional
groups in Iigninsl14• 115. The 100% natural abundance of the 19p nucleus, resulting in high
sensitivity during an NMR experiment, is among the advantages of fluorine NMR
spectroscopy. Although the potential of this technique has been applied for detection of
hydroxyl1l4 and carbonyl groupsllS, the Qlajor limitation of this technique is incomplete
f1uorine-derivatization of these functional groups in Iignins.
25

•
•
1.4. SCOPE and MM of tbis TBESIS
Although the structure of lignin is considered to he adequately defined, it is
certainly not perfectIy refmed. For this reason, it is imperative that analytical methods
suitable for the fme structural characterization of solid wood and soluble lignins be
developed.
The primary objective of the research presented in this thesis is focused on
developing and investigating the application of novel NMR spectroscopic techniques
toward studying and elucidating the role of different structural units in lignin.
SaUd state 13C CPIMAS was employed to measure proton spin-lattice relaxation
times (TlU) for several samples of softwood, lignin, and cellulosic materials as a function
of pH (Chapter 2). This was done to investigate the ionization of various functional
groups on the molecular mobilities of carbohydrates and lignin in order to arrive at a
better understanding of their molecular connectivities and their physico-chemical
properties in wood during various stages of pulping and bleaching processes.
During chemical pulping lignin in wood undergoes degradation reactions. It is
clear that in most cases lignin also undergoes condensation reactions, which work against
the degradation. In chapters 3 and 4 the application of quantitative 31p NMR spectroscopy
is implemented for detennining the thermodynamic parameters goveming the cleavage
of arylglycerol-l3-aryl ether linkages of lignins and the fonnation of condensed structures
under kraft pulping conditions.
The carbonyl groups present in wood and pulps play an important role in
determining the reactivity of lignin structures toward the yellowing of paper and the
bleaching of pulp. The low contents of these groups in wood, in pulp and in paper have
made the elucidation of their role ralher elusive. Therefore, the necessity to obtain
essential information toward understanding the reactivity of lignin structures during
yellowing and pulp bleaching, initiated efforts at developing a novel method for the fine
structural elucidation and quantification of the various carbonyl groups present in lignin.
The development of this technique is described in chapters S and 6.
Despite significant recent advancements in technical and instrumental fronts,
26

•
•
lignin chemists are still cballenged with the need to develop and apply improved
methodologies in search for solutions to both fundamental and applied lignin-related
problems.
27

1.5. REFERENCES
• 1. Browning, B. L., The cbemistry of wood., Interscience publisher, John Wiley &Sons, New York, Cbapter 1, pp. 1-6, 1963.
2. Rowell, R., The chemistry of solid wood., American cbemical society, ACS.,Washington, D. C. , Chapter 1, pp. 3-56, 1984.
3. Fengel, D., and Wegener, G., Wood; chemistry, ultrastructire, reactioDS., Walterde Groyter, Berlin, New York, pp. 6-7, 1983.
4. Preston, R. D., The molecular architecture of plant cell walls., Chapman andHall, Londond, 1952.
5. Wardrop, A. B., The stmcture and fonnation of the cell wall in xylem., In theformation of wood in forest trees, Ed. M. H. Zimmennan, Academic Press, NewYork, pp. 87-134, 1964.
6. Liese, W., The wany layer., ln cellular ultrastmcture of woody plants, Ed. W.A. Côté, Syracuse University Press, New York, pp. 251-269, 1965.
7. Côté, W. A., Wood ultrastmcture., University of Washington Press, Syracuse,New York, 1967.
8. Bolker, H. 1., Encyclopedia ofchemical technology., Interscience publisher, JohnWiley & Sons, New York, Vol. 5, p. 75, 1979.
9. Esau, K., Plant Anatomy., Interscience publisher, John Wiley & Sons, NewYork, 1965.
10. Jane, F. W., The Structure of Wood., Black, London, 1970.
Il. Panshin, A. J., and de Zeeuw, C., Textbook of Wood Technology., McGrawHill, New York, 1970.
12. Carlquist, S., Comparative Plant Anatomy., Holt, Rinehart and Winston, NewYork, 1961.
13. Esau, K., The Anatomy of Seed Plants., Interscience publisher, John Wiley &Sons, New York, 1960.
14. Ilvessalo, P., Wood Chemistry; The Structure of Wood., Jensen, W., Ed., Vol.l(Bl), pp. 1-50, 1967.
• ~

•15. Fengel, D., and Wegener, G., Wood; Chemistry, Ultrastrocture, Reactions.,
Walter de Gmyter, Berlin, New York, p. 33, 1983.
16. Narayanamurti, D., Die Bedeutung der Holzextraktstoffe., Holz Roh-u.Werkstoff, 15, 370-380, 1957.
17. Fengel, D., and Wegener, G., Wood; Chemistry, Ultrastrocture, Reactions.,Walter de Gmyter, Berlin, New York, p. 106, 1983.
18. Timell, T. E., Recent Progress in the Chemistry and Topochemistry ofCompression Wood*., Wood Sei. Technol., 16, 83-122, 1982.
19. Sjôstrôm, E., Wood chemistry: Fundamentals and applications., Second edition,Academie Press, Chapter 3, p. 65, 1993.
20. Smook, G. A., Handbook for Pulp and Paper Technologists., Second edition,Angus wilde publications, Vancouver, Chapter 1, p. S, 1992.
21. Hergert, H. L., Infrared soectra. In: Lignins. Occurrence, Formation, Structureand reactions., Sarkanen, K. V. and Ludwig, C. H., Eds., Interscience publisher,John Wiley & Sons, New York, pp. 267-297, 1971.
22. Neish, A. C. , Monomeric intennediates in the biosynthesis of lignin. In:Constitution and biosynthesis oflignin, Freudenberg, K., and Neish, A. C., Eds.,Springer-Verlag, Berlin, pp. 5-43, 1968.
23. Wardrop, A. B., Occurrence and formation in plants. In: Lignins occurrence,formation, structure and reactions., Sarkanen, K. V. and Ludwig, C. H., Eds.,Interscience publisher, John Wiley & Sons, New York, pp. 19-41, 1971.
24. Venverloo, C. J., The Lignin of Populus nigra L. cv. 'Italica' and Sorne OtherSalicaceae., Holzforschung, 25, 18-24, 1971.
25. Howard, E. T., Physical and Chemical Properties of Slash Pine Tree Parts.,Wood Sei. Teehnol., 5(4), 312-317, 1973.
26. Miksche, G. E., and Yasuda, S., Über die Lignine der Blatter und Nadeln einigerAngiospermen und Gymnospermen*., Holzforschung, 31, 57-59, 1977.
27. Luger, F., and Gampe, S., Potential forstlicher reststoffe (waldabfâlle), Vol. 2,Bericht Forstl. Fak., Universitit München, pp. 84-158, 1978.
28. Fyfe, C. A., SoUd State NMR for Chemists , C.F.C. Press, Guelph, Ontario,Canada, Chapter 7, pp. 440-442, 1983.
• 29

•29. BrauDS, F. E., and Brauns, D. A., The chemistry of lignin., supplement volume.
Academie press, New York, 1960.
30. Neish, A. C., Cinnamie aeid derivatives as intermediates in the biosynthesis ofIignin and related compounds. In: The fonnation of wood in forest trees.,Zimmerman, M. H., Eds., Academie press, New York, pp. 219-239, 1964.
31. Freudenberg, K., The fonnation of Iignin in the tissue and in vitro. In: Theformation of wood in forest trees., Zimmennan, M. H., Eds., Academie press,New York, pp. 203-218, 1964.
32. Schubert, W. J., Lignin Biochemistry., Academie press, New York, 1965.
33. Pearl, I. A., The chemistry of Iignin., Marcel Delcker Inc., New York, 1967.
34. Gross, G. G., Biosynthesis of Iignin and related monomers. In: The structure,biosynthesis and degradation of wood. Recent Adv. in phytochem. Il., Loewus,F. A., and runeeldes, V. C., Eds., Plenum press, New York, pp. 141-184, 1977.
35. Glasser, W. G., and Glasser, H. R., The evaluation oflignin's chemical structureby experimental and computer simulation techniques., Pape Puu., 63, 71-83,1981.
36. Erickson, M., Larsson, S., and Miksche, G. E., Gas-chromatographic analysisof Iignin oxidation produets. VU. An improved characterization of lignins.throughmethylation and oxidative decomposition., Acta Chem. Scand., 27, 127-140,1973.
37. Nimz, H., Beech lignin- Proposai of a constitutional scheme., Angew. hem. Int.Ed. Engl., 13, 313-321, 1974.
38. Freudenberg, K., Entwurf eines Konstitutionsschemas für das Lignin der Fichte.,Holzforschung, 18, 3-9, 1964.
39. Freudenberg, K., The constitution and biosynthesis of lignin. In: Constitution andbiosynthesis of Iignin., Freudenberg, K. and Neish, A. C., Eds., Spinger verlagBerlin, Heidelberg, New York, pp. 47-122, 1968.
40. Adler, B., Lignin chemistry- past, present and future., Wood Sei. Technol., Il,169-218, 1977.
41. Sakakibara, A., Structural model of softwood Iignin., Wood Sei. Teehnol., 14,89-100, 1980.
• 30

•42. Bolker, H.I. NaturaJ and Synthetic Polymers., New York, Marcel Dekker,
Chapter 12, 1974, .
43. Snyder, J., Breuning, R., Derguini, F., Nakanishi, K., Fractionation and praofof structure of natural products, In: Lowe, J. W., Eds., Natural products ofwoody plants 1. Chemicals exttaneous to the lignocellulosic cell wall. SpringerSeries in wood science, Springer, Berlin, Heidelberg, New York, Tokyo, 60-84,1989.
44. Levy, G. C., Lichter, R. L., Nelson, G. L., Carbon-13 nuclear magneticresonance gpectroscopy., Second edition, Interscience publisher, John Wiley &Sons, New York, Chapter 10, 1980.
45. Schaefer, 1., and Stejskal, E. O., Carbon-13 nuclear magnetic resonance ofpolymers spinning at the magic angle., J. Am. Chem. Soc., 98, 1031-1032, 1976.
46. Hall, L. D., and Yalpani, Determination of the primary structure ofpolysaccharides and their derivatives by solid-state carbon-13 n.m.r.spectroscopy., M., Carbohydr. Res., 91, CI-C4, 1981.
47. Saito, H., and Tabeta, R., l3e Chemical shifts of solid (1--4)-o:-D-glucans bycross polarizationlmagic angle spinning (CPIMAS) spectroscopy. ConformatioDdependent 13C chemical shifts as a reference in detennining confonnation inaqueous solution., Chem. Lett. Chem. Soc. Japan, 713-716, 1981.
48. Fyfe, C. A., Stephenson, P. J., Tylor, M. G., Bluhm, T. L., Deslandes, Y., andMarchersault, R. H., Macromolecules, 17, 501-502, 1984.
49. Saito, H., and Tabeta, R., and Hirano, S., Confonnation of chitin and N-acylchitosans in solid state as revealed by 13C cross polarizationlmagic angle spinning(CP/MAS) NMR spectroscopy., Chem. Lett. Chem. SOC. Japan, 1479-1482,1981.
50. Raymond, L., Morin, F. G., Marchersault, R. H., Degree of deacetylation ofchitosan using conductometric titr'ation and solid-state NMR., Carbohyr. Res.,246, 331-336, 1993.
51. Maciel G. B., D'Donnell, D. J., Ackerman, 1. J. H., Hawkins, B. H., andBartuska, V. J., A 13C NMR study of four lignins in the solid and solution state.,Makromol. Cnem., 182, 2297, 1981.
52. Schaefer, J., Sefcik, M. D., Stejskal, B. O., McKay, R. A., Hall, P. L.,Characterization of the catabolic transformation of lignin in culture using magicangle carbon-13 NMR., Macromolecules, 14, 557-559, 1981.
• 31

•53. Ludwig, C. H., Nist, B. J., McCanhy, J. L., Lignin. xn. The high resolution
nuclear magnetic resonance spectroscopy of protons in compounds related tolignin., J. Am. Chem. Soc., 86, 1186-1196, 1964.
54. Ludwig, C. H., Nist, B. J., McCarthy, J. L., Lignin. XIII. The high resolutionnuclear magnetic resonance spectroscopy of protons in acetylated Iignin., J. Am.Cbem. Soc., 86, 1196-1202, 1964.
55. Ludwig, C. H., Magnetic resonance spectra. In: Lignins, occurrence, formation,structure and reactions., Sarkanen, K. V., Ludwig, C. H., Eds., Interseiencepublisher, John Wiley & Sons, New York, 299-344, 1971.
56. Suty, L., GoUs, E., Chemical structure of beech Iignin and its changes duringwater hydrolysis., Cellul. Chem. TechnoI., 6, 485-491, 1972.
57. Kosikovâ, B., Polem, J., Joniak, D. , NMR studies of Iignin-carbohydratecomplexes., Holzforschung, 27, 59-64, 1973.
58. Faix, O., Schweers, W., Vergleichende untersuchungen an polymermodellen deslignins (DHP's) verscbiedener zusammensetzungen., Holzforschung, 28, 179-185,1974.
59. Simionescu, C. 1., Dragovova, R., Kusmanova, D., NMR-spektroskopischeuntersuchungen von dioxanligninfraktionen., Cellul. Chem. Technol., 15, 455464, 1981.
60. Bland, D. E., Menshun, M., The composition and reactive groups of the Iigninof Eucalyptus regnans., Appita, 23, 427-433, 1970.
61. Gagnaire, D., Robert, D., A polymer model of Iignin (DHP) l3C selectivelylabelled at the benzylic positions: synthesis and NMR study., Makromol Chem.,178, 1477-1495, 1977.
62. Lundquist, K., NMR studies of Iignins. 2. Interpretation of the lH NMR spectrumof acetylated brich lignin., Acta. Chem. Seand., B33, 27-30, 1979.
63. Lundquist, K., NMR studies of Iignins. 3. lH NMR spectroscopie data for Iigninmodel eompounds. Acta. Chem. Scand., B33, 418-420, 1979.
64. Lundquist, K., NMR studies of lignins. 4. Investigation of spruce Iignin by lHNMR spectroscopy., Acta. Chem. Scand., B34, 21-26, 1980.
65. Lundquist, K., NMR studies of lignins. 5. Investigation of non-derivatized spruceand birch lignin by IH nuclear magnetic resonance spectroscopy., Acta. Chem.
• 32

•Scand., B35, 497-501, 1981.
66. Marchessault, R. H., Coulombe, S., Morikawa, H., Roben, D., Characterizationof aspen exploded wood lignin. Cano J. Chem. 60, 2372-2382, 1982.
67. Hawkes, G. E., Smith, C. Z., Utley, J. H. P., Chum, H. L., Key structuralfeatures of acetone-soluble phenol-pulping Iignins by lH and 13e NMRspectroscopy., Holzforschung Suppl., 40, 115-123, 1986.
68. Gellerstedt, G., Gierer, J., The reactions of lignin during acidic sulphite pulping. ,Svensk. Papperstidn., 74, 117-127, 1971.
69. Johansson, B., Miksche, G. E., Über die benzyl-arylitherbindung im lignin n.Versuche an modellen., Acta Chem. Scand., 26, 289-308, 1972.
70. Glasser W. G., Gratzl, J. S., Collins, J. J., Forss, K., McCarthy, J. L., Lignin.XVI. Synthesis, nuclear magnetic resonance and mass spectroscopy of severa!monomeric and dimeric lignin-like sulfonates., Macromolecules, 6, 114-128,1973.
71. Sarkanen, K. V., Wallis, A. F. A., Oxidative dimerization of (E)- ans (Z)isoeugenol (2-methoxy-4-propenylphenol) and (E)- and (Z)-2,6-dimethoxy-4propenylphenol., JCS. Perkin 1., 1869-1878, 1973.
72. Nakatsubo, F., Higuchi, T., Synthesis of 1,2-diarylpropane-l,3-diols anddetermination of their configurations., Holzforschung, 29, 193-198, 1975.
73. Gellerstedt, G., Gierer, J., Pattersson, E. L.. Szabo-Lin, 1.. Über die reaktionendes lignins wahrend der neutralsulfitkochung, VI. Reaktionen vonzwischenprodukten des stilbentyps., Liebigs Ann. Chem., 2021-2036, 1976.
74. Lundquist, K., Olsson, T., NMRstudies of lignins. l.Signals due to protons infonnyl groups., Acta. Chem. Scand., B31, 788-792, 1977.
75. Ralph, J., Young, R. A., Stereochemical aspects of lignin model /j-aryl etherquinone methide reactions., 1. Wood Cbem. TechnoI., 3, 161-182, 1983.
76. Hauteville, M., Lundquist, K., von Unge. S., NMR studies of lignins. 7. lHNMR spectroscopie investigation of the distribution of erythro and threo fOnDSof /3-0-4 structures in lignins., Acta. Chem. Seand., B40, 30-35, 1986.
77. Ralph, J., Edé, R. M., Robinson, N. P., Main, L.. Reactions of l3-aryl ligninmodel quinone methides with anthrahydroquinone and antranol., J. Wood Chem.Tecbnol. t 7, 133-160, 1987.

•78. Brunow, G., Sipili, J., Mikeli, T., On the mechanism of formation of non-cyclie
benzyl ethers during lignin biosynthesis., Holzforschung, 43, 55-59, 1989.
79. Ede, R. M., Drunow, G., Simola, L. K., Lemmetyinen, J., Two-dimentional IH_IH ehemical shift correlation and J-resolved NMR studies on isolated and syntheticlignins., Holzforschung, 44, 95-101, 1990.
80. Bardet, M., Gagnaire, D., Nardin, R., Roben, D., Vincendon, M., Used 13Cenriched wood for structural NMR investigation of wood and wood components,cellulose, and lignin., Holzforschung Suppl., 40, 17-24, 1986.
81. Chua, M. G. S., Che'n, C. L., Chang, H. M., Kirk, T. K., 13C NMRspectroscopie study of spruce lignin degraded by Phanerochaete chrysoporium II.New structures., Holzforschung, 36, 165-172, 1982.
82. Gellerstedt, G., Robert, D., Quantitative 13C NMR analysis of kraft Iignins. ActaChem. Scand., 841, 541-546, 1987.
83. Kringstad, K. P., Morck, R., 13C NMR spectra of kraft lignins., Holzforschung,37, 237-244, 1983.
84. Lapierre, C., Monties, D., Guittet, E., Lallemand, J. Y., Photosynthetically 13Clabeled poplar lignins: 13C NMR experiments., Holzforschung, 38, 333-342,1984.
85. Hassi, H. Y., Chen, C. L., Gratzl, J. S., Carbon 13 NMR characterization ofIignosulfonates., Proc. Tappi Research and Development Conference, Appleton,WI., 249-260, 1984.
86. Obst, J. R., Landucci, L. L., Quantitative l3C NMR of lignins. Methoxyl: arylratio., Holzforscbung Suppl., 40, 87-92, 1986.
87. Ralph, J., Stereochemical aspects of addition reactions involving Iignin Madelquinonemethides., J. Wood Chem. TechnoL, 3, 161-181, 1983.
88. Robert, D., Bardet, M., Lundquist, K., von Unge, S., 13C NMR spectroscopiestudies of the distribution of erthro and threo fonns of various types of {j-O-4structures in lignins., Tappi Proc. Int. Symp. Wood pulp Chem., Raleigh, NC.,Tappi Press, Atlanta, 217-219, 1989.
89. Roben, D., Drunow, G., Quantitative estimation of hydroxyl groups in milledwood lignin from spruce and in a dehydrogenation polymer from coniferyl alcoholusing 13C NMR spectroscopy., Holzforschung, 38, 85-90, 1984.
tt 34

•
•
90. Landucci, L., Quantitative C-13 NMR cbaracterization of Iignin. A methodologyfor high precision., Holzforschung, 39, 355-359, 1985.
91. Lapierre, C., Monties, B., Guinet, E., Lallemand, J. Y., Quantitativemeasurements in hardwood lignin 13C NMR spectra., Holzforscbung, 39, 367-368,1984.
92. Robert, D., Gagnaire, D., Quantitative analysis of lignins by 1JC NMRspectroscopy., Proc. The Ekman Days lot. Symp. Wood pulp Chem., Stockholm,l, 86-88, 1981.
93. Nimz, H., Roben, D., Faix, O., Nemr, M., C-13 NMR spectra of lignin 8.·Stroctural differences betweeo Iignins of hardwoods, softwoods, and compressionwood., Holzforschung, 35, 16-26, 1981.
94. Gagnaire, G., Roben, D., A polymer model of lignin (DHP) 13C selectivelylabeled at the benzylic positions: synthesis and NMR study., Makromol. Chem.,178, 1477-1495, 1977.
95. Haider, K. Kem, H. W., Ernst, L., Intermediate steps of microbial lignindegradation as elucidated by 13C NMR spectroscopy of specifically 13C enrichedDHP lignins., Holzforschung, 39, 23-32, 1985.
96. Archipov, Y., Argyropoulos, D. S., Bolker, H. I. and Heitner, C., 31p NMRspectroscopy in wood chemistry. Part l, Model Compounds., J. Wood Chem.Technol., Il (2), 137-157, 1991.
97. Archipov, Y., Argyropoulos, D. S., Bolker, H. I. and Heitner, C., 31p NMR
spectroscopy in wood chemistry. Part n, Phosphite derivatives ofcarbohydrates., Carbohydrate Research, 220, 49-61, 1991.
98. Argyropoulos, D. S., Archipov, Y., Bolker, H. I. and Heitner, C., 31p NMRspectroscopy in wood chemistry. Pan IV, Lignin models: Spin-lanice relaxationtimes and solvent effects in 31p NMR., Holzforschung, 47(1), 50-56, 1992.
99. Argyropoulos, D. S., Bolker, H. 1., Heitner, C. and Archipov, Y., 31p NMRspectroscopy in wood chemistry. Pan V, Qualitative analysis of ligniD functionalgroups., J. Wood Chem. Tecbnol., 13(2), 187-212, 1993.
100. Argyropoulos, D. S., Quantitative Phosphorus-31 NMR analysis of Iignins. Anew tool for the lignin chemist., J. Wood Chem. Technol., 14(1), 45-63, 1994.
101. Argyropoulos, D. S., Quantitative Phosphorus-31 NMR analysis of six solublelignins., J. Wood Chem. Tecbnol., 14(1), 65-82, 1994.
35

•102. Argyropoulos, D. S., Heitner, C., and Morin, F., 31p NMR spectroscopy in wood
ehemistry. Part m. Solid state 31p NMR of trimethyl phosphite derivatives ofehromophores in mechanical pulp., Holzforschung, 46, 211-218, 1992.
103. Argyropoulos, D. S., Heitner, C., 31p NMR spectroscopy in wood chemistry. PartVI. Solid state 31p NMR of trimethyl phosphite derivatives of chromophores andcarboxcylic aeids present in mechanical pulps; a method for the quantitativedetermination of onho-quinones., Holzforschung, 48, 112-116, 1994.
104. Fillppov, V., Arehipov, Y., Argyropoulos, D. S., 4,4,S,S-tetramethyl-1,3,2dioxaphospholanyl ehloride-derivatization reagent for lignin funetional groupanalysis materials., 71b lot. Conf. Youog Seientists, Riga, Latvia, 1991.
105. Kostukevich, N. G., Fillppov, V. A., and Archipov, Y., Determination of thehydroxyl containing funetional groups of the oxygen-acetic aeid Iignins by 31p
NMR speetroseopy, 7lh Int. Sym. on Wood and Pulping chemistry, Beijing,China, 503-507, 1993.
106. Granata, A. and Argyropoulos, D. S., 2-Chloro-4,4,S,S-tetramethyl-1,3,2dioxaphospholane a reagent for the accurate detennination of the uneondensed andeondensed phenolie moieties in Iignins., 1. Agri. Food Chem., 43, 1538-1544,1995.
107. Jiang, Z. H., Argyropoulos, D. S., and Granata, A., Correlation analysis of 31p
NMR chemical shifts with substituent effects of phenols., Mag. Res. Chem., 33,375-382, 1995.
108. Sun, Y., Argyropoulos, D. S., Fundamental of high pressure oxygen and lowpressure oxygen-peroxide (Eop) delignification of softwood and hardwood kraftpulps; A eomparison., J. Pulp and Pap. Sei. 21, 185-190, 1995.
109. Brezny, R., and Sehraml, J., Silicon-29 NMR spectral studies of kraft lignin andrelated model compounds., Holzforschung, 41, 293-298, 1987.
110. Nieminen, O. J., Pulkkinen, E., and Rahkamaa, E., Determination of hydroxylgroups in kraft pine Iignin by Silicon-29 NMR spectroscopy., Holzforschung, 43,303-307, 1989.
111. Morris, G. A., Freeman, R., Enbancement of nuclear magnetic resonance signaisby polarization transfer., J. Am. Chem. Soc., 101, 760-762, 1979.
112. Bamm, D. P., Ernst, R. R., Net polarization transfer via a J-ordered state forsignal enhancement of low-sensitivity nuclei., J. Mag. Res., 39, 163-167, 1980.
~ 36

•113. DoddreU, D. M., Pegg, D. T., Assignment ofproton-decoupled carbon-13 spectra
of complex molecule by using polarization transfer speetroscopy. A superiormethod to off-resonance decoupling., J. Am. Chem. Soc., 102,.6388-6390, 1980.
•
114.
liS.
Barrelle, M., A new method for the quantitative 19p NMR spectroscopie analysisof hydroxyl groups in Iignins., Holzforschung, 47, 261-267, 1993.
Lachenal, D., Fernandes, J. C., and Froment, P., Behaviour of residuallignin .in kraft pulp during bleaching., J. Pulp and Pap. Sei., 21, 173-177, 1995.
37

•
•
Cbapter 2
Proton Spin-Lattiee Relaxation Time Measurements of SoUd Woodand its Constituents as a Fonedon of pH
2.0. ABSTRACT
Dy measuring the proton spin-lanice relaxation times (T1H) in the solid-state, for
black spnace softwood, the molecular mobilities of carbohydrates and Iignin have been
evaluated as a function of pH. Funhermore, in an effort to examine for possible
macromolecular conneetivities between lignin and cellulose, similar measurements were
carried out on isolated cellulose and cuoxam lignine These studies have shown that the
mobility of the polymerie constituents of wood is affected by the ionization of the
different functional groups, at different pH's (2-13). The analyses of the proton spin
lattice relaxation time data at constant humidity revealed that the maximum T1H for both
carbohydrates and lignin occurs at about neutrality while it was found to he depressed
at the two extremes of the pH range. Dy treating a wood sample with propylene oxide,
the esterification of the acid groups was affected, thus deactivating the ionization process
and their contribution to TIH• The experimental TIH values for cellulose and Iignin after
the esterification were significantly decreased at pH 6 confirming that their ionization
. plays a very significant role in determining chain mobility. To further substantiate our
findings, two additional sets of experiments were conducted which involved the
detennination of TIH values for isolated fully bleached cellulose and cuoxam Iignin as a
function of pH. The measured TIH values as a function of pH when combined
mathematically were found to semiquantitatively describe the pH dependence ofcellulose
and lignin present in solid wood in the pH range 5 to 10.
38

•
•
2.1. INTRODUCTION
Pulping is essentially the process of fiberizing wood1• The bonds which hold
fibres together in wood must he broken to such an extent tbat individual fibres can he
liberated from the wood stnlcture. Interfibre bonds can he weakened to the point of fibre
liberation using chemical, thermal and mechanical treatments. These treabnents can he
applied individually or in combination to produce a pulp of desired yield and quality. In
ail cases, an important step is the disroption of the lignin present in the middle lamella.
This May he achieved by softening the lignin in the middle lamella, thermally and/or
mechanically, or by degrading the lignin chemically2.
The process by which lignin is broken down and dissolved during pulping is
referred to as delignification. The ultimate goal of various delignification processes is the
production ofhigh yield pulp with superior physical and chemical propenies. However,
the efficient production of bright and stronger pulp at lower cost is not an easy task. This
may involve a combination of various chemical and thennal treatments. For example, it
has been shown that chemical pretreatment is more effective than presteaming in
promoting interfiber bonding but less effective in preserving tiber length3•
A number of studies have shown that mild sulphite treatments with sodium acid
sulphite3, sodium bisulphite4 , sodium sulphite-bisulphiteS and sodium sulphite6• 7, do
indeed produce chemimechanical (CMP)3-6, and chemithermomechanical (CTMP)3. 7,
pulps with strength properties superior to those of the corresponding rermer mechanical
(RMP) and thennomechanical (TMP) pulps. These sulphite treatments change the
polymerie properties of the wood biopolymers with concomitant increase in the strength
of CMP and CTMP pulps, produced from them. Sulphonation is lcnown to cause
progressive and irreversible softening of the Iignin and this effect has been held primarily
responsible for the strength increases exhibited by CMP and cTMP8. However, no
generally accepted relationship has been established between the polymerie propenies of
treated softwoods and pulp strength.
An important aspect in the various pulp treatments is the role of pH. The process
of fibre softening by sulphonation at several pH values has been examined9-11 and has
been attributed mainly due to the disroption of the surface charges of fibres and their
39

•
•
affinity toward various chemical additives during pulping, bleaching and paper-making
processes12• Proper pH control during the various stages of mechanical puIp production
is an important issue since the chemical properties of papers are significantly affected by
process history and the type and amount of the non-fibrous additives.
Understanding the molecular origin of the macroscopic behaviour of such pulps
May lead the way to further advances in both process and propenies of suc"h materials.
It is here that solid-state nuclear magnetic resonance techniques could malee notable
contributions toward comprehending the various morphological domains and the way in
which they influence the overall macroscopic properties of the different biopolymers
present in wood pulps. Indeed, recently developed techniques give promise to an
increasing role for NMR.
The introduction of cross-polarizationl3(CP) and magic angle spinningl4 (MAS)
were brought together by Schaefer and StejskaI1S in carbon-13 CP/MAS NMR
spectroscopy. These techniques paved the way for obtaining high resolution spectra of
solid wood samples with weil resolved signaIs for celluIosel6-18, hemiceUulose and
Iigninl9-21, for different wood samples22-25 •
The observations made in these studies contributed a considerable body of
knowledge on a variety of issues. For example, the analyses of 13C CP/MAS spectra have
cIearly demonstrated that the grinding of wood bas no influence on the crystallinity of
cellulose, wbereas bail milling converts "crystalline" cellulose to its amorphous form22 •
On another front, Matiel et al.26• 27 have succeeded in assigning the Most prominent
signaIs of CP/MAS spectral of various lignins specific functional groups.
Interest in NMR relaxation parameters bas shown a dramatic increase in the past
20 years. This interest bas developed for a number of reasons, probably the Most
impottant heing that it is essential for one to have a knowledge of nuclear relaxation rates
in order to use efficiently a pulse Fourier transform NMR spectrometer. Furtbermore,
it is relatively easy to measure NMR relaxation parameters using such a spectrometer.
The ease with which relaxation parameters can be measured has enabIed spectroscopists
to demonstrate and, to sorne extent, rediscover tbat these parameters are capable of
providing important dynamic information such as (i) molecular rotational and angular-
40

•
•
momentum correlation times, 1'2 and Tc, respectively, (ii) translational diffusion constants,
and (iH) inter- and intramolecular exchange rates. The dependence of sorne relaxation
parameters on nuclear-nuclear separations (bond lengtbs) allows one to use tbese
parameters to assist in the detennination of molecular structure.
The most commonly measured NMR relaxation parameters are the spin-lanice
relaxation time Tl' the spin-spin relaxation T2, the spin-lanice relaxation lime in the
rotating frame Tlp' and the nuclear Overhauser enhancement factor. The longitudinal
(spin-lanice) relaxation time represents a measure of the time required for energy to pass
from the spin system to other degrees of freedom. The transverse (spin-spin) relaxation
time refers to thennal equilibrium witbin the spin system itself. According to the theory
of nuclear magnetic relaxation of Solomon28, Tl and T2are fonctions ofa correlation time
Tc. The correlation time is the time a molecule takes to tum through a radian or to move
through a distance comparable to its own dimensions. The main advantage of these
spectroscopie techniques is that it provides a detailed analysis of molecular motion al
molecular leveI.
In recent years considerable effort has been devoted to the study of
macromolecular dynamics as detennined from nuclear magnetic relaxation parameters for
probing molecular motion29-32 and miscibility33. 34 of polymerie blends. The examination
of epoxy polymers35-37, polyesters36. 38-410, polycarbonates41. 42, polyphenylenes43,
polyphenylene oxides29, polyphenylene sulfones29, polyphenylene sulfides38, polystyrene35.
42, polyimides42 and heteroaromatic polymers44 are just a few examples of such
applications.
The advent of these applications bas provided a novel approach toward
investigating the polymerie components of soUd WOod19• 23. 25.45-52 in a nondestructive
manner. Techniques such as proton and carbon spin-lanice (TIH, Tld, spin-spin {T:J and
spin-lanice in a rotating frame (Tlp), relaxation measurements were implemented for
elucidating microstructural details of lignin-carbohydrate linkages2S• 45-50 which were
otherwise impossible with solution NMR spectroscopy. Consequently, solid-state NMR
techniques have opened up new avenues for studying the various morphological and
structural features of wood.
41

•
•
2.1.1. Effect of Moisture on Spin-Lattice Relaxation Parameters of Wood
Wood normally contains water. The amount of water can reach levels such that
it dominates the proton NMR signal. Barly NMR studies conducted on water in woodSJ•
54 and in cellulosic gels55• 56 reported a multi-exponential behaviour of relaxation times.
These studies concluded that such hehaviour of relaxation was due to part of the water
being intimately associated to the cell wall components, while another part was present
in the cell lumen and free ta diffuse. The presence of water is known to plasticize wood
components57• Plasticization increases the mobility of the wood polymers and
consequently May reduce the cross polarization (CP) efficiency at room temperatureS2•
Newmanso. s., Willis and Herring23 have noted that spin relaxation parameters May be
affected by the amount of water present on a wood sample. In addition, Newman5l has
shown that TIH values were much longer for dry wood than for wet wood. On the other
band, Willis and Herring23 reported that moisture is known to enhance signal to noise and
improve the resolution of a l3C CP/MAS NMR spectnlm in comparison ta a dry sample.
They concluded23 that hydration has an effect on both the carbohydrate and the lignin
components of wood. However, the effect of hydration for aliphatic carbons of the
carbohydrates and Iignin is more augmented than the aromatic carbons of lignin present
within a soUd wood sample.
The actual chemical shift values also give indications regarding the effect of water
on cellulose38• Dy increasing the moisture of cellulose from 0.5 to 16~ the principle
signais of cellulose shift a few ppm to higher field. A similar, but much smaller shift was
also observed for cellulose acetate. The spin-lanice relaxation time (T.) for Cl, C2, C3,
and C4 diminish with iDcreased moisture contents. However, for the case of C6 there is
no significant change. For cellulose acetate, qualitatively a similar behaviour was
observed38•
An important recommendationso therefore emerges on reponing proton spin
relaxation limes Le. the water content of the sample in question needs to he spec~fied .
42

•
•
2.1.2. Effect of Paramagnetic Metals on Spin-Lattice Relaxation Parameters ofWood
Another factor which may seriously affect the magnitude of proton Tl values in
wood and pulp samples is the presence of paramagnetic impurities58 such as Fe, Mg, Cu,
Mn, etc. The influence of paramagnetic impurities on nuclear relaxation takes place via
interactions with the fluctuating magnetic fields. The interaction of the unpaired spins of
paramagnetic impurities with the protons of carbohydrates and Iignin can cause
fluctuation of the magnetic intensity. Any fluctuation of magnetic intensity at a nucleus
can cause spin transition if it bas components of a suitable frequency. Since the magnetic
moment' of the electron is much larger (650 times) than that of the nucleus, even small
traces of paramagnetic species in the sample can dramatically reduce the measured
relaxation times. Before measuring relaxation times care must he taken to remove these
impurities from wood or pulps since wood is known to contain a number of such
paramagnetic centers59•
In actual fact the dependency of proton spin-Iattice relaxation times for lignin and
carbohydrates as a function of total ionic contents, for a series of sulphonated pulp
sampies were measured and quantified by Argyropoulos and Morin60• They observed that
aCter removal of the paramagnetic metal ion impurities from wood and pulp samples, the
proton Tl values were significantiy decreased.
2.1.3. Effect of Static Magnetic Field on Spin-Lattice Relaxation Parameters ofWood
The field of a spectrometer can also affect the relaxation parameters of Many
nuclei in a complex way (apan from modifications resulting from changing the second
order nature of the spectrurn), once the extreme narrowing limit is exceeded. This occurs
once the Larmor frequency of the nucleus being detected, or any nucleus to which it is
spin coupled, e.g. IH, approaches or exceeds the reciprocal of the molecular correlation
time. Under these conditions, which are increasingly encountered as magnet fields
increase, relaxation characteristics change, the NOE decreases, and can even invert in
sign6l , Tl will exceed T2 and consequently the efficiency of NMR decreases.
43

•
•
Argyropoulos et al.62 have measured the proton spin-Iattice relaxation parameters
of the two principle biopolymers of wood at different magnetic fields (at 100 and 300
MHz). They concluded that a three fold increase in the static magnetic field caused an
increase in the Tl values. However, the difference in proton spin-lattice relaxation time
values for both carbohydrates and lignin within the two fields, remains the same.
2.1.4. Effect of Temperature on Spin-Lattice Relaxation Parameters of Wood
Temperature can also influence the magnitude of spin relaxation measurements.
Several studies have shown that the Tl minimum is close to room temperature, while at
above and below room temperature TIH values raised62•
63• Nevertheless, if the spin-Iattice
relaxation time is studied as a function of temperature, a Tl minimum cecurs for each
temperature where a particular process (e.g., side group motion) has WOTr; - 164•
In light of the above considerable effons to avoid any unqualified contributions
to the spin-lanice relaxation times were made during our measurements.
In this chapter we document our measurements of proton spin-lanice relaxation
times for wood, isolated cellulose and Iignin as a function of pH. This was done in an
effort to obtain further information into the structure of wood and the effect of pH on it.
The derived infonnation is discussed in lerms of the macromolecular connectivities that
exist between cellulose and lignin in wood and the effect of ionization of the various
functional groups on its physico-chemical propenies.
44

•
•
2.2. EXPERIMENTAL
2.2.1. Materials and Methods
2.2.1.1. Preparation
A trunk section of a black spruce (Picea mariana) tree was pulverized into
sawdust. The sawdust was suspended in acetone three times to eliminate the water. Only
the sample was then allowed to dry under ambient conditions and fmatly subjected to
Wiley-milling to 20 mesh.
Cellulose
The cellulosic material was provided by Dr. T. Scallan of PAPRICAN. The
cellulose (Q90) was commercially prepared i.e., from fully bleached black spruce kraft
pulp. The letter "Q" is an abbreviation for the Quevillon mill in northern Québec, and
the number "90" is the brightness of the sample.
Cuoxam Lignin
In an attempt to isolate intact lignin, wood meal from a selected spruce log was
extracted for 48 hours with hot benzene-alcohol (1: 1). The wood meal was then
degummed by treating it twice with 5% sodium hydroxide for 24 hours and washing it
successively with water, dilute acetic acid, and again with water. To remove the easily
hydrolysed carbohydrates, such as pentosans and hemicelluloses, the wood meal was
retluxed for 1-2 hours with 1% sulfuric acid, washed, and dried in the air. The wood
Meal thus prepared was then shaken for 12 hours with Schweizer's reagent
[CU(NH3)4](OH)1' using 750 mL for 50 g wood Meal. The lignin was separated by
centrifuging and washed in the centrifuge jar successively with Schweizer's reagent,
concentrated ammonia, water, and dilute sulfuric acid (1 % w/v, 2L). It was then filtered
and washed with \vater. The hydrolysis with 1% sulfuric acid and the extraction with
cuprammonium hydroxide were repeated five times. The isolated insoluble lignin was a
light yellow-brown powder. The lignin thus obtained is referred to in the Iiterature as
"Freudenberg", "cuproxam", or "cuoxamlt lignin6S.
45
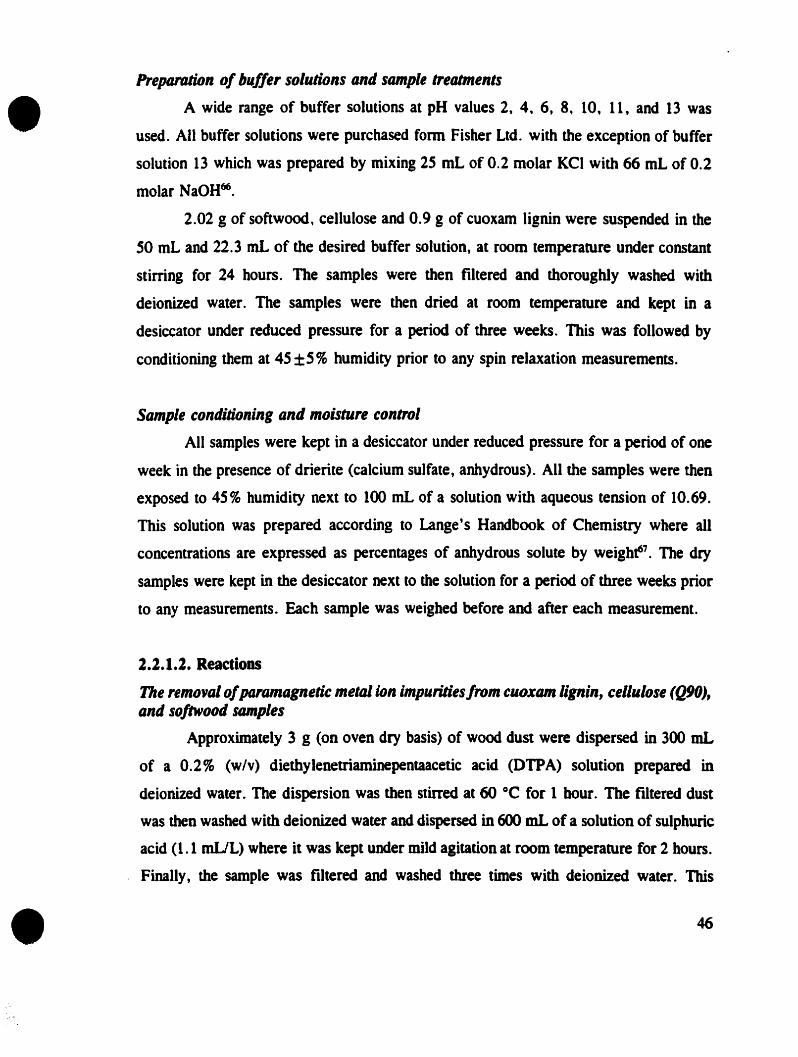
Preparation of buffer solutions and sample treatments
A wide range of buffer solutions at pH values 2, 4, 6, 8, 10, Il, and 13 was
used. Ail buffer solutions were purchased form Fisher Ltd. with the exception of buffer
solution 13 which was prepared by mixing 25 mL of 0.2 molar KCI with 66 mL of 0.2
molar NaOH66.
2.02 g of softwood, cellulose and 0.9 g of cuoxam lignin were suspended in the
SO mL and 22.3 mL of the desired buffer solution, at room temperature under constant
stining for 24 hours. The samples were then filtered and thoroughly washed with
deionized water. The samples were then dried al room temperature and kept in a
desiccator uoder reduced pressure for a period of three weeks. This was followed by
conditioning them at 4S ±S% humidity prior to any spin relaxation measurements.
Sample conditioning and moisture control
Ali samples were kept in a desiccator under reduced pressure for a period of one
week in the presence of drierite (calcium sulfate, anhydrous). Ali the samples were then
exposed to 45% humidity next to 100 mL of a solution with aqueous tension of 10.69.
This solution was prepared according to Lange's Handbook of Chemistry where ail
concentrations are expressed as percentages of anhydrous solute by weight67• The dry
samples were kept in the desiccator next to the solution for a period of three weeks prior
to any measurements. Each sample was weighed before and after each measurement.
2.2.1.2. Reactions
The remoyal ofJHUanlagnetic metal ion impurities/rom clloxam lignin, cellulose (QfO),and so/twood samples
Approximately 3 g (on oven dry basis) of wood dust were dispersed in 300 mL
of a 0.2% (w/v) diethylenetriaminepentaacetic acid (DTPA) solution prepared in
deionized water. The dispersion was then stirred at 60 oC for 1 bour. The ftltered dust
was then washed with deionized water and dispersed in 600 mL of a solution of sulphuric
acid (1.1 mUL) where il was kept under mild agitation at room temperature for 2 hours.
FinallY' the sample was ftltered and washed three times with deionized water. This
46

•
•
procedure was used for ail the samples examined in tbis work. The only exception was
cuoxam lignin wbere sulphuric acid was replaced with 0.2% (v/v) nitric acid aimed at
removing copper ions more effectively.
DeterminGlion of carbohydrate composition of extractive-free samples
The isolated filtrates from sawdust, cellulose (Q90), and cuxoam lignin after being
suspended in the wide range of buffer solutions, were isolated and analyzed for the
presence of various sugars and in particular, arabinose, xylose, galactose, and glucose
by Mean of gas chromatography. This was carried out for ail treated samples. The only
sugar detected was xylan for the treaUDent of black spruce softwood dust at pH 13 as a
concentration of 116 mg/L.
Esterification of carboxylic acid groups in soltwood sample with propylene oxide l08
The acid groups of approximately 2-3 g (oven dry weight) of the sawdust sample
were first exchanged to their acidic fonns by suspending the sample at 1% consistency
in 0.1 N Hel solution under gentle agitation for 1.0 hour. The sample was filtered and
the procedure repeated. After thorough washing with deionized water, the sample was
dispersed in 400 mL of a 37%-by-weight solution of propylene oxide in water68, and
allowed to react for 7 days at room temperature . Excess propylene oxide was removed
by washing the sample with deionized water.
%.%.1.3. Instrumentation
13CP MAS NMR and proton T, measurements
Ail samples were conditioned at 45 ±5% relative humidity prior to any
measurements, so as the effect of moisture content on the measured parameters was
eliminated. Proton spin-lanice relaxation time measurements were carried out via carbon.
On a Chemagnetics M-100 spectrometer operating at a 13C frequency of25.12 MHz. Ali
CP/MAS experiments were performed with a spinning rate of 4 kHz, a contact time of
1 ms and proton 1r/2 pulses Qf 4.5-5.0 ILS duration.
The proton spin-lanice relaxation times were measured from the 13C cross-
47

•polarized spectra immediately after the application of a fr-T-fr!2 pulse sequence to the
proton spins. The Tl data was fitted to the following three parameter equation:
(2.1J
•
where TIR is the proton spin-lattice relaxation lime ~-aD is the equilibrium magnetization
and 0: is the inversion efficiency of the proton fr pulse. For perfeet inversion a =1.0; the
values of 0: ranged between 0.80 and 0.90 s. In ail relaxation experiments, recycle times
of at least S x Tl were used, typically with 9 different T values. In order to reduce errors
due to instrument drift (variations in amplifier output etc.), the order of the T values was
scrambled. In addition, the data were colleeted in blacks, i.e., 1000 transients with the
first T value, then 1000 with the second and so on through to the last value. The
experiment then retumed to the beginning of the Iist and 1000 more transients were
added to the corresponding data set previously accumulated. The Iist was run tbrough in
this manner until an adequate signal to noise ratio was reached (usually 4000-8000
traDsients in total for each T value). SPectra were obtained on 7 different T values prior
ta the application of equation 2.1. The proton spin-Iattice relaxation values for
carbohydrates and lignin were derived by measuring the intensity of the signais at 72.4
and 148.2 ppm respectively60· 62. Similar measurements were also carried out for isolated
cellulose (Q90) and cuoxam lignine
48
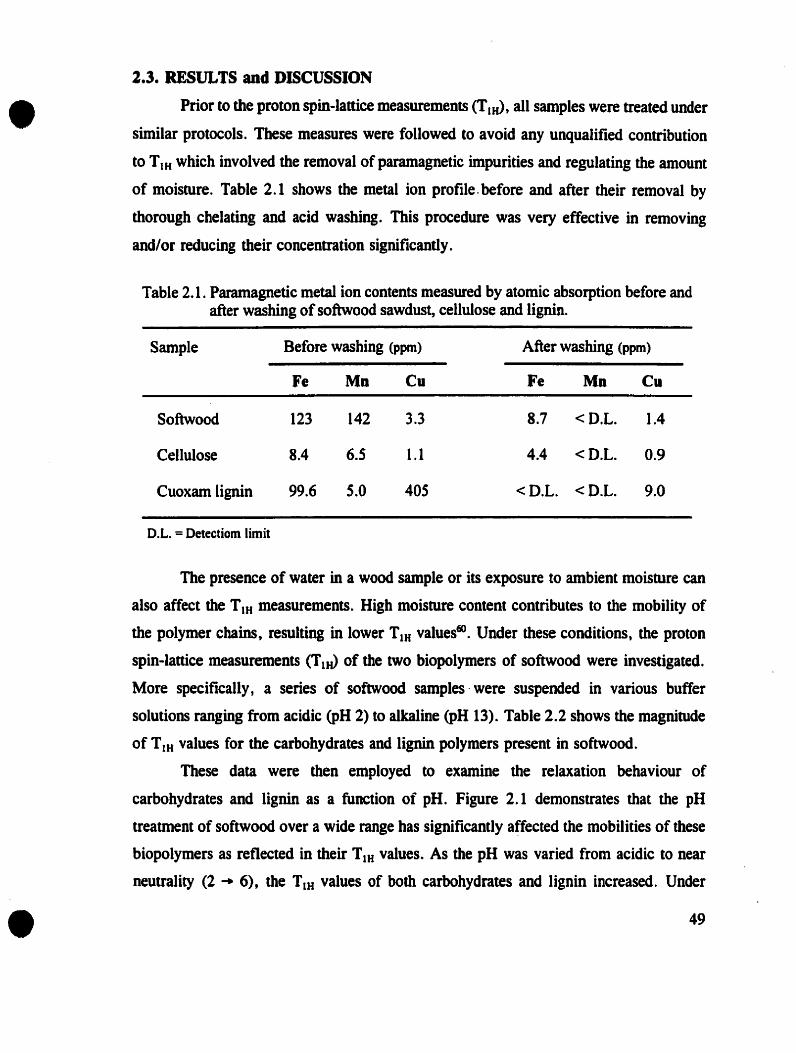
•
•
2.3. RESULTS and DISCUSSION
Prior to the proton spin-Iattice measurements (Tu'>, all samples were treated under
similar protocols. These measures were followed to avoid any unqualified contribution
to T lH which involved the removal of paramagnetic impurities and regulating the amount
of moisture. Table 2.1 shows the metal ion profl1e. before and after their removal by
thorough chelating and acid washing. This procedure was very effective in removing
and/or reducing their concentration significandy.
Table 2.1. Paramagnetic Metal ion contents measured by atomic absorption before andafter washing ofsoftwood sawdust, cellulose and Hgnin.
Sample Before washing (ppm) After washing (ppm)
Fe Mn Cu Fe Mn Cu
Softwood 123 142 3.3 8.7 <D.L. 1.4
Cellulose 8.4 6.S 1.1 4.4 <D.L. 0.9
Cuoxam lignin 99.6 5.0 405 <D.L. <D.L. 9.0
D.L. =Detectiom Iimit
The presence of water in a wood sample or its exposure to ambient moisture can
also affect the T lH measurements. High moisture content contributes to the mobility of
the polymer chains, resulting in lower TIH values60• Under these conditions, the proton
spin-lanice measurements (TlIJ of the (wo biopolymers of softwood were investigated.
More specifically, a series of softwood samples' were suspended in various buffer
solutions ranging from acidic (pH 2) to alkaline (pH 13). Table 2.2 shows the magnitude
of TIH values for the carbohydrates and lignin polymers present in softwood.
These data were then employed to examine the relaxation behaviour of
carbohydrates and lignin as a function of pH. Figure 2.1 demonstrates that the pH
trealment of softwood over a wide range has significantly affected the mobilities of these
biopolymers as retlected in their TIH values. As the pH was varied from acidic to near
neutrality (2 ... 6), the TIH values of both carbohydrates and lignin increased. Under
49

•alkaline conditions the opposite was apparent. As the pH changed from near neutrality
toward alkalinity (6 ~ 13), the Tm values decreased. The maximum T1H values were
obtained at about neutrality, i.e. pH 6. However, a striking feature of these data is that
the T1H values of these biopolymers qualitatively follow each other as a function of pH.
This trend is similar to that reponed by Argyropoulos et al.6O, 62 and May he indicative
of the presence of molecular connectivities between the lignin and carbohydrates.
Table 2.2. Spin-Iattice relaxation time for cellulose and Iignin signal for softwoodsawdust as a function of pH.
Entry pH Spin-lattice relaxation time (T tH) (ms)
1IIIIIIVVVIVII
246810Il13
Cellulose (1)
393 ± 16412± 4777 ± 19576 ± 15482± 36285± 5299 ± 12
L· . (1)19mD
377 ± 20391 ± 26661 ± 43515 ± 46476±26317 ± 13296±22
•
(1) Measured via the C-13 signal at 72.4 ppm
(2) Measured via the C-13 signal at 148.2 ppm
The observed variation in the TtH values as a function of pH could he anributed
to the modification of the macromolecular structure of the wood components. Large
variations in pH May affect the functional groups of the individual wood components by
inducing diople-dipole, ion-dipole, or hydrogen-bonding interactions. The formation of
hydrogen bonds by free OH groups69, ionization of various functional groups attached to
the macromolecular network70 and the formation of ionic aggregatesS8,71 can ail alter the
physical and dynamic mechanical properties72 of wood and their proton spin relaxation
values. Lindherg et al. 73 have actually documented the variation of spin-Iattice relaxation
values for a number of chemically modified wood samples. Their measurements provided
information regarding small changes in the composition of carbohydrates and lignin as
caused by various chemical agents. However, the Most significant account on the effect
50
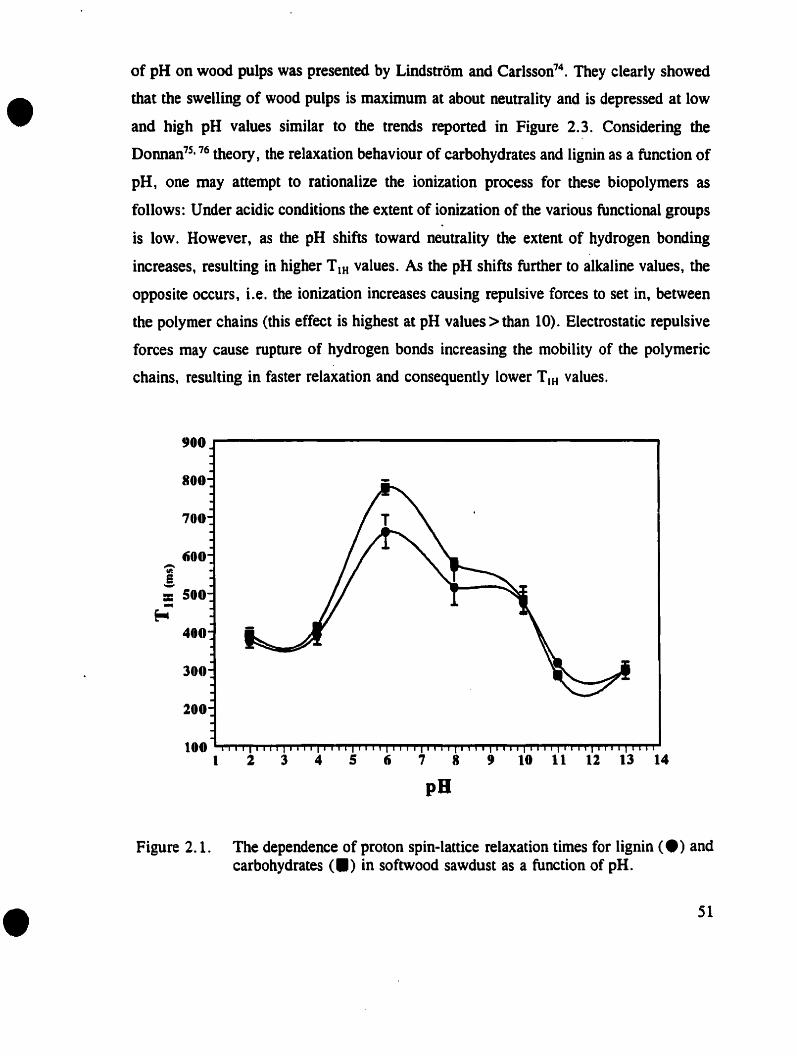
•of pH on wood pulps was presented by Lindstrom and Carlsson74
• They clearly showed
that the swelling of wood pulps is maximum at about neutrality and is depressed at low
and high pH values similar to the trends reported in Figure 2.3. Considering the
Donnan7S•76 theory, the relaxation behaviour of carbohydrates and lignin as a function of
pH, one may attempt to rationalize the ionization process for these biopolymers as
follows: Under acidic conditions the extent of ionization of the various functional groups
is lo\v. However, as the pH shifts toward neutrality the extent of hydrogen bonding
increases, resulting in higher T IH values. As the pH shifts further to alkaline values, the
opposite occurs 7 Le. the ionization increases causing repulsive forces to set in, between
the polymer chains (this effect is highest at pH values> than 10). Electrostatic repulsive
forces May cause rupture of hydrogen bonds increasing the mobility of the polymerie
chains, resulting in faster relaxation and consequently lower TlH values.
900
800
700
600-IIIa-=500...~
400
300
200
1001 2 3 4 5 fi 7 8 , 10 Il 12 13 14
pB
•Figure 2.1. The dependence of proton spin-lattice relaxation times for lignin (.) and
carbohydrates (.) in softwood sawdust as a function of pH.
51

•
•
Aeidie groups such as earboxyl, phenolie and even enolie hydroxyl groups present
within the lignocellulosie matrix can he ionized at pH values greater than 1077• Primary
and secondary carbohydrate hydroxyl groups78 May ooly partially ionize in a1kaline
solutions due to their weakly acidie nature79-83.
As previously mentioned, the longest TIH values for carbohydrates and lignin were
observed al pH 6. At this pH, the differenee in TIR values between these two polymerie
components of wood were augmented. A number of literature aceounts have provided
funher support on the significance of pH near neutrality for chemically modified wood
samples. Rowell et al. 84 have reported that the acetyl groups of acetylated wood is most
stable at pH 6 while Farrer and Neale8S have eonsidered the carboxylic acid groups to be
the active speeies affecting swelling near neutrality. The contribution of earboxylic acid
groups toward dynamie relaxation was examined by Nakano as a function of pH's. They
coneluded that the side-ehains of suceinylated wood ionize in solutions above pH 586• For
these reasons, during this effort greater attention was paid on the role of carboxylic acid
groups at pH 6. Dy treating a wood sample with propylene oxide68 , the esterification of
the acid groups was affeeted; thus ~eactivating the ionization process and their
contributions to TIH • In addition, the carboxylie protons were displaced with longer
propylene groups. Both of these are expeeted to increase the mobility of the polymer
ehains allowing for faster relaxation. Indeed the experimental TIH values for cellulose and
Iignin after the esterification were significantly decreased at pH 6. Table 2.3 and Figure
2.2 shows the magnitude of these relaxation times and compares them at pH 6 before and
after esterification.
In an effort to ascenain and further substantiate our TlH measurements, four
samples of softwood sawdust were exposed al various pH's and their TIR values were
measured al 45% moisture. This set of experiments assured that the reproducibility of
our data was adequate for the purposes of this work. The aforementioned reprodueibility
data is presented in Table 2.4 showing an excellent agreement to that of Table 2.2.
52

Table 2.3. Spin-lattice relaxation time data for cellulose and Iignin signais for softwoodsawdust at pH 6 before and after esterification ofcarboxylic acids.
• Entry pH Spin-lattice relaxation time (T 1H) (ms)
1II·
66
Cellulose
777 ± 19597 ± 24
Lignin
661 ± 43509 ± 64
*Measurements after esterification
900
SOO
700
600-li!!=500-E-c
400
301
201
1011 2 3 4 5 Ci 7 8 9 11 Il 1% 13 14
pB
•Figure 2.2. The dependence of proton spin-Iattice relaxation times for lignin (.) and
carbohydrates (.) in softwood sawdust before and after (---) esterificationat pH 6.
53

• Table 2.4. Evaluation ofspin-lanice relaxation time for cellulose and Iignin in softwoodsawdust as a function ofpH, at 45% relative humidity.
Entry pH Spin-lanice relaxation time (T IH) (ms)
1IIIIIIV
241013
391 ± 6404± 6488 ± 12300± 4
366 ± 17393 ± 22475 ± 28300 ± 31
•
(1) Measured via C·13 signal at 72.4 ppm
(%) Measured via C-13 signal at 148.2 ppm
ln an effort to funher substantiate and comprehend our fmdings, two additional
sets of experiments were conducted. These involved the detennination of TlH values of
isolated fully bleached cellulose and cuoxam lignin as a fonction of pH. These
measurements were carried out in exact analogy to the experimental protocols followed
for softwood sawdust. These studies were so designed as to provide the contributions of
the individual components to the overail relaxation behaviour of sofiwood87•92•
2.3.1. Cellulose (Q90)
ln nature, cellulose exists as microfibrils of varying dimensions93• 94. These are
aggregates of parallel chains of cellulose macromolecules which are held together by
hydrogen bonding. However, as in all crystalline polymers, there are amorphous regioDS
within cellulose. These regions occur when the chains are not oriented parallel to each
other.
Rorii et al.9S have shown that carbon-l3 spin-lanice relaxation limes (Ttc) are
longer for crystalline than non-crystalline cellulose. In the crystalline regions of cellulose
the chains are held together by cellulose-cellulose hydrogen bonds. This interchain
bonding would result in rigidity of the crystalline regions which would not permit partial
rotation of the anhydrocellulose rings without breaking hydrogen bonds. Rowever, in the
S4

•
•
amorphous regions of the polymer, the decreased packing density of the chains probably
Pennits the cellulose rings to undergo partial rotation63 •
Other observations on various material characteristics ofcellulose hydrogels, such
as dynamic mechanical96, mechanical and swelling970103, thermoelasticity99 and swelling
kinetics100 have been studied by means of NMR and Raman spectroscopy. However, the
effect of ionization on Tin for cellulose as a function of pH bas not been examined
before.
The surface charge of cellulose arises from the dissociation of acidic group and
this depends on pHI04 • At high pH's, the acidic groups exist in their dissociated salt form
and the surface charge is substantially negative, whereas at low pH's, the acid groups
exist in a largely undissociated form and the surface charge is closer to zero (the
isoelectric point) or it may even become slightly positive.
. The proton spin-Iattice relaxation limes for a series of cellulose samples (Q90)
were measured as a function of pH. These data are depicted in Figure 2.3 indicating tbat
the Tin values increased as the pH was changed from acidic to neutral, reaching its
maxima at pH 6. Above this pH the TlH was reduced up to pH 10, then increased again
for pH Il and 13. The Tin relaxation behaviour of isolated cellulose is very similar to
the corresponding carbohydrate measurements for softwood. The only sigoificant
difference was observed beyond pH 10. The TIH values of cellulose were found to be
higher by 400 and 500 ms at pH II and 13 respectively when compared to the TIH
measurements of the carbobydrate component in softwood.
Neale'9-81 considered the hydroxyl groups as very weak acids capable of forming
sodium salts. Because of the very low dissociation constants of the hydroxyl groups,
conversion to the sodium salt and subsequent swelling by necessity occurs at very high
alkalinities. For example, he calculated an ionization constant of Ka=1.84xIO-14 (pKa=13.74 at 25 OC) assuming that only one hydroxyl group per anhydroglucose unit is
ionized, below 20% NaOH. In this case Ka represents the sum of the ionization constants
for three hydroxyls per anhydroglucose unit. Neale'9-81 also concluded that the glucose
uoits in cellulose behave like weak acids with an approximate pKa value of 13.7. An
approximation of pKa values for a number of functional groups associated in cellulosic
55

materials have been reportedlOS, Ul6 •
• Table 2.5. Spin-Iattice relaxation time for isolated cellulose (Q90) and cuoxam ligninas a function of pH.
Entry pH Spin-Iattice relaxation time (T 1H) (ms)
Cellulose (Q90) (1) Cuoxam Lignin(Z)
1IIIIIIVVVIVII
246810Il13
700 ± 13841 ± 15849 ± 29781 ± 9688± 5693 ± 24791 ± 14
315 ± 15328 ±25353 ± 12366± 4375 ± 7346 ± 19232 ± 14
(1) Measured via C-13 signal al 72.4 ppm
(1) Measured via C-13 signal al 148.2 ppm
910 .....-----------------------.
851
810
'Üi'E-=750~
~
711
651
fiO0 ..,.,.1""P""P''I''TT''I''TT'T''I'"'I'',..,..,.'''''"'''""''I"'"'..,..,.,..,.,.,..,.,.,..,.,.,.''TT'T''TT''I'''T'T''I~''''I''''r''''I''''I''''r''''I~rTT''1'''\'''T'''
1 2 3 4 5 Ci 7 8 9 10 Il 12 13 14
pB
Figure 2.3. The dependence ofproton spin-lanice relaxation times for isolated cellulose(.) as a function of pH.
• 56

•Carboxylic acid groups which are present in the pectic components and in 4-0-methyl
glucuronic acid unit8 of xylan hemicelluloses, have an approximate pKa value of 4.5
(Ka=3.16x10·S)I05. Furthermore, the dissociation constants of the primary and secondary
hydroxyl groups of carbohydrates were found to he O.93x10·14 and O.02Sxl0·14
respectivelyl06. Considering these data an attempt was made to rationalize the impact of
ionization of the different functional groups of cellulose on the behaviour of TIH as a
function of pH. Figure 2.4 shows the calculated degrees of ionization as a function of pH
for the different functional groups of cellulose. Therefore, it is not surprising to see that
the TIH values in Figure 2.4 increased since the ionization of most cellulosic functional
groups occurs at pH Il and above. It is noteworthy to mention at this point, that after
treatment of cellulose al pH 13, (66 mL O.2M NaOH and 25 mL of O.2M KCI) the
resulting material tumed to light-yellow in calour and hardened. This physical change
was manifested in the increased TIH values for samples exposed at this pH (Figure 2.3).
The possibility of conversion ofcellulose 1to cellulose II under highly alkaline conditions
(>3M), was also considered. However, the 13C CP/MAS spectral analysis of cellulose
exposed at this pH did not exhibit aoy additional Cl signal due to mercerization.
20
,=1 15
=-....."N-. tO1:
=..~
5
O .......'P"I'II"""""'""""''"'''''''''I....''''''''''''r''''r'''I'..,.,..,...,~I''''P''P"'....'I''"t''''I'''''I'"P'I'.,.,..tp.p.,..,.P''P''I'''',.,.,.''I''r'T.,.,~1 2 3 4 5 fi 7 8 9 tO Il t2 13 14
pB
•Figure 2.4.. Percent ionization for cellulose (.), glucose in cellulose (.),
primary (0) and secondary hydroxyl (e) groups in cellulose.
57

•
•
2.3.2. Cuoxam Lignin
Unlike cellulose, the TlH plots for cuoxam lignin as a function of pH did not
behave in qualitative similarity to the corresponding measurements for lignin in softwood
(Figure 2.5). These measurements showed that the T1R values iDcreased from pH 2 to a
maximum value at pH 10. After this pH, the mobility of lignin was found to increase
dramatically as evidenced by the reduced T1R values. This is to be expected since the
alkaline treatment of ligniD is known to soften its macromolecular structure even allowing
its dissolution.
450
400
350
-IIIa-=300...~
250
200
1501 2 3 4 5 6 7 8 9 18 Il 12 13 14
pH
Figure 2.5. The dependence of proton spin-lattice relaxation times for isolated lignin(e) as a function of pH.
Lignin is known to behave as a spherical, amorphous macromolecule59• 107-109 of
a polydisperse molecular weight distribution. The swelling behaviour of these materials
was found- to be similar to that of polyelectrolyte networks110. Floryl11 has suggested that
crosslikned polyelectrolytes swell at elevated pH's due to the effect of ionization on
58

•
•
conformation. The ionization effect is attributed to the presence ofcarboxylic acid groups
which are known to form intermolecular hydrogen bonds within the .lignin network
stmcture110 via the abundant free phenolic hydroxyl groups112• Consequently, the extent
of ionization of these two functional groups and their contribution to TtH at various pH's
were examined. On the basis of approximate pKa values for carboxylic acids
(pKa=4.5)IOS and free phenolic hydroxyl groups (pKa= 10.21)105 the percent ionization
of these groups were calculated as a function of pH (Figure 2.6).
100
90
'80
= 70
=.- 60....NN
50.-==- 40~ 30
20
10
01 2 3 4 5 fi 7 8 , 10 Il 12 13 14
pB
Figure 2.6. Percent ionization of carboxylic acids (0), and free phenolic hydroxyls( 0) groups in Iignin.
These calculations show that the carboxylic acid groups were nearly fully ionized
at pH 6. However, the free phenolic hydroxyl groups began to ionize at pH 10 (40%).
At this point, the TIH values started to decrease. As the ionization of these groups
proceeded to maximum (pH 11 and 13), tbe mobility of the lignin macromolecular
network increased significantly contributing to ilS alkaline softening.
59

•2.3.3. Correlation of the Cellulose and Lignin TlH Measurements with those of Wood
In an effort to obtain a better insight on the significance of our measurements so
far and to examine for possible molecular connectivities between lignin and carbohydrates
in wood, the T1H data for cellulose (Q90) and cuoxam lignin as a function of pH were
compared to the corresponding measurements for wood (Figure 2.7). To facilitate
comparison of these data to those of softwood (Figure 2.1), they were plotted on the
2 3 4 5 6 7 8 9 10 Il 12 13 14
pH
same scale.
900
800
700
600-IIIe-= 500-E-t400
300
100
1001
Figure 2.7. Proton spin-Iattice relaxation times for isolated cellulose (.) and cuoxamlignin (.) and as a function of pH.
•
These data shows that the magnitude of the T1H values for isolated cellulose were
higher to that obtained for the carbohydrate signais in wood. Nonetheless, the trend of
their relaxation behaviour seems to be very similar to that of the carbohydrates in wood.
On the other hand, the TIH values for cuoxam lignin was relatively close to those
measured in softwood with the exception of pH's 6, 8, and 10. However, compared to
60

•softwood, the relaxation trends as a fonction of pH were found to he quite different.
The comparison of the overall relaxation data bas lead to another significant
observation. Contrary to the overall relaxation trends observed for lignin and
carbohydrates in softwood, the relaxation behaviour of cellulose did not follow by that
of lignine The main reason for such discrepancy between the two sets of data is likely
attributed to the lack of molecular connectivities and .the absence of hemicelluloses that
May associate (i.e. lignin carbohydrate complexes)1I3-1I5 these two polymers in wood.
Supponing evidence for such observation was obtained by examining their relaxation
bebaviour with those of softwood' especially beyond pH 10.
The comparison of these plots shows that the TIH trends for the two isolated
polymers behave differently (Figure 2.7) while in the case of softwood, the lignin and
carbohydrates appeared to he intimately associated with each other (Figure 2.1) since
their TtH values followed each other as a fonction of pH.
Further in our analysis, the overail average rate of TIH for these independent
studies was calculated in accordance to equation 2.2 and plotted in Figure 2.8.
1 Wt.Fr. Wt.Fr.(T)O.A.R = (T )C,IluloI, + (T )u,.. [2.1]
lB lB lB
where; T IH O.A.R= Overall average rate of proton spin-lanice relaxation timeT IH Cellulose = Spin-lanice relaxation time of cellulose; Wt. Fr.= weight fraction =0.7TIH Lignin = Spin-lanice relaxation time of lignin; Wt. Fr. = weight fraction:: 0.3
•
The simulated plot of the isolated materials shows an increase in TIH from acidic
pH's reaching a maximum near neutrality and a decreasing trend under alkaline
conditions. These data indicate tbat under acidic conditions the molecular rigidity
increases while the mobility of these macromolecules increases under alkaline conditions.
The measured TIH values as a function of pH when combined mathematically were found
to semiquantitatively describe the pH dependence of cellulose and lignin present in soUd
61

wood in the pH range 5 to 10.
• 700
650
600T
-IIIa-=5S0...E-t
500
458
4001 2 3 4 S 6 7 8 , 10 Il 12 13 14
pH
Figure 2.8. The simulated behaviour ofoverall proton spin-lattice relaxation times ( • )for cuoxam lignin and carbohydrates as a function of pH.
• 62
•
•
2.4. CONCLUSIONS
Solid-state proton spin-lanice relaxation measurements for carbohydrates and
lignin at room temperature and constant moisture over a wide range of pH's were
examined. These studies indicated that ionization of various functional groups can
influence the mobility of these biopolymers and consequently their physico-chemicat
pr0Perties. The analyses of the T1H data showed that as the pH increased from acidic to
near neutrality (2 -- 6), the TIH values of carbohydrates and lignin increased, reaching
a maximum at pH 6. However, as the pH changed from near neutrality toward alkalinity
(6 -- 13), the TIH values decreased, promoting the softening of these biopolymers under
alkaline conditions.
Having explored the effect of pH on the macromolecular properties of the
constituents of wood, we now tom our attention to explore the stereoselective degradation
of the arylglycerol-(j-aryl ether structures in lignin under kraft pulping conditions. As
opposed to the solid-state NMR work carried out in Chapter 2, Chapter 3 used
quantitative solution 3lp NMR to probe the sought structural changes in Iignin.
63

2.S. REFERENCES
•
•
1.
2.
3.
4.
5.
6.
7.
8.
9.
10.
11.
12.
13.
Larsson, L. 1., and Samuelson, O., Sugars in sulfite spent liquor., Svensk.Papperstidn., 70, 571-575, 1967.
Karger, B. L., Snyder, L. R., and Horvath, C., An Introduction to SeparationScience., John Wiley & Sons Inc., New York, 1973.
Atack, D., Heitner, C., and Stationwala, M. 1., Ultra high yield pulping ofeastem black spruce., Svensk. Papperstidn., 81, 164-176, 1978.
Giertz, H. W., Papermaking properties of spruce chemimechanical pulps-aninterim report., Pulp and Paper Mag. Can., 69, Nov. 1, 75-78, 1968.
Ford, M. J., and Gardener, P. E., Method of producing high yieldchemimechanical pulps., United states Patent 4, 116, 758, Sept. 1978.
Ri, S., and Nakano, J., High yield pulp production by a modified sulphiteprocess., J. Jap. Tappi, 28, 7, 38, 1974.
Hoglund, H., and Bodin, O., Modified thermomechanical pulp., Svensk.Papperstidn., 72, Il, 343, 1976.
Atack, D., and Heitner, C., Dynamic mechanical propenies of sulphonatedEastern black spruce., International Mechanical Pulping Conference Proceedings.,Technical section, CPPA., pp. 1..12, June 1979.
Gienz, H. W., Chemimechanical pulping ofhardwoods, Proceedings InternationalSymposium on New Forestry Resources for the Pulp and Paper 1ndustry., 244276, EUCEPA, Madrid, May 1974.
Richardson, C. A., and Le Mahieu, J. R., Superground wood from Aspen.,Tappi, 48, 6, 344, 1965.
Atack, D., Heitner, C., and Kamis, A., Ultra high yield pulping ofeastem blackspruce. Pan 2*., Svensk. Papperstidn., 83, 133-141, 1980.
Robens, J. C., The Chemistry of Paper., The Royal Society of Chemistry,Cambridge, UK., Chapter 6-7, pp. 89-140, 1996.
Hartmann, S., and Hahn, E. L., Nuclear doubleresonance spectroscopy., Bull.Am. Phys. Soc., S, 498, 1959.
64

•14. Andrew, E. R., Bradbury, A., and Eades, R. G., Removal of dipolar broadening
of nuclear magic resonance SPectra of solids by SPecimen rotation., Nature, 183,1802-1803, 1959.
•
15.
16.
17.
18.
19.
20.
21.
22.
23.
24.
25.
Schaefer, J., and Stejskal, E. O., Carbon-13 nuclear magnetic resonance ofpolymers spinning at the magic angle., J. Am. Chem. Soc., 98, 1031-1032,1976.
Atalla, R. H., Gast, J. C., Sindrof, D. W., Bartuska, V. 1., Maciel, G. E., 1JCspectra of cellulose polymorphs., J. Am. Chem. Soc., 102, 3249-3251, 1980.
Atalla, R. H., Vanderhart, D. J., Native cellulose: a composite of two distinctcrystalline forms., Science, 223, 283-285, 1984.
Evans, R., Newman, R. H., Roick, U. C., Suckling, I. D., and Wallis, A. F.A., Changes in cellulose crystallinity during kraft pulping. Comparison ofinfrared, X-ray differaction and solid-state NMR results., Holzforschung, 49, 498504, 1995.
Gerasimowicz, W. V., Hicks, K. B., Pfeffer, P. E., Evidence for the existenceof associated Iignin-carbohydrate polymers as revealed by carbon-13 CP/MASsolid state NMR spectroscopy., Macromolecules, 17, 2597-2603, 1984.
Manders, W., Solid state 13C NMR determination of the syringyl/guaiacyl rationin hardwoods., Holzforschung, 41, 13-18, 1987.
Hatfield, G. R., Maciel, G. E., Erbatur, O., Erbatur, G., Qualitative andquantitative analysis of solid lignin samples by carbon-13 nuclear magneticresonance spectroscopy., Anal. Chem., 59, 172-179, 1987.
Kolodziejski, W., Frye, J. S., Maciel, G. E., Carbon-13 nuclear magneticresonance spectrometry with cross polarization and magic angle spinning for theanalysis of lodgePQle pine wood., Anal. Chem., 54, 1419-1424, 1982.
Willis, J. M., and Herring, F. G., Effect of water in the 13C CPIMAS NMRspectrum of white spmce wood., Macromolecules, 20, 1554-1556, 1987.
Nimz, H. H., and Nemr, M., Carbon-13 NMR spectra of Iignins, 9. Spin-lanicerelaxation times (Tl) and determination of interunit linkages in three hardwoodIignins (A1nus Glutinsoa, Corylus Avellanus and Acer Pseudoplatanus)., J. WoodChem. Technol., 2(4), 371-382, 1982.
Tekely, P., Vignon, M. R., Cross polarizationIMagic angle spinning 13C_NMRcharacterization ofsteam exploded poplar wood., J. Wood Chem. Technol., 7(2),
6S

•215-228, 1987.
26. Maciel, G. E., Q'Donnell, D. J., Ackennann, J. J. H., Hawkins, B. H.,Bartuska, V. J., A l3e NMR study of four Iignins in the solid and solution states. ,Makromol. Chem., 182, 2297-2304, 1981.
•
27.
28.
29.
30.
31.
32.
33.
34.
35.
36.
37.
Bartuska, V. T., Maciel, G. E., Bolker, H. 1., Fleming, B. 1., Structural studiesof Iignin isolation procedures by 13e NMR., Holzforschung, 34, 214-217, 1980.
Solomon, 1., Relaxation processes in a system of two spins., Phys. Rev., 99, 559565, 1955.
Schaefer, J., and Stejskal, E. O., Buchdahl, R., Magic-angle l3e NMR analysisof motion in solid glassy polymers., Macromolecules., 10, 384-405, 1977.
McBriety, V., J., Douglass, D. e., Recent advances in the NMR of solidpolymers., Macromolecules Rev., 16, 295-366, 1981.
Havens, J. R., and Koenig, J. L., Applications of high-resolution carbon-13nuclear magnetic resonance sPectroscopy to solid polymers., Appl. Spectrosc.,37(3), 226-249, 1983.
Cory, D. G., and Ritchey, W. M., Inversion recovery cross-polarization NMRin solid semicrystalline polymers., Macromolecules, 22, 1161-1615, 1989.
McBriety, V., J., Douglass, D. C., and Kwei, T. K., Compatibility in blends ofpoly(methyl methacrylate) and poly(styrene-co-acrylonitrile). 2. An NMR study.,Macromolecules, 11(6), 126-1267, 1978.
Grobelny, J., Rice, D. M., Karasz, F. E., MacKnight, W. J., High-resolutionsolid state carbon-13 nuclear magnetic resonance study ofpolybenzimidazole/polyimide blends., Macromolecules, 23, 2139-2144, 1990.
Van der Hart, D. L., Earl, W. L., Garroway, A. N., Resolution in l3e NMR oforganic solids using high-power proton decoupling and magic-angle samplespinning., J. Magn. Reson., 44, 361-401, 1981.
Garroway, A. N., Ritchey, W. M., Moniz, W. B., Sorne molecular motions inepoxy polymers: A 13C solid-state NMR study., Macromolecules, 15, 1051-1063,1982.
Rosh, P. B., Larkey, C. S., Crawford, P. A., The use of liquid and solid stateNMR study compatibility with epoxy resins., Polymer Preprints., 22, 274-275,1981 .
66
•38. Hording, B., Lindberg, J. J., Kanerva, A., Pellinen, J., 6th National NMR
Symposium., Abstract of Papers, p. 26, Jyvaskyla 1982.
39. Jelinski, L. W., Dumais, 1. J., Watnick, P. 1., Bass, S. W., Shephard, L., 13C_NMR of ABS in the soUd state. Characterization and relaxation studies., J.Polym. Sei., Polymer Chem. Ed., 20, 3285-3296, 1982.
•
40.
41.
42.
43.
44.
45.
46.
47.
48.
Jelinski, L. W., Chemical shift parameters and molecular motion in Poly(butyleneterephthalate) and poly(butylene terephthalate)-containing polymers.,Macromolecules, 14, 1341-1345, 1981.
Steger, T. R., Schaefer, J., and Stejskal, E. O., McKay, R. A., Molecularmotion in polycarbonate and modified polycarbonates., Macromolecules, 13,1127-1132, 1980.
chaefer, 1., and Stejskal, E. O., Steger, T. R., Sefcik, M. D., McKay, R. A.,Carbon-13 T1p experiments on solid glassy polymers., Macromolecules, 13, 11211126, 1980.
Brown, C. E., Jones, M. B., Cross polarization, magic angle 13C NMRspectroscopy of poly(p-phenylene) and lower oligomers., Polymer Letters Ed.,18, 653-658, 1980.
Brown, C. E., Khoury, 1., Bezoari, M., Kovacic, R., Characterization ofaromatic polymers (Bezenoid and Heterocyelie) by cross-polarization, magic-angle13C-NMR spectroscopy., J. Polymer. SeL, Polymer Chem. Ed., 20, 1697-1707,1982.
Teeaar, R., Gravitis, J., Erins, P., Pugulis., J., Kulkevics, A., Gromov, V. S.,Lippmaa, E., Changes in the phase structure and conformation state of woodcomponents during explosive autohydrolysis., Dolk. Akad. Nauk SSSR, 288(4),932-935, Phys. Chem., 1986.
Teeaar, R., Lippmaa, B., Gravitis, J., Andersons, B., Erins, P., Relaxation studyof the native and steam exploded wood supemetwork structure by solid·state highresolution carbon-13 NMR spectrscopy., Khim. Drev., (6), 106·107, 1985.
Teeair, R., Gravitis, J., Andersons, B., and Lippmaa, E., CP/MAS NMR ofsteam explosion-treated wood and its major constituents., Teubner·Texte zurPhysik, 9, 240-249, 1986.
Tekely, P. , Vignon, M. R., Proton Tl and T2 relaxation limes of woodcomponents using 13C CP/MAS NMR., J. Polym. Leu., 25 (6), 257-261, 1987.
67

•49. Gravitis, J., Kokorevics, A., Teeiir, R., Zharov, A., Lippmaa, E., Structural
changes of wood and its components initiated by the simultaneous action of sheardefonnation and high pressure., J. Pulp Paper SeL, 17, 1119-123, 1991.
•
50.
51.
52.
53.
54.
55.
56.
57.
58.
59.
60.
61.
Newman, R. H., Nuclear magnetic resonance study of spatial relationshipsbetween chemical components in wood cell walls., Holzforschung, 46(3), 205210, 1992.
Newman, R. H., Carbon-13 nuclear magnetic resonance studies of molecularmotion in wood and paper., 4th Int. Symp. Wood and Pulping Chem., 195199, Paris, France, 1987.
Ni, J., Frazier, C. E., Molecular correlation to macroscopic wood performanceusing CP/MAS NMR., Holzforschung, 50(4), 327-334, 1996.
Hsi, E., Hossfeld, R., and Bryant, R. G., Nuclear magnetic resonance relaxationstudy of the water absorbed on milled nonhem white-cedar., J. Coll. Interf. Sei.,62, 389-395, 1977.
Riggin, M. T., Sharp, A. R., Kaiser, R., and Schneider, M. H., TransverseNMR relaxation of water in wood., J. Appl. Polym. SeL, 23, 3147-3154, 1979.
CarIes, J. E., and Scallan, A. M., The detennination of the amount of boundwater within cellulosic gels by NMR spectroscopy., J. Appl. Polym. Sei., 17,1855-1865, 1973.
Froix, M. F., and Goedde, A. O., The effect of temperature on thecellulose/water interaction from NMR relaxation times., Macromolecules, 9, 428430, 1976.
Kelly, S. S., Rials, T. G., and Glasser, W. G., Relaxation behaviour of theamorphous components of wood., J. Mater. Sei., 22, 617-624, 1987.
Sivashinsky, N., and Tanny, G. B., The state of water in swollen ionomerscontaining sulfonic acid salts., J. Appl. Polym. SeL, 26, 2625-2637, 1981.
Sarkanen, K. V., and Ludwig, C. H., In Lignins: Occurrence, Formation,Structure and Reactions., Wiley-Interscience, New York, 1971.
Argyropoulos, D. S., Morin, F. G., Probing the macromolecular structure ofwood and pulps with proton spin-Iattice relaxation time measurements in the soUdstate., Wood Sei. Technol., 29, 19-30, 1995.
Noggle, J. H., and Schirmer, R. E., The Nuclear Overhauser Effect: Chemical
68

•Applications., Academie Press, New York, 1971.
62. Argyropoulos, D. S., Morin, F. G., and Lapcik, L., Magnetic field andtemperature effects on the soUd state proton spin-lanice relaxation limemeasurements of wood and pulps., Holzforschung, 49, 115-118, 1995.
•
63.
64.
65.
66.
67.
68.
69.
70.
71.
72.
73.
74.
Froix, M. F., and Nelson, R., The interaction of \Vater with cellulose fromnuclear magoetie resonance relaxation times., Macromolecules, 8(6), 726-730,1975.
Sillescu, H., SoUd state NMR- A tool for studying molecular motion inpolymers., Makromol. Chem., Macromol. Symp., 1, 39-49, 1986.
Pearl, 1. A., The Chemistry of Lignin; the isolation of lignin, pp. 11-12, MarcelDekker Inc., New York, 1967 .
Weast, R. C., CRC Handbook of Chemistry and Physics, CRC Press, Inc., 58thEd., p. 0-134, 1977-1978.
Dean, J. A., Lange's Handbook ofChemistry, McGraw-Hill book company, NewYork, 12th Ed., pp. 10-81 to 10-85, 1979.
Sjôstrôm, E., and Enstrôm, B., A method for the separate determination of sulphoandcarboxyl groups in sulphite pulps., Svensk. Papperstidn., 15(3), 55-59, 1966.
Yano, S., and Hatakeyama, H., Effect of hydrogen bond formation on dynamicmechanical properties of amorphous cellulose., J. Appl. Polym. ScL, 20, 32213231, 1976.
Proctor, H. R., The equilibrium ofdilute hydrochloric acid and gelatin., J. Chem.Soc., 105, 313-327, 1914.
Eisenberg, A., Hird, B., and Moore, R. B., A new multiplet-cluster model forthe morphology ofrandom ionomers., Macromolecules, 23(18), 4098-4107, 1990.
Akitsu, H., Gril, J., Morooka, T., and Norimoto, M., Dynamic mechanicalproperties of chemically modified wood (II)., Chemical Modification ofLignocellulosic Proc., Rotoma, New Zealand, 7-8 Nov., pp. 130-139, 1992.
Lindberg, J. J., Bjôrkman, A., Salmén, L., and Soljamo, K., Chemicallymodified wood: Solid-State Cross-Polarization-Magic-Angle Spinning NMRSpectroscopy., Acs. Symp. Ser., No. 489, Ch. 21, pp. 320-328, 1992.
Lindstrôm, T., and Carlsson, G., Proc. Eucepa Conf., Warsaw, Poland, 1978.
69

•75. Donnan, F. G., and Harris, A. B., The osmotic pressure and conductivity of
aqueous solutions of congo-red, and reversible membrane equilibria., J. Chem.Soc., 99, 1554-1577, 1911.
•
76.
77.
78.
79.
80.
81.
82.
83.
84.
85.
Donnan, F. G. , Z. Elektrochem., Theorie der membrangleichgewichte undmembranpotentiale bei vorhandensein von nicht dialysierenden elektrolyten., 17,572-581, 1911.
Pu, Q., Gustafson, R., and Sarkanen, K., Donnan equilibria in wood-alkaliinteractions; Part 3. Theoretical modeling., J. Wood Chem. Technol., 13 (1), 124, 1993.
Nevell, T. P., and Zeronian, S. H., Cellulose Chemistry and its applications.,Ellis Horwood Limited, Halsted Press, New York, p. 27, 1985.
Neale, S. M., The swelling of cellulose, and its affmity relations with aqueoussolutions: Part 1. Experiments on the behaviour of cotton cellulose andregenerated cellulose in sodium hydroxide solution, and their theoreticalinterpretation., J. Text. Inst., 20, T373-T400, 1929.
Neale, S. M., The swelling of cellulose, and its affinity relations with aqueoussolutions: Part D. Acidic properties of regenerated cellulose illustrated by theabsorption of sodium hydroxide and water from dilute solutions and theirconsequent swelling., J. Text. Iost., 21, T225, 1930.
Neale, S. M., The swelling of cellulose, and its affinity relations with aqueoussolutions: Part III. The preferential absorption of sodium hydroxide from dilutesolutions as a cbaraeteristic property of cellulose, and an indicatiopn of previousmercerisation or other swelling treatrnent., J. Text. Inst., 22, T320, 1931.
Pennings, A. J., and Prins, W., The polyelectrolytic nature of cellulose gels inalkali solutions., J. Polym. Sei., 58, 229-248, 1962.
Sarkanen, K. V., and SOdersttom, K., Studies on acidic dissociation constants ofhydroxyl groups in glycosides., Proc. First Cellulose Conf., Cellulose Institute,Syracuse, New York, pp. 15-28, Apr. 1958.
Rowell, R. M., Lichtenberg, R. S., and Larsson, P., Stability of acetyl groupsin acetylated wood to changes in pH, temperature, and moisture., ChemicalModification of Lignocellulosic Proc., Rotorua, New Zealand, 7-8 Nov., pp. 3340, 1992.
Farrer, J., and Neale, S. M., The distribution of ions between cellulose andsolutions of eleetrolyte., J. Colloid. ScL, 7, 186-195, 1952.
70

•86. Nakano. T., Effects of ionization of side chains of partly succinylated wood on
mechanical properties., Chemical Modification ofLignocellulosic Proc., Rotoma,New Zealand, 7-8 Nov., pp. 52-57, 1992.
•
87.
88.
89.
90.
91.
92.
93.
94.
95.
96.
97.
Harris, E. E., A lignin-carbohydrate bond in wood., Tappi, 36(9), 402-405,1953.
Glasser, W. G., Sarkanen, S., Lignin: Properties and Materials., Chapter 2.Structure and properties of the lignin-carbohydrate comples polymer as anamphipatbic substance., ACS Sym. Ser., 397, Toronto, Canada, June 5-11, pp.11-28, 1989.
Iversen, T., Lignin-carbohydrate bonds in a Iignin-carbohydrate complex isolatedfrom spruce., J. Wood Sci. Technol., 19, 243-251, 1985.
Eriksson, D., and Lindgren, B. O., About he linkage between lignin andhemicelluloses in wood., Svensk. Papperstidn., 2, 59-63, 1977.
Eriksson, O., and Goring, D. A. I., Structural studies on the chemical bondsbetween lignins and carbohydrates in spruce wood., J. Wood Sci. Technol., 14,267-279, 1980.
Lundquist, K., Simonson, R., Tingsvik, K., Lignin carbohydrate linkages inmilled wood lignin preparation from spruce wood., Svensk. Papperstidn., 86,4447, 1982.
Timell, T. E., Recent progress in the chemistry of wood hemicelluloses., J. WoodSci. Technol., 1, 45-70, 1967.
Manley, R. St. J., Molecular morphology of cellulose., J. polym. Sci., 9{A2),1025-1059, 1971.
Horii, F., Kitamaru, R., CP/MAS carbon-13 NMR study of spin relaxationphenomena of cellulose containing crystalline and non-crystalline components.,J. Carbohyr. Chem., 2(4), 641-662, 1984.
WesbDan, L., Swelling and mechanical properties of cellulose hydrogels., Thesis(D. Tech.), Royal Institute of Technology, Depanment of Physical TechnologyS\\'edish Forest Products Research Laboratory (STFI), Stockholm, Sweden, 1980.
Westrnan, L., and Lindstrôm, T., Swelling and mechanical propenies of cellulosehydrogels. Part I. Preparation, characterization, and swelling behaviour., J. Appt.Polym. SeL, 26, 2519-2532., 1981.
71

•98. Westman, L., and Lindstrom, T., Swelling and mechanical properties ofcellulose
hydrogels. Part ll. The relation between the degree of swelling and the creepcompliance., 1. Appt Polym. Sei., 26, 2533-2544., 1981.
99. Wesanan, L., and Lindstrom, T., Swelling and mechanical properties of cellulosehydrogels. Part ID. Temperature effect on the swelling and compliance levelsstudied by dilatometry and IH-NMR spectroscopy., 1. Appl. Polym. Sei., 26,2545-2559, 1981.
100. Westman, L., and Lindstrom, T., Swelling and mechanical properties ofcellulosehydrogels. Part IV. Kinetics of swelling in liquid water., J. Appl. Polym. SeL,26, 2561-2572, 1981.
101. Westman, L., and Lindstrôm, T., Swelling and mechanical propenies of cellulosehydrogels. Part V. Swelling in concentrated alkaline solutions., 1. Appl. Polym.Sei., Appt. Polym. Symp., 37, 363-376, 1983.
102. Brown, W., Stilbs, P., and Lindstrom, T., Self-diffusion of small Molecules incellulose gels using FT-pulsed field gradient NMR., 1. Appl. Polym. Sei., 29,823-827, 1984.
103. Nielsen, O. F., Lindstrom, T., and Lund, P. A., Low-frequency (30-400 cm-1).
Raman spectra of water in cellulose gels., Acta Chem. Scand., Sere A, 36, 623625, 1982.
104. Sandell, L. S., and Luner, P., Flocculation of microcrystalline cellulose withcalionic ionene polymers., J. Appl. Polym. SeL, 18, 2075-2083, 1974.
105. Pu, Q., and Sarkanen, K., Donnan equilibria in wood-alkali interactions. Part 1.Quantitative determination of carboxyl-, carboxyl ester and phenolic hydroxylgroups., J. Wood Chem. Technol., 9(3), 293-312, 1989.
106. Pu, Q., Gustafson, R., and Sarkanen, K., Donnan equilibria in wood-alkaliinteractions. Part 3. Theoretical modeling., 1. Wood Chem. Technol., 13(1), 124, 1993.
107. Gupta, P. R., Goring, D. A. 1., Physicochemical studies of alkali lignins (part1 and m., Cano 1. Chem., 38, 248-258, 259-269, 1960.
108. Brauns, F. E., The chemistry of lignin., Academie Press, New York, 1952.
109. Rezanowich, A., Yean, W. Q., Goring, D. A. 1., The molecular properties ofmilled wood and dioxane lignins: sedimentation, diffusion, viscosity, refractiveindex iDcrementand UV absorption., Svensk. Papperstidn., 66(5), 141-149, 1963.
• 72

110. Lindstrôm, T., Westman, L., The colloidal behaviour of kraft lignin. Pan IV:Syneresis and hysteresis in swelling of kraft lignin gels., Colloid & polym. SeL,260, 594-598, 1982.
111. Flory, P. J., Principle of polymer chemistry.. Chap. XIII., Phase equilibria inpolymer system. pp. 584-589.• Comell University Press, Ithaca, New York,1953.
112. Akim, L. G., Fedulina, T. G., and Shevchenko. S. M., l3C NMR of tignins inaqueous alkali: 1. Ionisation effect on the spectra of model compounds and milledwood Iignins., Holzforschung, 50, 237-244, 1996.
113. Watanabe, T., Kaizu, S., and Koshijima, T.. Binding sites of carbohydratesmoities toward lignin in "lignin-carbohydrate complex" from Pinus densiflorawood., Chem. un., Chemi. Soc., Japan., 1871-1874, 1986.
114. Watanabe, T., Ohnishi, J., Yamasaki, Y., Kaizu, S., and Koshijima, T., Bindingsite analysis of the ether linkages between Iignin and hemicelluloses in Iignincarbohydrate complexes by DDQ-Oxidation., Agrie. Biol. Chem., 53 (8), 22332252, 1989.
115. Watanabe, T., and Koshijima, T., Structural features of2,3-Diehloro-S,6-dieyano1,4-benzoquinone-oxidized lignin acetate revealed by earbon-13 nuclear magneticresonance spectroscopy., Mokuzai Gakkaishi., 35 (2), 130-134, 1989.
'e 73

•
•
Cbapter 3
Determination of Tbermodynamic Parameters Goveming theStereoselective Degradation of Arylglycerol-,i-aryl Ether Bonds in
MiUed Wood Lignin Under Kraft Pulping Conditions
3.0. ABSTRACT
During this investigation, softwood (picea mariana) milled wood lignin was .
subjected to kraft pulping conditions al the lemperature range 100-160 oC, for variable
lengths of lime. After quantitative isolation of the treated lignins, they were subjected to
31p NMR analyses which allowed the absolute rates of scission of the erythro and threo
diastereomers of the arylglycerol-p-aryl ether structures present in Iignin to he derived.
The plots of the kinetic data revealed that two kinetic regimes operate i.e. an initial fast
phase that is followed by another slower phase. In agreement with previous accounts, the
rate constants for these scission reactions were found to follow a pseudo-flrSt-order rate
law, during both phases. Rate constant data obtained during this effott, invariably
indicated that the erylhro isomers of the (j-O-4 units of softwood milled wood Iignin
cleave faster than their threo counterparts during both phases. At elevated temperatures
(160 OC) the difference was found to he augmented. The general stability of the threo
diastereomers toward kraft pulping seems to he the manifestation of a considerably
slower reaction of the pulping reagents with the threo diastereomers of the (j-aryl ethers.
Arrhenius and Erying plots of these data supplied the complete profile of thennodynamic
parameters goveming this commercially important ether scission reaction.
74

•
•
3.1. INTRODUCTION
The degradation of lignin under kraft pulping conditions is known to be related
to its reactivityl. 2, rather than its accessibility3 to the pulping reageots. The faster
delignification rate of hardwoods compared to softwoods lends support to such
observations. This is the case not ooly because hardwoods are of lower lignin content but
also due to the presence of the syringyl uDits in lignin4• More specifically, the structural
elements of the lignin in hardwoods are composed of different proportions of syringyl
and guaiacyl units5, while those in softwoods are exclusively composed of guaiacyl units.
Consequently, such a variation in the arylglycerol-~-aryl ether (~-O-4) structures, which
account for more than 40% of the repeating units in lignin4, 6, plays an important role
toward controlling its reactivity during kraft pulping.
In order to avoid excessive carbohydrate degradation, commercial kraft pulping
protocols are typically terminated at a Iignin content of 4-5 % for softwoods and 3% for
hardwoods. Structural studies of the residual lignin remaining with the fibre al this stage
have shown that significant amounts of arylglycerol-~-arylether structures" 8 are still
present. Lignin-carbohydrate Iinkages9-12, lignin condensation reactionsI3-1S, aryl group
migration reactionsl6. 1', and stereochemical and thermodynamic considerations affecting
the stability of the ~-O-4 bonds10, 14, 16 are ail factors that need to he explored in detail if
we are to arrive at a comprehensive description of the chemistry of the process.
The presence of two asymmetric carbon centres within the arylglycerol-fj-aryl
ether moieties in Iignin, allows for the existence of erythro and threo diastereoisomers.
Softwood Iignins bave been shown to contain equal amounts of erythro and threo
diastereomersl8-22, while the erythro diastereomers predominate in hardwood Iignins. The
reason for the predominance of the erythro diastereomers in hardwoods bas been
rationalized on the basis of the extensive content of syringyl units in such species which
exist preferentially in their erythro forms l9• 23-25. Consequently, the efficiency of a
delignification reaction is govemed by the chemical and stereochemical considerations
that affect the scission of the predominant arylgtycerol-t3-aryl ether (fj-O-4) structures of
Iignin.
75

•
•
The erythro and threo fonns of the arylglycerol-l3-aryl ether structures of lignin
and severa! model compounds bave been investigated by using a variety of techniques,
sncb as X-ray crystallograpby26, ozonation2I• 27. 28, and a variety of one- and two
dimensional Duclear magnetic resonance spectroscopie methods19• 20.22.29.30.
In particular, ozonation bas been proved21 to he a powerful means to obtain
reliable values of erythro/threo ratios for insoluble samples sucb as wood meal, pulps,
or Klason lignins. Unlike other oxidative degradation methods used in lignin chemistry,
sucb as nitrobenzene and permanganate oxidations, which shonen the Iignin side chain
to an aldehyde or a carboxylic acid group, ozonation provides a significant amount of
information about the side chain structures31 of lignin. Extensive ozonation of lignin
destroys its aromadc moieties, but preserves the side chains in the form of identifiable
mono- and dicarboxcylic acids. More specifically, the side chains of the arylglycerol-l3
aryl ether moieties, after saponification with aqueous alkali, can he recovered and
quantified in the form of erythronic and threonic acids according to the reaction sequence
of Figure 3.1. Using this technique Taneda et al. 27 have monitored the relative changes
of the erythro/threo ratios of residual lignin at different extents of lignin degradation
under kraft pulping conditions. They reponed that the threo isomers can exist longer
during the delignification treatment.
This method bas been used successfully for the detennination of erythro/threo
ratios of a variety of lignocellulosic materials and lignios of different botanical origin
(Table 3.1)31.32.
Proton-NMR spectroscopy bas also been used for the determination of the
distribution of the erythro and Ihreo diastereomers in {j-O-4 structures. Ralph and Helm30
have demonstrated that snch a method can he applied with precision 00 a series of lignin
model compouods, while, Hauteville et al.20 used proton NMR spectroscopy to examine
the stereochemical features of {j-O-4 structures of spruce and birch lignins. The latter
investigators reported that the erythro/threo ratio of these structures in spruce lignin exist
in equal amounts, while the erythro diastereomers predominated in birch lignin.
Robert et a1. 29 have paved the way in using 13C NMR spectroscopy for the same
76

\ \
Ct\OH \ CHPH \
~b-~-- ~b-~ ~--HO-b....H)=I 0 HO-b....H 0 0
?OCH.J 3 ~ ~ OC"- _,-=--3~..
1 1 COOH,"'. ~ OCH;s '" C, 0 OCH;s 1
O~ 0 COOH
, ' COOMe
~~ bOOHCOz
•
\
CftPH \
H-6-~
?b~~--
" 1 :OCH.J,
Arylglycerol-f}-arylether
\ \
CHPH \ CftPH \
~b-~-- ~b-~ }--...6-~)=I 0 ...b-OH
?OCIt,s 3 ~ ~ OCI\
I~ I~
," ~ OC", '" C 0 OCH.JO~ '0
" 'Erylhro
y--COOH
bOOH
COOM.
bOOHCOJ
CttpH HO1 /'
"'C-Q-C C--l ,'""'C-OH 0 0
6o~ ....OH
o~c""""
b,
CHPt fi)1 /'
"'C-Q-C c--l ,'"
HO-C....H 00
bo~ ....OH
o~c""""
b"
•CI\QH
...b-OH
H-6-OH1c
o~ ....OH
Erylhronlc Acid
CI\QH
....t-OHHO-6....H
t~ ....OH
Threonic Acid
Figure 3.1. Reaction sequences operating during the ozonation of arylglycerol-fj-O-4 structures. The amounts of erythronicand threonic acids provide valuable information on the abundance of the two diastereomers in the sample.
77

Table 3.1. Erythro/threo ratios for various isolated and in situ lignins determined by
• ozonation32•
Substrate Ozonation time (min) E/T ratio
LigninsKraft Iignin 6 0.75KIason Iignin Tsuga heterophylla 18 0.76KIason Iignin Populus delloides 18 0.78Soda lignin P. delloides 6 1.94Native spruce Lignin 6 0.79Native spruce Lignin 18 0.88Native spruce Lignin 40 0.82MWL Corchorus capsularis fiber 6 2.18MWL C. capsularis wood 6 1.84C. capsularis fiber Iignin (enzymatic) 6 2.00C.capsularis wood Iignio (enzymatic) 6 2.06
Wood mealsNorway spnace 40 1.05Norway spnace (ozon. in gl. acetic acid) 40 1.03Tsuga heterophylla 30 1.02Tsuga heterophylla 40 1.27Tsuga heterophylla 60 1.01Tsuga hetcrophylla (compression wood) 40 1.36Pseudotsuga menziesii 40 1.01Populus deltoides 20 2.72Populus deltoides . 40 3.03Arbutus menziesii tension sapwood 40 3.69Liquidambar styraciflua 40 2.86Eucalyptus gummifera 40 2.60E. grandis 40 2.45Corchorus capsularis fiber 40 2.41C. capsularis wood 40 2.02
GrassesBagasse 40 1.92Wheat straw 40 1.88Wheat straw (saponified) 40 1.94
PulpsSoda pulp (cottonwood) 40 3.05Bagasse pulp (15t stage delignif.) 40 1.94Wheat straw pulp (15t stage delignif.) 40 2.25
• 78

•purpose. This was accomplisbed by examining severallignin model compounds and the
two-dimensional (INADEQUATE) gpectra ofaspen milled wood lignine Nimz et al. 19 also
used 13C NMR spectroscopy to probe the same stereocbemical details in beech lignins.
Their results implied that in beecb lignin the erythro ~-O-syringyl ethers are by far more
predominant. Kringstad and MorIc33, also using 13C NMR spectroscopy, reported that the
dissolved kraft Iignin from spruce wood contained higher amounts of threo than erythro
unïts.
In recent years a new form of spectroscopy has emerged that allows, amongst
others, the quantitative routine determination of the absolute amounts of the erythro and
threo uoits in soluble lignin preparationsJ4.38. This is achieved by the quantitative
phosphitylation of ail -OH groups in ligoin followed by quantitative 31p acquisition.
The overail pbosphitylation reaction of labile protons used is depicted as follows:
R-OH + CI-<J Pyridlnl/CDCI;s
2S·C R-O-a + HCI
Where R = Residues of Phenols. AlcoholsAldehydes, Sugars. Carboxylic Acidsand other hydroxyl containing lignin moieties
•
Figure 3.2. The derivatization reaction of l, 3, 2-dioxaphospholanyl chloride (1) withcompounds containing labile hydrogens.
Quantitative 31p NMR offers this facility with significant advantages over lH and
13C NMR sPectroscopies, including excellent signal dispersion, rapid acquisition protocols
and most significandy, precise quantitative information due to the use of internai
standards34-38. This novel and quantitative tool has bee.n employed for the quantitative
determination of lignin functional groups37, i.e. the three principal forms of phenolic
hydroxyl groups, p-bydroxyphenyl, guaiacyl, and syringyl, primary hydroxyls, carboxylic
acids, and the two diastereomeric fonns of arylglycerol-~-arylether unîts. Ail these
79

moieties present in lignins can he detennined from a single quantitative 31P NMR
experiment after derivatization with appropriate phosphitylating reagents.
A typical quantitative 31p NMR spectrum and signal assignment of softwood
milled wood Iignin phosphitylated with (1) is shown in Figure 3.3;
CH2-0H f1
H-T-O~~C-OH OM.
@-oo7\MeThreo;
--HO wllh nellhbourinl .:: C=O
Syrlngyl -OH
•r6LJô1
M.O~OMe
/"OH
Guaiacyl -OH
137 136 135 134 133 132 131 130 129 128 127 126
31p (ppm)
Figure 3.3. Quantitative 31p NMR sPectrum and signal assignment of birch dioxanelignin after derivatization with (li7.
The signais due to the erythro and threo forms of the {3-0-4 uDÎts for isolated
softwood and hardwood lignï.ns39 and model compounds3" bave been carefully assigned.
Funher evidence subslantiating tbese assignments was sougbt by specifically alkylating17
these positions in Iignin. More specifically, the methylation of the alpha hydroxyl groups
in 13-0-4 structures (proposed by Adler et al.40) caused the complete elimination of IWO
31p NMR signais al 135.0 and 134.2 ppm attributed to the erythro and threo
80

•
•
configurations of the arylglycerol-{j-arylether structures respectively.
A number of applications of this technique toward studying' specifie details of
lignin structure have appeared in the recent Iiterature. Jiang and Argyropoulos41 have
used this fonn of spectroscopy to study the stereospecificity of the degradation of the {j
0-4 bonds, while Froass et al. 42 used the technique to unravel salient features of the
degradation of {j-O-4 bonds under conventional and modified pulping protocols. This
methodology was used extensively by Saake et al.43 to determine the erythro to threo
ratios for a series of synthetic Iignins as a fonction of their molar mass.
The numerous advantages offered by quantitative 31p NMR have paved the way
toward detailed enquiries, which involve large arrays of repetitive kinetic experiments.
As such, the kinetics of scission of {j-O-4 bonds under commercial kraft pulping
conditions can now he investigated by using milled wood lignin and this novel form of
spectroscopy. More specifically, in this effort we will discuss our measurements of the
absolute rates of scission of the erythro and threo diastereomers of the (3-0-4 structures
in milled wood Iignin, as a function of lime and temperature. These studies allowed the
determination of the fondamental thennodynamic parameters goveming the stereoselective
degradation of these highly abundant structural elements in lignin.
81

3.2. EXPERIMENTAL
3.2.1. Materials and Methods
3.2.1.1. Preparation
IsoltJlion of Milled Wood Ugnin
The extraction and purification of milled wood lignin was carried out according
to the Bjôrkman method". Initially 150-200 g of wood chips were pulverized to 100
mesh and then subjected to bail milling (3 weeks) using a PQrcelain bail mill. The wood
Meal was then dispersed in 3L of dioxane containing 4.0% water. The suspension was
stirred with a magnetic bar for 3 weeks. The wood meal was then separated and
discarded from the dioxane solution by centrifugation. The dioxane solution was
evaporated under reduced pressure. The resulting residue was dissolved in acetic acid (20
ml per gram of lignin) containing 10% water. This solution was then added to water
(250 mL per gram of lignin) while stirring. This material was then washed by
centrifugation with occasional shaking of the vessel to distribute the lignin. After
evaporating the water with a stream of air. the isolated residue was dissolved in (2: 1 v/v)
l ,2~dichloroethane/ethanol (20 mL per gram of lignin). This solution was added dropwise
to diethyl ether (250 mL per gram of lignin). The material was then eentrifuged and
washed after decanting the ether. This step was repeated 2~3 times in which, eaeh
washing was allowed to stand ovemigbt. The final produets were washed once witb
hexane and the precipitate was first dried in air and men over drierite in vaeuo. The
elemental analysis of the resulting material was carbon 60.86%. hydrogen 5.71 %, and
methoxy1 15.45%.
3.2.1.2. Reactions
Treatment 01 Milled Wood Lignin Under Kraft Pu/ping Conditions
Initially, a white liquor solution was prepared containing 5.43 g of sodium
hydroxide (NaOH as Na20) and 1.6 g of sodium sulphide (Na2S as Na20) per 100 mL
deionized water with active alkali and sulfidity of 70.38 g/L and 22.92%, respectively.
This solution was then mixed with an equal volume of pure dioxane. During a typical
82

experiment, the softwood milled wood Iignin (0.1 g) was dissolved in 1.33 g of the
above solution (approximately simulating a Iiquor/wood ratio of 4/1). The reaction was
carried out in a 10 mL stainless steel bomb whose air was displaeed by nitrogen. The
kraft cooking was simulated by heating and oceasionally shaking the bomb in an oil bath
preheated to the desired temperature for a specifie time. At the end of the reaetion
period, the bomb was cooled with cold water and its contents were acidified to pH 2
using dilute hydrochloric acid (0.2M HCI). The precipitate was allowed to settle
ovemight. It was then collected by centrifugation and washed with acidified water to
remove the inorganic salts. The precipitated degraded lignin was then freeze dried and
brought to constant weight at room temperature under reduced pressure. This material
accounted for approximately 80% of the total weight.
However, in an effon to isolate the rest 20%, the solution eontaining the water
soluble low moleeular weight lignin, resulting from the first aqueous acidic precipitation,
was allowed to dry at room temperature. The remaining low molecular weight lignin was
extracted by the addition of 10-15 mL of high purity tetrahydrofuran. This was followed
by evaporation of the solvent to a fine viscous residue, and dropwise addition to 20 mL
of diethyl ether.
This step was repeated 2-3 times allowing the collection of more lignin, free from
inorganic salts. Finally, the diethyl ether was evaporated and the remaining lignin was
freeze dried. These samples after heing brought to constant weight under reduced
pressure accounted for almost 16% of the starting lignin. The two sets of the degraded
lignin samples collected, were then mixed thoroughly prior to subsequent analyses and
accurately weighted. The 31p NMR data collected was convened from mol/g to mol/L
by using the relation below:
(Frulctiolldl group .'~,.".iMd by J1p NMR (mollg)] X (ÂInOIIIII 01 isoldud ligftÏ1I (g)](Yolwne 01 i1IiIùJl cookirlg liquo,. (L)]
83

3.2.1.3. Instrumentation
Quantilative J1p NMR Spectroscopy
1,3,2 dioxaphospholanyl chloride was used as the phosphitylation reageot.
Approximately 30.0 mg of dry Iignin was weighed into a 2 mL volumetrie tlask. Then,
800~L of a solvent mixture containing pyridine and COCh at a volume ratio of 1.6/1
were added. The mixture was stirred with a magnetie bar until the lignin was fully
dissolved. Following the addition of 100 IJL of a solution containing bath bisphenol-A
as the internai standard, and chromium acetylaeetonate as the relaxation reagent were
added. Finally, l00IlL of 1,3,2 dioxaphospholanyl chloride were added and the tlask was
sealed and shaken to ensure thorough mixing. The 31P NMR spectra were obtained by
using inverse gated decoupling on a Varlan XL-300 FT-NMR spectrometer operating at
121.5 MHz. The internai deuterium lock was provided by the deuterium atoms present
in the deuterated chlorofonn, used as the solvent. The external standard was 85%H~4.
Ali downfield shifts from H3P04 were considered positive. A sweep width of 10000 Hz
was observed and speetra were aecumulated with a time delay of 10 sec between
successive pulses. Pulse width corresPOnding to a 45° flip angle and a line broadening
of 2 Hz was used for acquiring the processing of the spectra. For the 45 0 tlip angle a
series of eXPeriments showed that there was no funher increase in signal intensity after
a 7 sec pulse delay was applied. Ail chemical shifts reponed are relative to the dimeric
model compound with water which has been observed to give a sharp 31p signal at 121.1
ppm38•
84
•
•
3.3. RESULTS and DISCUSSION
During this investigation softwood (picea mariana) milled wood Iignin was
subjected to kraft pulping conditions at a temperature range varying from 100-160 oC,
for variable lengths of tilDe. Each isothermal set of measurements involved eight samples
of milled wood Iignin being exposed at the set temPerature for variable lengths of time.
Since the rate of most chemical reactions increase as the temperature rises, the actual
reaction tilDes were shortened as the temperature was increased. This was done in order
to avoid excessive lignin degradation at the high end of the temPerature range. Effons
at quantitatively isolating the Iignin after the reaction were also made in order to ensure
that most of the degraded low molecular weight fragments were included in the
quantitative 31p NMR analyses that followed. Care was also exercised to integrate ail
NMR SPectra acquired at precisely identical chemical shift ranges (126-138 ppm) so that
the derived infonnation will he free of anifacts introduced from such variations.
The kinetic data describing the actual consomption of both stereoisomers for the
arylglycerol-l3-aryl ethers in milled wood lignin under kraft pulping conditions is
tabulated in Table 3.2. The isothennal kinetic data (at 100 OC) has been plotted in Figure
3.4. A closer examination of these plots reveals that for the actual process of scission of
these ether bonds two kinetic regimes operate. An initial fast phase that is followed ~y
another slower phase. We have termed these two phases as "initial" and "bulk" in
accordance with the terminology used to describe the kinetics of pulping processes.
These data were then fitted to different kinetic expressions in arder ta determine
the sougbt rate constants. As 5uch, the rate constants (k) for the reaction describing the
cleavage of arylglycerol-~-arylether linkages during bath stages were found (on the basis
of correlation coefficients) to follow a pseudo-first-order rate law, in agreement with the
accouDts of Gicrer and Ljunggren4S•
85
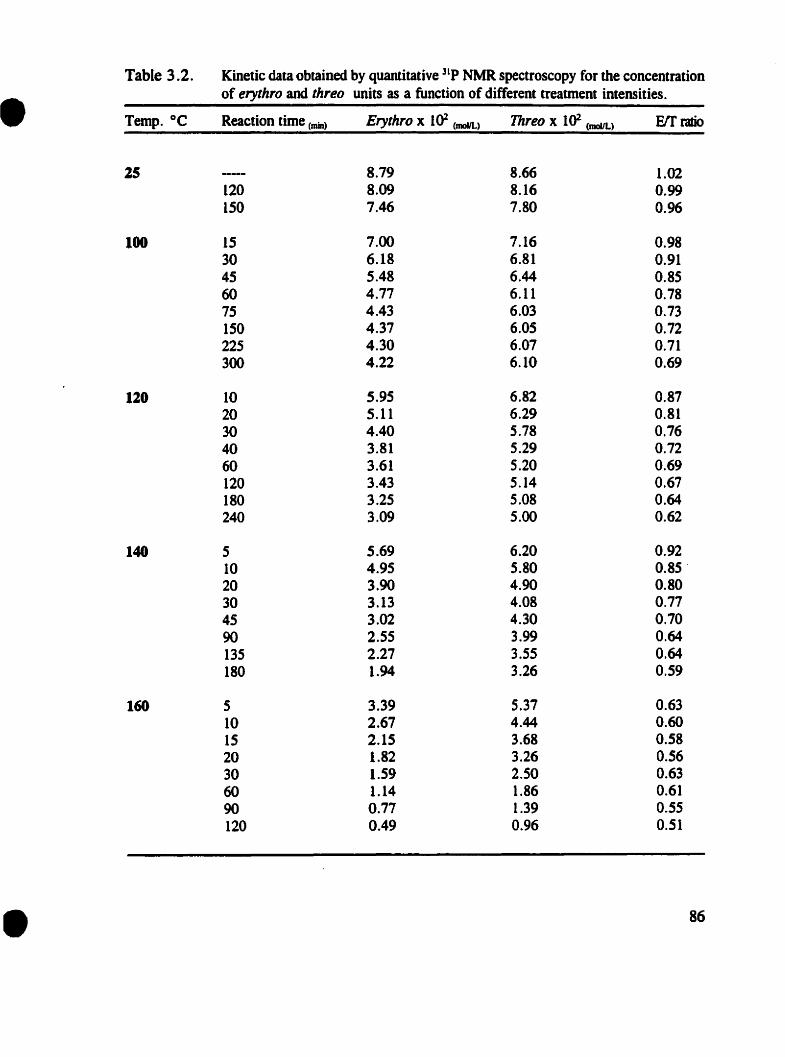
Table 3.2. Kinetic data obtained by quantitative 31p NMR spectroscopy for the concentration
• of erythro and threo units as a function of different treatrnent intensities.
Temp. oC Reaction time (min) Erythro x l ()2 (moIIL) 1hreo x 1()2 (moIJL) EIf raIio
25 8.79 8.66 1.02120 8.09 8.16 0.99150 7.46 7.80 0.96
100 15 7.00 7.16 0.9830 6.18 6.81 0.9145 5.48 6.44 0.8560 4.77 6.11 0.7875 4.43 6.03 0.73150 4.37 6.05 0.72225 4.30 6.07 0.71300 4.22 6.10 0.69
120 10 5.95 6.82 0.8720 5.11 6.29 0.8130 4.40 5.78 0.7640 3.81 5.29 0.7260 3.61 5.20 0.69120 3.43 5.14 0.67180 3.25 5.08 0.64240 3.09 5.00 0.62
140 5 5.69 6.20 0.9210 4.95 5.80 0.85·20 3.90 4.90 0.8030 3.13 4.08 0.7745 3.02 4.30 0.7090 2.55 3.99 0.64135 2.27 3.55 0.64180 1.94 3.26 0.59
160 5 3.39 5.37 0.6310 2.67 4.44 0.6015 2.15 3.68 0.5820 1.82 3.26 0.5630 1.59 2.50 0.6360 1.14 1.86 0.6190 0.77 1.39 0.55120 0.49 0.96 0.51
• 86

20
:+
:+
:8 10 12
Time xl0·3 (5)
28
• .-..~~- 15Qa
~---N
=,...M
c:I 18 ~Q.-.. r.lMII'bRas...
~..c:I~u
5c:I
=Ur.In.J~••
00
Figure 3.4. The plot of concentration vs. time describing the degradation oferythro(.) and threo(.) isomers, and the overall arylglycerol-~-ether( +)structures in milled wood lignin under homogeneous kraft pulpingconditions at 100°C.
Subsequently, by plotting ln k versus liT, the energy of activation was calculated on the
basis of the Arrhenius equation [3.1].
-E(_41)
k=Ae RT[3.1)
where:
A= Pre-exponential factorEn= Activation energyR= Gas constant
•
This equation relates the rate constant k of a chemical reaction to the absolute
temperature T (in K). It describes the behaviour of a vast number of chemical reactions
amazingly weil, particularly over a fairly small temperature range, but in sorne instances
87

•over as large a range as 100 degrees46• 47. Thus the plot of ln k vs Il is linear, with slope
-E/R and intercept InA.
A similar relationship is aIso derived by the absolute reaction rate theory, which
is used aImost exclusively toward understanding, the kinetics of reactions in solution48•
The activated complex in the transition state is reached by reactants in the initial state as
the highest point of the most favourable reaction path on the potential energy surface.
The formation of the activated complex May he regarded as an equilibrium
process involving an "almost" normal molecule (almost, since it is short by one mode of
vibrational energy). The free energy of activation ~Gtrr can therefore be defmed as in
nonnal thennodynamics,
leading to
1 1 1 1- --âG T =-RTlnK T = AH T - TAS T
[3.2]
where:
111- --KT -âG T r{f' -âH T âS T [3.3]
k =h exp ( RT ) =h exp ( RT ) exp (R)
•
JliIlrr = Enthalpy ofactivation~Slrr= Entropy ofactivation,,= Boltzmann'$ constanth= Planck'$ Constant
Equation [3.3] dictates that a plot of In(k/7) against lIT is linear, with a slope,
M{IITIR and an intercept (ln ,,1h + ~s lrrIR) = (23.8 + ~s lrrIR). This is sometimes
referred to as the Eyring relationship. When applied, both Arrhenius and Eyring plots
are known to give very simiJar results.
Most investigators are content to use the best linear plots of lok or In(k/7) vs T·l
in estimating Ea or ~Hlrr values, and to assume that these are constant over a narrow
88

temperature range49•
These equations were thus employed for obtaining the energy of activation.
enthalpy, entropy, and Gibbs free energy of activation for the reaction pathways of ·the
erythro and threo cleavage of the arylglycerol-fj-aryl ether structures present in softwood
milled wood lignin during bath initial and bulle phase.
-5 ------------------------
.-. ·10•"-'.-.e---.:.:"-'
=- ..15..=.-.•"-'.:.:
= B- -10 T
1.751.631.50
lOOO/T (1' .1)
2.38-%5 ......oop_...,..........--..---t'.....,~.,.......,.... ........ ....,......,~,.....oop_ ........_.,.......,.~-......_..
1.15
Figure 3.5. Arrhenius(.) and Eryring <e) plots for the determination of the energyof activation, entbalpy of activation, and enuopy of activation governingthe cleavage of erythro (E) and threo(T) isomers and the overallarylglycerol-p-aryl ether structures (D) in milled wood lignin underhomogeneous kraft pulping conditions during the bulk phase.
Experiments with bath phenolic and non-pbenolic l3-aryl ether model compounds
have shown how lignin structures MaY fragment in alkali, with the subsequent generation
of new pbenolic hydroxyl groupsSO. For example, in Figure 3.6, the non-phenolic ~-aryl
ether structure (lA) undergoes bydrolysis in alkali if it contains a free Q- or 'V- hydroxyl
groups (R=OCH3) , or if the Q position bears a carbonyl group'·. The mechanism of this
89
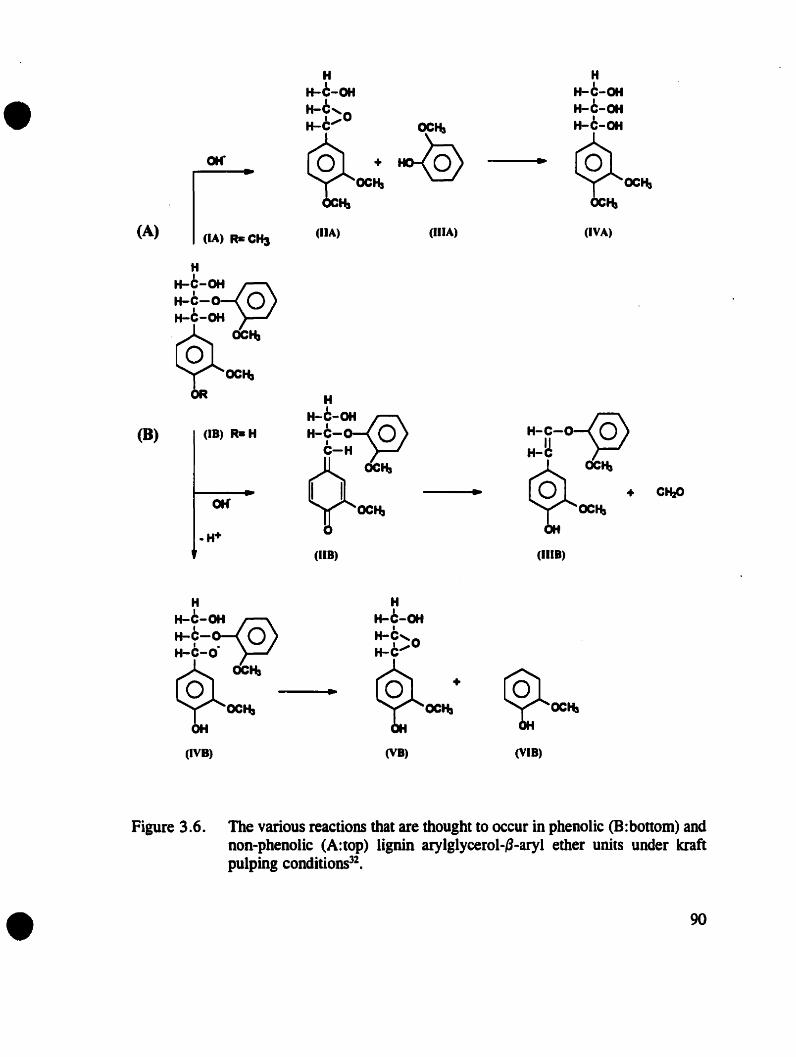
H HH-C-OH H-C-OH• H-C,O H-C-OH
~œ~~H-C-OH
otf • ~œ~1 (lA) Rs·C~(A) (lIA) (iliA) (IVA)
H
H-C-~H-C- 0
~œ~OCtf.l
H
H-C-~(B) (lB) R- H H-9- 0 H-C-~IlC-H H-C
~œ~ ~~1 1 • o + CHaOOK OC", OCt\
.H+(liB) (1IlB)
H H
H-C-~ H-C-OHH-C- 0 1
H-C,O1 • H-C""
~œ~ • ~+ ~œ~OCtf.l OC",
(IVB) (VB) (VIB)
•Figure 3.6. The various reactions tbat are thought to occur in phenolic (B:bottom) and
non-phenolic (A:top) Iignin arylglycerol-a-aryl ether units under kraftpulping conditions32•
90

•
•
cleavage52• 53 is thougbt to include a nucleophilic attack of the neigbbouring hydroxyl
group on the {j carbon.This results in the formation of an epoxide (fiA) and liberation
of a phenoxide ion (DIA). This mecbanism is supported by the observation that
compound (lA) can he made stable to alkaline bydrolysis by methylation of the a and "Y
hydroxyls so that the epoxide can no longer be formed.
The pbeDolic p·ether structure (lB, R=OH) a1so uDdergoes alkaline hydrolysis,
involving a somewhat more complex set of reactions 54-56. Initially the quinonemethide
(lIB) is thougbt to he formed, which subsequently eliminate formaldebyde yieldiDg the
comparatively stable enol aryl ether structure (IDB). Cleavage of the {j-aryl ether takes
place ooly as a side reaction, yielding guaiacol (VIB) and the epoxide (YB).
In the ligbt of the above description of events, that have been documented to
accur under kraft pulping conditions32, we are DOW to examine certain aspects of our data
in order to funber comprebend its significance.
Bmnow et al. 57 who bave examined the pH dependency of water addition to
quinonemethides (structure lIB, Figure 3.6) for various arylglycerol-l3-aryl ether lignin
model compounds, have concluded that the distribution of the erythro and threo
diastereomers in such compounds depends upon the kinetics of this addition. In actual
fact, acidified water addition to such quinonemethides caused the predominancy of
erythro isome'rs over it's threo counterparts. As sucb, it was thought appropriate to
examine if such an occurrence is applicable under the conditions of the present
experiments for softwood lignin. More specifically, since at the end of the various kinetic
kraft pulping experiments, the pH of the degraded milled wood lignin was above 11.5
12.0, the question is whether or oot acidification of this mixture could iocrease the
formation of the erythro isomer, and if such predominancy would occur, how could this
have affected our kinetic measurements?
In an effort to address the above concems, experiments were carried out in
duplicate. Two samples of milled wood lignin were treated at room temperature for a
period of 2 and 2.5 hours with the same reagents tbat were used during the actual kinetic
measurements. The alkaline mixtures were then acidified with 0.2 M HCI to a pH value
of 2. The resulting suspensions were then kept for a period of 27 hours simulating the
91

•
•
actual isolation conditions used during our kinetic work providing enough lime for
possible reaction involving alterations between the two diastereomers.The isolated
products were then subjected to quantitative 31p NMR spectroscopy and the erythro and
threo contents of the {j-0-4 units were measured.
The erythro to threo ratio of the softwood milled wood lignin used in this effort
was determined to be equal to one (Table 3.2). Similar values bave also been reported
by Taneda et al. s8, Jiang and Argyropoulos41, Froass et al. 42 and other investigatorsl8-22.
Our analyses showed no indication, of even a minor increase, in the erythro diastereomer
over it's threo counterpart. In fact, the erythro/threo ratio was detennined to he slightly
lower than unity. Not surprisingly, the data of Table 3.2 suggests that this treabnent
caused partial cleavage of the ether bonds in lignin since Iignin has been shown to
undergo a series of minor reactions in the presence of white liquor at room temPerature59•
60. Contrary to our working hypothesis, the erythro diastereomers of the {j-O-4 uoits were
found to cleave somewhat more than their threo counterparts during this treatment. This
caused the E/T ratio to become slightly lower tban unity.
The rate constants data of Table 3.3 invariably indicates that the erythro isomers
of the overalll3-0-4 uoits of softwood milled wood lignin cleave faster than their threo
counterparts during both the initial and the bulk phase. These data also reveals that at
elevated temperatures the difference is augmented. For example at 160 oC the rate
constant for the cleavage of the erythro isomer increases by almost a factor of 1.2,
resulting in significantly lower EIT values (Table 3.2). Miksche61 who studied the
degradation kinetics of a veratrylglycerol-{j-guaiacyl ether mode1 compound under
alkaline pulping conditions bas shown that the l3-aryl ether bond of the erythro isomer
is cleaved approximately four times faster than the threo isomer. A similar result bas aIso
been reported by Obst62• As such, the rate data set obtained for softwood milled wood
lignin under homogeneous kraft pulping conditions should not be surprising.
On a different front Jiang and Argyropoulos41 who monitored the stereoselective
degradation of {j-O-4 structures in model compounds, milled wood lignin and residual
and dissolved kraft lignins have reponed that the erythro isomers are less stable than their
92

•Table 3.3. Kinetic data describing the degradation of the erythro and threo isomers and the overall
arylglycerol- p-aryl ether units in milled wood lignin under homogeneous kraft pulpingconditions.
Temp.oC Rate Constant (k x lOS) s-l Correlation coefficient
Initial Bulk Initial Bulk
100 Erylhro isomer 14.1 ± 0.3 0.36±0.0 0.999 0.994Threo isomer 5.9±0.0 0.08±0.0 0.999 0.982Overall p-O-4 9.7 ± 0.1 O.IO± 0.0 0.999 0.996
120 Erylhro isomer 24.7±0.2 1.43 ± 0.0 0.999 0.999Threo isomer 14.2 ± 0.2 0.36± 0.0 0.999 0.999Overall p-O-4 18.8 ± 0.0 O.79±0.0 0.999 0.999
140 Erythro isomer 39.6 ± 1.2 5.38 ± 0.3 0.998 0.995Threo isomer 28.1 ± 1.0 3.50 ± 0.2 0.998 0.994Overall p-O-4 33.3 ± 0.1 4.24:1:0.0 0.999 0.999
160 Erythro isomer 69.1 ± 4.0 21.7 ± 1.0 0.993 0.996Threo isomer 56.4±4.0 17.5±0.7 0.990 0.997Overall p-O-4 61.1 ± 4.0 19.0 ± 0.8 0.992 0.997
•
93

•threo counterparts under kraft pulping conditions. In addition, Taneda et al. S8 who have
used ozonolysis to determine the erythro/threo ratios in a series of residual kraft lignins,
bave attributed their fmdings of consecutively lower ratios (as a function of degree of
delignification) to the lower reactivity of the threo isomer of the non-phenolic 13-0-4
lignin structures. Taneda et a1.S8 postulated that the actual reactivities of the erythro and
threo diastereomers, toward scission of the arylglycerol-l3-arylether bond, is govemed by
steric factors. An examination of the two possible confonnations of the l3-aryl ether
structures reveals that the formation of the epoxide intennediate is less favoured in the
case of the erythro diastereomer (Figure 3.5).
Therefore, the rate data ofTable 3.3 is further substantiated with literature efforts
on model compounds, isolated lignins and actual dissolved and residuallignin analyses.
The general stability of the threo diastereomers toward kraft pulping seems to he the
manifestation of a considerably slower reactioo of the pulping reageots with the threo
diastereomers of the l3-aryl ethers.
Ery''''o Form T",eo Form
CHzOH
HOti+'H~O.G
H
•Figure 3.7. The possible confonnations of arylglycerol-l3-aryl ether structures58
•
94

4It
Table 3.4. Activation energies, enthalpies, entropies, and Gibbs free energies goveming the degradation of the erythro and threoisomers and the overall arylglycerol- P-aryl ether structures in milled wood lignin under homogeneous kraft pulpingconditions.
-
Degradation phase From Arrhenius plot From Erying plot Gibbs free energy
1 1 1
Ea kJmor l ·R2 T T ·R2 T
( Initial )AH kJmor l AS JK-Imor l AG kJmor l
Erythro isomer 3S.2 ± 1.3 0.997 31.8 ± 1.3 -23S.3 ± 0.7 0.997 102.0 ± 1.0
Threo isomer SO.2 ± 1.0 0.999 46.8 ± 1.0 -202.1 ± 0.6 0.999 107.1 ± 1.0
Overall p-O-4 40.9± 0.9 0.999 37.S ± 0.9 -223.1 ±O.S 0.999 104.0 ± 1.0
(euik)Erythro isomer 91.5 ± 3.0 0.998 88.2 ± 3.0 -115.3 ± 1.6 0.998 122.6 ± 3.0
Threo isomer 122.3 ± 8.9 0.990 119.0 ± 9.0 -46.0± 5.0 0.989 133.0 ± 9.0
Overall p-O-4 117.5 ± 2.4 0.999 114.2 ± 2.5 -55.2 ± 1.4 0.999 130.7 ± 2.5
·R2_ Correlation coefficient
95

•
•
The Arrhenius plot of the data describing the initial phase (Table 3.3) indicates
that the cleavage of the erythro isomers required lower activation energy compared to
their threo counterparts. The difference between these activation energies was found to
he equal to 15±1.6 kJmol-1• Miksche's63 kinetic studies have also shown that the erythro
fonn of a arylglycerol-fj-(2-methoxyphenyl)-ether model compound is about 2.1 kcal
(8.8kJmol-1) more stable than its threo counterpart. The qualitative proximity of the two
sets of data is actually notable when one considers that Miksche6J examined model
compounds while this effort is focused on actual isolated lignin. The Arrhenius plot
(Figure 3.5) for the accumulated data during the bulk phase (Table 3.3) showed that the
erythro isomers required higher activation energy ta he cleaved than their threo
counterparts. The difference between these activation energies was found ta he equal to
30.8±9.4 kJmol- l .
In an effort to rationalize for the observed two kinetic phases the data of Figure
3.2 was examined as follows. The actual reduction in the concentration of (j-aryl ether
(specially for experiments conducted at lower temperatures) at the end of the initial phase
was correlated to the total amount of guaiacyl phenolic units present in the original milled
wood lignin. For example, at the end of the initial phase and for the isothennal data set
obtained at 100 oC the amount of (j-aryl ethers were reduced by S.9xl0·2 mol/L. Dy
considering that the total amount of guaiacyl phenolic hydroxyl groups, detennined on
the original milled wood lignin sample, was 8.8xlO-2 mol/L, then one realizes that during
the initial phase, the (j-aryl ethers bearing free phenolic groups would preferentially
cleave, followed by those whose phenolic groups are etherified64•
Obviously, in the data of Figure 3.2, the distinction between the etherified and
the non-etherified {j-aryl ethers that cao be made for the data set obtained at 100 ·C,
hecomes less accessible at higher temperatures. During the bulk phase of each isothermal
kinetic mn, non-phenolic fj-aryl ethers, and newly formed phenolic groups associated
with a- and (j-aryl ether structures undergo further degradation64• Miksche has shown that
model compounds possessing phenolîc hydroxyl groups react al differenl rates depending
on their substitution patterns and stereochemistry63. For example under alkaline
96

conditions, the formation of a quinonemethide from a model compound possessing a ")'
primary hydroxyl group Le. lA-{erythro) and IB-{Ihreo) proceeds approximately twice
as fast as the formation of quinonemethide from a compound whose 'Y- carbon does not
posses a hydroxyl group Le. 2A-{erythro) and 2B-(lhreo) (Figure 3.8).
H1
H-C-OH~H-C-O 0
1
~~YOCtfJ
OH
1A: R=H, R'=OH (.rythrot18: R=OH, R'=H (thl'8Ot
H
H-C-H~H-~-O 0R-C-R'
~ OCtfJ
~OCtfJOH
2A: R=H, R'=OH (erythrot28: R=OH, R'=H (threot
Figure 3.8. Arylglycerol-~-aryl ether model compounds containing free phenolichydroxyl groups examined by Miksche63
•
It is not, therefore, surprising that during the bulk phase, any residual non
etherified 6-aryl ethers may also c1eave slower than those cleaved during the initial phase
compared to the cleavage of etherified l3-aryl units during the initial phase64 •
The calculated values for the enthalpy, entropy and Gibbs free energy goveming
the scission of the (Wo diastereomers of the arylglycerol-l3-arylether structures of lignin,
were found to he relatively close (Table 3.4). The Gibbs free energies for the scission
of both diastereomers were found to he somewbat higher for the threo isomers during the
initial phase. The positive sign of the Gibbs free energies, determined for bath stages,
implies that the cleavage of the ~-O-4 moieties in lignin is a non-spontaneous process at
room temperature. The entropy signs describing the scission of bath isomers were found
to he negative. This is a common cbaracteristic in reactions involving polymers as
reactants6S• The entbalpy of activation for the cleavage of the erythro and threo isomers
were found to he positive, pointing to the endotbennic nature of the reaction during both
stages.
97

• •
E .., .., ,..,~,......, ,...,",,..,......, """"1"'''',''''ri"135.5 135.0 134.5 134.0 ppm
B.,~,,..,...,.., .., l'''''''I''W''''Pi.....,.., ..., .......,1"'1,
135.5 135.0 134.5 134.0 ppm
oef:-
I
A
Figure 3.9. Quantitative 31p NMR spectra of erylhrollhreo ratios of milled wood lignins al various times and temperaturesunder homogeneous kraft pulping conditions.(A: Starting material al 25°C, B: 225 min al 100°C, C: 180 minal 120°C, D: 90 min al 140°C, E: 90 min at 160°C).
98
•
•
3.4. CONCLUSIONS
The kinetics of the stereoselective degradation ofarylglycerol-{j-aryl ether linkages
present in softwood milled wood lignin were investigated by using quantitative 31p NMR
spectroscopy. The overall reaction involving the cleavage of these structures followed a
pseudo-first order rate law. The E/T ratio of the starting milled wood lignin was found
to he 1.02 and decreased to 0.51 after 2 hours of cooking al 160 oC. The activation
energy of the erythro isomer was found to he always lower than Its counterpart for both
the initial and the bulk phases of delignification.
Having explored the stereoselective degradation of the arylglycerol-{j-aryl ether
bonds using quantitative solution 31p NMR, we then tum our attention at better defining
the fonnation of condensed structures during kraft pulping. While in Chapter 3, we
followed an ether scission reaction, in chapter 4 we are following a carbon-carbon bond
formation as a side-reaction.
99
3.5. REFERENCES
• 1. Fergus, B. J., and Goring, D. A. 1., The topochemistry of delignification in kraftand neutral sulphite pulping of birch wood., Pulp Paper Mag. Can., 19, T315320, 1969.
2. Proct~er, A. R., Yean, W. Q., and Goring, D. A. 1., The topochemistry ofdelignification in kraft and sulphite pulping of spruce wood., Pulp Paper Mag.Can., 17, T445-453, 1967.
3. Chiang, V. L., Puumala, R. J., Takeuchi, H., and Eckert, R. C., Comparisonof softwood and hardwood kraft pulping., Tappi, 71(9), 173-176, 1988.
4'. Sarkanen, K. V., Precursors and their polymerization. in: Iignin: occurrence,formation, structures, and reactions., Eds. by Sarkanen, K. V., and Ludwig, C.H., Wiley-Interscience, New York, Chapter 4, pp. 95-163, 1971.
5. Chang, H-M. and Sarkanen, K. V., Species variation in lignin: Effect of specieson the rate of kraft delignification., Tappi, 56(3), 132-134, 1973.
6. Adler, E., Lignin chemistry: past, present, and future., J. Wood Sci. Technol.,Il, 169-218, 1977.
7. Nimz, H., Tschirner, U. and Roth, M., Mild hydrolysis of (j-O-4 linkages inIignin., 2nd Int. Symp. on Wood Pulping Chem., Tsukuba Science City,Japan, 1, 90-94, 1983.
8. Gellerstedt, G., Lindfors, E.-L., Lapierre, C. and Monties, B., Structuralchanges in lignin during kraft cooking. Part 2. Characterization byacidolysis., Svensk. Papperstidn., 87(9), R61-R67, 1984.
9. Yamasaki, T., Hosoya, S., Chen, C-L., Gratzl, J. and Chang, H-M.,Characterization of residual lignin in kraft pulp., 1Sl Int. Symp. on WoodPulping Chem., Stockholm, Sweden, 2, 34-42, 1981.
10. Taneda, H., Hosoya, S., Nakano, J. and Chang, H-M., Behaviour of ligninhemicellulose linkages in chemical pulping., 6th Int. Symp. on Wood PulpingChem., Melbourne, Australia, 1, 117-118, 1991.
11. Jiang, J., Chang, H-M., Bhattacharjee, S.S. and Kwoh, O. L. W.,Characterization of residual lignin isolated from unbleached andsemibleached softwood kraft pulps., J. Wood Chem. Technol., 7(1),81-96, 1987.
12. Minor, J. L., Chemical linkage of polysaccharides to residual lignin in
• 100

•loblolly pine kraft puIps., J. Wood Chem. Technol., 6(2), 185-201, 1986.
13. Gierer, J. , Imsgard, F. and Pettersson, 1., Possible condensation andpolymerization reactions of lignin fragments during alka1ine pulpiogprocesses., Appl. Polym. Symp., ~8, 1195-1211, 1976.
14. Chiang, V. L., Kalppo, K., Stokke, D. and Funaoka, M., Structural changes oflignin in kraft and acid sulphite delignification of western hemlock., 5th lot.Symp. Wood Pulping Chem., Raleigh, Ne, 593-597, 1989.
15. Hortling, B., Tunmen, E. and Sundquist, J., Investigation of residuallignin inchemical pulps. Part 2. Purification and characterization of residual Iignin afterenzymatic hydrolysis of pulps., Nord. Pulp Pap. Res. J., 7(2), 1-8, 1992.
16. Gierer, J., Aryl migrations during pulping., J. Wood Chem. Technol., 12(4),367-386, 1991.
17. Gierer, J., and Nelson, C. R., Mechanism of aryl group migration in theformation of stilbeoes from, 1, I-bis (p-hydroxyaryl)ethane 2-0-aryl ethers., J.Org. Chem., 43(21), 4028-4032, 1978.
18. Lundquist, K., NMR studies of Iignins. 4. Investigation of spruce Iignin by IHNMR spectroscopy., Acta Chem. Scand., B34, 21-26, 1980.
19. Nimz, H. H., Tschirner, V., Stiihle, M., Lehmann, R., Schlosser, M., Carbon13 NMR spectra of Iignin. 10. Comparison of structural units in spruce andbeech Iignio., J. Wood Chem. Technol., 4, 265-284, 1984.
20. Hauteville, M., Lundquist, K., von Unge, S., NMR studies of Iignins. 7. IHNMR spectroscopic investigation of the distribution of erythro and threo from {j0-4 structures in lignins., Acta Chem. Scand., 840, 31-35, 1986.
21. Matsumoto, Y., Ishizu, A., Nakano, J., Studies on chemical structure of Iigninby ozonation., Holzforchung Suppl., 40, 81"-85, 1986.
22. Ede, R. M., Brunow, G., Simola, L. K., Lemmetyinen, J., Two dimentional 1HIH chemical shift correlation and J-resolved NMR studies on isolated andsynthetic lignins., Holzforchung, 44, 95-101, 1990.
23. Lundquisl, K., von Unge, S., NMR studies of lignins. 8. Examination ofpyridine-ds solutions of acetylated Iignins from birch and spruce by IH NMRspectroscopy., Acta Chem. Scand., B40, 791-797, 1986.
24. Bardel, M., Gagnaire, D., Nardin, R., Robert, D., Vincendon, M., Use of 13C
• 101

•
•
25.
26.
27.
28.
29.
30.
31.
32.
33.
34.
enriched wood for structural NMR investigation of wood and wood components,cellulose and Iignin in solid and in solution., Holzforchung Suppl., 40, 17-24,1986.
Bardet, M., Lundquist, K., Roben, D., von Unge, S., 13C NMR spectroscopiestudies of the distribution of erythro and threo fonns of various types of (j-O-4structures in lignins., 1989 Proc. Int. Symp. on Wood Pulping Chem., Raleigh,U.S.A., May 22-25, 217-219, 1989.
Lundquist, K. and Stomberg. R., Stereochemistry of the structural elements inlignins., 5th Int. Symp. Wood Pulping Chem., Raleigh, NC, 659-662, 1989.
Taneda, H., Bahu, N. and Nakano, J., Ratio of erythro and threo isomers inlignin., 4lh Int. Symp. Wood Pulping Chem. Paris, France, 2, 175-178, 1987.
Matsumoto, Y., Ishizu, A. and Nakano, J., Studies on chemical structures ofIignin by ozonation., 200 lot. Symp. Wood Pulpiog Chem., Tsukuba ScienceCity, Japan, 4, 68-71, 1983.
Robert, D., Bardet, M., Lundquist, K. and von Unge, S., 13C NMRspectroscopic studies of the distribution of erythro aod threo forms of varioustypes of 13-0-4 structures in lignins., 51h lot.. Symp. on Wood Pulping Chem.,Raleigh, NC, 217-219, 1989.
Ralph, J., and Helm, R. F., Rapid proton-NMR method for determination ofthreo:erythro ratios in lignin model compouods and examination of reductionstereochemistry., 61h Int. Symp. Wood and Pulp Chem., Vol. 2, Melbourne, 345350, 1991.
Tsutsumi, Y., Islam, A., Anderson, C. D., Sarkanen, K. V., Acid pennanganateoxidations of lignin and model compounds: comparison with ozonolysis.,Holzforchung, 44, 59-66, 1990.
Sarkanen, K. V., Islam, A., Anderora, C. D., ln: Methods in Iignio chemistry:Ozonation., Eds. by Lin, S. Y., and Denee, C. W., Springer-Verlag Berlin,Heidelberg, Chapter 6, pp. 387-404, 1971.
Kringstad, K. P. and Morek, R., 13C-NMR Spectra of kraft Iignins.,Holzforsehung, 37, 237-244, 1983.
Archipov, V., Argyropoulos, D. S., Bolker, H. I. and Heitner, C., 31p NMRspectroscopy in wood chemistry. Part 1, Model compounds., J. Wood Chem.Technol., 11(2), 137-157, 1991.
102

•35. Archipov, Y., Argyropoulos, D. S., Bolker, H. 1. and Heitner, C., 31p NMR
spectroscopy in wood chemistry. Part n, Phosphite derivatives ofcarbohydrates., Carbohydr. Research, 220, 49-61, 1991.
•
36.
37.
38.
39.
40.
41.
42.
43.
44.
45.
46.
Argyropoulos, D. S., Archipov, Y., DoUcer, H. 1. and Heitner, C., 31p NMRspectroscopy in wood chemistry. Pan IV, Lignin models: spin-Iattice relaxationtimes and solvent effects in 31p NMR., Holzforschung, 47(1), 50-56, 1992.
Argyropoulos, D. S., Bolker, H. 1., Heitner, C. and Archipov, Y., 3lp NMRspectroscopy in wood chemistry. Part V, Qualitative analysis of Hgnin functionalgroups., J. Wood Chem. Technol., 13(2), 187-212, 1993.
Argyropoulos, D. S., Quantitative phosphoms-31 NMR analysis of lignins, Anew tool for the Iignin chemist., J. Wood Chem. Technol., 14(1), 45-63, 1994.
Argyropoulos, D. S., Quantitative phosphoms-31 NMR analysis of six solubleIignins., J. Wood Chem. Technol., 14(1), 65-82, 1994.
Adler, E., Brunow, G., and Lundquist, K., Investigation of the acid-eatalysedalkylation of lignins by means of NMR spectroscopie methods., Holzforchung,41, 199-207, 1987.
Jiang, Z.-H., Argyropoulos, D. S., The stereoseleetive degradation ofarylglycerol-(3-aryl ethers during kraft pulping., J. Pulp Pap. Sei., 20(7), J183187, 1995.
Froass, P. M., Ragauskas, A. J., and Jiang, J. E., Chemical structure ofresidua1 lignin from Kraft Pulp., J.Wood Chem. Technol., 16(4), 347-365,1996.
Saake, B., Argyropoulos, D. S., Beinhoff, O., and Faix, O., A comparison ofIignin polymer models (DHPs) and Lignins by 31p NMR spectroscopy.,Phytochemistry, 43, 499-507, 1996.
Bjôrkman, A. Studies on finely divided wood. Part 1. Extraction of lignin withneutral solvents., Svensk. Papperstidn., 59, 477-485, 1956.
Gierer, J., and Ljunggren, S., The reaction oflignins during sulfate pulping: Part16. The kinetics of the cleavage of l3-aryl ether linkages in structures containingcarbonyl groups., Svensk. papperstidn., 82, 71-81, 1979.
Merbach, A. B., Moore, P., Howarth, O. W., and Mcteer, C. H., Stopped-tlowFourier-transform NMR and NMR line broadening studies of the rates ofdimethyl sulphoxide exchange with the hexakis (dimethylsulphoxide) complexes
103

•of Aluminium(lll), Gallium(lll) lODS in nitI'omethane solution., Inorg. Chim.Acta., 39, 129-136, 1980.
47. Beitz, J. V., Miller, J. R., Cohen, H., Wieghardt, K., and Meyerstein, D.,Activation energies for an intramolecular electron transfer reaction., Inorg.Chem., 19, 966-968, 1980.
•
48.
49.
50.
51.
52.
53.
54.
55.
56.
57.
Glasstone, S., Laidler, K. J., and Erying, H., The theory of rate processes.,McGraw- Hill, New York, Kreevoy, M. M., and Truhlar, D. G., Chap. 1, 1941.
Kohnstam, G. , Heat capacities of activation and their uses in mechanisticstudies., Adv. Phy. Orge Chem., 5, 121-172, 1967.
Manon, J., Lignins: Occurrence, formation, structure and reactions., Eds. bySarkanen, K. V., and Ludwig, C. H., Wiley-Interscience, New York, Ch. 16,p. 639, 1971.
Gierer, J., Lenz, B., Norén, 1., and SOderberg, So, Reactions of lignin duringsulfate cooking m. The splitting of aryl-alkyl ether bonds in milled woodlignin by alkali., Tappi, 47(4), 233-239, 1964.
Gierer, Jo, and Kunze, 1., Zur Spaltung von ~-Hydroxy-alkyl-aryUithem durchAlkali., Acta Chem. Scando, 15, 803-807, 1961.
Gierer, J., and Norén, 1., Zur Spaltung von ~-Hydroxy-alkyl-arylathem durchalkali. ll. Der stereochemische verlauf., Acta Chem. Scand., 16(8), 1976-1988,1962.
Adler, B, Chïm., Biochim., Lignin, Cellulose et Hemicelluloses., Grenoble, p.73, 19640
Adler, B., Falkehag, 1., Marton, J., and Halvarson, H., The behaviour of Iigninin alkaline pulping Part 2; Model experiments with arylalkyl-~-aryl ether., ActaChem. Scand., 18, 1313-1314, 1964.
Gierer, J., Lenz, B., and Wallin, No-H., The Reaction of lignin during sulphatecooking. Pan Voile Model experiments on the splining of aryl-alkyl ether linkagesby 2N sodium hydroxide and by white Iiquor**., Acta Chem. Scand., 18, 14691476, 1964.
Bronow, Go, KarlssoD, 00, Lundquist, K. and SipiUi, J., On the distribution ofthe diastereomers of the structural elements in lignins: The steric course ofreactions mimicking Iignin biosynthesis., Jo Wood Sci. Technol., 27, 281-286,1993.
104

•58. Taneda, H., Habu, N., and Nakano, J., Characterization of the side chain sterie
stnlctures in the various lignins., Holzforschung, 43, 187-190, 1989.
59. Miksche, G. E., Lignin reaetions in alkaline pulping processes (Rate processesin soda pulping)., Chemistry of delignification with oxygen, ozone, andperoxides. UniPublishers Co., LTD. Tokyo, Japan, pp. 107-120, 1980.
•
60.
61.
62.
63.
64.
65.
Lundquist, K. , On the degradation of Iignin during pulping conditions.,Chemistry of delignification with oxygen, ozone, and peroxides. Uni PublishersCo., LTD. Tokyo, lapan, pp. 121-135, 1980.
Miksche, G.E., Zum AIkalischen Abbau der Alkoxyarylglycerin-l3AryUitherstrukturen der Lignins., Versuche mit Erythro-Veratryiglycerin-l3Guajacylither., Acta Chem. Scand., 26(8), 3275-3281, 1972.
Obst, J. R., Kinetics of alkaline cleavage of {j-Aryl ether bonds in lignin models:Significance to delignification., Holzforschung, 37, 23-28, 1983.
Miksche, G. E., Über das verhalten des lignins bei der alkalikochung., VITI.Isomerisierung der phenolatanionen VOD erythro- und threo- isoeugenolglykol-~
(2-methoxyphenyl)-ither über ein chinonmethid., Acta Chem. Scand., 26, 41374142, 1972.
Ljunggren, S., The significance of aryl ether cleavage in kraft delignifieation ofsoftwood., Svensk. Papperstidn., 13, 363-369, 1980.
Moore, J. W., and Pearson, R. G., Kinetics and Mechanism., Third editioD. AWiley-Interseience Publication, New York, p. 180, 1981.
105

•
•
Cbapter 4
On the Formation of Dipbenylmethane Structures in Lignin UnderKraft, EMCC· and Soda Pulping Conditions
4.0. ABSTRACT
This chapter describes our efforts focused at defming the fonnation of
diphenylmethane moieties in lignin during conventional kraft and soda pulping conditions.
This objective was realized by coOÏtrming initially the assignment of a 31p NMR signal
as being due exclusively to the presence of phosphitylated diphenylmethane (DPM)
phenolic hydroxyl groups. More specifically, softwood milled wood lignin (p;cea
mtlrianna) was subjected to kraft pulping conditions in the presence and absence of
varying amounts of fonnaldehyde. After quantitative recovery of the lignin, the 31p NMR
spectra were recorded and the spectra revealed selective signal growth in the region
confmed between 142.8-144.3 ppm, in accordance with previous model compound work
and detailed calculations based on the Hammett principles. To further substantiate our
conclusions we also carried out (WO series of isothermal (120 OC) kraft and soda pulping
experiments followed by quantitative determinations of the DPM moieties and correlated
our findings with the differences in chemistry known to occur between the two processes.
Finally, diphenylmethane phenolic moieties were detennined in isolated residuallignins
from two western hemlock kraft pulp samples produced via an EMCC· mill protocol and
a laboratory batch digester, reSPectively. These structures prevailed amongst the
condensed phenolic units of the conventional pulp, providing additional evidence
supporting the fact that modem modified pulping technologies alter the structure of
residual kraft lignin beneficially.
106

•4.1. INTRODUCTION
While the ether bonds of lignin cleave efficiently under alkaline pulping
conditions, the formation of condensed structures decreases its reactivity and diminishes
the solubility of the residual ligninl. This phenomenon seriously interferes with the
complete removal of Iignin and the rate of delignification, especially during the fmal
stages of most pulping processes.
During the past several years a number of modifications have been proposed for
the conventional kraft pulping process aimed at enhancing delignification2-s. Rapid
displacement heating (RDH)6-9 and modified continuous cooking (MCC)1(),13 are two
examples of these processes. In addition, the use of pulping additives such as
polysulfide l4-16 and anthraquinone l 6-18 have also been advocated.
Amongst the reactions that are known to interfere with the process of alkaline
delignification are those involving the fonnation of carbon-carbon bonds. Formaldehyde
is known to be Iiberatedl9 as early as 100 oC, as a result of C"f elimination from
phenylcoumaran20•
21 and from guaiacylglycerol-~-aryl ether structures, both abundant in
native lignin22-24
• The released formaldehyde is known to cause the substitution of
hydroxymethyl groups al positions onho to the phenolate moieties22• This potentially
represents a very important reaction since one-third of the phenolic nuclei in softwood
kraft lignin2S and about one-half of the phenolic and non-phenolic uoits in softwood
milled wood lignin contain free CS positions23. The methylolated phenols may undergo
further reaction to yield dipbenylmethane moieties1• 26, 27.
~~CH20 Rt OH Rt R,
(+u+). 0 .H20. 0 0Io\CO~CHPt ~co~~o
OH OH OH
•Figure 4.1. Formation of a typical diphenylmethane moietyl.
107

•A number of these stnlctures a-IV) have been suggested28-31. Another
condensation reaetion caused by the Iiberation of formaldehyde during alkaline hydrolysis
is Tollen's reaction1• This reaction involves the substitution of hydroxymethyl groups at
side-chain positions provided activating carbonyl groups are present1• 2S •
.J:- .t-
•
Figure 4.2. Chemical structure of different diphenylmethane moieties in lignin.
A1though several studies by Cbiang and Funaoka32o:W bave claimed to show
convincing qualitative and quantitative evidence for the presence of diphenylmethanes in
residual kraft lignin, a number of questions in relation to the method of detection have
recently surfaced35. Since the development of 31p NMR spectroscopy36-40 for probing
lignin stnlcture, the technique has been successfully implemented for the absolute
detennination of the various phenolic and non-phenolic structures in severa! native and
technicallignins41.44. The availability of a phosphitylating reagent'"l that permits excellent
resolution, and the quantitative spectroscopie detection of several phenolic moieties with
varying substitution pattems44-46, provides an excellent opportunity for systematically
exploring the complex reactions tbat cecur in lignin during alka1ine pulping. For
108

•example, such an effort bas already lead to the defmition of the fundamental
thermodynamic parameters that govem the stereoselective degradation of the arylglycerol
P-aryl ether bonds in milled wood lignin under kraft pulping conditions47 •
As mills move toward elemental chlorine free bleaching (BeF) the negative
impact of condensed lignin structures on fmal pulp brightness ceiling provides additional
incentives to minimize condensation reactions from occurring in the digester and during
oxygen delignification. The precise identification of such structures and their formation
kinetics could he a major step forward toward understanding and minimizing their
detrimental effects.
In this paper we aim to describe our efforts that are focused at defming the
formation of diphenylmethane moieties in lignin during conventional kraft and soda
pulping conditions. This objective was realized by initially confmning the assignment of
a 31p NMR signal as being due exclusively to the presence of phosphitylated
diphenylmethane phenolic hydroxyl groups. The overall phosphitylation reaction of labile
protons is depicted as follow;
,0-1....,.R-OH + CI-P,~
° /Pyridlne • °1·'/ '"
R-O-P
'0 j
+ HCI
•
Figure 4.3. The derivatization reactio~ of 2-chloro-4,4,5,S-tetramethyl-l,3,2dioxaphospholane with compounds containing labile hydrogens.
We then accumulated kinetic data for the formation of these species under soda and kraft
.pulping conditions and correlated this infonnation to known chemistry.
109

•
•
4.2. EXPERIMENTAL
4.2.1. Materials and Metbod
4.2.1.1. Preparation
Isolation of Mi"ed Wood Lignin
The extraction and purification of milled wood lignin was carried out according
to the Bjôrkman method44• Initially 150-200 g of wood chips were pulverized to 100
mesh and then subjected to ball milling (3 weeks) using a porcelain ball mill. The wood
meal was then dispersed in 3L of dioxane containing 4.0% water. The suspension was
stirred with a magnetic bar for 3 weeks. The wood meal was then separated and
discarded from the dioxane solution by centrifugation. The dioxane solution was
evaporated under reduced pressure. The resulting residue was dissolved in acetic acid (20
mL per gram of lignin) containing 10% water. This solution was then added to water
(250 mL per gram of Iignin) while stirring. This material was then washed by
centrifugation with occasional shaking of the vesse1 to distribute the lignine After
evaporating the water with a stream of air, the isolated residue was dissolved in (2: 1 v/v)
1,2-dichloroethane/ethanol (20 mL per gram of lignin). This solution was added dropwise
to diethyl ether (250 mL per gram of lignin). The material was then centrifuged and
washed after decanting the ether. This step was repeated 2-3 limes in which, each
washing was allowed to stand overnight. The final products were washed once with
Îlexane and the precipitate was flI'St dried in air and then over drierite in vaeuo. The
elemental analysis of the resulting material was carbon 60.86%, hydrogen 5.71 %, and
methoxyl 15.45%.
Preparation of Kraft Pulps and Resitluallignin Isolation
A conventional western hemlock kraft pulp was prepared at Paprican in a
laboratory batch digester using conditions described previously46. The western hemlock
EMCC· (extended modified continuous cooking) pulp was supplied by a Canadian mille
The isolation of residual lignin was camed out from pre-extracted pulp Meal following
a procedure46 described previously.
110

•
•
4.2.1.2. Reactions
TretJlment ofmilled wood lignin under homogeneous kraft or soda pulping conditions
Initially, a white liquor solution was prepared containing 7.0 g of sodium
hydroxide (0.175 mole NaOH) and 6.2 g of sodium sulphide (0.026 mole Na2S.9H20)
per 100 mL deionized water. For the case of the soda "cooks" the molar amount of
sodium sulphide (Na2S.9H20) used for the kraft pulping experiments was substituted with
sodium hydroxide dissolved in 200 mL of deionized water and dioxane (1: 1 v/v). This
solution was then mixed with an equal volume of dioxane. During a typical experiment,
0.1 g of softwood milled wood lignin prepared according to the Bjôrkman procedure47•
48 and having the following elemental composition: 60.86%carbon, 5.71 %hydrogen, and
15.45% methoxy, was used. This lignin was dissolved in 1.33 g of the previously
described white Iiquor (the ratio of Iiquor:lignin was 4: 1). The reaction was carried out
in a 10 mL stainless steel bomb whose air was displaced by nitrogen. The kraft cooking
was simulated by heating and occasionally shaking the bomb in an oil bath preheated to
the desired temperature and for specific tinte intervals. At the end of the reaction period,
the bomb was cooled with cold water and its contents were acidified to pH 2 using dilute
hydrochloric acid (0.2M Hel). The precipitate was allowed to settle ovemight. It was
then collected by centrifugation and washed with acidic water to remove the inorganic
sal15. The precipitated degraded Iignin was then freeze dried and brought to constant
weight at room temperature under reduced pressure. This material accounted for
approximately 80% of the initial weight of lignin used. In an effort to isolate the
remaining 20%, the solution containing the water soluble low molecular weight Iignin
resulting from the flrst aqueous acidic precipitation was allowed to dry at room
temperature. The remaining low molecular weight lignin was extracted by addition of lO
IS mL high-grade tetrahydrofuran. This was followed by evaporation of the solvent to
a fine viscous residue, and dropwise addition to 20 mL of diethyl ether. This step was
repeated 2-3 limes allowing the collection of more Iignin, free from inorganic salts.
Finally, the diethyl ether was evaporated and the remaining lignin was freeze dried. The
samples, after being brought to constant weight under reduced pressure, accounted for
almost 16% of the staning Iignin. The two sets of degraded Iignin samples collected,
III

•
•
were then mixed thoroughly prior to subsequent analyses.
Addition ofjormaldehyde 10 miUed wood ligninJoUowedby homogeneous laa/t pulping
100 mg of milled wood Iignin were placed in a 10 mL stainless steel bomb. The
lignin was then dissolved by the addition of 1.33 g of white liquor solution, prepared by
dissolving 7.0 g of sodium hydroxide (NaOH) and 6.2 g of sodium sulphide (Na2S.9H20)
in 200 ml, solution of deionized water and absolute dioxane (1:1 v/v). Two separate sets
of experiments were carried out 120 oC in which the amount of fonnaldehyde added was
varied. For the fmt series of experiments Il.1 ILL of a 30% fonnaldebyde solution,
accounting for SO% of the totall3-aryl ether bonds, was added to each sample, while for
the second series, 22.2 #LL (representing 100% of the total l3-aryl ether bonds) were
added. After replacing the air with nitragen, each bomb was sealed. Four reaetion bombs
(each containing the above mixture) were then placed in a preheated oil bath and after
occasional shaking they were removed after l, 2, 3, and 4 hours of treabnent. The
isolation and purification procedure were conducted in a manner identical to those
discussed in the previous section.
4.2.1.3. Instrumentation,_
Quantitative JIP NMR spectroscopy
Tbederivatizingreagent2-chlor0-4,4,S,S-tetrametbyl-l,3,2-dioxaphospholanewas
synthesized40 and used as the phosphitylation reagent. Approximately 30 mg of dry lignin
was added to 800 ~L of a solvent mixture containing pyridine and CnCl] at a volume
ratio of 1.6/1. The mixture was stirred with a magnetie bar until the lignin was fully
dissolved. This was followed by the addition of 100 "L of a solution containing both (11
mg/mL) eyclohexanol, used as the internai standard, and (S mg/mL) chromium
acetylacetonate, used as the relaxation reagent. Finally, 100 ILL of 2-chloro-4,4,S,5
tetramethyl-l,3,2-dioxaphospholane, was added and the flask was sealed and shaken to
ensure thorough mixing. The 31p NMR sPectra were obtained by using inverse gated
decoupling on a Varian XL-300 FT-NMR SPectrometer at 121.5 MHz. The obtained
sPectra were integrated 3 times in separate occasions and the resulting data were
112

•
•
averaged out as reponed here. Further details dealing with acquisition and spectral
processing have been described elsewhere40• 49•
113
•
•
4.3. RESULTS AND DISCUSSION
In our earlier work the phosphorus NMR spectra of solubilized kraft lignin
contained, amongst others, a signal centered around 143.5 ppm40. On the basis of model
compound work and calculations based on the Hammett principlesso ~ this signal was
tentatively assigned to be due to diarylmethane structures possessing free phenolic
hydroxyl groupS40. In an effon to conftml the validity of our earlier work, the interaction
of milled wood lignin with formaldehyde under kraft pulping conditions was clarified by
conducting experiments in which different amounts of formaldehyde were introduced in
the reaction mixture prior to the cook. More specifically, two different sets of
experiments were carried out with four samples of milled wood lignins being subjected
to kraft pulping at 120 oC with the addition of fonnaldehyde accounting for 50 and 100%
. of the total aryl ether uoits of lignin, respectivelySl. After quantitative recovery of the
lignin, the 31p NMR spectra were recorded and the spectra critically examined. Figure
4.4 shows a representative series of 5uch spectra.
A comparison of the 31p NMR spectra of milled wood lignin (A) to those treated
under kraft pulping conditions without (B) and with (C & D) the addition of
fonnaldehyde, reveals substantial signal growth (Table 4.1) at around 143.5 ppm. Indeed
the area under the broad signal (142.8-144.3 ppm), labelled DPM, was increased in
spectra C and D where significant amounts of fonnaldehyde have been added (Table
4.1). In addition, one observes that the spectra of the samples in which formaldehyde bas
been added display a new signal at 147.01 ppm which appears in the aliphatic OH
region. In accordance with the cbemistry of the fonnaldehyde/phenol interaction, that is
known to occur under alkaline conditionsI9• 20, it is' very likely that this signal is due to
the aliphatic primary hydroxyl group of methylolated aromatic rings.
When the 31p NMR signal in the region 142.8-144.3 ppm, was integrated, the
determination of the actual concentrations of diphenylmethane structures in milled wood
lignin in the presence and absence of formaldehyde under kraft pulping conditions as a
function of reaction time at 120 oC was made possible (Table 4.1) ..
The quantitative data thus collected revealed that under isothermal conditions (120
OC) the addition of formaldehyde to the kraft reaction medium causes the build up of
114

•OPM structures within lignin, while in the absence of extemally added formaldehyde,
these structures predominate after three to four hours of reaction. It is also interesting
to note that when a large excess of formaldehyde was added (amounting to 100% of the
total aryl ethers) the amount of OPM structures reached a value of 0.4 mmoles/g within
60 minutes at 120 oC remaining approximately constant beyond this point.
Table 4.1. Showing the actual amounts of OPM(l) stnlctures present in MWL(2) beforeand after the addition of formaldehyde(3) under homogeneous kraft pulpingconditions(4).
Reaction Time (min) DPM x 1()4 (mollg)
Control Kraft 50%(3) 100%(3)
60120180240
0.831.412.414.10
1.602.203.004.10
4.04.24.44.6
•
(1) Diphenylmelhane structures(2) Milled wood lignin (softwood. Picea mDriana)(3) Amount of formaldehyde added. expressed as "of the total amount of aryl ethers present in MWL(4) The temperature of the kraft pulping experimenl was set at 120 oC
In an effort to further substantiate our conclusions we then carried out two series
of isothermal (120 OC) kraft and soda pulping experiments followed by quantitative
determinations of the OPM moieties and correlated our findings with the differences in
chemistry known to occur between the two processes.
The data of Table 4.2 clearly demonstrates that the formation of diphenylmethane
moieties is a considerably more facile reaction under soda pulping conditions than under
kraft pulping conditions. Sulphide ions present in kraft liquors are responsible for
promoting and accelerating lignin fragmentation reactions as weil as suppressing
undesirable condensation reactionsl • 52. 53.
The presence of sulfide ions within sulfate liquors has been suggested to preclude
the Iiberation of formaldehyde from the lignin biopolymer19• Alternatively, the absence
of sulfide, i.e. soda pulping, allows the intennediate quinonemethides (Figure 4.5) to lose
formaldehyde, causing the formation of undesirable a1kaline stable enol ethers l • S4 •
115

•DPM 4O-W ....
•
D
c
B
A
f' , , , " '" -'lT-.TTll ' , , f' , , , " , , , f'-'--'-' 1 1 1 1 • f' •• 1 1 • • l , )' Till' 1 1 TJTTTTlI , , , '1 ,,,",,,l' ,111 ta 1. ttM 142 t40 111 tM tM
Figure 4.4. Quantitative 31P NMR spectra of milled wood Iignin before and after being subjected to isothermal (120 oC,3 h) homogeneous kraft pulping conditions; (A) blank, (8) control kraft pulping, (C) with the addition of 11ILLand (D) 221lL fonnaldehyde corresponding to 50% and 100% of the aryl ether structures in lignin.
116

•
•
Table 4.2. Showing the actual amounts of DPM(l) stnlctures present in MWL(2) underhomogeneous kraft and sodaO) pulping conditions(4).
Reaction 1;"ime (min) DPM x 10" (mollg)
Kraft pulping Soda pulping
60 0.83 1.60120 1.41 2.20180 2.41 3.10240 4.10 4.30
Cl) Diphenylmedlane structures.(2) Milled wood lignm (softwood. Picea mariana).(J) Amount of sodium sulphide was replaced with sodium hydroxide.(4) The lemperature of the pulping experiments was set al 120 oC.
The rate data of Table 4.2 clearly demonstrates the efficiency of fonnation of
diphenylmethanes under soda pulping conditions especially early in the process.
Therefore, it is not surprising that bleaching a soda-AQ pulp is more difficult compared
to a kraft pulp of a similar kappa numbers.
Amongst the various principles that operate during modified pulping, the control
of alkalinity is of prime importance. Maintaining hydroxide concentration at a uniformly
low level offers distinct advantages as far as carbohydrate degradation is concerned. In
this context, maintaining a uniformly low alkalinity May also have an impact on the
actual amount of diphenylmethane structures that fonn within the residual kraft lignin.
For this rcason residual Iignin was isolated from two hemlock kraft pulp samples (kappa
number 26.0) produced via an EMCC· mill protocol and a laboratory batch digester,
respectively. The data of Table 4.3 is in accord with the previous observations. While
in the conventional kraft pulp the overall amount of C-S substituted phenolic
environments is higher by Il%, the diarylmethane structures prevail amongst them by
37%. This data coupled with the eartier account of Froass et al. (43) provides convincing
evidence supporting the fact that modern modified cooking technologies alter the structure
of lignin beneficially.
The region of the 3lp NMR spectra assigned to the overall condensed phenolic
uoits (140.2-144.3 ppm), in addition to the diphenylmethane moieties, also includes
phenolic hydroxyl groups belonging to 4-0-5' and 5,5' structures.
117
•
H-b-OHZ>-OCH;sH-t-o , ,tt:0It
.: - -OK
HoCO~·"o·
H-b_OH~OCH;sH-t-o
~H-t ,-,.. . ..1 1 Soda
I\CO ". [PDIPing]
[Kraft] 11+ aH'pulpioK -If
H-C-O };
~H-a ~
/, +
HoCO ' 1••.O·
CHzO
•
H-b-OHz>-OCItJH-tCb , ,H-t~· -
I\CO~"'/o·
HH-C-OH
H-tl'S·
H-C'"
HoCO~'"O·
-50
H1H-C-OH
H-tH-A
HoC;;)••.o·
+ ~,,,
Figure 4.5. The cleavage of {j-aryl ether bonds in kraft and soda pulpingS4•
118

•More specifically, on the basis of model compound work and detailed calculatioDS
these structures have been assigned to the signais ranging between 142.8-141.7 ppm and
141.7-140.2 ppm respectively40'so (Figure 4.4). This assignment was also conftmled by
the efforts of Smit and co-workers44• In 1995, Brunow's group announced the discovery
of the dienzodioxocin bonding patterns as being prevalent in softwoods ligJlins56. S7. This
involves the formation of a, {J ethers on the same 5-5' biphenyl structure. The new
inoiety when subjected to soda pulping conditions was shown to release significant
amounts of structures bearing 5,5' biphenolic hydroxyl groups58. Therefore, under kraft
pulping conditions it is likely that sunilar reactions will occur releasing 5,5' biphenolic
hydroxyl groups. The data of Figure 4.6 shows that indeed such structures are released
in very significant amounts after 4 hours at 120 oC (about 1.5 mmole/g are fonned
within milled wood Iignin). As anticipated, the presence of fonnaldehyde does not seem
to affect the rate of formation of S,S' biphenolic hydroxyl groups or the concentration
of dibenzyl ether (4-0-5') stnlctures.
Table 4.3. Showing the actual distribution of condensed and diphenylmethanestructures present in conventional and EMCC· kraft pulps of similar kappanumber.
Pulp sample identity Total Concentration x lot (mol/g)
Condensed units1 DPM units2
Conventional kraft (k=26.8)3
EMCC· kraft (k=26.0)3
(1) Total condensed phenolic slructures.(2) Diphenylmelhane phenolic OH structures.(3) Kappa number.
17.0
15.0
3.0
2.0
•
Finally, the formation of diphenylmethane structures under kraft and soda pulping
conditions were found to follow pseudo-fint-order kinetics with rate constants 14.8 xl0-s
± 2.2 x 10·7s·1 and 9.2 x 10's ± 8.8 x 10"5'1, respectively.
119
• •2.00
1.80';1
1.60---...0a 1.40e
---'1.20ri)....-1.00CI
::1
-a 0.80~ri)
c 0.60u~c:: 0.400U
0.10 ~ __ < __( --c -,- -< -,-< --'-( -,-< -,-< -,-<.-( 4-0-5'0.00 1" "0 C -,-<, , ·
\ V a W A .. 1
No Formaldehyde 50'. Fonnaldehyde
Time(min)
100% FOlllUlldehyde
Figure 4.6. Kinetic data showing the development of the actual amounts of 4-0-5', 5,5' biphenolic and diphenylmethanephenolic hydroxyl structures on softwood milled wood lignin under homogeneous kraft pulping conditions al120 oC in the presence and absence of fonnaldehyde. The amount of fonnaldehyde added is expressed as %ofthe total amonnt of aryl ethers present in MWL.
120

•
••
4.4. CONCLUSIONS
Dy using quantitative 31p NMR spectroscopy it is possible to identify, quantify and
fol1ow the formation of phenolic hydroxyl groups that belong to diphenylmethane units
under kraft and soda pulping conditions. Tbese units exhibit a 31p chemical shift signal
that is confmed between 142.8 ta 144.3 ppm. Data derived during the course of this
work implied that diphenylmethanes are formed in higher quantities during a conventional
pulping as opposed to its EMCC~ counterpart, at the same kappa number.
Having explored the formation of condensed structures in kraft lignin, which
seriously affect its subsequent reactivity, we now turn our attention at another functional
group which when present on the lignios side-chain dramatically affects its reactivity; this
is the carbonyl group. Chapter 5, using Madel compounds explores the fundamentals of
a novel NMR-based technique for the detection of minute amounts of carbonyl groups
in lignin.
121

4.5. REFERENCES
• 1. Marton, J., Reactions in alkaline pulping., In Lignins: occurrence, formation,structure, and reactions., Eds., K. V. Sarkanen, C. H. Ludwig, WileyInterscience, New York, pp. 639-694, 1971.
2. Johansson, B., Mjôberg, J., Sandstrôm, P., and Teder, A., Modified continuouskraft pulping-now a reality., Svensk. Papperstidn., 10, 30-35, 1984.
3. Backlund, A., Extended delignification of softwood kraft pulp in a continuousdigester., Tappi, 67, 62-65, 1984.
4. Teder, A., and Sandstrôm, P., Pulp yield in continuous kraft pulping with amodified alkali profile., Tappi, 1, 68, 94-95, 1985.
5. Mera, F. E., Chamberlin, J. L., Extended delignification, an alternative toconventional kraft pulping., TAPPI Pulping Conf. Proceed., Washington, DC,pp. 459-465, 1987.
6. Swift, L. K., Dayton, J. S., RDH pulping process, impact on the mill energybalance., CPPA Energy Management Conf. Toronto, ON, pp. 31-37, 1987.
7. Tikka, P. O., Virkola, N. E., Pursiainen, S. A., Hamala, I. T., The processchemistry and the control of an RDH-digester house., TAPPI Pulping Conf.Proceed., Washington, OC, pp. 635-645, 1987.
8. Barrat, K. B., Kraft pulping for the environment of the 90's., TAPPI AnnualMeeting Proceed., TAPPI PRESS, Atlanta, GA, pp. 95-102, 1990.
9. Shin, N. H., Sundaram, V. S. M., Jameel, H., Bleaching of softwood RDHpulps with low/no chlorine bleaching sequence., TAPPI Annual MeetingProceed., TAPPI PRESS, Toronto, ON, pp. 817-828, 1990.
10. Dillner, B., Larsson, L. O., and Tibbling, P., Nonchlorine bleaching of pulpproduced by the modified continuous cooking process., Tappi, 73, 167-172,1990.
Il. Whitley, D. L., Zierdt, J. R., and Lebel, D. J., Mill experience with conversionof a Kamyr digester to modified continuous cooking., Tappi, 73, 103-108, 1990.
12. Stromberg, B., Modified continuous cooking-an update., TAPPI Pulping Conf.Proceed., Washington, OC, pp. 453-458, 1987.
13. Prasad, D. Y., Gnanasekaran, A., and Mohan Rao, N. R., Modified kraft
• 122

•hardwood pulp yields high brigbtness and higb strengtb., Tappi, 77, 141-147,1994.
14. Jiang, J. E., Extended modified cooking ofsouthem pine with polysulfide: effectson pulp yield and physical properties., Tappi, 77, 120-124, 1994.
15. Mao, B., and Hartler, N., Improved modified kraft cooking; Part 3: Modifiedvapor-phase polysulfide cooldng., Tappi, 77, 149-153, 1994.
16. Jmeel, H., Gra12l, J., Prasad, D. Y., and Chivukula, S., Extendingdelignification with AQ/polysulfide., Tappi, 78, 151-160, 1995.
17. Blain, T. J., Anthraquinone pulping: fifteen years later., Tappi, 76, 137-146,1993.
18. Sturgeoff, L. G., and Pitl, Y., Low-kappa pulping without capital investment:using anthraquinone for low-kappa pulping., Tappi, 77, 95-100, 1994.
19. Ekman, K. H., Fonnaldehyde obtained by alkaline hydrolysis of wood andlignin., Tappi, 84, 398-402, 1965.
20. Adler, E., Manon, J., Falkehag, S. 1., The behaviour of lignin in alkalinepulping, 1. Model experiments with phenylcoumarans., Acta Chem. Scand., 18,1311-1312, 1964.
21. Gierer, J., SOderberg, S., Über die carbonylgruppen des lignins., Acta Chem.Scand., 13, 127-137, 1959.
22. Adler, E., Falkehag, S. 1., Manon, J., and Halvarson, H., The behaviour oflignin in alkaline pulping, ll. Model experiments with arylalkyl-{J-aryl ethers·.,Acta Chem. Scand., 18, 1313-1314, 1964.
23. Adler, E., Lundquist, K., Estimation of "Uncondensed" phenolic units in sprucelignin., Acta Chem. Scand., 15, 223-234, 1961.
24. Gierer, J., Lenz, B., and Wallin, N. H., The splitting of aryl-alkyl ether bondsin milled wood lignin by white liquor. Pan VII. Reaction of lignin during sulfatecooking., Tappi, 48, 402-405, 1965.
25. Marton, J., Manon, T., and Falkehag, S. 1., Alkali-catalyzed reactions offormaldehyde with lignins., Adv. Chem. Ser., 59, 125-144, 1966.
26. Chirkin, G., and Tishschenko, D., Oxidation reduction in alkaline pulping.,Zhum. Priklad. Khim., 35, 153-159, 1962.
• 123

•27. Harkin, J. M., o-Quinonemethides as tentative structural elements in lignin.,
Adv. Chem. Ser., 59, 65-74, 1966.
28. Gierer, J., Chemistry of delignification. Part 1: General concept and reactionsduring pulping., J. Wood Sei. Technol., 19, 289-312, 1985.
29. Brunow, G., Miksche, G. E., Sorne reactions of Iignin in kraft and polysulfidepulping., Appl. Polym. Symp., 28, 1155-1168, 1976.
30. Gierer, J., Imsgard, F., and Pettersson, 1., Possible condensation andpolymerization reactions of Iignin fragments during alkaline pulping processes.,Appl. Polym. Symp., 28, 1195-1211, 1976.
31. Johansson, B., and Miksche, G. E., Über das verhalten des ligoin bei deralkalikochung. IV., Acta Chem. Scand., 23, 824-930, 1969.
32. Chiang, V. L., and Funaoka, M., The fonnation and quantity ofdiphenylmethane type structures in residuallignin during kraft delignification ofDouglas-Fir., Holzforchung, 42, 385-391, 1988.
33. Chiang, V. L., and Funaoka, M., The dissolution and condensation reactions ofguaiacyl and syringyl units in residual Iignin during kraft delignification ofsweetgum., Holzforchung, 44, 147-155, 1990.
34. Chiang, V. L. and Funaoka, M., The difference between guaiacyl and guaiacylsyringyl uoits in their responses to kraft delignification., Holzforchung, 44, 309313, 1990.
35. Chan, F. D., Nguyen, K. L., and Wallis, A. F. A., Estimation of the aromaticuoits in lignin by nucleus exchange- Areassessment of the method. t J. WoodChem. Technol., 15, 473-491, 1995.
. 36. Archipov, Y., Argyropoulos, D. S., Bolker, H. 1., and Heitner, C., 31p NMRspectroscopy in wood chemistry. Part 1. Model compounds, J. Wood Chem.Technol., Il, 137-157, 1991.
37. Archipov, Y., Argyropoulos, D. S., Bolker, H. 1., and Heitner, C., 31p NMRspectroscopy in wood chemistry. Part II. Phosphite derivatives ofcarbohydrates.,Carbohyd. Research, 220, 49-61, 1991.
38. Argyropoulos, D. S., Archipov, Y., Bolker, H. 1., and Heitner, C., 31p NMRspectroscopy in wood chemistry. Part IV. Lignin models: Spin-lattice relaxationtimes and solvent effects in 31p NMR., Holzforschung 47, 50-56, 1992.
• 124
•39. Argyropoulos, D. S., Bolker, H. 1., Heitner, C., and Archipov, Y., 31p NMR
spectroscopy in wood chemistry. Part V. Qualitative analysis of lignin functionalgroups., J. Wood Chem. Technol., 13, 187-212, 1993.
40. Granata, A., Argyropoulos, D. S., 2-chloro-4,4,5,5-tetramethyl-l,3,2dioxaphospholane a reagent for the accurate determination of the uncondensed andcondensed phenolic moieties in Iignin., J. Agric. Food Chem., 43, 15381544, 1995.
41. Argyropoulos, D. S., SUD, Y., Mazur, M., Milox pulping: Lignincharacterization by 31p NMR spectroscopy aild oxidative degradation., Nord. PulpPap. Res., 10, 68-73, 1995.
42. Sun, Y., and Argyropoulos, D. S., Fundamentals of high pressure oxygen andlow pressure oxygen-peroxide (Eop) delignification of softwood and hardwoodkraft pulps; A comparison., J. Pulp PaPer ScL, 21, 185-190, 1995.
43. Froass, P. M., Ragauskas, A. J., and Jiang, J., Chemical structure of residuallignin from kraft pulp., J. Wood Chem. Technol., 16, 347-365, 1996.
44. Smit, R., Suckling, 1. D., and Ede, R. M., A new method for the quantificationof condensed and uncondensed softwood lignin structures., The 9lh Int. Symp.Wood and Pulp. Chem., Montréal, Canada, Oral presentations volume, IA-l tolA-6, 1997.
45. Jiang, Z. H., Argyropoulos, D. S., The application of the Mannich reactiontoward the quantitative analysis of lignins., The 8lh Int. Symp. Wood and Pulp.Chem., Helsinki, Finland, Vol. l, 511-518, 1995.
46. Jiang, Z. H., Argyropoulos, D. S., Isolation and characterlzation of residualIignins in kraft pulps., The 9lh Int. Symp. Wood and Pulp. Chem., Montréal,Canada, Oral presentations volume, J2-1 to J2-6, 1997.
47. Ahvazi, B. C., Argropoulos, D. S., , Thermodynamic parameters governing thestereoselective degradation of arylglycerol-~-aryl ether bonds in milled woodlignin under kraft pulping conditions., Nord. Pulp Pap. Res. J., 12, 282-288,1997.
48. Bjôrkman, A., Studies on fmely divided wood. Part 1. Extraction of Iigninneutral solvents. Svensk. Papperstidn., 59, 477-485, 1956.
49. Argyropoulos, D. S., Quantitative phosphorus-31 NMR analysis of lignin; A newtoo1 for the lignin chemist., J. Wood Chem. Technol., 14, 45-63, 1994.
• 125

•50. Jiang, Z. H., Argyropoulos, D. S., and Granata, A., Correlation of 31p NMR
Chemical shifts with substituent effects of phenols, Mag. Res. Chem., 33, 375382, 1995.
51. Adler, E., Lignin chemistry-past, present and future., J. Wood Sei. Technol., Il.169-218, 1977.
52. Hagglund, E., Sulphidity in the sulphate process., Tappi, 32, 241-245, 1949.
53. Enkvist, T., and Hagglund, E., Studien über den zusammenhang zwischensulfidierung, Methylierung und sulfitierung von Iignin., Svensk. Papperstidn., 53,85-93, 1950.
54. Gierer, J., Chemical aspects of kraft pulping., J. Wood Sei. Technol., 14, 267279, 1980.
55. Parthasarathy, V. R., Grygotis, R. C., Wahoske, K. W., and Bryer, D. M., Asulfur-free, chlorine-Cree alternative to kraft pulping., Tappi, 79, 189-198, 1996.
56. Karhunen, P., Rummakko, P., SipiUi, J., Brunow, G., and Kilpelainen, 1.,Dibenzodioxocins; A novel type of linkages in softwood lignins., TetrahedronLett., 36, 169-170, 1995.
57. Karhunen, P., Rummakko, P., Sipîla, J., Brunow, G., and KilpeUiinen, 1., Theformation of DibeDZodioxocin structures by oxidativè coupling. A model reactionfor lignin biosynthesis., Tetrahedron Lett., 36, 4501-4504, 1995.
58. Karhunen, P., Mikkola, J., Brunow, G., The behaviour of dibenzodioxocinstructures in lignin during alkaline pulping processes., The 9th Int. Symp. Woodand Pulp. Chem. Montréal, Canada, Oral presentations volume, RI-3 to RI-3,1997.
• 126

•
•
Cbapter 5
l'F Nuclear Magnetic Resonance (NMR) Spectroscopy for theElucidation of Carbonyl Groups in Lignin Model Compounds
5.0. ABSTRACT
A new method for the detection of different classes of carbonyl groups in a series
of carbonyl-containing Iignin-like model compounds has been developed. The method is
based on the selective tluoride-induced trifluoromethylation of carbonyl groups with
trifluoromethyltrimethylsilane (TMS-CF]) in the presence of tetramethylammonium
fluoride (TMAF), followed by hydrolysis with aqueous HF or TMAF in the case of
quinones. In this study a series of ketones, aldehydes, quinones, and dimeric-Iignin
model compounds, were quantitatively trifluoromethylated followed by 19p NMR spectral
analyses of the resulting tluorine-containing derivatives, allowing for a thorougb
understanding of their strocture/ l 9p cbemical sbift relationships. These studies have
shown that the 19p-NMR chemical sbifts of the trifluoromethyl groups vary significantly
and consistently for various classes of carbonyl groups which May he present in complex
lignocellulosic materials. These studies are to fonn the basis for the development of a
novel and sensitive method that can he used to obtain quantitative infonnation on the
various carbcnyl groups present in such materials .
127

•
•
5.1. INTRODUCTION
The carbonyl groups present in wood and pulps play an important role in
determining the reactivity of lignin stnlctures toward the yellowing of paper and the
bleaching of pulp1-4. The low contents of these groups in wood, in pulp and in paPer have
made the elucidation of their role rather elusive. Detecting and determining these groups
will pave the way toward arriving at new conclusions in relation to a variety of pressing
issues as far as the yellowing of paper and the bleaching of chemical and mecbanical
pulps are concemed. Therefore, the necessity ta obtain essential infonnation toward
understanding the reactivity of lignin structures during yellowing and inhibition, initiated
efforts at developing a novel method for the fme structural elucidation and quantification
of the various carbonyl groups present in lignine
The presence of carbonyl groups in Iignin was fust postulated by Klasons as early
as 1922. However, Adler et al.~8 and Pew9 were the fmt to obtain reliable direct
evidence for the presence ofconjugated carbonyl groups, in particular coniferyl aldehyde
type structures in spruce lignine In 1979, further investigations by Geiger and Fuggerer10
resulted in the detection of cinnamaldehyde-type structures of conjugated carbonyls in
milled wood lignine Additional experimentation suggested the presence of other types of
conjugated and possibly non-conjugated carbonyls (a-carbonyl) structures [Figure 5.1(a,
b)] in Iignin. These structures, including trace amounts of quinone ketals11. 12 [Figure
S.I(d)] have been recognized to he a portion of the total carbonyl content present in
milled wood lignins. However, different Iignin isolations May contain a variety of other
possible carbonyl containing structures. For instance, tecbnicallignins and in particular,
alkali lignins, contain appreciable amounts of a-carbony1 groups in addition to
benzaldehydes- and o-quinones. Nevenheless, investigations in this area have continued
to grow aimed al the identification of these groups and elucidating their role in lignin
reactivity. Recent studies by Panchapakesan13 provided evidence and new information on
such deactivating groups in lignine
These studies have shown that the presence of carbonyl groups in lignins, in
particular those present as 0- and p-quinonoids, quinonemethides, and other extended
conjugate enone systems, are not only contributors to the color observed in lignified plant
128

•tissues14. 15, but also sensitizers in the photo-yellowing of lignocellulosicsl6• 1,. Oxidation
of lignins with reagents such as molecular oxygeo, hydrogen peroxide, and chlorine may
further increase tlteir carbonyl contentl8• The 0- and p-quinone stnlctures so generated
in residual lignins of pulps MaY funber alter the color of the pulps and promote their
capacity to he photosensitized13. 19.
6oc~-cr1
<a) (b) (e) (d)
Figure S.l. Stnlctures of lignin moieties with carbonyl groups.
Two methods have been proposed for the determination of the carbonyl content
in lignin preparations. These methods are based on the oximation20•21 and reduction22 of
the carbonyl groups in Iignins.
The fust method involves the reaction of carbonyl groups with hydroxylamine
hydrochloride at room temperature. This is a relatively simple procedure, since
hydroxylamine hydrochloride reacts with aImost ail types of carbonyl groups, including
those ofdiketones20 and 0- and p-quinones. In general, the carbonyl group ofan aldehyde
or ketone condenses with hydroxylamine hydrochloride, forming an oxime with the
liheration of hydrochloric acid:
, ,C=O+ NH20H'HCI ~ C=NOH+H20 + HC1
/ /[5.1]
•Using this procedure, the total carbonyl content of a lignin preparation can he
conveniently determined by tib'ation of the Iiberated hydrochloric acid, since one
129

•carbonyl group quantitatively liberates one mol of hydrochloric acid.
Altematively, the total carbonyl content of a lignin preparation can he detennined
by reduction with either sodium or potassium borohydride.
(S.2)
[S.3)
•
Carbonyl groups in a lignin preparation are reduced with an excess of sodium
borohydride in an alkaline solution [Equation 5.2]. After the reaction, the excess sodium
borohydride is decomposed by the addition of a solution of dilute sulfuric acid [Equation
5.3]. The volume ofmolecular hydrogen liberated is then measured volumetrically. The
same experiment is repeated in the absence of the Iignin sample (blank test). Since each
mole of hydrogen consumed corresponds to a mole of carbonyl group, the total carbonyl
content in Iignin is detennined from the difference in the volumes of hydrogen Iiberated
in the presence and absence of lignin.
According to these methods, the total amount of carbonyl groups in Bjorkman
lignin has been found to vary between 0.22~0.24 mol CO/OCH3 via oximation and O.41~
0.44 mol CO/OCH3 via reduction, respectively. The discrepancies between these methods
have been rationalized by Gierer and SOderberg23. They suggested that the reaction of the
carbonyl groups in Iignin and hydroxylamine hydrochloride is incomplete, while their
reduction by borohydride goes to completion. For example, certain Ct~aryl-ketones were
found to react very slowly24 with hydroxylamine hydrochloride but rapidly with
borohydride. Theyalso imply that a certain fraction of the carbony. groups in Iignin is
present in a "masked" fonn, e.g., as hemiacetals, which are unreactive towards
hydroxylamine but reducible by borohydride.
Despite the knowledge aimed at understanding and elucidating the role of the
carbonyl groups in lignins, there are still no fundamental techniques available for
classifying these groups. The objective of this study is to identify and detennine aU
distinct classes of carbonyl groups in lignin by implementing an innovative method.
130

•The strategy followed toward the development of 80ch a method was as follows:
various carbonyl groups present in lignins and severa! model compounds were to he
quantitatively derivatized with a reagent which readily reacts with carbonyls and which
contains an NMR sensitive heteroatom. Next, the stnlcture/chemical shift relations must
he evaluated in order to allow for the precise qualification of the different classes of
carbonyls in complex mixtures. Therefore, according to these criteria, Ruppen's reageot
[trifluoromethyltrimethylsilane (TMS-CF3)] was chosen for the selective and quantitative
fluoride-induced trifluoromethylation ofcarbonyl groups. This was followed by 19p NMR
spectroscopy aimed at probing the resulting fluorine-containing derivatives.
The 19p nucleus bas severai advantages over other NMR-active nuclei:
i) 19p and 1H are the easiest isotoPeS to study since both have 100% naturalabundance causing them to bave greater receptivity than any other nucleL
ii) The 19p nucleus is of a low spin lattice relaxation time, and it's sensitivityis greater tban 13C and 29Si.
iii) 19F and 1H have spins of one half which means zero quadrupolarmoments, resulting in sharp, narrow line widths, and weil resolved NMRsignais.
These factors malee 19p NMR a superior tool over other NMR nuclei. Accordingly, 19F
NMR was selected as the Most appropriate instnunent for the analysis of carbonyl groups
in Iignins.
The introduction of trifluoromethyl groups ioto organic molecules and
Macromolecules bas been the 80bject of significant interest by both synthetic and
Medicinal chemists25• These compounds bave been examined for their potential as
biologically active drugs and agrochemicals26• Trifluoromethyl-substituted compounds
often exhibit significant effects in their physical and chemical properties. This is mainly
due to the following considerations:
•i) Fluorine and hydrogen atoms are comparable in size. Tbeir van der
Waal's radii are 1.35 and 1.20 Arespectively, making a molecule and itsfluoro analogues almost indistinguishable to a guest molecule.
131

•ü)
üi)
The C-F bond energy is about 485 Id/mol. Such high bond energies leadsto increased thermal stability of fluoro analogues.
Fluorine-containing molecules often show different chemical properties.These differences are attributed to the high electronegativity of fluorine.
•
. .Table 5.1. Properties ofsorne common elements.
Element Covalent b van der Waals C-X bond ElectronegativityC.radius (A) radius (A) energy (kcal/mol)
1.33 2.5 57.4 2.5
Br 1.14 1.95 65.9 2.8
CI 0.99 1.8 78.5 3.1
F 0.64 1.35 105.5 4.0
H 0.30 1.20 98.9 <0.5
C 0.77 2.0d 83.1 2.&
• VaJues from Pauling (1967), and Holland cl 81. (1964)
b Single bond covaJent radii for iodine, bromine, chlorine, fluorine, bydrogcn, and carbon, .&ken from Pauling (1967)
C ElecttoDegativities based on lbe Pauling sc:aJe (Pauling 1967)
d van der Waals radius of Cf-b is given
In 1989 Prakash and co-workers27 reponed the efficient and selective fluoride
induced trifluoromethylation of carbonyl compounds with trifluoromethyltrimethylsilane
(TMS-CF3)28. The work of this group bas been focused at developing new synthetic
methods for introducing pertluoroalkyl groups ioto different classes of carbonyl
compounds by using efficient nucleophilic trifluoromethylating agents. Various carbonyl
containing compounds when reacted with (TMS-CF3) in the presence of a catalytic
amount of tetra-n-butylammonium fluoride (TBAF) have been shown to undergo 50ch
reaction. This reaction works equally weil for different classes of carbonyl groups, such
as aldehydes, ketones, enones, carboxylic acid, and even ketoesters29 without heing
affected by moisture.
132

Table 5.2. NMR properties ofsome common magnetic nuclei.
Nucleus Spin y Natural • Sensitivity Chemical ReferenceAbundance
Relative b Absolute Cshift range Substance
(ppm)d
1H 1/2 26725 99.98 1 1 10 (CH,t.Si
2H 1 4117 1.5x10·2 9.6 X 10.3 2 X 10" 10 (C~t.SI
13C 1/2 6728 1.1 ·2 2 x 10~ (CH,).SI1.5 X 10 340
15N -1/2 -2711 0.4 ·3 3x10" 620 NH:a(I)1.0 x 10
170 -5/2 -3627·2 ·2 3x10" HzO3.7 x 10 2.9 x 10 850
19F 1/2 25187 100 0.83 0.83 700 CCI:aF
31p 1/2 10829 100 ·2 7 x 10.2 960 H:aPO•6.6 x 10(8S-Ié)
1 Values &om Gerig (1978)
b Relative sensitivity bascd on constant number ofcach nuclide
c Absolutc scnsîtivîty bascd on natural abundanœ ofeach nuclîdc
d Values hm Gcrig (1978); and JardcczJcy & Robats (1981)
In this work a series of organic compounds containing different classes of
carbonyl groups were subjected to the proPOsed chemical reaction and their carbonyl
groups were convened to their trifluoro analogues according to the following schematic
reaction mechanism.
Finally, the resulting tluorine-containing derivatives were examined by 19p NMR
spectroscopy. As a result, numerous signals, due to the different classes ·of carbonyl
groups, were detected and studied.
133

• ( IndUCtion)
(prOpagation)
TBAFTHF
•Figure 5.2. The mechanistic reaction pathway for tritluoromethylation of carbonyl
groupS17.
134
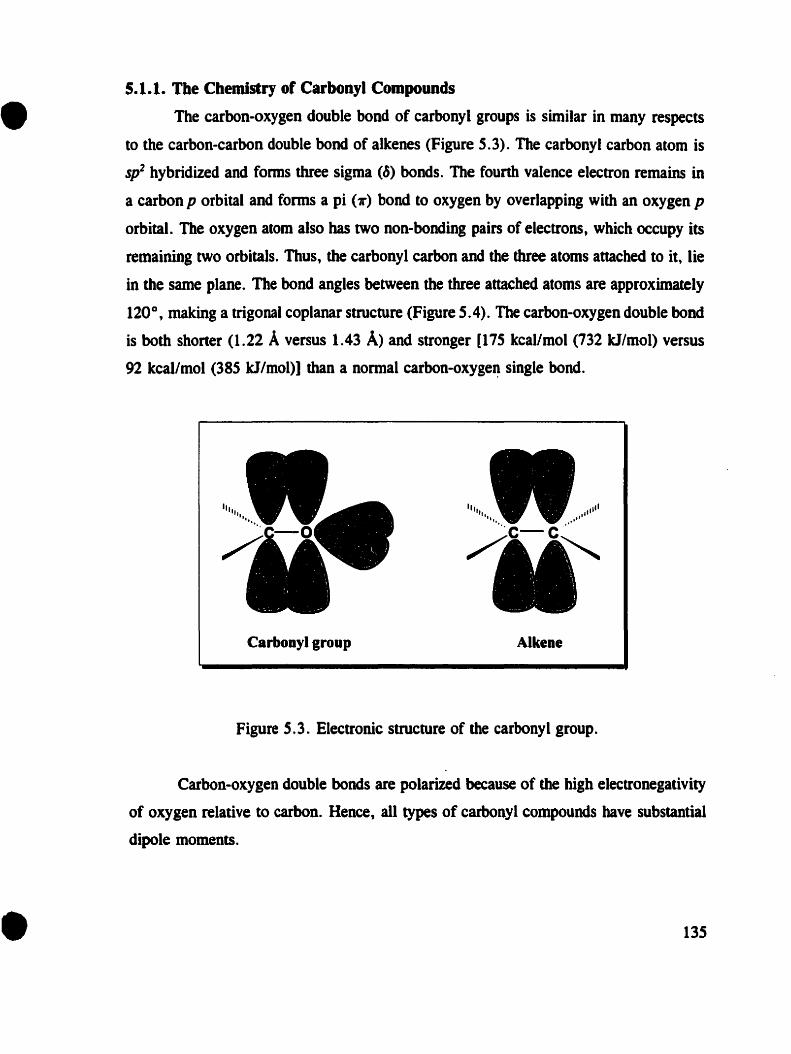
•S.l.l. Tbe Chemistry of Carbonyl Compounds
The carbon-oxygen double bond of carbonyl groups is similar in many resPects
to the carbon-carbon double bond of alkenes (Figure 5.3). The carbonyl carbon atom is
Sp2 hybridized and fonns three sigma (8) bonds. The founh valence electron remains in
a carbon p orbital and forms a pi (11') bond to oxygen by overlapping with an oxygen p
orbital. The oxygen atom also bas two non-bonding pairs of electrons, which occupy its
remaining two orbitais. Thus, the carhonyl carbon and the three atoms attached to il, lie
in the same plane. The bond angles between the three attached atoms are approximately
1200, making a trigonal coplanar structure (Figure 5.4). The carbon-oxygen double bond
is both shorter (1.22 Aversus 1.43 À) and stronger [175 kcallmol (732 Id/mol) versus
92 kcal/mol (385 kl/mol)] than a normal carbon-oxyge~ single bond.
Carbonyl group Alkene
•
Figure 5.3. Electronic structure of the carbonyl group.
Carbon-oxygen double bonds are polarized because of the high electronegativity
of oxygen relative to carbon. Rence, ail types of carbonyl compounds bave substantial
dipole moments.
135

• ,---1~~Z ••
r"'0""""" c~j
-1~Le/l~
Figure 5.4. Geometrie structure of the carbonyl group.
The most important consequence of carbonyl-group polarization is the chemical
reactivity of the carbon-oxygen double bond. Since the carbonyl carbon canies a partial
positive charge, it is an electrophilie site and is attacked by nucleophiles. Conversely, the
carbonyl oxygen carries a partial negative charge and is a nucleophilic site.
!J+t\'. a CJ..Electrophilic carbon reacts . C :.:.:.: Q Nucleophilic oxygen reactswllh bases and nucleophiles / with aciels and electropblJes
Hybrid
This charge distribution arises from two effects: the inductive effect of the
electronegative oxygen and the resonance contribution of the second structure shown
below.
" ..C=O:/
.. " ..+C-O:-/ .. or
Hybrid
•Resonance of bybrid structures for the carbonyl group
136

•
•
One highly cbaracteristic reaction of a1dehydes and ketones is the nucleop~ic
addition to the carbon-oxygen double bond. Aldehydes and ketones are especially
susceptible to nucleophilic addition because of the stnlctural features mentioned above.
The trigonal coplanar arrangement of groups around the carbonyl carbon implies that the
carbonyl carbon is relatively open to anack from above or below. The positive charge
on the carbony1 carbon suggests that it is especia11y susceptible to attack by a
nucleophile. The negative charge on the carbonyl oxygen indicates that nucleophilic
addition is susceptible to acid catalysis. The nucleophilic addition to the carbon-oxygen
double bond can he visua1ized as taking place in two general path ways; as illusttated in
Figure 5.5.
S.l.l.l. For particularly strong nucleopbiles
The nucleophile uses its electron pairs to form a bond to the carbonyl carbon. As
this happens, an electron pair from the carbon-oxygen 11'" bond shifts out to the carbonyl
oxygen and the hybridization state of the carbon changes from s'; to spJ. The important
feature of this step is the ability of the carbonyl oxygen to accommodate the electron pair
of the carbon-oxygen double bond. In the second step, the oxygen associates with an
electrophile (usually a proton). This happens because the oxygen is now much more
basic; it carries a full negative charge, and it resembles the oxygen of an alkoxide ion.
(In sorne reactions the oxygen of the carbonyl group actually becomes the oxygen of an
alkoxide ion.)
5.1.1.2. An acid-catalyzed mechanism
This mechanism 0Perates when carbonyl compounds are treated with reagents that
are strong acids but weak nucleophiles. In the flIst step the acid attacks an electron pair
of the carbonyl oxygen: the resulting protonated carbonyl compound is highly reactive
toward nucleophilic anack at the carbonyl carbon (in a second step) because of the
contribution made by the second resonance structure below:
137

• R, +C=O-HRV .. ... R,+ ..
C-O-HRV ..
The general nucleophilic addition to the carbon-oxygen double bond can he illustrated as
follows:
..:0:-
1,.c,R"',
R' Nu
OH1.. c,
R"',R' Nu
(a)
cJ:-" C,/'"J
R"', ,+'R' NUHz
!
(b)
•
Figure 5.5. The addition of a nucleophile to a ketone or aldehyde.
Typically, trifluoromethylation of carbonyl groups follows the (a) reaction pathway with
the trifluoromethyl group acting as a nucleophile, bearing substantial negative charge.
The intermediate trifluoromethylated siloxy compound is then hydrolyzed to the
corresponding alcohol with aqueous hydrochloric acid (lM HCl).
138

•
•
5.1.2. F1uorine-l' NMR Spedroscopy
In recent years, tbere bas been much progress in lignin structure determination
using NMR spectroscopy.
lH wouId seem to he the nucleus of choice because of i15 high sensitivity to
detectionand its natura! presence in lignin. However, lH-NMR studies oflignins involves
acetylation or other derivatization procedures wbicb cause unwanted chemical
modification of the lignin samples.
~other difficulty with using IH-NMR is the relatively narrow spectral dispersion
of cbemical shifts, typically 10-12 ppm in the absence of paramagnetic species. The
slower tumbling associated with larger macromolecules causes broad NMR linewidths
and a loss of both signal intensity and spectral resolutioD.
13C_NMR is a sensitive method for the qualitative structural analysis of lignin. It
provides detailed stnictural infonnation on nearly ail types of carbons including those in
minor structures. However, the capacity for producing reliable quantitative analysis of
carbonyl groups in lignin is limited by its inability to differentiate the presence of
different classes of carbonyls.
Studies of carbonyl groups in lignin by IH and 13C-NMR have been limited due
to those problems30•
As an alternative to lU and 13C, other NMR detectable nuclei may he used to
obtain stroctural details for large macromolecular complexes. For example, 31p NMR
spectroscopy has been used successfully for the quantitative detennination of different
classes of hydroxyl groups in lignins3IoJ4.
An NMR observable nucleus should ideally allow: a higb sensitivity of detection
tbat is comparable to IR, a large chemical shift range Iike that of 31p or 170, and the
ability to incorporate the label into biomolecules for NMR observations. Table 1.2 shows
that the fluorine-19 nucleus offers high sensitivity and a large cbemical shift dispersion.
115 sensitivity is only 17% lower than proton and, fluorine, in ail i15 chemical fonns gives
rise ta a spectral dispersion of more than 700 ppm3S • While 13C, lSN, 170, and 31p also
provide wide chemical shift ranges, their lower natural abundance or gyromagnetic ratios
cause their sensitivity of detection to he inferior to 19F. The detection of these other
139
•nuclei can he improved by (expensive) isotopie enrichmenf, increased sample
concentrationst or indirect detection.
There are several limitations associated with the use of 19p-NMR for obtaining
structural information. First, one must prove tbat the fluorine substitution does not alter
"the structure and fonction of the system in which it is incorporated. Second, 19p-NMR
does not provide complete structural infonnation in the way that IH-NMR and x-ray
crystallograpby cano Rathert only limited information can he obtained concerning fluorine
environment within a macromolecule. Finally, there is no quantitative method for
interpreting fluorine chemical shifts unambiguously in terms of structural details.
Although this problem is to a large extent associated with ail NMR observable nuclei,
much progress bas been made in identifying shielding contributions that affect fluorine
chemical shifts.
5.1.2.1. Fluorine Sbielding Constant
Since nuclear shielding constants are not measurable directly, it is necessary to
measure shieIding36-39, D'c, relative to sorne reference resonance, aR; the differences are
known as chemical shifts, 8:
[5.4]
•
6 is negative if the reference compound is less shielded than the sample. Both internai
and external referencing are used with different reference compounds. Trifluoroacetic
acid (TFA) bas been used extensively, panicularly as external reference. However, TFA
is not satisfactory for correlating cbemical shift measurements due to the bulk
susceptibility corrections that must he applied. Because of the magnitude of 19p shifts,
these corrections are not very important. Several other reference standards are often
used40 (Table 5.3).
The most common reference compound is CFCh. Evaluating (1 requires sorne
detailed knowledge of the excited-state wave fonctions of the molecule, wbich is rarely
available. Following an oversimplified picture il is possible and useful to write (1 as a
140

•SUDl of local effects and long-range or molecular effects (Equation 5.5).
o = 0 'local) + 0 (local) + 0 + 0 + 0 + 0 [5.5)d' p 111' e s
Where; am= neiabbour anisotropy errectO'r= rina eurrent efrectae= electric field efl'ect0'.= solvent erreet
•
This scheme is arbitrary but useful. (Jd (local) and ap (local) are the diamagnetic
apd paramagnetie local terms of Ramsey's equation for nuclear shielding due to electrons
closely associated with the nucleus. The chemical shift of the fluorine nucleus is
dominated by up (local). For instance the 19f resonance of F2 occurs about 625 ppm to
low field of that for HF. The difference in ad can he estimated to he about 20 ppm. up
is zero for spherically symmetric species such as an atom or an ion, like P-, whereas it
is appreciable for an asymmetric distribution of p electrons 50ch as covalently bonded
fluorine. The discrepancy between experimental and calculated values is due to the partial
ionic charaeter of the bond in F2 which reduces up considerably from its calculated value.
(Jm is related to the anisotropy in the diamagnetic susceptibilities, âx, of a cenain group
of electrons. The magnitude of this contribution depends only on the magnitude of 4x
and the geometry of the molecule.
This means that (Jm should he equal for the 19p and lH resonances, and typically
of the order of 1 ppm. The magnitude of ar and its effect on nuclear shielding should
again he independent of the nucleus and hence the magnitude of this term should he
typically about 1ppm. The Ue term is related to the intramolecular electric fields arising
from charges remote from the shielded nucleus. The Ue term for the fluorine resonance
is more important than Um and ar, and can he considered to he made up of three
contributions. When the fluorine is in an axially symmetric environment the flrSt
contribution to (Je May simply he related to drift of electrons along the bond direction,
and the second contribution to the distortion of the electronic charge distribution in a
direction perpendicular to the bond direction. The third contribution is due to time
dependent electric dipoles mutually induced hetween bonds in the Molecule and the bond
141
•to the shielded nucleus. Such dipoles give a nonzero average value ofE:!, written <E2 > .
[5.6]
[5.7]
•
This is the so called van der Waals contribution, uw' for which Pi and Ii are the
polarizability and fll'St ionization potential of the electron group (bond). Experimental
estimates of the constants A, B, and B' have shown that they are quite large for fluorine
and that Ais negative. Typical values are A=about -10xl0-12 e.u.s., B=BI 20+40xlO-18
e.u.s. Us contains contributions of the same type as am' ar, and ae, but they are of
intermolecular origin.
5.1.2.2. Fluorine Coupling Constants
19p chemical shifts are extended over a much wider ppm range than that found
with the IH. The intrinsic sensitivity of a given nucleus to its environment is determined
by the density, distribution, and symmetry of the orbital electrons surrounding ·the
nucleus. In hydrogen, only the s-electron exerts an orbital magnetic field at the nucleus.
However, in covalently bound fluorine, with a valency shell containing unequal
populations in its three 2 p-orbitais, the fluorine chemical shift tensor is quite large and
orientation sensitive41 •42• As a result, the 19p_NMR observed peak positions are highly
dependent on the micro-envïronment of the fluorine nucleus.
Spin coupling between nuclei is mediated by shared electrons involved in chemical
bonding. Table 5.4 shows the magnitudes of coupling constants for F-F and F-H spin
spin interactions. The geminal coupling constants for H-F (40-80 Hz) or F-F (150-300
Hz) are larger than those for H-H (12-15 Hz).
S.I.2.3. Relaxation and 1'F-NMR Linewidtbs
The mechanism of relaxation derives from the action of local tluctuating fields on
142

nuclear magnetic moment. There are three relaxation pathways associated with a 19p
nucleus placed inside a molecule. The first is diPOlar coupling between 19p and its
neighboring spins (i.e lH). A second pathway is that of chemical shift anistropy (CSA)
where both the overall and the internaI motions of a tluoro-substituted macromolecule
contribute to the averaging of the orientation-dependent chemical shift. A third
mechanism arises from spin-rotation. where a tluctuating field is produced by the
rotational motion of a molecule's electron cloud. Spin rotation contributes to relaxation
only for small symmetric molecules, and has minimal contribution in larger
macromolecules"3-4s.
While the large anisotropy of the 19p chemical shift has the advantage of providing
a wide spectral distribution for 19J=-NMR peaks, it has one important drawback. At higher
fields, the observed line broadening (liT TJ increases with the squared frequency of
resonance. As a result, the increase in resolution that one expects in going to higher
fields (which scales linearly with w) is offset by CSA relaxation46• Narrower 19p-NMR
linewidths have been observed at lower fields from alkaline phosphatase and
dihydrofolate reductase.
Table 5.3. Sorne f-19 NMR reference standards 39,
Compound <J{ppm)•
CFCI;s 0.00
CF;sCOOH (Int.) -76.55
CFsCOOH (ext.) -78.90
CFsCCI;s -82.20
CFClz·CfClz -67.80
CFzCI.CCI;s -65.10
C4F. -135.15
'1F12 -133.23
'1F, -164.90. '
Shifts upfield hm CFel) arc negative.
143
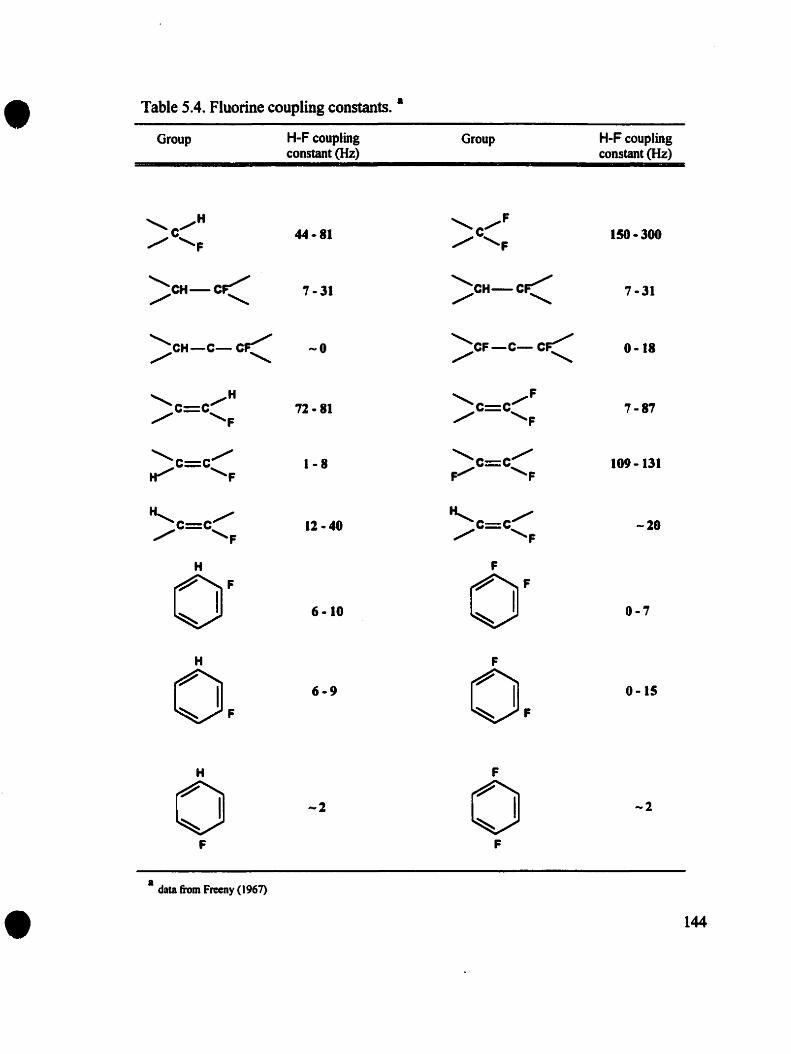
Table 5.4. Fluorine coupling constants. •• Group H-F couplingconstant (Hz)
Group H-F couplingconstant (Hz)
........... ,....,H ........... ,.....F
/C'F 44·81 /C'F 150·300
)CH-C< 7 -31 )CH-C< 7 ·31
'CH-C-C~ -0 'CF-C-C~ 0-18/ , / ,'C=C,.....H 72 - 81 'C=C,.....F 7-87/ 'F / 'F
........... C=C.......... 1-8 'C=C.......... 109-131H"" 'F F......... 'F
~c=c""""" 12 -40 ~c=c""""" -20.......... 'F / 'F
H FOF OF~I 6-10 ~I 0-7
H F
OF 6-9 OF 0-15
•
H
oF
•data ftom Frccny (1967)
-2
F
oF
-2
144

•Table 5.5. Contributions ofdipolar interactions and chemical shift anisotropy to fluorine
relaxation.
Dominates C
Linewidth
H
J(O)) disotropie
Dipolar Interaction •
molecular weilht <10 Kdand maanelic nelds <300 MHz
Y Y h21 <_1__ 3r12or12 )l1 2 1 3 r 2
r 12 12
Chemical Shift Anisotropy b
molccular weilht >10 Kdand malnelic nelds >300 MHz
...!-fA)2~2<1 + 112)[4.1(0)
40 1:c 3
+3J((,,) 1)]
•
a Two non-identical spin interaction belwcen spins 1and 2 with respective gyromagnetic rati~1in hamiltonians (H) n:fer to the spin z component angular momcntum operator and omerwisc rcfcrsto the spin angular momcntum. The vector distance separation is givcn by r. and lm: in the spectraldcnsity functions Jt») is the rotational correlation lime constant.
b The 5 and Tl arc the anisolropy and asymmetry orthe nuorinc chemical shin tensor
C From Hull '" Sykcs (1947); Hardin " Horowitz ( (987); and Gcrig (1989)
d The spectral density funetions for other motions an: dcscribed by Hardin " Horowitz «(987)
145

•
•
5.2. EXPERIMENTAL
5.2.1. Materials and Methods
5.2.1.1. Reactions
Acetyllltion 0/Ugnin Model Compounds
Carbonyl containing compound (- 200 mg) was acetylated with 2-4 mL of acetie
anhydride/pyridine (1:1, v/v) at room temperature ovemight in a lOO-mL flask. Ethanol
(50 mL) was added, and, after 30 min, the solvents were removed by fllm evaporation.
Repeated addition and removal (film evaporation) of ethanol (five to ten times) resulted
in the removal of acetic aeid and pyridine from the sample. The acetate was dried in
vaeuo over KOH and P20S or purified as deseribed below prior to drying.
Trlfluoromethylation Procedure
Carbonyl containing model compound (10 mmol) was dissolved in 3 mL of high
purity tetrahydrofuran (THF). To this solution an excess (15 mmol) of
trifluoromethyltrimethylsilane (TMS-CF3) was added. The mixture was then treated with
a eatalytic amount (20 mg) of tetramethylammonium fluoride (TMAF) under constant
stirring at O°C for 0.5 hours. It was then brought to room temperature and eontinued to
completion (TLC). The intennediate siloxy adducts were hydrolysed by the addition of
aqueous hydrofluoric aeid (10% HF). Finally, the hydrolysed mixture was extracted with
chlorofonn (3x15 mL) and dried over anhydrous magnesium sulphate. The hydrolysis of
aIl the quinones were aecomplished by replacing HF with TMAF. The isolated products
were characterized by 19F, lB NMR and Ge-MS.
5.2.1.2. Instrumentation
l'F NMR Spectroscopy
Ali spectra were reeorded on a Varian Unity 500 FT-NMR spectrometer at an
operational frequency of 470.3 MHz. The model compound derivatives were dissolved
in deuterated chloroform (10-20 mg/l.O mL CDC~) using fluorotrichloromethane
(CFCI3) as internaI reference. The measurements were canied out in a 5 mm tube at
146

•
•
room temperature. The acquisition time of 0.64 sec was used followed by the relaxation
delay of 2 sec. The number of scans acquired was 8 per measurement. Pulse widths
corresponding to a 45 0 flip angle and a line broadening of 1 Hz was used during
acquisition and processing of the spectra.
1H NMR Spectroscopy
The NMR spectra were recorded at a proton operating frequency of 200.1, 299.9
and 499.8 MHz on Varian XL-200 FT-NMR, Varlan XL-300 FT-NMR and Varlan unity
500 spectrometer respectively. The model compounds containing carbonyl groups and
their derivatives were dissolved in deuterated cbloroform (30 mg/t.O mL eDC~) using
tetramethylsilane (TMS) as internai reference. The measurements were carried out in a
5 mm tube al room temperature. No relaxation delay was used. The acquisition time for
Varlan XL-200 FT-NMR, Varian XL-300 FT-NMR and Varian unity 500 spectrometer
were 3.752, 2.496, and 1.892 sec respectively. The number of scans for the acquisition
of the IH NMR signais were 128.
IJC NMR Spectroscopy
The model compounds containing carbonyl groups and their derivatives were
dissolved in deuterated cblorofonn (30 mg/1.G mL eDC~) and quantitative 13e NMR
spectra were obtained on both Varian XL-300 FT-NMR and Varian Unity 500
spectrometer operating at 75.4 and 125.7 MHz respectively. The internaI reference was
tetramethylsilane (TMS). The measurements were carried out in a 5 mm tube at room
temperature with heteronuclear-decoupling. No relaxation delay was used. The
acquisition time on Varlan XL-300 Fr-NMR and Varian Unity 500 spectrometer were
0.970 and 1.083 sec respectively. The number of scans ranged between 65000 to 80000.
31P NMR Spectroscopy
The Jlp NMR spectra were obtained by using inverse gated decouling on a Varian
XL-300 FT-NMR spectrometer at 121.5 MHz. The internai deuterium lock was provided
by the deuterium atoms present in the deuterated chloroform. used as the solvent. The
147

•external standard was 85% H3P04 • Ail downfield shifts from H3P04 were considered
positive. A sweep width of 10000 Hz was observed and spectra were accumulated with
a lime delay of lOs between successive pulses. Pulse width corresponding to a 45° flip
angle and a line broadening of 2 Hz was used for the processing of the spectra. For the
4S° flip angle a series of experiment showed that there was no further increase in signal
intensity after a 7s pulse delay was applied. Ail chemical shifts reported are relative to
the dimeric model compound with water which bas been observed ta give a sharp 31p
signal al 121.1 ppm31-34•
Gas Chromatography/Mass Spectrometry
GC-MS analyses were carried out a Hewlett Packard 5972 mass spectrometer
interfaced to a Hewlett Packard 5890A gas chromatograph with a 30rn x 0.25mmpacked
silica capillary column. The injection port temperature was 280 oC and the oven
temperature was varied from 100 oC to 250 oC, with a gradient of 5 oC/min. The CF3
containing lignin model compounds were analyzed after silylation.
5.2.2.3. Charaeterization of triftuoromethylated compounds
•
1.
2.
3.
IH NMR (CDCI])(TMS) 6: 1.77 (s, 3H); 2.60 (s, IH); 7.37-7.46 (m, 3H); 7.56-7.61 (m,
2H) ppm. 19p NMR (CDCI])(CFCI3) ô: -81.35 (s) ppm. MS mlz 190 (M+), 151, 127,
121, 105, 91, 77, 51. Anal. Calcd for C,Hgf]O: C, 56.84; H, 4.77; F, 29.97. Found:
C, 56.92; H, 4.69; F, 29.92. 96% yield.
IH NMR (CDCI])(TMS) ô: 1.74 (s, 3H); 2.35 (s, IH); 5.67 (s, IH); 6.829 (d, 2H,
1=8.78 Hz); 7.432 (d, 28, 1=8.58 Hz) ppm. 19p NMR (CDCI])(CFCI3) ô: -81.76 (s)
ppm. MS mlz 206 (M+), 188, 167, 149, 137, 119, 107,91. Anal. Calcd for CgH~302:C, 52.43; H, 4.40; F, 27.65. Found: C, 52.48; H, 4:49; F, 27.67. 98% yield.
lH NMR (CDCI3)(TMS) ô: 1.74 (s, 3H); 2.90 (s, IH); 3.879 (d, 3H, 1=6.64 Hz); 5.84
(s, IH); 6.86-7.13 (m, 3H) ppm. 19p NMR (CDCI3)(CFCI3) 6: -81.60 (s) ppm. MS mlz236 (M+), 197, 167, 151, 124. 110, 69, 51. Anal. Calcd for CIOHlI F30 3: C, 50.85; H,
4.69; F, 24.13. Found: C, 50.91; H, 4.68; F, 24.19. 96% yield.
148

•4. IH NMR(CDCI3)(TMS) 6: 1.73 (s, 38); 2.54 (s, IH); 3.879 (d, 68, /=10.26 Hz); 6.78
(s, 28); 7.22 (s, IH) ppm. 19f NMR (CDCI3)(CFC13) 8: -81.47 (s) ppm. MS mil. 266
(M+),227, 197, 181, 155, 123,93,69. Anal. Calcd forCIIH13F304: C, 49.63; H, 4.92;F, 21.41. Found: C, 49.69; H, 4.85; F, 21.35. 95% yield.
5. IH NMR (CDC13)(TMS) 8: 1.73 (s, 3H); 2.72 (s, IH); 3.841 (d, 6H, 1=2.16 Hz); 6.825
(d, IH, 1=8.48 Hz); 7.03-7.11 (m, 2H) ppm. 19p NMR (CDCh)(CFCI3) 6: -81.56 (s)
ppm. MS mil. 250 (M+), 211, 181, 139, 124, 107, 95, 77. Anal. Calcd for CIIH13F303:
C, 52.80; H, 5.24; F, 22.78. Found: C, 52.85; H, 5.28; F, 22.80. 95% yield.
6. 18 NMR (CDCI3)(TMS) 8: 2.93 (s, IH); 7.34-7.38 (m, 6H); 7.47-7.52 (m, 4H) ppm.
19F NMR (CDCI3)(CFCI3) 8: -74.79 (s) ppm. MS mil. 252 (M+), 233, 213, 183, 165,
127. 105, 77. Anal. Calcd for ClIH13F303: C, 66.67; H, 4.40; F, 22.60. Found: C,66.71; H, 4.32; F, 22.66.94% yield.
7. 18 NMR(CDCI3)(TMS) 6: 3.22 (s, IH); 3.84 (s, 6H); 6.87-7.03 (m, 4H); 7.03-7.47 (m,
4H) ppm. 19F NMR (CDCI3)(CFCh) 8: -75.11 (s) ppm. MS mil. 312 (M+), 273,243,
212, 168, 135, 108, 77. Anal. Calcd for CIJlI,F30 3: C, 61.54; H, 4.84; F, 18.25.Found: C, 61.56; H, 4.88; F, 18.17. 96% yield.
8. IH NMR (CDCI3)(TMS) 6: 2.60 (s, IH); 4.989 (q, IH, 1=6.60 Hz); 7.38-7.48 (m, 5H)
ppm. 19F NMR (CDCI3)(CFC13) 8: -78.848 (d, JF•H=6.1 Hz) ppm. MS mil. 176 (M+),159, 127, 107, 89, 79, 51. Anal. Calcd for C.H,F30: C, 54.55; H, 4.01; F, 32.36.
Found: C, 54.58 H, 3.99; F, 32.40. 97% yield.
9. IH NMR (CDCI3)(TMS) 6: 2.59 (s, IH); 3.89 (s, 3H); 4.925 (q, IH, 1=6.78 Hz); 5.72
(s, IH); 6.947 (d, 3R, J= 13.93 Hz) ppm. 19F NMR (CDCIJ)(CFCI3) 6: -78.981 (d, JF•
H=6.1 Hz) ppm. MS mil. 222 (M+), 205, 183, 153, 125, 93, 65, 51. Anal. Calcd for
CgH9FJ03: C, 48.66; H, 4.08; F, 25.65. Found: C, 48.70; H, 4.11; F, 25.69. 95%yield.
10. IH NMR (CDCIJ)(TMS) 6: 2.18 (s, IH); 3.85 (s, 6H); 4.924 (q, IH, 1=6.58 Hz); 6.68
(s, 2H) ppm. 19p NMR (CDCI3)(CFCI3) 8: -78.890 (d, JF•H=6.1 Hz) ppm. MS mil. 252
(M+), 205, 183, 167, 155, 140, 123, 95. Anal. Calcd for CIOHII F30 4: C, 47.63; H,
4.40; F, 22.60. Found: C, 47.62; H, 4.42; F, 22.58. 98% yield.
Il. IH NMR (CDCI3)(TMS) 8: 2.50 (s, IH); 3.87 (s, 6H); 4.943 (q, IH, 1=6.64 Hz); 6.841
(t, tH, 1=4.88 Hz); 6.976 (d, 2H, 1=3.42 Hz) ppm. 19F NMR (CDCI3)(CFC13) 8: -
• 1~
•
•
12.
13.
14.
15.
16.
17.
18.
78.916 (d, JF-H=6.1 Hz) ppm. MS mlz 236 (M+), 219, 197, 167, 139, 124, 108, 96.
Anal. Calcd for C IOHuF30 J: C, 50.85; H, 4.69; F, 24.13. Found: C, 50.92; H, 4.66;
F, 24.11. 99% yield.
IH NMR (CDCI3)(TMS) 8: 2.97 (s, IH); 4.58-4.66 (m, IH); 6.20 (q, IH, 1=9.46 Hz);
6.842 (d, IH, 1=15.93 Hz); 7.31-7.44 (m, 5H) ppm. 19f NMR (CDCh)(CFCI3) ô:
79.458 (d, JF•H=6.1 Hz) ppm. MS mlz 202 (M+), 184, 165, 133, 115,91, 77, 55. Anal.
Calai for ClofI9F30: Ct 59.41; H, 4.49; F, 28.19. Found: C, 59.45; H, 4.52; F, 28.17.
99% yield.
IH NMR (CDCI3)(TMS) ô: 2.25 (s, IH); 3.84 (s, 3H); 4.531 (t, IH, J= 13.19 Hz); 5.65
(s, IH); 5.961 (q, lH, 1=9.12 Hz ); 6.689 (d, IH, 1= 15.73 Hz); 6.82-6.88 (m, 3H)
ppm. 19F NMR (CDCh)(CFCI3) ô: -79.607 (d, JF." =6. 1Hz) ppm. MS mil 248 (M+),
219, 199, 179, 161, 147, 119, 91. Anal. Calcd for C IlHlIF30 3: C, 53.23; H, 4.47; F,
22.96. Found: C, 53.28; H, 4.44; F, 22.97. 99% yield.
IH NMR (CDCI3) ô: 0.091 (s, 18H); 6.16 (s, 4H) ppm. 19f NMR(CDCI3)(CFC13) ô:
80.51 (5) ppm. MS mlz 323 (M+ - CF3), 307, 285, 265, 254, 223, 219, 189.
IH NMR (CDCI3) 8: 2.42 (br, 4H); 6.19 (s, 4H,); 6.27 (s, 4H,) ppm. 19p NMR(CDCIJ)(CFC13) ô: -80.81 (s); -80.75 (s) ppm. MS mlz 179 (M+ - CF]), 159, 143, 110,
83, 69, 53. Anal. Calcd for CaH6F60 z: C, 38.73; H, 2.44; Ft 45.94. Found: C, 38.75;
H, 2.49; F, 45.96. 96% yield.
IH NMR (CDCI]) ô: 0.08-0.09 (d, 18H, 1=2.5 Hz); 1.93-1.94 (d, 3H, J= 1.26 Hz);
5.85-5.86 (d, IH, /=1.18 Hz); 6.16 (s, 2H) ppm. '9F NMR (CDCI3)(CFCI3) ô: -80.67
(s); -77.03 (s) ppm. MS mil 337 (M+ - CF]), 321, 268, 229, 203, 175, 147, 127.
IH NMR (CDCI3) ô: 2.02-2.03 (d, 3H, 1= 1.16 Hz); 2.30 (br, 2H); 5.98-5.99 (d, lH,
J= 1.72 Hz); 6.24-6.25 (t, 2H, /=2.16 Hz) ppm. 19F NMR (CDCI3)(CFC13) ô: -81.21
(s); -77.25 (s) ppm. MS mil 193 (M+ - CF3), 173, 145, 124, 69, 51. Anal. Calcd for
CJlaF602: C, 41.24; H, 3.08; F, 43.48. Found: C, 41.27; H, 3.15; F, 43.50. 95%
yield.
IH NMR (eDel3) ô: -0.137- -0.125 (d, 18H, 1=2.38 Hz); 1.36-1.39 (d, 9H, 1=5.30Hz); 7.45-7.51 (m, 3H); 7.80-7.95 (m, 4H) ppm. 19F NMR (CDCI3)(CFC13) 8: -78.56
(s); -78.55 (s) ppm. MS mlz 479 (M+ -CF3), 441, 410, 372, 344, 301, 267, 233 .
150

•19. IH NMR (CDCI3) 8: 1.37-1.41 (d, 9H, J=8.6O Hz); 3.19-3.30 (d, 2H, 1=21.23 Hz);
7.52-7.60 (m, 3H); 7.89~8.03 (m, 4H) ppm. 19f NMR (CDCI3)(CFCI3) ô: -78.61 (s);
78.29 (s) ppm. MS mlz 335 (M+ - CF3), 320, 266, 251, 209, 181, 152, 112. Anal.
Calcd for CJI IsF60 2: C, 59.41; H, 4.49; F, 28.19. Found: C, 59.38; H, 4.46; F,
28.22. 94% yield.
20. IH NMR (CDCI3) 8: 0.021 (s, 18H); 1.03 (s, 9H); 1.20 (s, 9H); 5.39 (s, IH); 6.01 (s,
IH) ppm. 19f NMR (CDCI3)(CFCI3) 8: -68.84 (s); -74.89 (s) ppm. MS mlz 504 (M+
CF3), 489, 435, 399, 379, 327, 285, 259.
21. IH NMR (CDCh) 8: 1.05 (s, 9H); 1.25 (s, 9H); 2.45 (s, IH); 3.05 (s, IH); 5.19 (s,
IH); 6.06 (s, IH) ppm. l9f NMR (CDCI3)(CFCh) 8: -69.59 (s); -75.87 (s) ppm. MS mlz
(silylated) 504 (M+ - CF3), 489, 399, 379, 327, 285, 259, 239. Anal. Calcd for
CI6H22F60z: C, 53.33; H, 6.15; F, 31.63. Found: C, 53.40; H, 6.10; F, 31.59. 89%
yield.
22. IH NMR (CDCh) ô: 0.042 (s, 18H); 7.22-7.31 (m, 3H); 7.36-7.61 (m, 4H); 7.76-7.83
(m, 3H) ppm. 19F NMR (CDCI3)(CFCh) ô: -74.52 (s) ppm. MS mlz 247 (M+
CllH I4F30Si), 213, 181, 165, 135, 105, 77, 51.
23. IH NMR (CDCI3) ô: 4.75 (s, 2H); 7.25-7.34 (m, 2H); 7.41-7.55 (m, 6H); 7.67-7.72 (t,
2H, J=7.32 Hz) ppm. 19p NMR (CDCI3)(CFCI3) ô: -73.55 (s) ppm. MS mlz 175 (M+
CSH6F30), 152, lOS, 77, 51. Anal. Calcd for C16HlzF602: C, 54.87; H, 3.45; F, 32.54.
Found: C, 54.91; H, 3.50; F, 32.58. 98% yield.
25. IH NMR (CDCI3)(TMS) ô: 3.63 (s, IH); 3.78 (s, 3H); 3.863 (d, 6H, J=5.40 Hz), 4.07
4.12 (m, 2H); 4.449(t, IH, 1= 1.80 Hz); 5.57 (s, IH); 6.692 (q, IH, J=3.60 Hz); 6.77
6.83 (m, 28); 6.865 (d, IH, J=5.10 Hz); 6.95-6.99 (m, IH); 7.193 (d, IH,I=4.80
Hz); 7.294 (d, lH, 1=1.2 Hz) ppm. 13C NMR (CDCI3)(TMS) ô: 55.85; 56.04; 56.17;
61.36; 79.59 (q, Jc.CF =26.4 Hz); 82.64; 109.87; 110.48; 112.07; 118.25; 120.72;
121.66; 124.62; 124.97 (q, I c.f =286.59 Hz); 128.93; 146.18; 148.56; 148.89; 151.53
ppm. 19F NMR (CDCI3)(CFCI3) ô: -75.53 (s) ppm. MS mlz (silylated) 402 (M+), 302,
278, 248, 235, 221, 181, 165. Anal. Calcd for CI~2IF306: C, 56.72; H, 5.26; F,
14.16. Found: C, 56.74; H, 5.29; F, 14.22.95% yield.
27. IH NMR (CDCI3)(TMS) ô: 3.84 (s, 3H); 3.87 (s, 3H); 3.90 (s, 3H), 3.93 (d, 1H,I=3
Hz); 4.24 (d, IH, J= 12 Hz); 4.640 (d, IH, J= 12 Hz); 5.865 (d, IH, 1=3 Hz); 6.84
7.12 (m, oH) ppm. 13e NMR (CDCI3)(TMS) ô: 56.11; 56.19; 56.64; 71.68; 75.62 (q,
• 151

•
•
29.
Jc-cr:=27.9 Hz); 108.78; 110.06; 111.44; 113.40; 120.41; 121.80; 122.95; 125.60 (q,
Jc_f =286.59 Hz); 127.88; 147.37; 148.68; 149.16; 149.95 ppm. 19p NMR
(CDCI3)(CFCI3) 8: -77.63 (5) ppm. MS mlz 372 (M+), 303, 248, 235, 217, 189, 180.
Anal. Calcd for C,sH'9F30s: C, 58.06; H, 5.14; F, 15.31. Found: C, 58.21; H, 5.20;
F, 15.29.96% yield.
IH NMR (CDCI3)(TMS) ô: 2.25 (s, 3H); 3.75 (s, IH); 3.79 (s, 38), 3.88 (s, 3H); 3.935
(d, IH, J=9 Hz); 4.12 (d, IH, J=5.99 Hz); 4.33 (s, IH); 5.60 (s, IH,); 5.70 (s, IH);
6.55-6.64 (m, 3H); 6.94 (d, IH, J=5.40 Hz); 7.10 (d, IH, J=4.80 Hz); 7.311 (d, IH,
J= 1 Hz ) ppm. I3C NMR (CDCI3)(TMS) ô: 21.19; 55.88; 55.93; 61.31; 79.85 (q, Je_
CF=28.9 Hz); 82.64; 109.59; 112.95; 113.93; 118.43; 121.01; 122.19; 125.07 (q, Je.f=286.59 Hz); 128.71; 134.83; 143.81; 145.62; 146.35; 151.36 ppm. 19F NMR
(CDCI3)(CFC13) ô: -75.48 (s) ppm. MS mlz (silylated) 618 (M+), 480, 451, 411. 365,
343, 323, 271. Anal. Calcd for C1gH21P306: C, 56.72; H, 5.26; F, 14.16. Found: C,
56.78; H, 5.19; F, 14.18.93% yield.
152

•
•
5.3. RESULTS" DISCUSSION
Initially a series of model compounds containing carbonyl groups, including
various quinones, were tritluoromethylated and their 19p NMR spectra were examined.
This was done in order to understand the relationships between the chemical environment
of CF3-containing derivatives and their 19p NMR chemical shifts. Detailed work with
carbonyl containing arylglycerol /3-0-4 ether model compounds followed, aimed at
understanding the tritluoromethylation reaction so that it cao eventually he applied to
Iignins, solid wood and paper samples.
Prior to commencing the discussion, an examination of the 19p chemical shifts of
tluorine-containing compounds is described. Such data was obtained on four different
monofluorinated organic compounds in order to commence accumulating information on
the structure versus 19p chemical shift relationships. Monofluorinated aromatic
compounds exhibited a single 19p NMR signal upfield from CFCI3.
Furthermore, in order to examine the ehemical shifts of monofluorinated-organic
compounds containing earbonyl group, p-tluorobenzaldehyde was tritluoromethylated.
The resulting f1uorine-containing derivatives featured two major 19p NMR signais. One
at -103.26 ppm due to the original aromatic fluorine and a new signal (a doublet) due to
the trifluoromethyl group present on the carbon atom of the fonner carbonyl group in
benzaldehyde, i.e. at -79.122 and -79.144 ppm (Table 5.6).
ln general the chemical shifts of the aromatie tluorine atoms occur within the
range 0=-130 to -180 ppm (uptield from CFCI3). Fluorine chemical shift (OF) of
substituted compounds generally decrease in the order ortho> para> mela. The shifts
of fluorine nuclei mela or para to a substituent can he successfully correlated with their
1r-electron charge densities and bond orders as caleulated by the Hückel MO Methode For
example, substituents such as -NH2 and -OH, which produce an increase in the 'l'-electron
density al the para carbon alom, produce an increase in the shielding of the para fluorine
atoms and substituents 50ch as -N02 and -CHO, which decrease the 1r-electron density,
decrease the fluorine shielding. However, for fluorine nuclei in a position ortho to a
substituent, large deviations are always found. This is the so-called "onho effectIf:
153
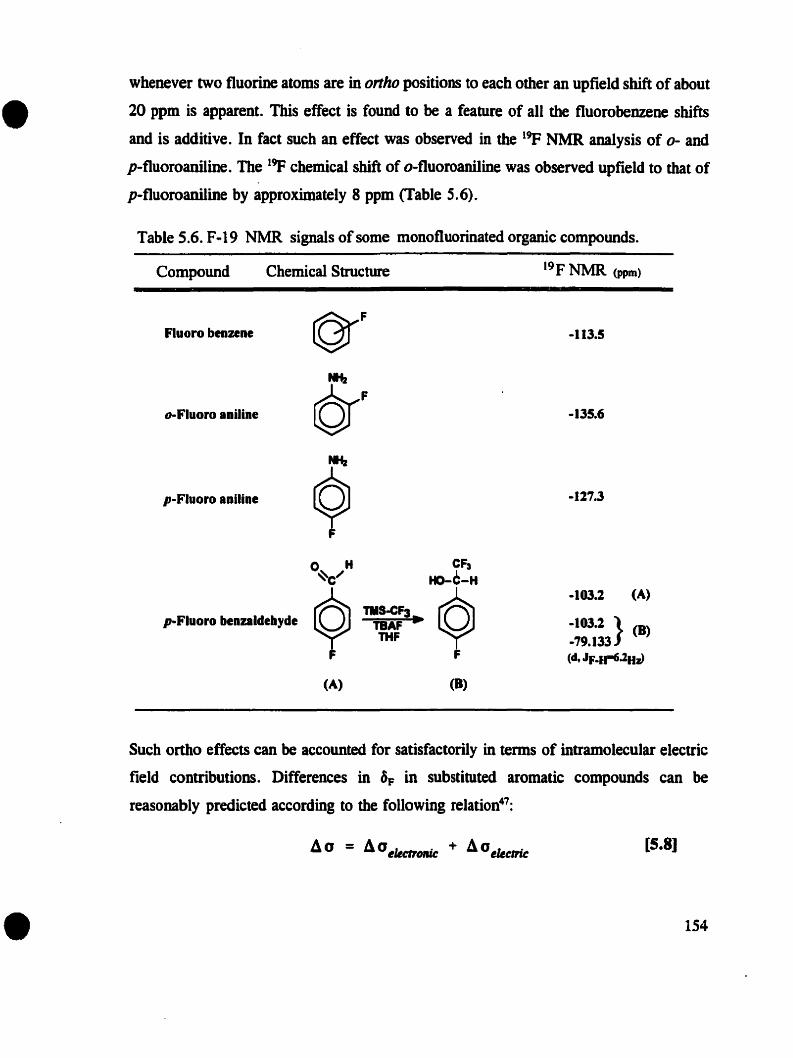
•whenever two fluorine atoms are in ortho positions to each other an upfield shift of about
20 ppm is apparent. This effect is found to he a feature of ail the fluorobenzene shifts
and is additive. In fact 80ch an effect was observed in the 19p NMR analysis of 0- and
p-fluoroaniline. The 19f chemical shift of o-fluoroaniline was observed upfield to that of
p-fluoroaniline by approximately 8 ppm (Table 5.6).
Table 5.6. F...19 NMR signais ofsome monofluorinated organic compounds.
Compound
Fluoro benune
o-Fluoro aniline
p-Fluoro aniline
Chemical Structure 19F NMR (ppm)
-113.5
-135.6
-127.3
•
o~/H CF3
HO-C-H
Q Q-103.2 (A)
p-Fluoro benzaldebydeTIIS-CF3
TBAF • -103.2 } (D)THF -79.133
F F (dt JF-u-'.2Hz)
(A) (8)
Sucb ortho effects cao he accounted for satisfactorily in terms of intramolecular electric
field contributions. Differences in 8F in substituted aromatic compounds can he
reasonably predicted according to the following relation47:
[5.8]
154

•
•
where ~aelecuonic takes into account differences in r-electron charge distribution and
4aclcaric: is the difference in the resultant electric fields at fluorine nuclei.
This demonstrates tbat the chemical shift of 19f is quite sensitive ta environment48
and therefore 19F spectroscopy would he useful tool for measuring and probing different
classes of compound containing fluorine and fluorine-derivatives.
5.3.1. Aromade Compounds Containing Carbonyl Groups
Various organic compounds containing carbonyl groups in different chemical
environments were subjected to the described trifluoromethylation reaction. This
eventually allowed for the correlation of trifluaromethylated structures to their 19p
resonance for carbonylic environments that may likely he present in lignins. These
studies indicated that the 19F NMR chemical shifts vary significantly for several classes
of carbonyl groups. For example, the 19F NMR signal of various trifluoromethylated
ketones, such as acetophenone (1) was observed at -81.35 ppm distinguishing it from that
of p-hydroxyacetophenone (2) recorded at -81.76 ppm upfield from CFCI3• Such
variations of 19p chemical shifts were also apparent for different aldehydes. .
The 19F NMR chemical shift of trifluoromethylated henzaldehyde (8) was recorded
(doublet) at -78.848 ppm while the 19F NMR signaIs moved progressively downfield with
the addition of different substituents on the benzene ring. This demonstrates that the
chemical shift of 19): is quite sensitive to environment48 and therefore 19F spectroscopy
would he useful tool for measuring and probing different classes of compounds
cantaining fluorine and tluorine-derivatives.
It is weil known that the fluorine (19p) nucleus has similar magnetic properties to
those of the proton, and may he coupled not only with each other, but also with protons.
Absorption by fluorine does not appear in the proton NMR spectmm since it appears far
off the proton observation scale, but fluorine splitting of proton signais can he seen. This
was evident for all the trifluormethylated aldehyde derivatives examined during this
wark. Ali the aldehydes were found to have the same splitting (6.1 Hz), while they
exhibited different 19p NMR chemical shifts due to different chemical substituents present
on their benzene rings .
155

•
•
Another significant observation during this phase of our work sbowed that all 19p
NMR signaIs of the various tritluoromethylated ketones appeared at a region distinct to
those ofaldebydes. For example, different trifluoromethylated aldehydes exhibited signais
at about -79 ppm, wbi1e trifluoromethylated ketones gave 19p signaIs at about -81 ppm.
This is a very significant feature of this work since it can he used for the classification
of the different carbonyl environments that may he present in lignin (Table 5.7 and 5.8).
The introduction of a trifluoromethyl group ante the carbon atom of ketone or
aldehyde May alters the chemical propenies of almost aIl the starting ketones1 and
aldehydes to chiral compounds. This May allow the compounds to exhibit optical activity,
and manifest enantiomeric properties. Funhermore, Norgai et a1.49 have also concluded
that a tritluoromethyl group" behaves as a substitutent as large as a cyclohexyl group
and a little smaller tban a sec-butyl group". The observed 19p chemical shift variations
therefore, are not surprising.
5.3.1.1. Salient Features of the Reaction
The trifluoromethylation of most of the examined organic compounds was first
carried out in the presence of catalytic amounts of tetra-n-butylammonium fluoride
(TBAF) acting as an initiator for the reaction. Although this salt was quite effective on
the series of chain reactions required, other catalysts were also investigated since the
reaction yields were consistently low. Potassium ten-butoxide and tetra-n
butylammonium iodide (TBAI) have been used with success as initiators for the
trifluoromethylation ofacetophenoneso• In comparison to tetra-n-butylammonium tluoride
(TBAF), both work equally weil. In fact the rmal yields of the reaction increased to about
88% when potassium ten-butoxide was employed. However, there are some drawbacks
associated with the use of such initiators, restricting their use in tritluoromethylating
lignins.
In general the treabnent ofcarbonyl-containing compounds with Ruppen's reagent
in the presence of TBAF only resulted in qualitatively convening these compounds to
1 Except for benzophenone (6) and 4,4'-dimethoxybenzophenone (7) .
156

•
•
their siloxy intermediates. The hydrolysis of trimethylsiloxytrifluoromethylated
intermediates was also found to he rather ineffieient when dilute HCI was used. For the
case of benzophenone, the hydrolysis of the siloxy intermediates was partieularly
ineffieient. Such problems were also observed by another group in their attempt to
trifluoromethylate hindered steroidal ketonesS1• Both of these issues were found to he
responsible for the low overall yields of the reaetion. Such yields could not qualify this
reaction as an analytical tool. Wang and Ruan sueeeeded in improving the yields of this
reaction to quantitative levels, by using the more effective tetramethylammonium tluoride
(TMAF) as an initiator.
In our work we addressed the issue of efficiently eleaving the silyl ethers by using
40% aqueous HF solution in acetonitrile (CH3CN)S2. After careful purification of the
products, their yield was calculated and compared to those with TBAF. The combination
of TMAF and 40% HF was therefore used in all subsequent efforts of
tritluoromethylating the various sets of compounds diseussed in this thesis2.
5.3.2. Quinones
Another class of carbonyl-containing compounds of special interest to wood
science is a,fj-unsaturated ketones known as quinones. Quinones are an interesting and
valuable class of compounds because of their oxidation-reduction propenies. They can
he easily reduced to hydroquinones by reagents like sodium borohydride (NaBH4) and
stannous chloride (SnCIJ. Alternatively hydroquinones can he easily reoxidized baek to
quinones by potassium nitrosodisulfonate (Fremy's salt). Since quinones are highly
conjugated, they are colored; p-benzoquinone, for example, is yellow. In addition, due
to their high degree of conjugation, quinones are energetically closely balanced against
the conesponding hydroquinones. This facility of interconversion provides a convenient
oxidation-reduction system that bas been studied intensively.
2 Quinones were hydrolyzed with TMAF.
157

• •Table 5.7. Fluoride ion induced trifluoromethylation ofcarbonyl compounds ofketones with trifluoromethyltrimethylsilane.
Entry Precursor Product Reaction Overall 19F GC-MSConditions % Yield NMR(ppm) mIe
(Q)-~-CH, (Q)-Cf' O·C, JO Iain
1) o l-eH, %5~, 16. 96 -81.35 MS ralz 190 (Ir),hydrolylis, •• 151,127,121,105,11.
I«l-Ô-~-CH, -Ô-Cf'O·C,JOlain
2) I«l 0 tCH, lS·C,Cih 98 -81.76 MSIaIz 201(.....,bydrolysil, %h 111,117,141,137,111.
I«li}-~-CH, i}-Cf. o·C, JO min
3)HO 0 tCtiJ 2S~, 14b 96 -81.60 MS rftlz 238 (M+»,
bydrolysil, Sb 197,117,151,124,110.
tfJCO tfJCO
tfJCO
H,C~Cf' O·C, JO m'.I«l*~-CH,4)
fi) 0 t CtfJ %S·C, lib 95 -81.47 MSmlz 281 (M+»,bydrelysls, %b 227,197.111,155.123.
t\CO t\CO
5) H,C~-CH, i}-Cf. o·c, 30 min
t\CO 0 t cHslS·C.14b 95 -81.56 I\IS mlz 250(M~,bydrulysis, Sb 211,111,13'.124.107.
t\CO t\CO
(Q)-~-<Q) (Q)-l~O·C, JO min
6) lS·C,ICib 94 -74.79 MSmlz 252 (M+»,bydrulysis, 5h 253,213,113,165,127.
7) H,Co-Ô-~-Ô-OCH' -Ô-C~o·e,» la'.
H,Co 0 lOOCH' 2S·C, ICib 96 -75.11 MSmlz 312(~,
hydrolysis, Sb 273.243,212,135,101.
158

• •Table S.S. Fluoride ion induced trifluoromethylation of carbonyl compounds ofaldehydes with trifluoromethyltrimethylsilane.
--Entry Precursor Product Reaction Overall 19F GC-MS
Conditions %Yield NMR(ppm) mie
(O>-~-H (Q)-~F'O·C.lOmia2S-c.20h 97 -78.848 MSmIz 171(.~.
8) C-Hhydrolysis. Sh 159.127.107•••• 71.,
(d. J'.R =6.1 Hz)OH
t\CO t\CO O·C.lOmia
HO=<Q)l-H b-CF,9) HO 0 tH 2St.20h 95 -78.981 MS..,z 222(~.hydrolysis. Sh (d, J'oR =6.1 Ilz) 205.1'3.153.125.93.
~co
~*CF'O·C.lO mla
HO*~-"10) te) 0 tH 2St.24h 98 -78.890 MS raJz 252(."".hydrolysis, Sil (d, J'oR = 6.1 Hz) 205.113.117.155.140.
t\co ~co
Il,CO)Q>-H-H )Q>-CF, O·C.lOmla
11) ~co 0 tH 2St.24h 99 -78.916 MSrnIz 231("~.hydrolysls, 511 (d. J'oH =6.1 Hz) 21•• 1.7. 117, 13', 124.
~CO "CO
(Q)-C=C-~-H(Q)- CF, O·C•.lO mla
12) o C:C-~-H 25 t.l6h 99 -79.458 MSmlz 202(• ..-"hydrolysu. Sh 114.18'.133.115.91.
OH (d, J,.n = 6.1 Hz)
HO)Q>-C=C-~-" -©- CF, O·C,lOmla
13, te) 0 c:c-tH 25 ·c, 18h 99 -79.607 !\tS ra/z 241(.".hydl1llysis, Sh (d, J'_R =6.1 Hz) 219,111.171,161.147.
....CO ....CO
159

•
•
In many cases quinones and aromatic hydroquinones seem to take part in
oxidation-reduction cycles essential to living organisms. A number ofstudies have shown
that quinones are present, in small amounts in wood and high-yield mechanical pulpS53.
54. However, despite their low abundance, they have been held responsible as one of the
significant factors for the yellowing of paperS-60.
The trifluoromethylation of quinones by adding only to one of the carbonyi carbon
atolnS bas been studied by Stahly and Be1161• However, in an effon to evaluate the
reactivity of quinones (on both carbonyl carbon atoms) with Ruppert's reageot, a number
of different compounds were selected and tritluoromethylated.
Initially p-benzoquinone was tritluoromethylated. The CF3-containing
trimethylsiloxy intermediate (14) was isolated and later examined by IH and 19p NMR
spectroscopies. The 1H NMR spectnlm featured two signais. One of them was very close
to the signal of tetramethylsilane (TMS) internai standard, and was Most likely due to the
intennediate trimethylsiloxy adduct while the second signal was attributed to the four
environmentally equivalent methyl protons. The upfield position of this signal in
comparison to the staning material indicated the elimination of the deshielding effect of
the carbonyl groups caused by the trifluoromethylation reaetion. On the ather hand, the
19p NMR spectrum exhibited only one signal at -80.51 ppm, suggesting that both
introduced trifluoromethyl groups were environmently equivalent.
After hydrolysis, the isolated compound (15) was subjected to 19p and IR~
investigations in order to assign the signais for the corresponding fluorine and alcohol
groups of the derivative. The 19F NMR spectrum showed two signaIs with equal iotensity
and 0.05 ppm difference in their chemical shifts (Figure 5.6). The lU NMR spectrum
confirmed the complete hydrolysis of the silyl ethers, since the trimethylsiloxy signal
disappeared completely and instead a new signal due to the hydroxyl group appeared at
2.42 ppm. In addition, two other signaIs corresponding to the four unsaturated prolons
of each stereoisomer were observed.
This data in conjunction with its GC-MS spectrum, confirmed the purity of the
products. As such, the formation of two stereoisomers (syn and anR) as a result of
trifluoromethylation and hydrolysis became evident. The absence of these geometric
160

•
•
isomers prior to hydrolysis can ooly he explained by the presence of the bulky
trimethylsiloxy groups which considerably hinders the formation of the"SJn" isomer,
therefore giving rise to ooly one signal in the 19p NMR speCtnlm at -80.51ppm.
Methyl-p-benzoquinone, heing of the same c1ass as p-benzoquinone, yet
asymmetric, when subjected to trifluoromethylation and the products examined by IH and
19p NMR spectroscopies showed that bath carbonyl groups were substituted by the CF3
groups. The 19p NMR spectrum of the new compound (16) displayed two well resolved
signais at -77.03 and -80.67 ppm. These signals were assigned to both CF3 substituted
of the former carbonyl carbons adjacent and nonadjacent to the methyl group,
respectively.
In an additional effort to examine an alternative siloxy hydrolysis systems the
siloxy adduct of methyl-p-benzoquinone was also treated with N,N' -dimethylfonnamide
in potassium fluoride (DMF-KF). Detailed examination of the isolated products showed
that such hydrolysis medium was effective at cleaving silyl ether bonds yielding the
corresponding alcohols. However, the high boiling point of DMF caused difficulties
during the workup.
The subsequent hydrolysis of the CF3-containing siloxy intermediates with 40%
HF solution was limited since such concentrations would result in the c1eavage of several
arylglycerol /3-0-4 ether bonds when applied to Iignins. However, lower concentration
of HF (Le. 10%) failed to cleave silyl ether bonds completely due to the low solubility
of quinones in acetonitrile. This problem was resolved by the addition of
tetramethylammonium fluoride (TMAF) in THF at room temperature. Such combination
was able to cleave the trimethylsiloxy intermediates effectively to their corresponding
alcohols, resulting in the development of a novel method of cleaving silyl ethers.
When 2-tert-butyl anthraquinone was subjected to tritluoromethylation, the IH
NMR spectnim of the isolated intermediate (18) showed the presence of trimethylsiloxy
groups, and its 19p NMR spectrum displayed two overlapping signais seperated by 0.007
ppm. Such evidence supponed the observation of two stereoisomers of derivatized p
benzoquinones.
161

•14.
~0"~OR14IR-"~
1'1 R- H
11)
, i , i ,
..... .....S ..... ".IS ...., , i , , ,
".5 .... ..., .... .... ....•
1••
11)
i.'lI
,.." -.
~Q• CHa
1 1
FsC 'OR
1'IR-"~17)R-H
171, i i i i , 1 i ,.. ..a ... ·ft .'PP ·ft .... .. ..a ·U ".
QQl"C'. OR~ t~
1 1
"c "OR
11IR-IlMe3111R- H
11)
i i ,i , i i
-".~ ·",,,s ·,..a ·,..11 •....ft ... ·71.1 ......1 ..n.J .,... ·....1 •.... 1 ·71.' ,,.
•Figure 5.6. 19p NMR spectra of trifluoromethylated quinones before (left) and after
(right) hydrolysis.
162

•
•
This was concluded since the t-butyl group, though far removed from the carbonyl
groups is less sterically hindering than the neighbouring methyl group in methyl-p
benzoquinone (Figure 5.6).
The 1H NMR spectrum of (19) showed a broad signal due to the hydroxyl groups
at 3.19 ppm, while its 19p NMR spectrum showed two signais at -78.29 and -78.61 ppm
due to the substituted Cf3and -OH groups on both carbon atoms of the carbonyl groups.
In addition to para quinones, ortho quinones are another important class of
dicarbonyl-containing compounds tbat May be found in Iignin. Ortho quinones May he
formed during demethylation and/or deprotonation of several guaiacyl-lignin structures
as a result of various chemical reactions.
To evaluate the reactivity of ortho quinone with Ruppen's reagent, 3' ,S'-di-ten
butyl-l,2 benzoquinone was trifluoromethylated and hydrolysed. The trifluoromethylated
intermediates (20) and hydrolysed (21) were isolated and probed with 19F, lU
spectroscopies, and GC-MS. According to the obtained data, ortho quinones were found
to undergo this process quite efficiently as shown in Table 5.9.
furthermore, the same procedure was carried out for benzil, and the chemistry
of the trifluoromethylated intermediates (22) and alcohols (23) was once again studied in
detail. The 19p NMR spectra of the both (22) and (23) depicted only one signal due to
the symmetric structure of benzil.
5.3.3. Lignin Mode. Compounds
Our efforts toward examining the potentiaI ofRuppen's reagent for the elucidation
of carbonyl groups in lignins were then focused at dimeric model compounds containing
carbonyl groups, resembling those present in Iignins. Dimeric model compounds have
often been used in NMR studies aimed at the structural elucidation of Iignins62-66.
31p, lH, 13C NMR spectroscopies, and OC/MS analyses were used in a manner
similar to that described so far in each step of the tritluoromethylation reaction and the
obtained spectra were compared to those of the starting materials aimed at monitoring all
changes that took place during the course of the reaction.
163

• •Table 5.9. Fluoride ion induced trifluoromethylation ofquinones with trifluoromethyltrimethylsilane.
Entry Precursor Product Reaction Overall 19F GC-MSConditions % Yield NMR(ppm) mIe
0
~Q~323 cr- Cf3 ),
0 O·C,JO min 1.. {-80.51 MSm/z14) 2S·C,6h 96
307,215,215,254,223.
15) hydrelysls, Sh15 {-80.75 MSraIz 179 (r- Cf3 ),
0 F3C "OR 14)R- S1Me3 -80.81 159,143,110,13,11.
15)R-H
0
~~Q337(r·Cf3),
<JC"' ". CH, O·C,JO.ln 16 {-77.03 MSraIz16)
f,cl ......I~ 1') RaSl.3
2S-C,7h 95-80.67 321,211,221,203,175.
17) hydre'Ylu, Sh17 {-77.25 MSm/z 193 (M+. Cf3 ),
0 -81.21 173,145,124,",51.17)R-H
o @ 18 {-78.55 MS raJz 471 (r. Cf3 ),, ~ UNdyI.p '. ~ t-butyl o·C, JO min18) cycr f,cl
.....!~ 1I)R"SI·3
-78.56 410,372,344,301,217.
19)2S·C,lh 94
335 (r.CF3),hydrolYlis,6h 19 {-78.29 MSralz
-78.61 320,211,251.209,111.
1')R- H
0 OR
......,.a.-IIuIy, :a O·C, JO min 20 {-68.84 MS raJz 504 (r- Cf3 ).20) i CF,
2S·C,"h -74.89 419,435, 319, 371, 327.1 89
21) t-butyl ~ t-butyl hydrelysis, Sh21 {-69.59 MSraIz 504 (silyl.led), (r
ZO)R-SIIieJ -75.87 - Cf3 )."l, 311, 371, 327, 215.2t)R -H
ROF,~ ~ CF,o·c, 30 min 21 {-74.52 MSm/z 247 (M·. CUH14f30Si ),
(Q)-~J-<Q) ~~-Ï(Q)22)2S-C,Sh 98 213,111,185,135,105.
23) hydrolYlis, -th13 {-73.5S
MS rn/z 175 (11+. CaHeF30),
2Z)R-SI"3 152, 105, 77, 51.
23)R-H 164

•
•
Initial attempts to trifluoromethylate the a-carbonyl ofdîmer (24) [3,4-dimethoxy
a-(2-methoxy-phenoxy)-y-hydroxy propiophenone] posed sorne difficulties since low
yields of the trifluoromethylated products were obtained when stoichiometric amounts of
TMS-CF3 in the presence of TBAF were used. The pr~sence of the primary y-OH was
suspected as interfering with reaction of (24) with TMS-CF3.In an effon to understand
the role of the y-OH in this reaction, two avenues were followed.
The compound was ace~lated prior to trifluoromethylation, thus proteeting the
primary 'Y hydroxyl groups. Following acetylatioo, the mode1 compound was
trifluoromethylated selectively at the carbonyl group. After hydrolysis with IN HCI, the
yield of the purified products was calculated to he 46%. Although this procedure
improved the final yield to a smalt extent, the reaction yield was stilliow for using this
reaction to quantitatively study lignins.
Trifluoromethylationof3,4-dimethoxy-a-(2-methoxy-phenoxy)acetophenone (26)
was the other approach. The overall trifluoromethylation of the a-carbonyl of (26) took
place with somewhat more facility than that of (24). Although the spectral anaIysis of the
product (27) showed only one 19p NMR signal at -77.63 ppm due to trifluoromethyl
group, the yield of the product never exceeded 46%.
Finally the yields of these reactions were considerably improved by using
tetramethylammonium tluoride (TMAF) as the initiator and 20% aqueous HF in
acetonitrile as the hydrolysis medium. These modifications oot only increased the reaction
yields by twofold they also gave fully clean trifluoromethylated products.
The 19p NMR spectrum of (25) showed a single signal at -75.53 ppm due to substituted
CF3, while the 31p NMR spectra featured a signal at 127.4 ppm due to the formation of
teniary a-OH as a result of the hydrolysis.
The 13C NMR contained a new quanet due to the CF3 group while the complete
elimination of the carbonyl signal signified the tritluoromethylation of the carbonyls
(Table 5.12 and Figure 5.8). This was verified by examining the lB NMR spectrum of
the compound, where a new signal at 5.57 ppm signified the formation of a-OH (Figure
5.7).
165

•"::=t~~~~&:
OCN,OCN,
•
"....~-OH~....C-~=O
Ha
1 l ' , 1 1 1 1 1 1 1 1 T--'--'--' -, ' , , , l ' , , , l ' , , , 1 l , 1 1 1 l , l , , ,--r-., l ' , , , l ' , , , 18.0 7.5 7.0 6.5 6.0 5.5 5.0 4.5 4.0 3.5 3.0 2.5
Figure 5.? IH NMR spectra of lignin model compound, before and after trifluoromethylation.
166

•,•
= 1H
1 1l,
1
.~-~
)JAl.c-
-~~~
..........-OCt\
·••!1 i~ ~..--_...•••••.....~-_.-.--_.
Ca-CPa
•
".C-GIt III 1.f-~
1
~~
11
oc...OCM,
•
1 1 !
1
1
- 1
11 1 1 1 JLI 1 • 1 JI.. 1 j
1J-
jj Il i "1 i i il Il i il1i i li" i il1i i li li i il l' i il" i " 1i i il " i li l' i ii" i il 1i j il " i " 1i i il Il i il 1i i il " i ii1i i il" i il fT200 110 110 140 120 100 80 10 40 20 o
Figure S.S. Ile NMR spectra of lignin model compound, before and after triOuoromelhylation.
167

•Tofurtherconftmlourfmdings, 3-methoxy-4-hydroxy-a-(2-methoxy-4-methyl)-1'
hydroxy-propiophenone (28) was trifluromethylated under the same conditions. The
resulting CF3-contaïning compound (29) was then examined by GC-mass, 19p, 13C and
1H NMR spectroscopies. Consequently, it was demonsttated that trifluoromethylation of
dimeric lignin model compounds can be quantitatively achieved with the more effective
TMAF as an initiator.
.(CYl) (CYII) (CYDI)
•
Figure 5.9. Chemical structure of Iignin model compounds.
The next issue was whether or.not the trifluoromethylation reaction could result
in the scission of arylglycerol 13-0-4 ether bonds. This is a very important issue as far
as the primary objectives of this work are concemed, since more than 40% of the
structural units in lignins are believed to he linked together by l3-ether bonds67-69.
Such an event May take place due to the presence of trimethylsilyl fluoride,
fonned as side product in conjunction with RUPPett's reagent dwing the reaction. In a
series of publications that address the selective cleavage of ether bonds in lignin, there
is substantial evidence that trimethylsilyl iodide is capable of cleaving (3-0-4 ether bonds.
In fact several studies have shawn that this is an effective method of cleavage the éther
bonds hetween lignin side chains and aromatic nuclei'~74.
Although the reaction was canied out in the absence of trimethylsilyl iodide
(TMSiI), the formation of trimethylsilyl fluoride (TMSif) during the course of the
reaction was a possibility to consider since it could behave similarly ta TMSiI.
168

• •Table 5.10. Fluoride ion induced tritluoromethylation ofcarbonyl groups with trifluoromethyltrimethylsilane.
ProductPrecursorEntryReaction Overall 19F GC-MS
Conditions % Yield NMR (ppm) mie====-=~========-=--""=-=:="'=====""-==I:::I:::::==
H H1 1
H-C-OH H-C-OH
H-f-~ H-~-O~
~ œH, ~~'œH'24) 25) 0
OCH, OCH,OCH, OCH,
H-~~H
H-~-0;9
~ œH, ~~'œH'28) 27) 0
OCH, OCH,OCH, OCH,
O·C,JOnaialS-c,14hhydroly" 24h
O·C,JO.i.15-C,24hhydrolylis, 24h
95
96
-75.53
-77.63
1\11 ralz (sllyl.eed) 402,CM"', 302. 271. 241. 235, 221.
MI ralz 372, CM+), 303, 241,235, 2t7. t19.
H H1 1
H-C-OH=p ..-e--OH~H-~-O 0 CI\ H-V~O 0 Cf\
~C=O OCH, HO~-C-CF'OCH'
28) 0 .29) 0OCH, OCH,
OH OH
O·C,JOnaIDlS-C.14hhydrolysis, 14h
93 -75.48 MI m1z(lily..eed) 611,(~,4IO,451,411.385,343.
169

•Table S.ll. Qualitative C-I3 NMR chemical shifts ofdimeric lignin model compounds.
•Compound a p y e-1 e-2 e-3 e-4 e-s e-6 Othe,
CH.aO
CI\O~0>-c-CH-CI\OH I1J4.1J7 B4.35 63.67 128.03 110.08 141J.14 153.88 110.1J4 123.51J Â {p-OCII.J S6.0l
80 m-OCIIJ 55.90
@roa\ 123.43 112.26 146.IJI 150.32 118.11 121.10 B o-OCH.J 55.74
(24) 0
CH,C)
~C-CH-ctt.OH I1J5.02 84.60 63.65 133.45 110.71 146.80 ISI.O' IIJ.13 127.7J Â p-OCII] 55.99
80{o-OCR] 55.70
toa\114.18 114.02 144.61 150.06 118.42 121.30 B P-CHl 21.09
(28) 0H.s
CHP
cHoO~0>-c-CHz IIJJ.18 71.81J -- 127.74 110.03 141J.12 153.72 110.JO 122.69 Â {p-OC11.1 56.34()O m-OCIIJ 55.92
@rOCHz 122.26 112.01 147.48 141J.61 114.51 120.72 B o-OCR] 55.81
0(26)
170

•Table 5.12. Qualitative C-13 NMR chemical shifts ofdimeric Iignin model compounds after trifluoromethylation..
•Compound a p Y CF3 e-1 e-2 e-3 C-4 e-s e-8 Othe,
CftP~C~CtlP 0 J-XH-CHPl 79.17 81.64 61.36 128.39 118.93 109.87 148.56 151.53 110.48 114.61 PlIe"" Vni, A
79.48 126.11
@roc~ 79.70 123.83 121.66 112.07 146.18 148.89 118.25 120.72 PIte"", VIII' Il
0 79.92 121.55(25)
Ct\O
~~o J-r-CHPl 79.52 82.64 61.31 128.49 134.83 109.59 145.62 151.36 112.95 128.71 PlIe"" Vni, A79.73 126.21
~OC~79.96 123.93 122.19 113.93 143.81 146.35 118.43 121.01 PIte.' Vni' JI
0 80.17 121.65
(29)
ltJ
CH,O
~CF'CH,O 0 J-r 75.05 71.68 -- 129.02 127.88 108.78 148.68 149.95 110.06 112.95 PIte.' VIII' A75.43 126.74
@r~75.80 124.46 120.41 111.44 147.37 149.16 113•.#0 121.80 Phe"" Uni, B
0 76.18 122.18(27)
171

•
•
For this reason, gas-chromatography was employed ta evaluate the integrity of alkyl-aryl
ether bonds of the Iignin model compounds (24 and 26) before and after the reaction. It
was confirmed tbat onder the conditions employed in this work, the foonation of
trimethylsilyl fluoride (TMSiF) did not cleave the ~-ether bonds of the models used.
Tetrabutylammonium iodide can not he used as an initiator for the reaction, since it
would result in the foonation of trimethylsilyl iodide (TMSïI) which will in retum c1eave
the alkyl-aryl ether bonds in dimeric model compounds and Iignin. Pottasium ten
butoxide, was found to he a very effective initiator of tritluoromethylation for a series
of monomeric model compounds. Its strongly basic character, however, poses the danger
of stnlctural alterations to the delicate and complex nature of Iignin. The
trifluoromethylation reaction in the presence of tetra-n-butylanunonium fluoride (TBAF)
resulted in low yields, precluding this procedure from becoming a tool for the
quantitative analysis of carbonyl groups in lignins.
172

•
•
5.4. CONCLUSIONS
The quantitative trifluoromethylation of carbonyl groups for a series of carbonyl
containing Iignin-like model compounds bas been accomplished. This was achieved by
using tritluorotrimethylsilane (RuPPert's reagent) in the presence ofTMAF. This reagent
was found to he an efficient nucleophilic tritluoromethylating agent for derivatizing a
variety of carbonyl-containing compounds. Although their 19f NMR signais were weil
resolved, allowing differentiation amongst the various classes of carbonyl groups, the
chemical shifts of tritluoromethylated quinones occupied a wide range, overlapping with
those of ketones.
Having established the precise conditions required for the trifluoromethylation
reaction so as to qualify as an analytically reliable reaction. In Chapter 6 we tum our
attention 00 actual lignio samples.
173

•s.s. REFERENCES
1. Heitner, C. and Schmidt, J., Light-induced yellowing of wood-containingpapers-A review of fifty years of research., Proc. 6rh • Int. Symp. on Wood andPulping Chem., 1, 131-149, 1991.
2. Schmidt, J. A. and Heitner, C. E., Light-induced yellowing of mechanical andultra-high yield pulps. Part 3. Radical-induced cleavage of etherifiedguaiacylglycerol-l3-arylether groups in the main degradative pathway., J. WoodChem. Technol., 13, 309-325, 1993.
3. Schmidt, J. A. and Heimer, C. E., Light-induced yellowing ofmechanical Pulp:effect of methylation, NaBH4 reduction and ascorbic acid on chromophoreformation., J. Wood Chem. Technol., Il, 397-418, 1991.
4. Leary, G. J., Recent progress in understanding and inhibiting the light-inducedyeUowing ofmechanical pulps., J. ofPulp and Paper Sei., 20 (6), 154-160, 1994.
5. Klason, P., Beitrag zur Kenntnis der Konstitution des Fichtenholz-Lignins(II). BerDtsch. Chem. Ges., 55,448-455, 1922.
6. Adler, E., Bjorkqvist K. J., Haggroth, S., Über die Ursache der Farbreaktionendes Holzes., Acta Chem. Scand., 2, 93-94, 1948.
7. Adler, E. and Elimer, L., Coniferylaldehydgruppen im Holz und in isolienenLigninpraparaten., Acta Chem. Scand., 2, 836-840, 1948.
8. Adler, E., Sulfite pulping propenies of spruce wood from unpeeled, floated logs.Pan 1. Catechol tannins in the surface layer of the sapwood., Svensk.Papperstidn., 54, 445-450, 1951.
9. Pew, J. C., Structural aspect of the color reaction of Iignin with phenols., J. Am.Chem. Soc., 73, 1678-1685, 1951.
10. Geiger, H. and Fuggerer, H. Über den Chemismus der Wiesener-Reaktion aufLignin., Z. Natuforsch., 34b, 1471-1472, 1979.
Il. Adler, E. and Marton, J., Zur Kenntnis der Carbonylgmppen im Lignin. 1. ActaChem. Scand., 13, 75-96, 1959.
12. Larsson, S. and Mikscbe G. E., Gaschromatographische Analyse vonLigninoxidations-produkten.VI.4,4-Bis-aryloxy-cyclohexa-2,5-dienonestrukturenim Lignin., Acta Chem. Scand., 26, 2031-2038, 1972.
• l~

•13. Panchapakesan, B. Photo-induced reactions of lignin and Iignin fragments: Photo
oxidation of chlorinated organics in bleach plant effluents and brightness stabilityof high yield pulps. Ph. D. Thesis, North Carolina State University, Raleigh,North Carolina, USA. 1990.
14. Hon, D. N. S. and Glasser, W. On possible chromophore structures in wood andpulps- a survey of the present state of knowledge., Polym-Plast Technol. Eng.,12, 157-179, 1979.
15. Lebo, S. Y., Lonsky, W. F. W., McDonough, T. J., Medvecz, P.J., Theoccurrence and light induced formation of onho-quinonoid lignin structures inwhite spruce rermer mechanical pulps., Proct. Int. Pulp Bleach Conf., Orlando,FL, June 6-9, 277-251, 1988.
16. Brunow, G. and Eriksson, B., Q-Carbonyl groups as sensitizers in the photodehydrogenation of phenolic structures in lignin., Acta Chem. Scand., 25, 27792781, 1971.
17. Lin, S. Y. and Kringstad, K. P., Photosensitive groups in Iignin and lignin modelcompounds., Tappi, 53, 658-663, 1970.
18. Chang, H. M. and Allen, G. G., Oxidation. In: Lignins. Occurrence, fonnation,structure and reactions., Eds. Sarkanen, K.V., and Ludwig, C.H., WiJeyInterscience, New York, 433-485, 1971.
19. Gierer, J. and Lin, S. Y., Photodegradation of lignin. A contribution to themechanism ofchromohore formation., Svensk. Papperstidn., 75,233-239, 1972.
20. Heuser, E., Analytik der Carbonylgmppe. In: Müller E, Bayer 0, Meerwein H,Ziegler K (eds.) Methoden der organischen Chemie (Houben-Weyl) 4. Autl., Bdn Analytische Methoden. , George Thieme, Stuttgart, Federal Republic ofGermany, 434-472, 1953.
21. Heuser, E., Analytik von Chinonen. In: Müller E, Bayer 0, Meerwein H, ZieglerK (eds.) Methoden der organischen Chemie (Houben-Weyl) 4. Autl., Bd fiAnalytische Methoden. George Thieme, Stuttgan, Federal Republic of Germany,434-472, 1953.
22. Lindberg, B. and Misiorny, A., Quantitative analysis of reducible carbohydratesby means of sodium borohydride., Svensk. Papperstidn., 55, 13-14, 1952.
23. Gierer, J. and Sooerberg, S., Über die Carbonylgruppen des Lignins., ActaChem. Scand., 13,127-137, 1959.
• 175

•24. Adler, E. and Matton, J. Acta Chem. Scand., 13, 75, 1959. [Preliminary report,
Manon, J. Proc.lVthIntem. Congr. Biochem., Vienna 1958, vol. D, 154, 1959] .
25. Liebman, J. F., Greenberg, A., Dolbier, W. R., Jr., Eds. VCH: Fluorinecontaining molecules, structure, reactivity, synthesis, and applications., NewYork, 1988.
26. Banks, R. E. Ed., Organofluorine compounds and their industrial applications.,Ellis Horwood LUI., Chichester, 1979.
27. Prakash, G. K. S.; Krishnamurti, R.; Olah, G. A., Fluoride-inducedtrifluoromethylation of carbonyl compound withtrifluoromethyltrimethylsilane(TMS-CF3). A trifluoromethide equivalent., J.Am. Chem. Soc., 111, 393-395, 1989.
28. Ruppert, 1., Schlich, K., Volbach, W., Die Ersten CF3-SubstituiertenOrganyl(chlor)Silane., Tetrahedron Lett., 25, 2195-2198, 1984.
29. Prakash, G. K. S. and Pichika, R., Direct trifluoromethylation of a-keto estersta (j,(j,I3-trifluorolactic acid derivatives using trifluoromethyltrimethylsilane.,Synlett., 9, 643-644, 1991.
30. Lundquist, K., and Robert, D., ProtoneH) and Carbon-13 nuclear magneticresonance spectroscopy. In: Method in ligninchemistry., Eds. Denee, C. W. andLin, S. Y., Berlin, Ch. 5.3 and 5.4., pp. 242-273, 1992.
31. Arehipov, Y., Argyropoulos, D. S., Bolker H. 1. and Heitner, C., 31p NMRspectroscopy in wood chemistry. Pan 1. Lignin model compounds., J. WoodChem. Technol., 11(2), 137-157, 1991.
32. Archipov, Y., Argyropoulos, D. S., Bolker, H. 1., and Heitner, C., 31p NMRspectroscopy in wood chemistry. Part II. Phosphite derivatives of carbohydrates.,Carbohydr. Research., 220, 49-61, 1991.
33. Argyropoulos, D. S., Archipov, Y., Bolker, H. 1., and Heitner, C., 31p NMRspectroscopy in wood chemistry. Part IV. Spin-Iattice relaxation times &solvent effects in 31p NMR., Holzforschung, 47, 50-56, 1993.
34. Argyropoulos, D. S., Bolker, H. 1., Heitner, C. and Archipov, Y., 31p NMRspectroscopy in wood chemistry. Part V. Qualitative analysis of Iignin functionalgroups., J. Wood Chem. Technol., 13, 187-212, 1993.
35. Jenkins, B. G., Detection of site-specifie binding and co-binding of ligands tomacromolecules using fluorine-19 NMR., Life SeL, 48, 1227-1240, 1991.
• 176

•36. Emsley, J. W. and Phillips, L., The effect of solvents on the chemical shift of
fluorine nuclei in aromatie compounds., Mol. Phys., Il, 437-456, 1966.
37. Emsley, J. W. and Phillips, L., Chemical shifts of fluorine nuclei in somefluorinated pyridines., J. Chem. Soc., B434-439, 1969.
38. Mooney, E. F., An Introduction to 19F NMR spectroscopy., HeydenlSadler,1970.
39. Emsley, J. W. and Phillips, L., Fluorine chemical shifts in NMRspectroscopy., J. W. Emsley, J. Feeney, and L. H. Sutcliffe, Eds., PergamonPress, Oxford, 1971.
40. Dungan, C. H. and Van Wazer, J. R., Compilation of reported 19F NMRchemical shifts., Wiley-Interscience, New York, 1970.
41. Feeney, J., NMR studies of nuclei other than hydrogen., Nuclear magneticresonance of organic chemists., D. W. Mathieson, ed., New York, AcademicPress, pp. 151-158. 1967.
42. Gerig, J. T., Fluorine nuclear magnetic resonance of fluorinated ligands.,Methods Enzymology., 177B, 3-23, 1989.
43. Jardetzky, O. and Roberts, G. C. K., NMR in molecular biology., New York,Academie Press, 1981.
44. Gerig, J. T., Fluorine nuclear magnetic resonance in biochemistry., Biol. Magn.Reson., L. Berliner & Reuben, J., ed. New York, Plenum Press, 139-203, 1978.
45. Hull, W. E., Sykes, B. D., Dipolar spin relaxation of fluorine-19 in multispinsystem., Application to fluorine-19 labeled proteins., J. Chem. Phys., 63, 867880, 1975.
46. Sykes, B. D., and Weiner, J. H., Biosynthesis and 19F NMR characterization offluoroamino acid containing proteins., Magnetic resonance in Biology., J. S.Cohen, ed. New York, John Wiley & Sons. 171-196. 1980.
47. Boden, N., Emsley, J. W., Feeney, J. and Sutcliffe, L. H., The effect of 1['
electron distribution and intramolecular electric fields on the 19F NMR shieldingin substituted perfluorobenzene., Mol. Phys., 8, 133-149, 1964.
48. Gerig, J. T., In: Biological magnetic resonance., Vol. 1., Berliner, L. G. andReubens, J., Eds. Plenum, New York, Chapter 4., 1978.
• 177
•49. Nagai. T., Nishioka. G., Koyama. M., Ando. A., Takuichi. M., and Kumadaki,
1., Reactions of tritluoromethyl ketones. IX. Investigation of the steric effect ofa tritluoromethyl group based on the stereochemistry on the dehydration oftrifluoromethyl homoallyl alcohols., J. of Fluorine Chem., 57, 229-237, 1992.
50. Prakash, G. K. S., Krishnamurti, R., Olah, G. A., Fluoride-inducedtrifluorornethylation of carbonyl compound withtrifluoromethyltrimethylsilane(TMS-CF3). A trifluoromethide equivalent. , J.Am. Chem. Soc., 111, 393-395, 1989.
51. Wang, Z., and Ruan, B., Trifluoromethylation of steroidal ketones., J. ofFluorine Chem., 69, 1-3, 1994.
52. Greene, T. W., and WUls, P. G. M., Protective groups in organic synthesis.,second edition, New York, John Wiley & Sons Inc., 71, 1991.
53. Argyropoulos, D. S., Heitner, C. and Morin, F. G., 31p NMR spectroscopy inwood chemistry. Part Ill. Solid state 31p NMR of trimethyl phosphitederivatives of chromophores in mechanical pulp., Holzforschung, 46, 211-218,1992.
54. Argyropoulos, D. S., and Heitner, C., 31p NMR spectrocopy in wood chemistry.Part VI. Solid state 31p NMR of trimethyl phosphite derivatives ofchromophores and carboxcylic acids present in mechanical pulps: A method forthe quantitative detennination ofonho-quinones., Holzforschung Suppl., 48, 112116, 1994.
55. Lin, S. Y., and Kringstad, K. P., Sorne reactions in the photoinduceddiscoloration of lignin., Norsk. Sldksind., 25, 252-256, 1971.
56. Kringstad, K. P., Sorne possible reactions in the light-induced degradation ofhigh-lignin-containing high-yield pulps., Papier., 27(lOA), 462-466, 1973.
57. Forsskâhl, 1., and Janson, J., The irradiation of mechanical pulps withmonochromatic light at selected wavelenghls., Proc. 6lJl Int. Symp. of Wood andPulping Chem., Melbourne, Australia, l, 255-263, 1991.
58. Castellan, A., Nounnamode, A., Jeager, C. and Forsskâhl, 1., Photochemistryof lignocellulosic materials., Eds. Heitner, C. and Scaiano, J. C., ACS Symp.Ser., 531, pp. 60-76, 1993.
59. Gellersted, G. and Pattersson, E. L., Light-induced oxidation of lignine Part 2.The oxidative degradation of aromatie rings., Svensk. Papperstidn., 80, 15,1977.

60. Lebo, S. E., Lonsky, W. F. W., McDonough, T. J., Medvecz, P. J., and
• Dimmel, D. R., The occurrence of light-induced fonnation of ortho-quinoidlignin stnlctures in white spruce refmer mechanical pulp., J. Pulp and PaperSei., 16(5), JI39-143, 1990.
61. Stahly, P. G., Bell, R. D., A new method for synthesis of trifluoromethyl-substituted phenols and anilines., J. Orge Chem., 54, 2873-2877, 1989.
62. Adler, E., Brunow, G., Lundquist, K., Investigation of the acid-catalysedalkylation of lignin by means of NMR spectroscopie methods., Holzforscbung,41, 199-207, 1987.
63. Lundquist, K., NMR studies of lignins. 4. Investigation of spmce lignin by IHNMR spectroscopy., Acta Chem. Scand., B34, 21-26, 1980.
64. Lundquist, K., and Olssoo, T., NMR studies of lignine 1. Signal due to protonin formyl groups., Acta Chem. Scand., B31, 788-792, 1977.
65. Brunow, G., Lundquist, K., Comparison of a synthetic dehydrogenatioo polymerof coniferyl alcohol with milled wood lignin from spruce using IH NMRspectroscopy, Pape Puu., Il, 669-672, 1980.
66. Lundquist, K., NMR studies of lignins. 5. Investigation of non-derivatizedspruce and birch lignin by IH NMR spectroscopy., Acta Chem. Scand., 835, 497-501, 1981.
67. Lai, Y. Z., Sarkaneo, K. V.; In: Lignins. Occurrence, formation, structure andreactions., Eds. Sarkanen, K.V., and Ludwig, C.U., Wiley-Interscience, NewYork, pp. 226-228, 1971.
68. Erickson, M., Larsson, S., and Miksche, G. E., Gas chromatographie analysisof lignin oxidation produets. VID. The structure of lignin of spruce., ActaChem. Scand., 27, 903-914, 1973.
69. Matsumoto, Y., Ishizu, A., and Nakano, J., Selective cleavage of arylglycerol-l3-aryl ether type structures in Lignin I., Mokuzai Gakkaishi., 26(12), 806-810,1980.
70. Matsumoto, Y., Ishizu, A., Iiyama, K., and Nakano, J., Selective eleavage ofarylglycerol-~-arylether type structures in lignin I., Mokuzai Gakkaishi., 28(4),249-254, 1982.
71. Makino, S., Meshitsuka, G., and Ishizu, A., Selective eleavage of ether bondsin lignin by trimethylsilyl iodide., J. Wood and Pulp. Chem., 275-277, 1989.
• 179

•72. Maldno, S., Meshitsuka, G., and Ishizu, A., Selective cleavage of ether bonds
in lignin by trimethylsilyl iodide., Mokuzai Gakkaishi., 36(6), 460-465, 1990.
73. Fujino, K., Meshitsuka, G., and Ishizu, A., Selective cleavage of ether bonds inlignin by trimethylsilyl iodide n., Mokuzai Gakkaishi., 38(10), 956-962, 1992.
74. Ho, T. L., and Olah, G., Cleavage of esters and ethers with iodotrimethylsilne.,Angew. Chem., lot. Ed. Engl., 15(12), 774-775, 1976.
~ 180

•
•
Cbapter 6
l'F Nuclear Magnetic Resonance (NMR) Spectroscopy for theQuantitative Detection and Classification of Carbonyl Groups in
L· ·19a1ns
6.0. ABSTRACT
A novel method that permits the quantitative detection and classification of various
carbonyl groups in lignins has been developed. The proposed method was optimized with
the quantitative trifluoromethylation of a series of carbonyl-containing lignin-like .model
compounds. This effort was followed by 19p NMR spectral analyses of the resulting
fluorine derivatives allowing for a thorough understanding oftheir structure/ l 9p chemical
shift relationships. The various carbonyl groups present in lignins were also investigated
by trifluoromethylating them in the presence of catalytic amounts of
tetramèthylammonium fluoride (TMAF), followed by hydrolysis with TMAF in THF.
By using a variely of selective reactions it became possible to assign a number of
prominent 19p NMR signais to a variety of carbonyl groups present in Iignins. Our
studies demonstrated that the proposed method can be applied toward the quantitative
detenninatioD of carbonyl groups that are present in soluble native and technicallignins.
181

•
•
6.1. INTRODUCTION
Lignin is a complex phenylpropanoid biopolymer formed by an enzyme initiated
radical polymerization of cinnamyl alcohols1• Due to the random nature of its formation,
lignin does not posses regularity in its repeating units2-4. This peculiarity makes the
characterization of its structure a challenging task.
A number of studies have demonstrated the presence of small amounts of carbonyl
groups in lignïns5-s. In particular milled wood lignins have been reported to contain
conjugated cinnamaldehyde structures and a-carbonyl groupS9. Other investigations have
shown that technicallignins contain appreciable amounts of a-carbonyl groups in addition
to benzaldehyde and quinoneslO• 11. The presence of carbonyl groups in lignins, in
particular those present as 0- and p-quinonoids, quinonemethides, and other extended
conjugated enone systems, are not ooly responsible for the color of Iignified plant tissuel2•
13 but also sentisizing centres in the photoyellowing of Iignocellulosic materials14. In
general, the low content of these groups in lignins has made the elucidation of their role
rather elusive. For example, quinones, which are present in wood and high-yield
mechanical pUlpsl5. 16 in rather low amouots, only recently have been unequivocally
shown to he responsible for the yellow colour of photochemically revened papersI5•20•
Several methods for determining the carbonyl groups in lignins are available21•25•
Amongst these, the most effective and simple is the one that utilizes the reaction of
carbonyl groups with hydroxylamine hydrochloride forming an oxime and hydrochloric
acid. Subsequent titration of the hydrochloric acid provides an estimation of the amount
of carbonyl groups in a sample8• 2S. A modification of this technique, claïmiog greater
reproducibility, has heen described by zakiS26 • The modified procedure caUs for the use
of triethanolamine to function as the acid acceptor followed by a back titratioo. A
technique that anempts the distinction of a-carbonyl groups to those of conjugated
aldehydes is also available22•23 , based 00 sample reduction (sodium borohydride) followed
UV spectroscopie measurements. The latter method requires the use of appropriate Iignin
model compounds that serve as standards for determining the changes in molar
absorbitivity of the absorption bands that are caused by the reduction of a particular
carbonyl group to the corresponding benzylic alcohol .
182

•
•
Infrared spectroscopy bas been also used for investigating various structures in
lignin170 29 inculding carbonylsJO. Recently, HonIing et al.JI reported a semiquantitative
technique for the detennination of carboxylic and non-conjugated carbonyl groups by IR
spectroscopy. However, the application of tbese techniqu~s were not widespread since
their precision is limited and the various classes of carbonyl moieties can not he
differentiated.
NMR is rapidly becoming a powerful analytical tool in the bands of wood
chemists aimed at providing answers in relation to the structure of lignins. However, the
complex stnacture of these materials bas imposed some serious challenges and
limitations, even in the application and use of NMRJ2. Efforts to overcome some of the
limitations imposed by protonJ3-3S and 13C-NMR spectroscopies36-38 have prompted the
examination of other NMR-active nuclei. These efforts have provided additional tools
for obtaining fme structural details for these heterogeneous biopolymers. The
detennination of a variety of labile protons in Iignins has been carried out by 29Si_, Jlp_
and 19F_ based NMR meth~s, for suitably silylated39. 40, phosphitylated41-48 and
fluorinated49• so lignins respectively. Funhennore, Lebo et al. 13 and recently,
Argyropoulos et al. S1 bave reponed the detection of onho quinones in mechanical pulps.
In panicular, the latter group bas actually managed to follow tbeir fonnation during the
process of light-induced yellowing using solid-state 3IP_NMR spectroscopySI.
The 19p nucleus is 100% naturally abundant and its high gyromagnetic ratio makes
its NMR sensitivity nearly the same as that of proton. 118 chemical shift extends over a
wide range providing adequate signal dispersion that May reduce signal overlap and aid
interpretation. Attemp18 at detennining the carbonyl content of lignin by 19p-NMR have
actually been made previously afterp-fluorobenzylation52 of the lignin or i18 derivatization
with p-fluorophenylhydrazines3 • In both cases the 19p-NMR signais received were found
to overlap over a relatively narrow range thus diminishing the quantitative reliability of
the techniques. Funhermore, the proposed methods were not capable to distinguish
amongst the different classes of carbonyl groups present in Iignin.
In a previous effort, our attention was focused al the developmenl of an 19F-based
novel magnetic resonance method aimed al expanding the frontiers of application of
183
•
•
NMR for the analysis of carbonyl groups in ligninS4. For this purpose a selective and
quantitative trifluoromethylation reaction was developed for tagging the carbonyl groups
in various lignin model compounds, using tritluoromethyltrimethylsilane (TMS-CF3) in
the presence of tetramethylammonium fluoride (TMAF). More specifically, a series of
ketones, aldehydes, quinones and dimeric Iignin model compounds were quantitatively
tritluoromethylated, followed by 19p NMR spectral analyses of the resulting fluorine
derivatives. This effort allowed for a thorough understanding of the various
structure/ l9p chemical shifts relationshipsss that operate for Iignin-like moieties.
The present effort attempts to expand the application of quantitative
tritluoromethylation to lignins, aimed at elucidating the nature and the quantity of the
various carbonyl groups present in them.
184

•
•
6.2. EXPERIMENTAL
6.2.1. Materials and Methods
6.2.1.1. Reactions
Trifluoromethylation
The following trifluoromethylation procedure was developed and applied to ail
Iignin samples. 100 mg of Iignin were dissolved, under eonstant stining, in 10 mL of
dry tetrahydrofuran (THF) at room temperature. After 10 min of stirring, 600 pL of
trifluoromethyltrimethylsilane (TMS-CF3) were added. The mixture was eooled at 0 oC
for 10 min followed by the addition of eatalytie amount (15 mg) of tetramethylammonium
fluoride (TMAF) aeting as the initiator. The reaetion mixture eontinued to he stirred at
o oC for 30 min and then al room temperature for 24 hours. The intermediate
trifluoroanethylated siloxy adduets were then hydrolysed by the addition of (50 mg) of
tetramethylacunonium tluoride (TMAF) at room temperature for 24 hours in THF. After
evaporating the THF under redueed pressure, the residue was washed and centrifuged
thoroughly by 3x50 mL water. Finally, the isolated materials were dissolved in a mixture
of dioxane/water (25:5, v/v) and freezed dried under redueed pressure.
Sodium Borohydride Reduction
Lignin (200 mg) was dissolved into 25 mL of a solution eomposed of (60:40:50,
v/v) 2-methoxyethanol, isopropanol, and water resPectively. This was followed by the
addition of 3 mL of a solution eomposed of O.OlN sodium hydroxide and 100 mg of
sodium borohydride and stirred at 40 oC for 24 hours. The reaetion mixture was then
aeidified to pH 3-4 with dilute (10%) sulfurie aeid. The organic solvents were evaporated
under redueed pressure and the Iignin was precipitated with the addition of water. The
preeipitated lignin was then washed and eentrifuged 3 tintes, dissolved in a mixture of
dioxane/water (25:5, v/v) and freeze dried.
Dakin Reaction
Lignjn (200 mg) was suspended in a solution of 6.5 mL of n-propanol and 7.5 mL
185

•
•
of water under eonstant stirring for 15 min. To this mixture 5 drops of a 0.5M sodium
hydroxide solution was added causing the complete dissolution of the Iignin. This was
fol1owed by the addition of 702 pL·of 30% hydrogen peroxide. ACter adjusting the pH
of the mixture to 10.6, the reaction mixture was stirred at SO oc for 4 hours. Then the
reaction was neutralized by the addition 1-2 drops of25% sulforie acid to pH 4.7. After
evaporating the organic solvent under redueed pressure, the Iignin was preeipitated by
addition of water. The precipitated lignin was washed with water and centrifuged 3 times
with 15 mL of water. The isolated lignin was then dissolved in a mixture of
dioxane/water (25:5, v/v) and freeze dried.
Sodium Hydrosulphite Reduction ofUgnin Model Compounds
Selected lignin Madel eompounds (200 mg) were dissolved in 5 mL of dioxane
and a slow stream of nitrogen was bubbled through the solution for about 30 minutes.
To this solution 200 mg of sodium hydrosulphite (Na2S204) dissolved in 5 mL of water
were added. After various reaetion times (15, 60, and 240 min), a 1 ml aliquot of the
mixture was withdrawn, aeidified by the addition of lM HCI, and extraeted with
ethylacetate. The organic solvent was then evaporated under reduced pressure and the
residue was analyzed by GC-MS chromatogram.
Sodium Hydrosulphite Reduction ofUgnin
Lignin (200 mg) were dissolved in 5 mL of dioxane and a slow stream of nitrogen
was bubbled through the solution for about 30 minutes. To this mixture, a solution
eomposed of 200 mg of sodium hydrosulfite in 5 mL of water was added and the reaction
mixture was kept under stirring at room temperature for 1 hour. The mixture was then
freeze dried and the residue was washed with smal1 aliquots of water followed by
centrifugation (x3). Finally, the reduced lignin was dissolved in a mixture of
dioxane/water (25:5, v/v) and freeze dried.
186

•
•
6.%.1.2. Instrumentation
Gas ChrollUltographylMass Spectrometry
OC-MS analyses were carried out on a Hewlett Packard 5972 mass spectrometer
interfaced to a Hewlett Packard 5890A gas Cbromatograph with a 30m x 0.25 mm
packed silica capillary column. The injection port temperature was 280 oC and the oyen
temperature increase profl1e was from 100 oC to 250 oC, witb a gradient of 5 oC/min.
Z'F NMR Spectroscopy
Ali spectra were recorded on a Varian Unity 500 FT-NMR spectrometer al an
operational frequency of 470.3 MHz. The derivatized trifluoromethylated lignin were
dissolved in 800 ilL of a solvent mixture composed of pyridine and deuterated
chloroform (15-20 mg/O.8 ml) at a volume ratio of 1.6:1, v/v. The mixture was stirred
with a magnetic bar until the lignin was fully dissolved. To this mixture, 100 pL of an
internaI standard solution were added (i.e 1.69 g/mL 1.6:1 v/v pyridine/CnCl3 oÏ 3,3'
bis(tritluoromethyl)benzophenone; whose chemical shift was referenced to
tluorotrichloromethane. Quantitative acquisitions were carried out in 5 mm tubes at room
temperature with acquisition times of 0.64 sec followed by a relaxation delay of 10
seconds. The number of scans acquired was 1000 per measurement. Pulse widths
corresponding to a 45 0 tlip angle and a line broadening of 2 Hz were used during
acquisition and processing of the spectra.
Two-Dimensional NMR Spectroscopy (HMac)
5uch spectra were acquired using 10-30 mg of sample dissolved in 0.6 mL CnCl3
or nMSO-D6 or acetone-D6 on a Varian Unity 500 NMR spectrometer using a 5 mm
inverse detection probe (DHP). The chemical shifts were referenced to Me4Si and CfCl3
for 13C and 19p respectively. HMQC spectra were acquired over a 30 ppm window in F2
e9F) and 190 ppm in FI (13C) with GARP-I decoupling. The value of the coupling
constant was adjusted to the estimated value for the 2J C-F of 30 Hz. 2K x 256
increments were acquired. After Ft zero-filling, Fourier transformation, and squared
cosine bell apodizatioD, the transformed data matrix was 1024 (F~ x 512 (FI) real points.
187

•6.2.1.3. Cbaracterization
6.2.1.3.1. CbaracterizatioD of Trinuorometbylated Mode. Compounds
•
1.
2.
3.
4.
5.
6.
IH NMR (CDCh)(TMS) ô: 1.77 (s, 3H); 2.60 (s, IH); 7.37-7.46 (m, 3H); 7.56-7.61 (m,
2H) ppm. 19p NMR (COCI3/pyridine)(CFCI3) ô: -80.30 (s) ppm. MS mIt. 190 (M+), 151,
127, 121, 105, 91, 77, 51. Anal. Calai for ~~30: C, 56.84; H, 4.77; F, 29.97.
Found: C, 56.92; H, 4.69; F, 29.92. 96% yield.
IH NMR (COCI3)(TMS) ~: 1.74 (s, 3H); 2.35 (s, IH); 5.67 (s, IH);· 6.829 (d, 2H,
J=8.78 Hz); 7.432 (d, 2H, J=8.58 Hz) ppm. 13C NMR (CDCI3)(TMS) ô: 23.85; 74.54
(q, Jcoa:=29.1 Hz); 115.11; 155.83; 129.36 (q, JcoF= 284.9 Hz); 155.83. 19F NMR
(CDCI3/pyridine)(CFCI3) ~: -80.57 (s) ppm. MS mlz 206 (M+), 188, 167, 149, 137, 119,
107, 91. Anal. Calcd for CJl9F30Z: C, 52.43; H, 4.40; F, 27.65. Found: C, 52.48; H,
4.49; F, 27.67.98% yield.
IH NMR (CDCI3)(TMS) ô: 1.74 (s, 3H); 2.90 (s, IH); 3.879 (d, 3H, 1=6.64 Hz); 5.84
(s, 1H); 6.86-7.13 (m, 3H) ppm. 19p NMR (CDCI3/pyridine)(CFCI3) ô: -80.38 (s) ppm.
MS mIt. 236 (M+), 197, 167, 151, 124. 110, 69, 51. Anal. Calcd for C1oH1IF303: C,
50.85; H, 4.69; F, 24.13. Found: C, 50.91; H, 4.68; F, 24.19.96% yield.
IH NMR (CDCI3)(TMS) ô: 1.73 (s, 3H); 2.54 (s, IH); 3.879 (d, 6H, J= 10.26 Hz); 6.78
(s, 2H); 7.22 (s, 1H) ppm. 19F NMR (CDCI3/pyridine)(CFCI3) ô: -80.28 (s) ppm. MS
mIt. 266 (M+), 227, 197, 181, 155, 123, 93, 69. Anal. Calcd for CIIH13F304: C,49.63;
H, 4.92; F, 21.41. Found: C, 49.69; H, 4.85; F, 21.35. 95% yield.
IH NMR (CDCh)(TMS) ô: 1.73 (s, 3H); 2.72 (s, IH); 3.841 (d, 6H, J=2.16 Hz); 6.825
(d, IH, 1=8.48 Hz); 7.03-7.11 (m, 2H) ppm. 19F NMR (CDCI3/pyridine)(CFCI3) ô: 80.42 (s) ppm. MS mIt. 250 (M+), 211, 181, 139, 124, 107, 95, 77. Anal. Calcd for
CIlH13F303: C, 52.80; H, 5.24; F, 22.78. Found: C, 52.85; H, 5.28; F, 22.80. 95%
yield.
IH NMR (CDCI])(TMS) 8: 2.93 (s, IH); 7.34-7.38 (m, 6H); 7.47-7.52 (m, 48) ppm.
19F NMR (CnCI]/pyridine)(CFCI]) ô: -73.39 (s) ppm. MS mlz 252 (M+), 233, 213, 183,
165, 127. 105, 77. Anal. Calcd for CIlH13F303: C, 66.67; H, 4.40; F, 22.60. Found: C,
66.71; H, 4.32; F ,22 .66. 94% yield.
188

•7. lU NMR(CDCI3)(TMS) 8: 3.22 (s, IH); 3.84 (5,68); 6.87-7.03 (m, 4H); 7.03-7.47 (m,
4H) ppm. 19F NMR (CDCI3/pyridine)(CFCI3) 8: -73.76 (s) ppm. MS mlz 312 (M+), 273,
243, 212, 168, 135, 108, 77. Anal. Calcd for CIJlISF303: C, 61.54; H, 4.84; F, 18.25.
Found: C, 61.56; H, 4.88; F, 18.17.96% yield.
8. IR NMR (CDCI3)(TMS) 8: 2.60 (s, IH); 4.989 (q, IH, J=6.60 Hz); 7.38-7.48 (m, SR)
ppm. 19F NMR (CDCI3/pyridine)(CFCI]) 8: -78.680 (d, JF.H=6.1 Hz) ppm. MS mlz 176(M+), 159, 127, 107, 89, 79, 51. Anal. Calcd for CSH7F30: C, 54.55; H, 4.01; F,
32.36. Found: C, 54.58 H, 3.99; F, 32.40. 97% yield.
9. IH NMR (Acetone-D6)(TMS) cS: 5.073 (q, 1H, 1=7.34 Hz); 5.30-6.30 (s, b, IH); 6.658
(m, 2H); 7.359 (m, 2H); 7.80-8.90 (s, b, IH) ppm. 19): NMR (c;D60)(CFCI3) cS: -77.745
(d, JF•H=6.1 Hz) ppm. 19F NMR (CDCI3/pyridine)(CFCI]) ô: -77.901 (d, JF-H=6.1 Hz)
ppm. MS mlz (silylated) 336 (M+), 267, 249, 225, 197, 195, 151. Anal. Calcd for
CsH,F30 2: C, 50.01; H, 3.67; F, 29.66. Found: C, 50.12; H, 3.71; F, 29.72. 98% yield.
10. IH NMR (Acetone-D6)(TMS) ô: 2.997 (s, b, IH); 4.997 (m, IH); 5.560 (m, IH);
6.834(m, 2R); 7.976 (s, b, IH); 8.035 (S, b, IH).ppm. 19p NMR (c;060)(CFCI3) ô:
77.587 (d, JF•H=7.5 Hz) ppm. 19F NMR(CDCI3/pyridine)(CFCI3) ô: -77.691 (d, JF•H=8.0
Hz) ppm. MS mlz (silylated) 424 (M+), 409, 383, 356, 352, 283, 247. Anal. Calcd for
CsH7F30 3: C, 46.17; H, 3.39; F, 27.38. Found: C, 46.25; H, 3.41; F. 27.37.97% yield.
11. IH NMR (CDCI3)(TMS) ô: 2.59 (s, IH); 3.89 (s, 3H); 4.925 (q. IH, J=6.78 Hz); 5.72
(s, IH); 6.947 (d, 3H, J= 13.93 Hz) ppm. 19F NMR (CDCI3/pyridine)(CFCI3) ô: -77.756
(d, JF•H=8.0 Hz) ppm. MS mlz 222 (M+), 205, 183, 153, 125, 93, 65, 51. Anal. Calcd
for CgH9F30 3: C, 48.66; H, 4.08; F, 25.65. Found: C, 48.70; H, 4.11; F. 25.69. 95%
yield.
12. IH NMR (CDCI3)(TMS) ô: 2.18 (s, 1H); 3.85 (s, 6H); 4.924 (q, IH, 1=6.58 Hz); 6.68
(s, 2H) ppm. 19p NMR (CDCI3/pyridine)(CFCI3) 8: -77.633 (d, JF•H=8 Hz) ppm. MS mlz252 (M+), 205, 183, 167, 155, 140, 123, 95. Anal. Calcd for C 1JlIIF30 4 : C, 47.63; H,
4.40; F, 22.60. Found: C, 47.62; H, 4.42; F, 22.58. 98% yield.
13. IH NMR (CDC13)(TMS) ô: 2.50 (s, IH); 3.87 (s, 6H); 4.943 (q. IH, J=6.64 Hz); 6.841
(t, IH, J=4.88 Hz); 6.976 (d, 2H, 1=3.42 Hz) ppm. 13C NMR (CDCI3)(TMS) cS: 55.73;
72.65 (q,Jc•CF =32.1 Hz); 110.19; 110.91; 120.29; 124.30 (q,Jc.cF =281.7 Hz); 126.44,
149.13; 149.99. 13C NMR (DMSO) ô: 24.05; 70.37 (q, Jc.F=30.2 Hz); 114.89; 115.06;
118.85; 124.20 (q, Jc.CF=282.3 Hz); 126.59; 144.95; 145.79. 19F NMR
• 1~

•
•
14.
15.
16.
17.
18.
19.
(CDCI3/pyridine)(CFCI3) ô: -77.756 (d, I F•H=7.5 Hz) ppm. MS mlz236 (M+), 219,197,
167, 139, 124, 108, 96. Anal. Calcd for CloHllF30]: C, 50.85; H, 4.69; F, 24.13 .
Found: C, 50.92; H, 4.66; F, 24.11. 99% yield.
IH NMR (CDCI3)(TMS) ô: 2.97 (s, IH); 4.58-4.66 (m, IH); 6.20 (q, IH, 1=9.46 Hz);
6.842 (d, IH,I=15.93 Hz); 7.31-7.44 (m, 5H) ppm. 19F NMR(CDCI]/pyridine)(CFCI3)
6: -78.229 (d, JF•H =7.5 Hz) ppm. MS mlz 202 (M+), 184, 165, 133, 115,91, 77, 55.
Anal. Calcd for CloH~30: C, 59.41; H, 4.49; F, 28.19. Found: C, 59.45; H, 4.52; F,
28.17. 99% yield.
IH NMR (CDCI3)(TMS) ô: 2.25 (s, IH); 3.84 (s, 3H); 4.531 (t, IH, J= 13.19 Hz); 5.65
(s, 1H); 5.961 (q, 1H, J=9.12 Hz ); 6.689 (d, IH, 1= 15.73 Hz); 6.82-6.88 (m, 3H)
ppm. 19p NMR (CDCllpyridine)(CFCI3) 6: -78.241 (d, JF•H =6.1 Hz) ppm. MS mlz 248
(M+), 219, 199, 179, 161, 147, 119, 91. Anal. Calcd for CIIHII F30 3: C, 53.23; H,
4.47; F, 22.96. Found: C, 53.28; H, 4.44; F, 22.97. 99% yield.
IH NMR (CDCI3) ô: 2.42 (br, 4H); 6.19 (s, 4H,); 6.27 (s, 4H,) ppm. IH NMR (DMSO)
6: 6.17 (s, 4H); 6.86 (s, 2H,) ppm. 13C NMR (DMSO) 6: 67.18 (q, Jc.CF=29.4 Hz);
124.77 (q, I C•F =286.4 Hz); 129.16. IJC NMR(Acetone-D6) ô: 68.70(q, J c.CF=30.3 Hz);
125.64 (q, I C•F=285.0 Hz); 130.26. 19p NMR (CDCIJ/pyridine)(CFCI3) ô: -79.80 (s,
major); -79.72 (s, minor) ppm. MS mlz 179 (M+ - CF), 159, 143, 110, 83, 69, 53.
Anal. Calcd for CaH,F60 z: C, 38.73; H, 2.44; F,.45.94. Found: C, 38.75; H, 2.49; F,
45.96. 96% yield.
IH NMR (CDCI3) 6: 2.02-2.03 (d, 3R, J= 1.16 Hz); 2.30 (br, 2H); 5.98-5.99 (d, IH,
J= 1.72 Hz); 6.24-6.25 (t, 2H, J=2.16 Hz) ppm. 19F NMR (CDC13/pyridine)(CFCI3) ô:
80.25 (s); -76.04 (s) ppm. MS mlz 193 (M+ - CFJ),. 173, 145, 124,69, 51. Anal. Calcd
for CJlaF602: C, 41.24; H, 3.08; F, 43.48. Found: C, 41.27; H, 3.15; F, 43.50. 95%
yield.
IH NMR (CDCI]) 6: 1.37-1.41 (d, 9R, J=8.60 Hz); 3.19-3.30 (d, 2H, J=21.23 Hz);
7.52-7.60 (m, 3H); 7.89-8.03 (m, 4R) ppm. 19f NMR (CDC13/pyridine)(CFCI3) 6: -77.85
(s); -77.69 (s) ppm. MS mlz 335 (M+ - CFJ), 320, 266, 251, 209, 181, 152, 112. Anal.
Calcd for ~laF602: C, 59.41; H, 4.49; F, 28.19. Found: C, 59.38; H, 4.46; F, 28.22.
94% yield.
IH NMR (CDCI) ô: 1.05 (s, 9H); 1.25 (s, 98); 2.45 (s, IH); 3.05 (s, IH); 5.19 (s, IH);
6.06 (s, IH) ppm.19F NMR (CDCh/pyridine)(CFCI3) ô: -68.78 (s); -74.86 (s) ppm. MS
190

•
•
20.
21.
22.
23.
mIl (silylated) 504 (M+ - CFJ), 489, 399, 379, 327, 285, 259, 239. Anal. Calal for
CIJlnF601: C, 53.33; H, 6.15; F, 31.63. Found: C, 53.40; H, 6.10; F, 31.59. 89%
yield.
IH NMR (CDCI3) 8: 4.75 (s, 2H); 7.25-7.34 (m, 28); 7.41-7.55 (m, 6H); 7.67-7.72 (t,
2H, J=7 .32 Hz) ppm. 19p NMR (CDCIJ/pyridine)(CFCI3) 8: -75.66 (s) ppm. MS mIl 175
(M+ -CsH6FJO), 152, 105, 77, 51. Anal. Calcd for C16HIZF602: C, 54.87; H, 3.45; F,
32.54. Found: C, 54.91; H, 3.50; F, 32.58. 98% yield.
IH NMR (CDC13)(TMS) 8: 3.63 (s, IH); 3.78 (s, 3H); 3.863 (d, 6H, J=5.40 Hz), 4.07
4.12 (m, 28); 4.449(t, IH, J= 1.80 Hz); 5.57 (s, IH); 6.692 (q, IH, J=3.60 Hz); 6.77
6.83 (m, 28); 6.865 (d, IH, J=5.10 Hz); 6.95-6.99 (m, 1H); 7.193 (d, IH, J=4.80
Hz); 7.294 (d, IH, J=1.2 Hz) ppm. 13C NMR (CDCll)(TMS) 8: 55.85; 56.04; 56.17;
61.36; 79.59 (q, Jc.CF=27.4 Hz); 82.64; 109.87; 110.48; 112.07; 118.25; 120.72;
121.66; 124.62; 124.97 (q, Je.F=286.59 Hz); 128.93; 146.18; 148.56; 148.89; 151.53
ppm. 19F NMR (CDCI3/pyridine)(CFCI3>8: -76.03 (s) ppm. MS mil. (silylated) 402 (M+),
302, 278, 248, 235, 221, 181, 165. Anal. Calcd for CIJlZIF306: C, 56.72; H, 5.26; F,
14.16. Found: Ct 56.74; H, 5.29; F, 14.22. 95% yield.
IR NMR (CDCI3)(TMS) 8: 3.84 (s, 3H); 3.87 (s, 3H); 3.90 (s, 3H), 3.93 (d, IH, J=3
Hz); 4.24 (d, IH, J= 12 Hz); 4.640 (d, IH, J= 12 Hz); 5.865 (d, IH, J=3 Hz); 6.84
7.12 (m, 68) ppm. IlC NMR (CDCI3)(TMS) 8: 56.11; 56.19; 56.64; 71.68; 75.62 (q,
Je.f =28.65 Hz); 108.78; 110.06; 111.44; 113.40; 120.41; 121.80; 122.95; 125.60 (q,
Je.f =286.59 Hz); 127.88; 147.37; 148.68; 149.16; 149.95 ppm. 19F NMR
(CDC13/pyridine)(CFCh) 8: -76.57 (s) ppm. MS mlz 372 (M+), 303, 248, 235,217, 189,
180. Anal. Calcd for ClsHI9F30S: C, 58.06; H, 5.14; F, 15.31. Found: C, 58.21; H,
5.20; F, 15.29. 96% yield.
IH NMR (CDC13)(TMS) 8: 2.25 (s, 38); 3.75 (s, IR); 3.79 (s, 38), 3.88 (s, 3H); 3.935
(d, IH, J=9 Hz); 4.12 (d, IH, J=5.99 Hz); 4.33 (s, IH); 5.60 (s, IH,); 5.70 (s, IH);
6.55-6.64 (m, 3H); 6.94 (d, 1H, J=5.40 Hz); 7.10 (d, IH, J=4.80 Hz); 7.311 (d, IH,
J=1 Hz) ppm. IJC NMR (CDCh)(TMS) 6: 21.19; 55.88; 55.93; 61.31; 79.85 (q, Je.
CF=28.9 Hz); 82.64; 109.59; 112.95; 113.93; 118.43; 121.01; 122.19; 125.07 (q, Je.
F=286.59 Hz); 128.71; 134.83; 143.81; 145.62; 146.35; 151.36 ppm. 19p NMR
(CDCI3/pyridine)(CFCh) 8: -75.93 (s) ppm. MS mIl (silylated) 618 (M+), 480,451,411.
365, 343, 323, 271. Anal. Calcd for C19H11F306: Ct 56.72; H, 5.26; F, 14.16. Found:
C, 56.78; Ht 5.19; F, 14.18.93% yield.
191

•
•
6.2.1.3.2. Cbaracterization of TriOuorometbylated Lignins
1. Dioxane Ugain:
19F NMR (CDCh/pyridine)(CFCh) 0: -67.71 ta -67.79 (m); -72.70 ta -72.99 (h); -74.23(s); -74.54 (s); -75.20 (h); -75.83 (s); -76.87 ta -77.11 (h); -77.78 (d, JHF= 6.6 Hz);
-78.21 ta -78.26 (h); -78.78 (d, JHF = 7.0 Hz); -82.66 (s); -84.25 (d, l HF = 5.2 Hz) ppm.
2. Kraft Opin:
19p NMR(CDClipyridine)(CFCh) 8: -73.78 (s); -74.29 (s); -74.48 (s); -74.92 (s); -76.06
(s); -76.40 (s); -77.61 (h); -77.78 (d, JF.H=6.6 Hz); -79.14 (d, JF•H=6.6 Hz); -79.24 (d,
l F.H=7.1 Hz); -83.42 (s); -84.22 (d, JF.H= 4.2 Hz) ppm.
3. Suerolin aeid hydrolysis:
J9p NMR (CDCI3/pyridine)(CFCI3) ô: -74.28 (s); -75.77 (s); -75.81 (s); -76.53 (h);
-76.64 (s); -77.65 (d, JF•H=6.6 Hz); -77.76 (d, JF•H=7.5 Hz); -77.89 (d, JF•H= 7.0 Hz);
-79.13 (d, JF•H=6.6 Hz); -84.32 (s); -85.35 (h) ppm.
4. Aleell Organo~lv:
19F NMR (CDCI3/pyridine)(CFCh) 0: -66.19 (s); -66.23 (s); -72.84 (s); -73.20 (h);
-73.65 (s); -74.27 (s); -74.81 (t, lF-H=13.2 Hz); -75.81 (s); -76.37 (h); -77.29 (d, JF•
H=7.5 Hz); ..77.35 (h); -77.46 (b); -77.54 (b); -77.65 (d, JF•H=7.1 Hz); -77.04 (h);
-77.75 (s); -77.76 (s); -7S.13 ta -78.23 (h); -78.63 (s); -84.32 (s) ppm.
5. Steam Explosion lignin:
19p NMR (CDCllpyridine)(CFCI3) ô: -72.84 (s); -73.65 (s); -74.27 (s); -75.81 (s); -76.37
(h); -77.16 (d, JF.H=4.2 Hz); -77.29 (d, JF-H=7.5 Hz); -77.32 (h); -77.54 (b); -77.64 (d,
JF.H=8.0 Hz); -77.75 (d, lF-H=7.1 Hz); -78.18 (h); -78.28 (d, JI=-H=6.6 Hz); -78.63 (s);
-78.76 (h); -79.13 (b); -79.22 (d, l F•H=3.8 Hz); -84.32 (s) ppm.
6. Straw Lignin:
'9F NMR (CDCI3/pyridine)(CFCh) ô: -67.67 (h); -74.26 (s); -75.15 (h); -75.80 (s);
-76.52 (h); -76.64 (s); -77.04 (h); -77.25 (s); -77.69 (h); -78.19 (s); ..79.05 (s); -79.15
(s); -83.27 (h); -83.95 (h); -84.39 (s) ppm.
192
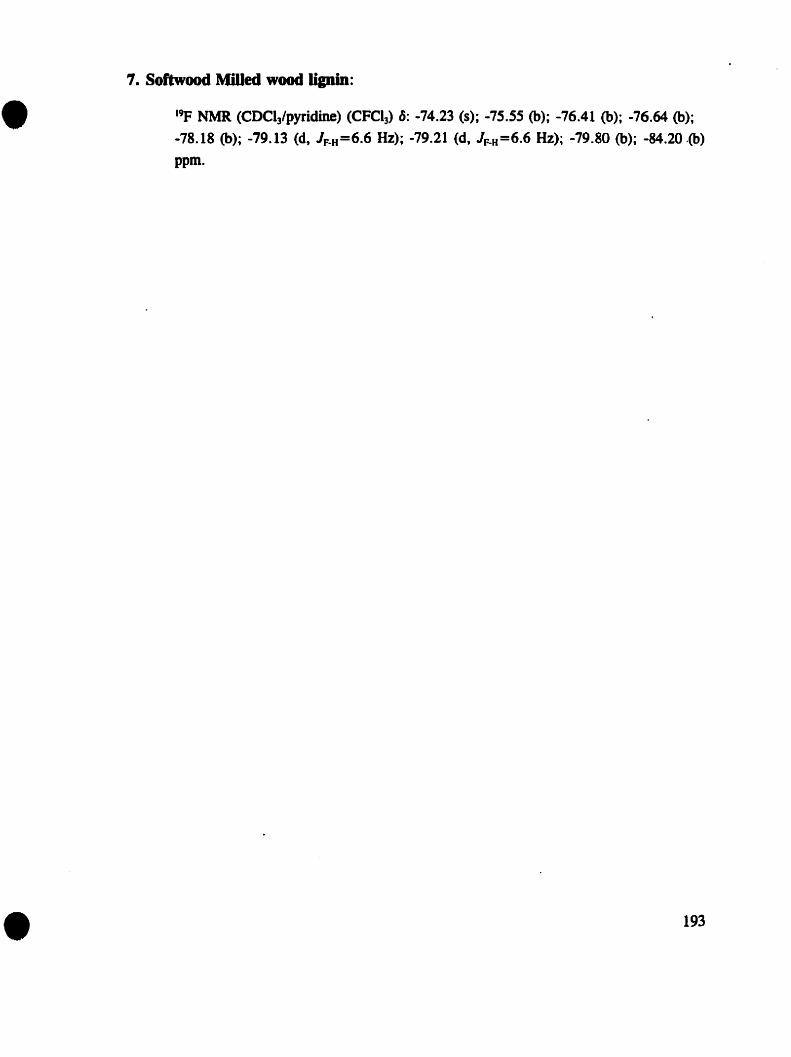
•
•
7. Softwood MiUed wood Ugain:
19f NMR (CDC13/pyridine) (CFC13) ô: -74.23 (s); -75.55 (b); -76.41 (b); -76.64 (b);
-78.18 (b); -79.13 (dt JF-H=6.6 Hz); -79.21 (d, JF_H =6.6 Hz); -79.80 (b); -84.20.(b)
ppm.
193

•6.3. RESULTS and DISCUSSION
The detailed chemical reactions used to quantitatively tritluoromethylate the
carbonyl groups (including quinones) that are present in lignin are shQwn in Figure 6.1.
The precise tritluoromethylation conditions used for Iignins were devel0Ped from an
understanding of the reaction details for various model compounds55•
o C~ C~
~8-R' + .eJ8I-CF, ~~ ~b-R 4O%tF.. ~b-R~ ~l C~N ~I
R - R - 011••3 R - OH
o
oo
TMAF..TtF
•
Figure 6.1. Trifluoromethylation of carbonyl-containing (including quinones) lignin-likemodel compounds.
The acquisitions of the 19p NMR spectra for all trifluoromethylated lignins were
carried out in a mixture of CnC13 and pyridine 1: 1.6 (v/v), due to the relative low
solubility of lignins in common organic solvents. The particular choice of cnel]
/pyridine (1:1.6 v/v) was made based on our previous work which requires to acquire
31p NMR spectra of phosphitylated Iignins45-48. For this reason all 19p chemical shift
values for tritluoromethylated carbonyl-containing Hgnin model compounds were
recorded in cncl]/Pyl, (Tables 6.1 - 6.4).
A closer examination of these data shows that the 19p NMR signais of
tritluoromethylated ketones for Hgnin end-groups range between -80.28 to -80.42 ppm
(upfield from CFCI3), while those ofdimeric uoits are confmed between -73.39 to -76.57
ppm. Tritluoromethylated derivatives of cinnamic-like aldehydes appeared between
1 DMF and DMSO were Dot suitable.
194
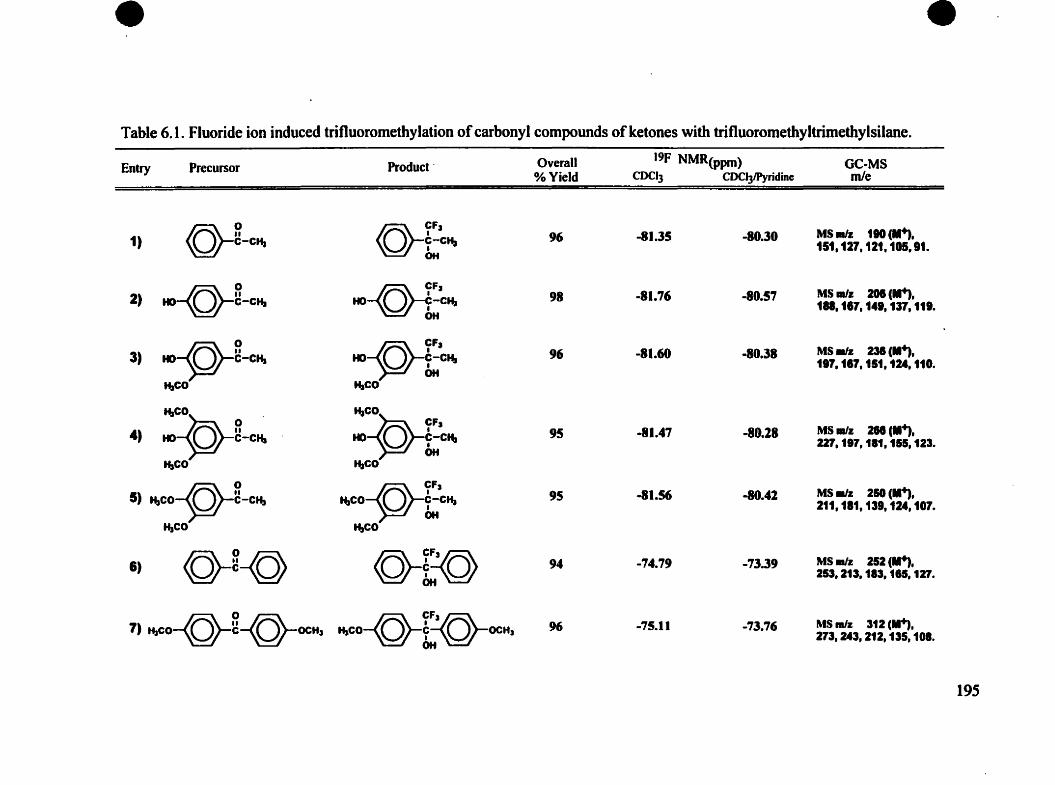
• •Table 6.1. Fluoride ion induced trifluoromethylation ofcarbonyl compounds ofketones with trifluoromethyltrimethylsilane.
Entry Precursor Product· Overall 19F NMR(ppm) GC-MS% Yield CDC)3 CDCl3/Pyridinc mie
~-~ (Q}--Cf' 110("".1) o t c",96 -81.35 -80.30 MSra/z
151,127. 12t,105,9t.
~~-C~ -<Q)-Cf' 201(.....2) HO 0 tCt\98 -81.76 -80.57 MS Dtlz
111,117.141.137.111.
1Il~-C~ {»-Cf' 231(.....3) HO 0 tc~ 96 -81.60 -80.38 MS-.Jz117,117,151. 1U. ftO.
t\co t\CO
f\CO .
~*Cf'~~-C~ 2.. (.....4) HO 0 tCt\95 -81.47 -80.28 MS.,z
227.117,111.155.123.
f\CO f\CO
5) ~CO~-C~ {»-Cf' 250("".t\CO 0 tCt\ 95 -81.56 -80.42 MSraIz
211.111.131.124.107.
t\co t\CO
6) ~-<Q) (Q}--L~ 94 -74.79 -73.39 MSra/z 252(.....253,213.113,185,127.
7) H,CO-<Q)-~-<Q)-OCH' -<Q)-C:\Q>-H,CO 0 t 0 OCH, 96 -75.11 -73.76 MSra/z 312 (II"),273.243.212,135.101.
195

• •Table 6.2. Fluoride ion induced trifluoromethylation of carbonyl compounds ofaldehydes \\'ith trifluoromethyltrimethylsilane.
Entry Precursor Product Overall 19F NMR(ppm) GC-MS%Yield CDCI3 CDCl3/Pyridinc mie
(Q)-~-H (Q)-~F' 97 -78.848 -77.6&0 MSralz 171 (Ill"),8) C-H• (d,J'.H =6.1 Hz) (d, J'~H = 6.1 Hz) 151,127,107,11,79•OH
1Il-<Q)-~-H -<Q)-CF'9) t«) 0 tH 98 -77.745 (Aceloae-Qs) -77.901 MS mIz (Iilyblled) 331
(d, J'.H = 6.1 lb) (d, J'oB = 6.' Hz) (....., 287, 241, 225.117,151.
HO
~CF'lIl~tH10) III 0 tH 99 -77.587 (Aceloae-Qi) -77.691 MS m/z (Illyialed) 424(d, J'oB = 7.5 Hz) (d. J'oB = 8.0 Hz) (1lI"),409,3I3.351,213,247.
f\CO H,C-b-CF•1Il~~-H11)
t«) 0 tH 95 -78.981 -77.756 MSra/z 222(.",(d,J'.H =6.1 lb) (d, J'oH = 8.0 Hz) 205, 113, 153, 125, 93.
t\co~~CF'1Il*~-H12) HO 0 ~-H 98 -78.890 -77.633 MSmIz 252 (II"),
OH (d, J'.H = 6.1 Hz) (d,J'.H =8.0 Hz) 205,113,117,155,148.
t\co ""CO
IbCOi»-tH i»-CF'13) ",CO 0 ~-H 99 -78.916 -77.756 MSm/z 231(.",OH (d. J".H= 6.1 Hz) (d, J'oH = 7.S Hz) 219,117,117,131,124.
t\co ""CO
(Q)-c=C-~-H(Q)- CF.
14) o C:C-*-H 99 -79.458 -78.229 MSm/z 202(.",OH (d. J'oB = 6.1 Hz) (d.J'oH =7.5 Hz) 114,115,133,115,91.
~=C-~-H i»- CF.15) HO 0 c=c-tH 99 -79.607 -78.241 MS ralz 241(....,
(d,J'oH =6.1 Hz) (d, J'oH = 6.1 Ilz) 219.119,179,111,147.
t\co t\co 196

• •Table 6.3. Fluoride ion induced trifluoromethylation ofquinones with triOuoromethyltrimethylsilane.
Entry Precursor Product Overall 19F NMR(ppm) GC-MS% Yield COCl3 COCl31Pyridinc mie
0
F'~Qœ16) Q 96 l' {-80.75 16 {-79.72 (miBor) MS mJz 171 cr.Cf3 ).-80.81 -79.80 (m.jor) 15',143,110,13.61.
0 FJC "OR
a
F'~Qq~'. CHJ
17) 1 1 95 17 {-77.25 17 {-76.04 MS -'_ 113 cr.Cf3 )...81.21 -80.25 173.145.124.61.51•
"
0 FJC "'OR
$@18) 1 1 : t-IIulyI,. 1" ". 1 : 1.w,J 94 18 {-78.19 18 {-77.69 MS JJJIz 335 (.... Cf3 t.-78.61 ..78.85 320.218. 251. 201. tlt.
a FJC "'OR
0 OR
1....,1~1.w,J :C{R; ..CFJ19 {-69.S9 19 {-68.78 MS BIh. 504 (Iilylatld). Cr19) 1 89
t-butyl A ..... t-butyl -7S.87 -74.86 • Cf3 )...... 311. 371, 327, 215.
20) (Q)-~j-<Q)ROFJ~ ~ CFJ
ft,: :~~.c-~~ 98 20 {-73.SS 20 {-75.66 MS .-Jz 175cr.CaHlF30).
152, 105, 77, 51.
197

•Table 6.4. Fluoride ion induced trifluoromethylation ofcarbonyl groups with trifluoromethyltrimethylsilane.
Overall 19F NMR (ppm) GC-MSEntry Precursor Product % Yield CDCI3 CDCL3jPyridinc mie
•
H H• 1
H-C-OH H-C-OH
H+O~ H-~-O-~
~ ooH, HO~'ooH'21) o OCH,OCH,
OCHJ OCH,
H H
H~-o-)O> H:-~-o;9c=o
HO~'F'ooH'~ ooH.22) 0,
OCHs OCHJOCH, OC''',
95
96
-75.53
-77.63
-76.03
-76.57
Ms.. (liIy.a.cd) 402,(M+), 302, 271, 241, 235, 221.
MI raJz 372, (M+), 303, 241,235,217,11'.
H1
trC-OH
H-~-O=Ô-Cc=o ~ Ha
23) ~ ooH,
OH OCHJ
H1
trcr0;,p-H1 CHaH-f-O
HO,ACF'ooH.
~ooH'OH
93 -75.48 -75.93 M. ralz (tilyla'ed) 111,(~,4IO,451,411.315,343.
198

•
•
...78.23 to -78.24 ppm, while benzaldehyde analogues occupied the range from -77.63 to
77.90 ppm. The latter signais appeared as doublets due to the coupling of fluorine to the
adjacent proton present on the trifluoromethylated carbon, with coupling constants
ranging between 6.1 to 8.0 ars.The 19p NMR chemica1 shifts of tritluoromethylated ortho and para-quinones were
spread over a wide range and their position was found to he sensitive to steric effects.
The 19p NMR spectra of trifluoromethylated ortho-quinone model compound showed two
signais at -68.8 and -74.9 ppm while the signais of trifluoromethylated para-quinone
model compounds ranged from -76.0 to -80.2 ppm (upfield from CFCI3).
Figure 6.2-6.4 show the 19p NMR spectra for a variety of tritluoromethylated
lignin samples; namely: black spruce milled wood lignin, residual kraft Iignin, Sucrolin,
A1cell organosolv, steam explosion lignin from yellow poplar and milled straw lignine
Apparently, these spectra contain a number of 19p NMR signals that spread over 20 ppm
with a number of common signais for alilignins.
To ensure that the tritluoromethylation reaction was selectively carried out on the
carbonyl groups in Iignin, 19p NMR spectra of Iignin samples before and after reduction
with sodium borohydride, were acquired. As anticipated the 19F NMR spectra of the
reduced and trifluoromethylated lignins showed no signais (Figure 6.S).
6.3.1. Signal Assigmnent
Initial attempts aimed at structural elucidation of several tritluoromethylated
carbonyl...containing moieties in Iignins were flrst carried out by comparing their 19p
NMRchemical sbifts to the various tritluoromethylated lignin-model compounds. The 19p
NMR spectral analyses of different fluorinated lignins displayed a numerous weil
resolved sharp signaIs ranging from -64 to -87 ppm, corresponding exactly to the region
of various tritluoromethylated lignin model compounds, allowing for some tentative
signal assignments. These assignments were tentative because the 19p NMR chemical
shifts of trifluoromethylated quinones were found ta occupy a wide range, overlapping
with those of ketones55• As such, complete signal identification could not he carried out
based solely on model compound chemical shift information.
199

•
J
i ii i l' 'ii ii i" 1ii i"'" 'l" l'l' iii1ii' '1 'i' il'"'ii' ii i ii"l' ii 'l' 'l' ii iii li' "l'" 'i' ii 'l' "'l" ii i li' 'l' 'l' i 'i" ii .ii i ii li I,i;' ii li'1i 'i' i i'i 'I,i, '1-60 -62 -6. -66 -68 -70 -72 -74 -76 -78 -80 -82 -84 -86 PP.
Figure 6.2. Quantitative 19p NMR spectra of steam explosion yellow poplar (top) andblack spruce milled wood (bottom) lignins.
• 200

•
"i i Ji iii'iiiii i,i'i ''''l'''' l'i"1 ii "1 'i' 'l' 'i' 'l'"i'i' '1;"'1""1""1""1 iii 'i"" ii' ii l'" il" ,'l' 'ii" "'l" "'ii'IP'''' 'Ii li"~ 1'1 '" '1 il. ii
-60 -62 -6" -66 -68 -70 -72 -7" -76 -78 -80 -82 -84 -86 PP'"
•Figure 6.3. Quantitative 19p NMR spectra of Sucrolin (top) and milled straw (bottom)
lignins.
201

•
1• l
i " , 1i , i i 1i , i , 1i i i i i i , i '1 i i i i i i' i il' i i'1i" i 1i 'i' i i'"Iii i i i i i i il i i' 'i , i , i 1i i il i i" , i i i i 'i' i" Iii" i il , 'i' ",i il i'1i i i' i i'" 1i, i i i 'i" l' ,, i 'i' i' l' i" i
-60 -62 -64 -66 -68 -70 -72 -704 -76 -78 ·80 -82 -e~ -86
•r: t: A
.Li!f,i.&i.\; V.'T.n...__~':~_.:•._ t9~ ~T'.rn ~~_.~ _1: __.. : ........ 1 l,... /:. 1.,.._,\ _'!"......rI_. _A_-'~_~_!l_."'w"iiU.Uii.& ....~ ... - •.• ~••.A.-~ ~t'''''''''.'''' v.. .. ...;u~w..& &~""i."' \",vyj --
organosolv (bottom) Iignins.
202

•
'" il"" ii' "l" 'i i'" il i i i' l' 'i' i'i i i,'"'l'" 'i i'" Iii' 'Iii" i"" i'" ,i i' i , l" , 'l' ,,,i'" il' i ,i i 1i i i f j i" i i' "l' '" i" i il' 'i ,i i" ,1i' i i i"" i" i il-60 -62 -6~ ..66 -68 -70 -72 -7~ -76 ..78 -80 -82 -84 -86 pp.
Figure 6.5. 19F NMR spectra of trifluoromethylated kraft lignin before (top) and after(bottom) reduction of carbonyls by sodium borohydride.
• 203

•
•
The presence of different aldehydes in trifluoromethylated lignins were detected
on the basis of their 19f NMR chemical shifts and coupling constants (JF•..). The 19p
NMR spectral analyses of trifluoromethylalted aldehydes showed tbat their signaIs were
spread over two regions i.e. from -77.6 to -77.9 ppm and from -78.8 to -79.1 ppm.
These regions were assigned to benzoic and cinnamic-aldehyde type structures
respectively. However, the absence of the characteristic aldehydic doublets signais from
the 19p NMR spectra of some lignins could he due to signal overlap.
Further clarification of signal assignments was attempted by acquiring two
dimensionaI 19F-13C heteronuclear NMR experiments in anticipation of 1JC NMR signal
splitting by fluorine nuclei. This is because the IJe NMR spectra for a number of
trifluoromethylated model compounds showed distinct signais with appreciably different
J-coupling constants. More sPecifically, the 13C NMR chemical shifts for CF3 groups
(quartet) apPeared between 123 to 126 ppm, with a IJ C-F coupling constant of about 285
Hz. Furthermore, a long range 2} C-F coupling constant was found to he about 30 Hz,
confmed (quartet) between 68 to 80 ppm, allowing for the differentiation of the ketonic
from the quinonic signals.
Table 6.5. Carbon-13 NMR chemical shifts and coupling constants of sornetrifluoromethylated model compounds.
Compounds C-13 NMRS (ppm) J C-F (Hz)
CF3 C..CF3 1J 2J
Dîmer p..O-4 (21) 125.1 79.6 285 26Dîmer (3-0-4 (22) 125.1 79.8 285 27Dîmer P.0-4 (23) 125.5 75.6 285 47p-hydroxyacetophenone (2) 130.8 74.5 290 293,4'·dimethoxybenzaldehyde(13) 124.1 72.6 282 32p-benzoquinone (16) 123.0 68.7 285 30
204

•
•
Figure 6.6. 19F_13C coupling CODStants for different classes of carbonyl groups.
In an effort ta select a suitable set of parameters that would coyer a11 possible 19p_
13C long range eoupling constants that may be encountered in lignin, several HMQC
(Heteronuclear Multiple Quantum Correlation) experiments were conducted on different
carbonyl-eontaining lignin madel compounds. These studies revealed that, during an
HMQC experiment, minor variations in the selected J-coupling constants could have
serious implications on cross Peak intensity. For example, Figure 6.7 (A-D) shows
HMQC spectra oftrifluoromethylated 3,4'-dimethoxybenzaldehyde (13) withJ-values 28,
30, 32 and 282 Hz. The cross Peak at -72.25 & 73.70 ppm (Figure 6.7 signal 1) is our
target signal. However, by varying the J-value, another cross peak at -72.37 & 130.9
ppm (Figure 6.7 B, C, D signal D) was apparent as ~ result of an isotope shift effect due
to the 13c_19p iQteraction. This is not surprising since isotopie substitution causes changes
in shielding effects: for instance, 19p NMR chemical shift of CF3I is shielded by 0.149
ppm more for the 13CF3I isotopomer than in 12CF3158. This signal, however, was easily
distinguished from the primary correlation since it was confined in the -CF3 I3C chemical
shift region, and in addition it was sligbtly shifted (about 0.1 ppm) from the parent 19p
peak. Nevertbeless, isotope shift effects in HMQC spectra of trifluoromethylated lignins
could increase the complexity of signal assignment. Being aware of such potential
problems, a number oftrifluoromethylated Iignins were subjected to HMQC experiments.
The accumulated spectral data, however, despite the long acquisition limes (24 hours),
were inconclusive due ta the low carbonyl contents of lignins that gave low signal to
noise ratios.
205
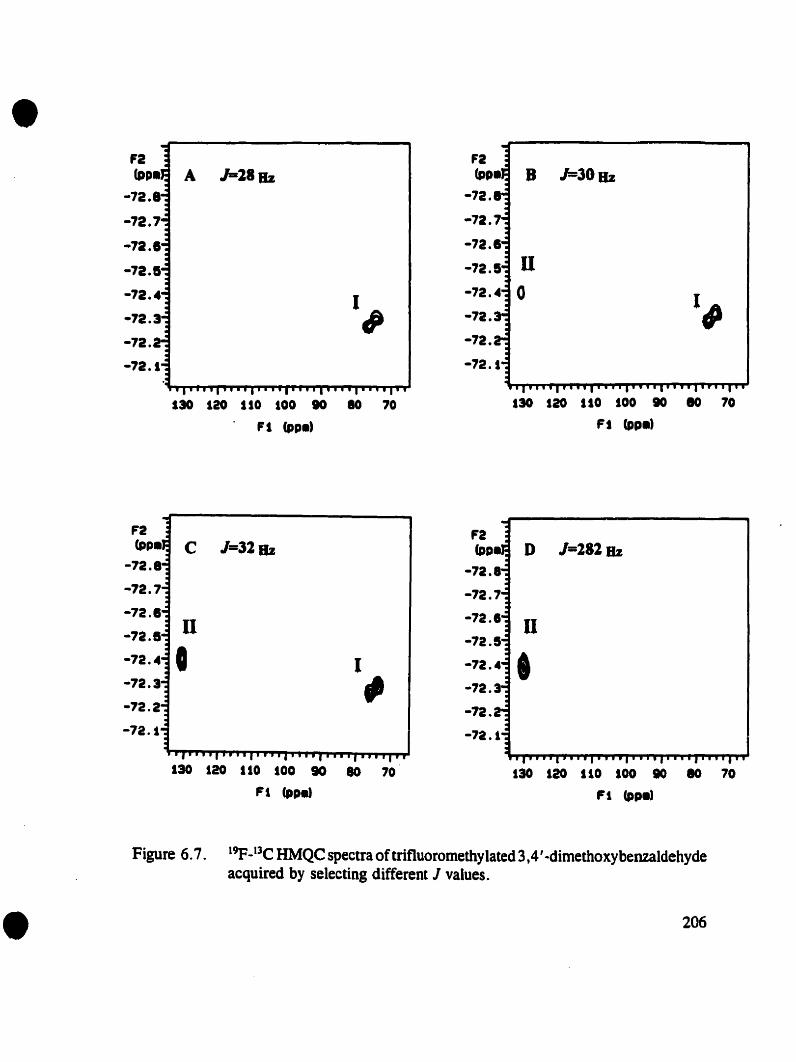
•B 1=30BzA J=28Bz
S30 120 1SO 100 10 10 70
FI (PP.»
130 S20 1SO 100 10 10 70
Ft (PP.)
130 120 110 100 90 80 70 .
FI (PP.)
D J=282Bz
u
130 120 S10 100 10 10 70
FI (pp.)
1,C J=32Bz
Il
o
•Figure 6.7. 19p_13c HMQC spectra oftritluoromethylated3,4'-dimethoxybenzaldehyde
acquired by selecting different J values.
206

•
•
Sïnce 2D NMR was of limited utility toward aiding the 19p NMR signal
assignments for tritluoromethylated lignins, our attention was focused to the application
of selective chemical derivatization techniques. In particular two different reactions were
considered, namely; the Dakin oxidation59• tiO and sodium hydrosulphite reduction61-63.
The Dakin reaction bas been shown to cause the selective oxidation of various
carbonyl groups present in ligninstiO. More specifically, a-carbonyl groups are known to
be oxidized to para-quinones when a frec hydroxyl group is present para to the side
chain. In contrast, when the phenolic group is etherified the system is totally unreactive.
Funhennore, a,n-unsaturated aldehydes react with a1kaline hydrogen peroxide with the
formation of the corresponding benzaldehydes and benzoic acids, while non-phenolic
benzaldehydes are converted directly to the corresponding benzoic acids.
Therefore, a lignin sample subjected to the Dakin reaction should be enriched in
para-quinones and depleted of aldehydes and a-carbonyls that hear free phenolic
hydroxyl groups. The total concentration of etherified a-carbonyl structures, however,
should remain the 3ame before and after the Dakin reaction.
Sodium bydrosulphite is a mild reducing agent that has been reported61-63 to
selectively reduce quinones in the presence of aldehydes or ketones. In an effort to select
the proper set of reaction conditions suitable for conducting such selective reductions on
lignins a series of exploratory experiments were carried out. Furthermore, these
experiments were also aimed at confmning that cinnamic and benzoic aldehydes as weil
as model a-ketones would not he reduced by sodium hydrosulphite. More specifically,
di-ten-butyl-o-quinone, p-quinone, acetovanillone and syringaldehyde were reduced by
sodium hydrosulphite. Both 0- and p-quinones were found to he reduced quantitatively
to their corresponding alcohol in 15 minutes, while acetovanillone and syringaldehyde
were not affected even after a 4 hour reaction. Nevertheless, the reduction of lignin with
sodium hydrosulphite was complete within one hour.
Figure 6.8 shows the 19p NMR spectra of trifluoromethylated samples of residual
dioxane lignin (A), after Dakin oxidation (B) and after sodium hydrosulphite reduction
(C). ÛU ÛlC UiI:lilS uÎ ÛlC abuvc ae,;..,;ounls, cuupic:û with the accumuiateâ chemicai soift
data bank of Tables 6.1-6.4, a number ofmajorcarbonyl signais are tentatively assigned.
207

•
laie...." St.adard
o-Quiaoaes•
A
œ-e.rboaylsp.o-4 Lipia Dimen
p-QuiaoaesAldebydes
A
0-, p-Quiaoaes.,
1•
Keloaes..
a.-carboayl iaaoa-etberified
f CH:arboDyl inf elberified
B
cl"~ 'l" li i li li1l" il' .1'1' ii' li' ii l" "l'" '1 ' li' il' ii ii ii ii'" 'l'"'i""I' Iii i ii' 'l' ii» ,ii"i" "Ii' 'ii»"iii'iii""'" Iii 'Ji 'il"~ 'l' 'Iii"'" "i'i
-60 -12 -1" -e6 -el -70 -72 -7. -71 -7. -10 -12 -1" -81 001
•19p NMR spectra of trifluoromethylated dioxane lignin (A), after Dakinreaction (B) and reduction (C) with sodium hydrosulphite.
208

•
•
The comparison of 19p NMR spectral analyses of trifluoromethylated dioxane
lignin showed a number of prominent signais that were significantly affected by the
Dakin and sodium hydrosulfite reactioDS. For example, the intensity of signais located
at -67.7, -73.0 and -78.2 ppm in the original spectrum of the dioxane lignin [Figure 6.8
(A)] were reduced almost completely [Figure 6.8 (C)] after their reaction with sodium
hydrosulfite. Therefore, these signais were assigned to 0- andp-quinones o~ the basis in
chemistry known to occur between sodium hydrosulfite and quinones.
Another important signal, centred at -7~.5 ppm, which appeared consistently in
ail the different trifluoromethylated Iignin samples (Figure 6.2-6.4) was also identified.
This signal which was assumed to represent a-carbonyl containing (3-0-4 structures or
quinones (Tables 6.4) was found to he drastically reduced after Dakin oxidation, while
it remained unaffected upon treatment with sodium hydrosulfite (Figure 6.8). As 5Och,
this signal was assigned to he due exclusively to a-carbonyl groups of {j-O-4 units
bearing a free phenolic hydroxyl group para to the side-chain.
The fine structural elucidation for a number of signaIs located at -75 to -79 ppm
(Figure 6.8) was restricted since various trifluoromethylated carbonyl signais in Iignin
panially overlap in this region. For instance, the 19p NMR signais of aldehydes, quinones
and also a-carbonyls could he ail found in this region.
The last set of 19p NMR signaIs in trifluoromethylated lignio spectra located
between -82 to -85 ppm (Figure 6.8) were assigned to different unhindered ketones. The
comparison with model compound data (Table 6.1) allowed the assignments of two
different classes of ketones in this region. The signal that was not affected by the Dakin
oxidation appeared at -84.2 ppm was assigned as being due to the a-carbonyl of
etherified lignin end-groups. However, the signal at -82.7 ppm was found to he seriously
reduced by Dakin oxidation. This signal was assigned to the ketonic structures bearing
a free phenolic hydroxyl group in the para position of the aromatic ring such as 5-5'
biphenyl or 4-0-5' units. Traces of acetone used to wash and dry the glassware was
found to give rise to the signal at -82.15 ppm. Therefore, the sensitivity of this technique
dictates that when ac~tvüe i5 ü5ed fûr cleaning purpûses ~hùulù oe;: ûluruughiy n:llloved.
209

•
•
6.3.2. Quantitative evaluation of the carbonyl groups in Ugnins
The quantification of the total amount ofcarbonyl groups in lignin was carried out
by using 3,3'-bis(tritluoromethyl)benzophenone as an internai standard. This compound
had all the characteristics of a reliable internai standard required for accurate
measurements: it is a pure crystalline soUd possessing two equivalent CF3 groups giving
a sharp signal at -62.511 ppm. Its position is in the proximity of the lignin signaIs, so
as ta allow the use of a narrow sweep width during spectral acquisition, and al the same
time does not overlap with any of the lignin signais allowing for precise integrations. The
use of this internai standard permined the quantitative detennination of all carbonyl
groups present in all examined lignins. This was made possible because adequate delay
time between pulses was used (10 sec). This selection was based on detailed
measurements of the 19p spin-lanice relaxation times for trifluoromethylated lignins and
the internai standard. As anticipated, the longest Tl' was found to he that of the internai
standard.
Table 6.6. Quantitative analyses ofcarbonyl groups in severallignins by using F-19NMR spectroscopy.
Lignin sample COfC9 W.t.% M.W. (glmol)
x s x s
Sucrolin AcidHydrolysis (Bagasse) 0.12 ± 0.01 0.0097 1.89 ± 0.2 0.15 177.4
Alcell Organosolv(Mixed Hardwoods) 0.11 ± 0.01 0.0086 1.56 ± 0.2 0.13 178.5
Steam Explosion(Yellow Poplar) 0.13 ± 0.01 0.010 1.57± 0.2 0.18 194.8
Dioxane Acidolysis 0.15 ± 0.01 0.0095 2.27:l: 0.2 0.15 189.4
Kraft Residual* 2.90:l: 0.2
Straw 0.018 :l: 0.005 0.0011 0.25 :l: 0.05 0.012 21)1.1
i =Mean values =Standard deviation• The amount ofCO/C9 is Rot reponed since the C9 unit can not be defined
210

Funhermore. in an effon to examine the reproducibility and quantitative reliability
of our measurements, severai native and technical lignins were selected and their
carbonyl contents were determined after tritluoromethylation. The total carbonyl content
for each lignin sample was detennined four times and the calculated Mean values and
standard deviations are shown in Table 6.6. Notably, the total amount of carbonyls
determined by 19p NMR were found to he different from sample to sample with high
precision. A funher investigation aimed at substantiating the present technique as an
analytical tool for the quantification of the various carbonyl groups in different soluble
lignins was conducted. In panicular the quantitative derivatization of carbonyls by
tritluoromethylation was examined by selecting Ugnin samples whose carbonyl content
were exarnined by IWo different techniques i.e. oximation and UV spectroscopy during
the 1991 International Round Robin efforf6' 57. It was thus possible to compare the results
fumished by quantitative 19J=-NMR with those produced by independent methods in other
laboratories for the same samples as presented in Table 6.7.
Table 6.7. Detennination of total amount ofcarbonyl groups in Iignins by differenttechniques.
Lignin sample Detection method M.W. (g/mol) Formula
F-19 NMR Oximation UV-VIS·
Sucrolin AcidHydrolysis(Bagasse) 0.12:0.01 O.l2±0.12 0.03±N.R. 177.4 C9HS.302.2(OCH3>O.S3
Alcell Organosolv(Mixed Hardwoods) 0.11: 0.01 0.10 ± 0.0 0.11 ± N.R. 178.5 C9H7.701.9(OCH3)1.04
Steam Explosion(Yellow Poplar) 0.13: 0.01 0.11:t: 0.04 0.09:t: N.R. 194.8 C9H7.S02.S(OCH»1.25
• Reduction with sodium borohydride followed by UV-VIS (standard deviation was not reported - N.R.).
The proximity of the two sets of data in. Table 6.7 qualifies the 19f NMR
technique as a novel and promising analytical tool for detecting and detennining the most
prominent carbonyl-containing groups present in different sûluble lignins.
211

•
•
6.4. CONCLUSIONS
The quantitative trifluoromethylation of carbonyl groups in sorne technical and
native lignins was examined. These studies demonstrated that such a technique can he
applied for the detection and quantitative determination of the various carbonyi groups
present in lignins. By applying a set of selective reactions onto a sample of lignin Le.
borohydride and hydrosulphite reductions and Dakin oxidation it became possible to
assign a number of prominent 19p NMR signais in trifluoromethylated lignins. The actual
quantification of the total amount of carbonyls can he carried out using 3,3'
bis(trifluoromethyl)benzophenone as an internaI standard. The total amount of carbonyls
detennined by the proposed technique in a variety of samples was found to he different
from one another and yet close to reponed values using independant techniques. The
proximity of these data for three lignin samples qualifies the 19p NMR technique as a new
analytical tool for detecting and determining carbonyl groups in lignins.
212
6.S. REFERENCES
• 1. Harkin, J. M:, Lignin-A Datural polymerie product of phenol oxidation., ln: Thechemistry of phenolic resins; the formation, structure and reactions, of phenolicresins and related products., John Wiley & Sons, New York, Chapter 6., pp.243-312, 1956.
2. Jansherkar, H., Fiechter, A., Lignin: biosynthesis, application, andbiodegradation., Advances in Biochemical EngineeringlBiotechnology., 27, 119178, 1983.
3. Glasser, W. G., Kelley, S. S., Light stability of polymers., J. Pulp and paperCan., 8, 795-851, 1987.
4. Argyropoulos, D. S., Menachem, S. B., Lignin., Advances in BiochemicalEngineering/Biotecbnology., 57, 127-158, 1997.
5. Adler, B., Elimer, L., ConiferylaldehydgropPen im Holz und in isolierten Ligninpraparaten., Acta Chem. Scand., 2, 839-840, 1948.
6. Adler, B., Marton, 1., Zur Kenntnis der CarbonylgrupPen im Lignin. 1., ActaChem. Scand., 13, 75-96, 1959.
7. Marton, J., Adler, E., Carbonyl groups in lignin m. Mild catalytic hydrogenationof Bjôrkman lignin., Acta Chem. Scand., 15, 370-383, 1961.
8. Gierer, J., and SOderberg, S., Über die Carbonylgruppen des Lignins., ActaChem. Scand., 13, 127-137, 1959.
9. Geiger, H., Fuggerer, H., Über den Chemismus der Wiesener-Reaktion aufLignin. Z. Naturforsch., 34, 1471-1472, 1979.
10. Lin, S. Y., Denee, C. W., Methods in Lignin Chemistry., Springer Series inWood Science., Springer-Verlag Berlin Heidelberg., Chapter 7.4., pp. 446-457,1992.
Il. Sarkanen, K. V., Ludwig., C. H., ln Lignins: occurrence, formation, structureand reactions., Wiley-Interscience, John Wiley & Sons, Ine., New York, London,Sydney, Toronto, 1971.
12. Hon, D. N. S., and Glasser, W., On possible chromophore stnlctures in woodand pulps-a survey of the present state of knowledge., Polym. Piast. Technol.Eng., 12, 157-159, 1979.
• 213

•13. I..ebo, S. B., Lonsky, W. F., McDonough, T. J., Medvecz, P. J., Dimmel, D.
R. , The occurrence of light-induced formation of ortho-quinonoid ligninstructures in white sproce rermer mechanical pulp., J. Pulp and Pap. Sei., 16, S,139-143, 1990.
14. Bronow, G., Eriksson, B., a-carbonyl groups as sensitizers in the photodehydrogenation of phenolic structures in Iignin., Acta Chem. Scand., 25, 27792781, 1971.
15. Argyropoulos, D. S., Heitner, C. and Morin, F. G., 31p NMR spectroscopy inwood chemistry. Part m. SoUd state 31p NMR of trimethyl phosphite derivativesof chromophores in mechanical pulp., Holzforschung, 46, 211-218, 1994.
16. Argyropoulos, D. S., Heitner, C., 31p NMR spectroscopy in' wood chemistry. PartVI. Solid state 31p NMR of trimethyl phosphite derivatives of chromophores andcarboxcylic acids present in mecbanical pulps: A method for the determination ofortho-quinones., Holzforschung SuppL, 48, 112-116, 1994.
17. Lin, S. Y. and Kringstad, K. P. , Some reactions in the photoinduceddiscoloration of Iignin., Norsk. Skiksind., 25, 252-256, 1971.
18. Forsskâhl, 1., Tylli, H., Olkkonen, C. and Janson, J., Photochemistry ofquinones and hydroquinones on solid matrices., Int. Symp. of Wood and PulpingChemistry, ·Melbourne Australia, 2, 325-332, 1991.
19. Castellan, A., Nourmamode, A., Jeager, C. and Forsskàhl, 1., Photochemistryof Iignocellulosic materials., Eds. Heitner, C. and Scaiano, J. C., ACS Symp.Ser., 531, pp. 60-76, 1993.
20. Gellersted, G. and Pattersson, E. L., Light-induced oxidation of Iignin. Pan2.The oxidative degradation of aromatic rings, Svensk. Papperstidn., 77, 15-21,1977.
21. Green, J. W., Determination of carbonyl group. In: Whistler, R. L, (ed) Methodsin carbohydrates Chem., Vol. m. Ac~demic Press, New York, 49-54, 1963.
22. Lindberg, B., Misiomy, A., Quantitative analysis of reducible carbohydrates bymeans of sodium borohydride., Svensk. Papperstidn., 55, 13-14, 1952.
23. Lindberg, B., Theander, O., Quantitative detennination of carbonyl groups inoxycellulose by means of sodium borohydride., Svensk. Papperstidn., 57, 83-85,1954.
24. Heuser, E., .~"'1alytik von Chinonen., In: Müller E., Bayer, O., Meerwein H.,
• 214
•
•
25.
26.
27.
28.
29.
30.
31.
32.
33.
34.
35.
36.
Ziegler, K., (eds) Methoden der organiseben Chemie (Houben-Weyl) 4. Aufl.,Bd n Analytisehe Methoden. George Tbieme, Stuttgan, Federal Republie ofGermany, 434-472, 1953.
Miyake, M., Kraft cooking with addition of redueing agents. m. Effect of yieldincrease by hydrazine or hydroxylamine and its meehanism., J. Jap. Tappi, 24,(2), 74-80, 1970.
Zakis, G. F., "Functional analysis of Iignins and their derivatives", Tappi press,Riga, Latvia, Tappi, pp. 61-76, 1994.
Kolboe, S., and Ellefsen, O., Infrared investigations of Iignin; A discussion ofsorne reeent results., Tappi, 45(2), 163-166, 1962.
Faix, O., Classification of lignins from different botanical origins by FTIRspectroscopy, Holzforschung Suppl., 45, 21-27, 1991.
Hergert, H., Inrared spectra. In: Lignins-Occurrence, Formation, Stmcture andReaction, Eds. K. Sarkanen and C. Ludwig, Wiley Interscience, New York, pp.267-297, 1971.
Marton, J., Adler, E., and Persson, K. I., Carbonyl groups in lignin IV*.Infrared absorption studies and examination of the volumetric borohydridemethod**., Acta Cbem. Scand., 15(2), 384-392, 1961.
Hortling, B., Tamminen, T., and Kentti, E., Determination ofcarboxyl and nooconjugated carbonyl groups in dissolved and residuallignins by IR spectroscopy.,Holzforschung, 51, 405-410, 1997.
Argyropoulos, D. S., 3lp NMR in Wood Chemistry, A review of reeentprogress., Research on chemical intennediates., 21, No. 3-5, pp. 373-395, 1995.
Lundquist, K., NMR studies of lignins. 2. Interpretation of the IH NMR spectrumof acetylated brich lignin., Acta. Chem. Seand., B33, 27-30. 1979.
Lundquist, K., NMR studies of lignins. 3. IH NMR spectroscopie data for Iigninmodel compounds., Acta. Chem. Scand., B33, 418-420, 1979.
Lundquist, K., NMR studies of Iignins. 4. Investigation of spruee Iignin by lUNMR spectroscopy., Acta. Chem. Scand., B34, 21-26, 1980.
Lapierre, C., Monties, B., Guittet, E., Lallemand, J. Y., Quantitativemeasurements inhardwood iignin t~c NivlRspectra., Holzforschuog, 39,367-368,1984.
215

•37. Robert, D., Brunow, G., Quantitative estimation of hydroxyl groups in milled
wood Iignin from spruce and in a dehydrogenation polymer from coniferyl alcoholusing 13C NMR spectroscopy., Holzforschung, 38, 85-90, 1984.
38. Obst, J. R., Landucci, L. L., Quantitative 13C NMR of lignins. Methoxyl: arylratio., Holzforschung SuppL, 40, 87-92, 1986.
39. Pan., X., and Lachenal, D., Structure and reactivity of spmce mechanical pulplignins IV: 13C_NMR spectral studies of isolated lignins., J. Wood Chem.Technol., 14(4), 483-506, 1994.
40. Brezny, R., and Schraml, J., Silicon-29 NMR spectral studies of kraft Iignin andrelated model compounds., Holzforschung, 41, 293-298, 1987.
41. Nieminen, O. J., Pulkkinen, E., and Rahkamaa, E., Detennination of hydroxylgroups in kraft pine lignin by Silicon..29 NMR spectroscopy., Holzforschung, 43,303-307, 1989.
42. Archipov, Y., Argyropoulos, D. S., Bolker, H. I. and Heitner, C., 31p NMRspectroscopy in wood chemistry. Part l, Model compounds., J. Wood Chem.TechnoL, 11(2), 137-157, 1991.
43. Archipov, Y., Argyropoulos, D. S., Bolker, H. I. and Heitner, C., 31p NMRspectroscopy in wood chemistry. Pan n, Phosphite derivatives ofcarbohydrates., Carbohydrate Research, 220, 49-61, 1991.
44. ArgyroPOulos, D. S., Archipov, Y., Bolker, H. 1. and Heitner, C., 31p NMRspectroscopy in wood chemistry. Part IV, Lignin models: Spin-Iattice relaxationtimes and solvent effects in 31p NMR, Holzforschung, 47, 50-56, 1992.
45. Argyropoulos, D. S., Bolker, H. 1., Heitner, C. and Archipov, Y., 31p NMRspectroscopy in wood chemistry. Part V, Qualitative analysis of lignin functionalgroups., J. Wood Chem. TechnoL, 13(2), 187..212, 1993.
46. Argyropoulos, D. S., Quantitative phospborus-31 NMR analysis of lignins, Anew tool for the lignin chemist., J. 'Nood Chem. Technol., 14(1), 45-63, 1994.
47. Argyropoulos, D. S., Quantitative phosphorus-31 NMR analysis of six solublelignins., J. Wood Chem. Technol., 14(1), 65-82, 1994.
48. Fillppov, V., Archipov, Y., Argyropoulos, D. S., 4,4,5,5-tetramethyl-l,3,2dioxaphospholanyl chloride-derivatization reagent for lignin functional groupanalysis materials., 7th Int. Conf. Young Scientists, Riga, Latvia, 1991.
• 216

•49. Manatt, S. L., Characterization of functional groups by nuclear magnetic
resonance. I. Classification of alcohols from the fluorine-19 spectra oftritluoroacetates., J. Am. Chem. Soc., 88(6), 1323-1324, 1966.
50. Barrelle, M., Improvements in the structural investigation of lignins by 19p NMRspectroscopy., J. Wood Chem. Technol., 15(2), 179-188, 1995.
SI. Argyropoulos, D. S., Heitner, C. and Schmidt, J. A., Observation of quinonoidgroups during the light-induced yellowing of softwood mechanical pulp., Res.Chem. Intermed., 9, No. 3-5, pp. 263-274, 1995.
52. Barrelle, M., A new method for the quantitative 19f NMR spectroscopie analysisof hydroxyl groups in lignins., Holzforschung, 47, 261-267, 1993.
53. Lachenal, D., Fernandes, J. C., and Froment, P., Behaviour of residual iigninin kraft pulp during bleaching., J. Pulp and Pape ScL, 21, 173-177, 1995.
54. Ahvazi, B. C., and Argyropoulos, D. S., Quantitative tritluoromethyIation ofcarbonyl-containing lignin model compounds., J. Fluor:ne Chem., 78, 195-198,1996.
55. Ahvazi, B. C., and Argyropoulos, D. S., '9F Nuclear magnetic resonancespectroscopy for the eIucidation of carbonyl groups in lignins: Part 1. Modelcompounds., J. Agric. Food Chem., 44, 8, 2167-2175, 1996.
56. Andersons, B., and Faix O., CarbonyI group determination of lignins., 8thInternational Symposium on Wood and Pulping Chemistry., Helsinki, Finland.,Vol. l, 559-566, June 6-9, 1995.
57. Milne, T. A., Chum, H. L., Agblevor, F., and Johnson, D. K., Standardizedanalytical methods., Biomass and Bioenergy, 2, 341-366, 1992.
58. Harris, R. K., Nuclear magnetic resonance spectroscopy; A Physiochemicalview., The Universities Press (Belfast) Ltd., Pitman eds., Chap. 8, p. 189, 1983.
59. Bailey, C. W., and Denee, C. W., Reactions of alkaline hydrogen peroxide withsoftwood lignin model compounds, spruce milled-groundwood lignin and sprucegroundwood., Tappi, 52(3), 491-500, 1969.
60. Reeves, R. H., and Pearl, I. A., Reaction products fonned upon the aIkalineperoxide oxidation of lignin-related model compounds., Tappi, 48(2), 121-125,1965.
61. Rabjohn, N., Organic Syntheses: Collective Volume IV., A revised edition of
• 217

•annual volumes 30-39, John Wiley & Sons, IDe., New York, London, pp. 13-18,1963.
62. Fieser, F., and Fieser, M., Reagents for organie synthesis., John Wiley & Sons,Ine., New York, London, Sydney, pp. 1080-1082, 1967.
63. Gmndmann, C., Chinone: p-Chïnone der Benzol-und Naphthalin-Reihe., In:Methoden der Organischen Chemie., Ed. by Müller, E., Houben-Weyl., GeorgThieme Verlag Stuttgart., Vol. VII/3a., pp. 648-650, 1977.
• 218

•
•
Original Contributions to Knowledge and Ideas for Continued Researcb
Wood is a unique organic material. It is unique in virtually every one of its
properties and characteristics: its strength-to-weight ratio, its machinability, its warmth
and beauty, its chemical malee-up, its insulating properties, its anisotropy, and its great
variability. There is no other material embodying ail of these properties in a single
complex.
While there exists a great accumulation of information about wood properties-
physical, mechanical, chemical--and a substantial body of knowledge is available on its
cellular structure, still there are many gaps to he filled. Advancement depends in part on
understanding the molecular origins of macroscopic behaviour; It is here nuclear
magnetic resonance spectroscopy techniques malee notable contributions to comprehend
the various physico-chemical properties of wood structure.
The work carried out during this effort contributes in the development and
application of solid-state and solution NMR spectroscopic techniques, revealing fine
structural details of lignin when exposed to a range of pH's and pulping processes.
1. The solid-state proton spin-Iattice relaxation measurements for carbohydrates
and lignin over a wide range of pH's were examined. These studies indicated
that ionization of various functional groups can influence the mobility of these
biopolymers and consequently their physico-chemical propenies. The analyses
of the T lH data showed that as the pH increased from acidic to near neutrality
(2 -. 6), the T1H values of carbohydrates and lignin increased, reaching a
maximum at pH 6. However, as the pH changed from near neutrality toward
alkalinity (6 ... 13), the T lH values decreased, promoting the softening of
these biopolymers under alkaline conditions. Further studies aimed at a better
understanding of the ultrastructure of wood and the architectural association
of lignin with carbohydrates can be canied out by evaluating the prolon spin
lattice relaxation times (TtH) of several isolated samples of black spruce
softwood as a function of degree of delignification.
21~

•
•
2. The pseudo-fmt order rate kinetics for the stereoselective degradation of
arylglycerol-~-arylether linkages present in softwood milled wood Iignin
were investigated by using quantitative 31P NMR spectroscopy. The erythro
and threo fonns of (J-aryl ethers units were measured quantitatively by 31p
spectroscopy as a function of time and temperature. The activation energy of
the erythro isomer was found to he always lower than its counterpart for bath
the initial and the bulk phases of delignification. The stereoselectivity of bath
arylglycerol-(J-aryl ether isomers and the stability of the threo over their
erythro counterparts can be further investigated by enzymatic degradation of
these structural units in lignine This will he followed by quantitative 31p NMR
spectral analyses aimed at revealing more information on this issue.
3. By using quantitative 31p NMR spectroscopy it is possible to identify, quantify
and follow the formation of pbenolic hydroxyl groups that belong to
dipbenylmethane uoits under kraft and soda pulping conditions. Data derived
during the course of this work implied that diphenylmethanes are fonned in
higher quantities during conventional pulping as opposed to its EMCC·
counterpart, at the same kappa number. Further studies may involve the
kinetic investigation for the fonnation of overall condensed structures and
particularly diphenylmethane units in milled wood lignin under homogeneous
kraft pulping conditions. This will provide vital information on the magnitude
of their activation energies. indicating on how and to what extent the
formation of condensed structures hamper the rate of delignification
processes.
4. The quantitative trifluoromethylation of carbonyl groups for a series of
carbonyl-containing lignin-like model compounds has been accomplished by
using trifluorotrimethylsilane (Ruppen's reageot) in the presence of TMAF.
This reagent was found to he an efficient nucleophilic tritluoromethylating
220

•
•
agent for derivatizing a variety of carbonyl-containing compounds that may
have been present in Iignin. This was followed by studying the 19p NMR
cbemical shifts of fluorine containing derivatives.
s. The quantitative trifluoromethylation of carbonyl groups in some technical
and native Iignins was a1so examined. These studies demonstrated that such
a technique can he applied for the detection and quantitative determination of
the various carbonyl groups present in Iignins. The actual quantification of
the total amount of carbonyls was canied out using 3,3'
bis(trifluoromethyl)benzophenone as an internai standard qualifying this
technique as a new analytical tool for detecting and determining carbonyl
groups in Iignins. Further investigation may be carried out by
trifluoromethylating more carbonyl-containing Iignin-like model compounds
(Le. o-quinones, dimeric model compounds) followed by recording their 19F
NMR chemical shifts. EXPerimentation with various organic solvents other
than THF aimed at dissolving a greater variety of Iignin samples can also he
carried out.
221
Recommended