CONSOLIDATED FINANCIAL STATEMENTSNintendo Co., Ltd. and Consolidated Subsidiaries
April 26, 2007Nintendo Co., Ltd. 11-1 Kamitoba hokotate-cho,Minami-ku, Kyoto 601-8501Japan
FINANCIAL HIGHLIGHTS
1. Consolidated results for the years ended March 31, 2006 and 2007(1) Consolidated operating results (Amounts below one million are rounded down)
Net sales Operating income Income before income taxes and extraordinary items Net income
million yen % million yen % million yen % million yen % Year ended March 31, 2007Year ended March 31, 2006
Net income per share Return on equity
yen % % % Year ended March 31, 2007Year ended March 31, 2006
(2) Consolidated financial position
Total assets Net assets Capital adequacyratio
Net assets pershare
million yen million yen % yen As of March 31, 2007As of March 31, 2006
(3) Consolidated cash flowsCash and cash
equivalents - endingmillion yen million yen million yen million yen
Year ended March 31, 2007Year ended March 31, 2006
2. Cash dividendsDividend per share
Interim Year-end Annualyen yen yen million yen % %
Year ended Mar. 2006Year ended Mar. 2007Year ending Mar. 2008
(forecast)
3. Forecast for the fiscal year ending March 2008 (April 1, 2007 - March 31, 2008)
million yen % million yen % million yen % million yen % yen
Six months ending Sept. 2007Year ending Mar. 2008
[Notes] *With respect to this forecast, please refer to pages 3 and 4 for the forward-looking conditions and other related matters.
Dividends in total(annual)
Dividend payout ratio(consolidated basis)
Dividends onnet assets
Net sales Operating income Income before income taxes and extraordinary items Net income Net income
per share
140.00
70.00
(208,807) 617,139
1,575,597 8,614.97 1,160,703
Cash flows frominvesting activities
Cash flows fromfinancing activities
46,382 (60,166) 274,634
1,102,018 69.9 974,091
688,737 (50,137)
7,613.79 83.9
(174,603)
Cash flows fromoperating activities
89.8 966,534509,249 (1.2)
1,362.61 762.28
150.2 226,02490,349 (19.0)
79.7 288,839160,759 10.6
77.2 174,29098,378 12.5
Operating incometo net sales
Income before income taxesand extraordinary items on
total assets
16.8 10.4
21.1 14.0
23.4 17.7
390.92 1,140,000 270,000 290,000 175,000 1,368.22
53.9 26.7 460,000 85,000 (8.0) 17.9 19.5 0.4 0.4
85,000 50,000 (10.2)
70.00 320.00 620.00
560.00
390.00 690.00
700.00
88,253 49,886 51.2
50.6
51.2
5.3 8.5
- 1 -

4. Others(1) Changes for important subsidiaries during the fiscal year ended March 31, 2007
Addition: Nintendo of Korea Co., Ltd.[Note] Please refer to "Company Group Information" at page 5 for details.
(2) Changes on the basis of consolidated financial statements preparation① Related to accounting standard revisions etc. Applicable② Other changes Not applicable[Note] Please refer to "Changes on the Basis of Consolidated Financial Statements Preparation" at page 12 for details.
(3) Outstanding shares (common shares)① Number of shares outstanding (including treasury stock)
As of Mar. 31, 2007 : 141,669,000 shares As of Mar. 31, 2006 : 141,669,000 shares② Number of treasury stock
As of Mar. 31, 2007 : 13,765,987 shares As of Mar. 31, 2006 : 13,754,896 shares③ Average number of shares
Year ended Mar. 31, 2007 : 127,908,919 shares Year ended Mar. 31, 2006 : 128,821,844 shares
(Reference) Non-consolidated results1. Non-consolidated results for the years ended March 31, 2006 and 2007(1) Non-consolidated operating results
Net sales Operating income Income before income taxes and extraordinary items Net income
million yen % million yen % million yen % million yen % Year ended March 31, 2007Year ended March 31, 2006
Net income per shareyen
Year ended March 31, 2007Year ended March 31, 2006
(2) Non-consolidated financial position
Total assets Net assets Capital adequacyratio
Net assets pershare
million yen million yen % yen As of March 31, 2007As of March 31, 2006 1,003,005 856,501 85.4 6,694.51
1,366,267 947,076 69.3 7,404.64
709.55 1,115.98
149,439 11.4 91,585 14.5 411,770 (7.1) 81,547 (18.1) 263,403 76.3 142,743 55.9 898,639 118.2 212,288 160.3
[Note]Forecasts announced by the Company referred to above were prepared based on management's assumptions with information
available at this time and therefore involve known and unknown risks and uncertainties.Please note such risks and uncertainties may cause the actual results to be materially different from the forecasts (earnings
forecast, dividend forecast, and other forecasts).
- 2 -

<Appendix> Nintendo Co., Ltd.(consolidated)
OPERATING RESULTS1. Analysis of Operations
(1) Fiscal year ended March 31, 2007Throughout the fiscal year ended March 31, 2007, the Japanese economy continued to show a pattern of recovery despite
concerns over crude oil price trends and rising interest rates. Intensified capital investments due to improvements incorporate earnings, as well as steady consumer spending led by improvements in employment, helped to support theJapanese economy. Looking overseas, in the U.S., the economy continued to show steady performance supported byfavorable consumer spending and capital investments despite early signs of an economic slowdown. As for the Europeaneconomy, the business environment showed indications of moderate improvement.
In the video game industry, the handheld market expansion reversed its long decline, while the console market wasapproaching to the stage of being reinvigorated with the launch of the new game machines by each hardware developer.
Under such circumstances, Nintendo continuously executed its strategy to expand gaming to the masses and made greatprogress in cultivating the female and senior demographics. Until now, these demographics have been less interested ingames, however, with the launch of “Nintendo DS” and its software lineup known as “Touch! Generations”, Nintendo hassuccessfully expanded the definition of video games in multiple software releases. In addition, Nintendo’s new console,“ Wii ” , provides intuitive operation and unprecedented playing style using the Wii remote, and is attracting expandedaudience demographics as well as conventional gamers following last year’ s launch, and consequently is gaining wide-spread popularity. The video game industry is now on a new growth path with strong performance in both “Nintendo DS”and “Wii”. In Japan, the overall game market is expanding.
Consolidated net sales for the fiscal year ended March 31, 2007 resulted in 966.5 billion yen, including overseas sales of643.0 billion yen, which accounted for 66.5% of total sales. Income before income taxes and extraordinary items was 288.8billion yen. Net income was 174.2 billion yen.
With respect to sales by business category within the electronic entertainment products division, “ Nintendo DS ” and“Nintendo DS Lite” sold a total of more than 23 million units worldwide during the fiscal year (40 million units life-to-date), resulting from continuous robust sales of “ Nintendo DS Lite ” after its March launch in Japan and strong salesfollowing its June release overseas. In addition, “Nintendo DS” software enjoyed a boost in sales. For instance, “New SuperMario Bros. ” , the side-scrolling action game with easy access and user-friendly operation, sold 9.5 million units on aworldwide basis, and “Brain Age: Train Your Brain in Minutes a Day!” , which was released overseas after achievingpopularity in Japan, has cultivated a new video game market of brain training overseas. “Brain Age” has sold a total of 8.08million units worldwide including its sequel version released in Japan (12 million units life-to-date). “ Nintendogs ”continued to enjoy favorable sales overseas, reaching a total of 6.95 million sales units (13.6 million units life-to-date).“Pokémon Diamond and Pearl”, the latest series of “Pokémon” launched last September in Japan, sold 5.21 million unitsand has yet to be released overseas. As a result, the number of new software titles and long-term selling titles has increased,generating a significant rise in handheld software sales in the fiscal year.
As for the console business, “Wii” hardware got off to a favorable start with sales of 5.84 million units within the first fivemonths after launch. “Wii” software, such as “The Legend of Zelda: Twilight Princess”, which allows the player to feel thevirtual world come alive by handling the Wii remote as swords or bows and arrows, and “Wii Sports”, which consists offive different games simulating real life sports sold extremely well. As a result, net sales in the electronic entertainmentproducts division were 964.3 billion yen, while sales in the other products division (playing cards, karuta, etc.) were 2.1billion yen.
With respect to results by geographic segment, sales in Japan were 898.7 billion yen including inter-segment sales of567.3 billion yen. Operating income was 212.2 billion yen. Sales in the Americas were 354.7 billion yen including inter-segment sales of 2.3 billion yen. Operating income was 14.3 billion yen. Sales in Europe were 266.1 billion yen. Operatingincome was 16.9 billion yen.
(2) Outlook for fiscal year ending March 31, 2008Nintendo will continue pursue expansion of the gaming population, with a diverse software lineup, and through expansion
of the definition of video games. Nintendo will offer brand new entertainment that takes root in our daily lives, as hasalready been achieved with “Touch! Generations” software series. As for “Nintendo DS”, by positioning it as “a machinethat enriches the owner’s daily lives”, Nintendo aims to accelerate the current sales momentum of “Nintendo DS” from“must-have for every family” to “must-have for everyone”. Nintendo also has positioned “Wii” as “a machine that putssmiles on surrounding people’s faces”. Specifically, Nintendo will not just enrich the applicable package software lineupfor “Wii” but will further intensify Wii’s “Channel” concept which already includes the abilities for the “Wii” owners tocreate their caricatures, view weather forecasts, news, and surf the web. “ Wii ” will encourage communication amongfamily members as each of them can feel something relevant to themselves and be motivated to turn on the power everydayin order to enjoy “the new life with ‘Wii’”.
With regard to consolidated performance forecasts for the fiscal year ending March 31, 2008, with anticipations of “Wii”,which contributes to operating performance for the full-year, and further growth of “Nintendo DS”, net sales are projectedto reach 1,140 billion yen, operating income 270 billion yen, income before income taxes and extraordinary items 290billion yen, net income 175 billion yen. Exchange rates used for the forecast are 115 yen per U.S. dollar and 150 yen perEuro. Foreign exchange loss of approximately 20 billion yen is estimated as the exchange rates for the forecast are set atyen-appreciated level as compared with the exchange rates as of the end of March 31, 2007, which are 118.05 yen per U.S.dollar and 157.33 yen per Euro.
- 3 -

<Appendix> Nintendo Co., Ltd.(consolidated)
2. Financial Positions
Cash flows from operating activities:
Cash flows from investing activities:
Cash flows from financing activities:
Cash flow index trend
% % % % %
[Notes] Capital adequacy ratio: Total owners' equity and valuation and translation adjustments divided by Total assets Capital adequacy ratio at market value: Total market value of stocks divided by Total assets *Percentage figures are calculated on a consolidated basis.
3. Basic Policy of Profit Distribution and Dividends
134.4
81.4
139.1
88.1
278.0
69.9
194.0
83.9
*Total market value of stocks is calculated by multiplying closing price and the number of shares outstanding (excluding treasury stock) at the end of the period.
As ofMarch 31, 2007
Capital adequacy ratio at market value
Capital adequacy ratio 82.0
118.8
As ofMarch 31, 2003
As ofMarch 31, 2004
As ofMarch 31, 2005
As ofMarch 31, 2006
Total assets increased overall by 414.8 billion yen compared to the previous fiscal year-end to 1,575.5 billion yen, due tostrong business results. Total liabilities increased by 287.1 billion yen compared to the previous fiscal year-end to 473.5billion yen mainly due to the increase in notes and trade accounts payable from purchasing materials. Net assets were1,102.0 billion yen mostly due to increases in retained earnings.
The ending balance of "Cash and cash equivalents" (collectively, Cash) as of March 31, 2007 increased by 71.5 billionyen compared to the previous fiscal year-end to 688.7 billion yen. Net increase (decrease) of Cash and contributing factorsduring the fiscal period ended March 31, 2007 are as follows.
Net cash from operating activities increased by 274.6 billion yen primarily due to increases in income before incometaxes and minority interests and notes and trade accounts payable.
Net cash from investing activities decreased by 174.6 billion yen mainly resulting from the decrease in time depositsexceeding the increase.
Net cash from financing activities decreased by 50.1 billion yen mainly due to payments for cash dividends.
It is the Company's basic policy to internally provide the capital necessary to fund future growth, including capitalinvestments, and to maintain a strong and liquid financial position in preparation for changes in the business environmentand intensified competition. As for direct profit returns to our shareholders, dividends are paid based on profit levelsachieved in each fiscal period.
The annual dividend per share will be established at the higher of the amount calculated by dividing 33% of consolidatedoperating income by the total number of outstanding shares, excluding treasury stock, as of the end of the fiscal yearrounded up to the 10 yen digit, and the amount calculated based on the 50% consolidated net income standard rounded upto the 10 yen digit.
As a result, the dividend for the fiscal year ended March 31, 2007 has been established at 690 yen (interim : 70 yen, year-end : 620 yen) and dividend for the fiscal year ending March 31, 2008 will be 700 yen (interim : 140 yen, year-end : 560yen) if earnings are in line with the financial forecast herein.
Retained earnings are maintained for effective use in research of new technology and development of new products,capital investments and securing materials, enhancement of selling power including advertisement, and common stockbuyback whenever deemed appropriate.
[Note] Forecasts announced by the Company referred to above were prepared based on management's assumptions withinformation available at this time and therefore involve known and unknown risks and uncertainties. Please note such risksand uncertainties may cause the actual results to be materially different from the forecasts (earnings forecast, dividendforecast, and other forecasts).
- 4 -

<Appendix> Nintendo Co., Ltd.
COMPANY GROUP INFORMATION
The trade name has been changed from "iKuni Inc." to "AiLive Inc." during the consolidated fiscal year ended March 31, 2007. The company listed below has been newly added to the Company group.
Relationship with the Company
MANAGEMENT POLICY
(Nintendo homepage)http://www.nintendo.co.jp/kessan/english.html
‐Purchasing
the Company'sproducts
Capital Majorbusiness
25,000millionKRW
100 1 5Distributionof electronic
entertainmentproducts
Businessrelationship
Nintendo ofKorea Co., Ltd.
SouthKorea ‐
AddressCompany'sname Leased
facilitiesThe Company'semployees
Financialsupport
Votingshare(%) The Company's
directors
Number of directors concurred by
Among Nintendo Co., Ltd. ("the Company") and its related companies, which are composed of the Company, twenty-onesubsidiaries, and eight affiliates as of March 31, 2007, the main business is manufacturing and distribution of electronicentertainment products.
Management policy is omitted since nothing significant has changed from the one set forth in the financial statementsannounced on October 26, 2006. Please refer to the following URL for further information.
- 5 -

<Appendix> Nintendo Co., Ltd.
CONSOLIDATED BALANCE SHEETS
Date
Description Amount % Amount % Amount
(Assets) million yen million yen million yen
Ⅰ Current assets1 Cash and deposits
2 Notes and trade accounts receivable
3 Securities
4 Inventories
5 Deferred income taxes
6 Other current assets
7 Allowance for doubtful accounts
Total current assets
Ⅱ Fixed assets1 Property, plant, and equipment
(1) Buildings and structures
(2) Machinery, equipment and automobiles
(3) Furniture and fixtures
(4) Land
(5) Construction in progressTotal property, plant, and equipment
2 Intangible fixed assets
(1) Software etc.Total intangible fixed assets
3 Investments and other assets
(1) Investments in securities
(2) Deferred income taxes
(3) Other investments and other assets
(4) Allowance for doubtful accountsTotal investments and other assets
Total fixed assets
Total assets
7.8
0.0 185
11.5 38,951
414,894
32,604 32,595 (8)
1,144 1,134 5,629
(9) 18,022 (815)
57,600 3.7 217
45,061 11,461 57,774 51,684
59,421
962,197
88.5
89,666 115,971 88,609 35,631
104,483
1,394,673 (1,886)
505
180,924
16,001
505
45,840 150,132
32,199
176
375,942 (372)
2,287
1,630
185
812,064 43,826 64,287 30,835 24,170
Increase(decrease)
(10)
14,414
122,818
819
92,412
37,134
4,099
16
As of March 31,2007
12.2
55,969
7.4
10,314
85,683 (26)
319 319 0.0
141,972
1,575,597 100.0 100.0 1,160,703
As of March 31, 2006
3,341
60,213
15,182
4.8 41
18,838
(1,514) 1,018,730 87.8
- 6 -

<Appendix> Nintendo Co., Ltd.
Date
Description Amount % Amount % Amountmillion yen million yen million yen
Ⅰ Current liabilities1 Notes and trade accounts payable2 Accrued income taxes3 Reserve for bonuses4 Other current liabilities
Total current liabilities
Ⅱ Non-current liabilities1 Non-current accounts payable
2
Total non-current liabilities
Total liabilities
Minority interests
Ⅰ Common stockⅡ Additional paid-in capitalⅢ Retained earningsⅣ Unrealized gains on other securitiesⅤ Translation adjustmentsⅥ Treasury stock
Total shareholders' equity
(Net assets)Ⅰ Owners' equity
1 Common stock2 Additional paid-in capital3 Retained earnings4 Treasury stock
Total owners' equityⅡ Valuation and translation adjustments
1 Unrealized gains on other securities
2 Translation adjustments
Ⅲ Minority interestsTotal net assetsTotal liabilities and net assets
-
- -
-
- -
-
15,331 Total valuation and translation adjustments
- -
-
Total liabilities, minority interests, and shareholders' equity 1,160,703 100.0 -
217,262
(155,112) 762
- -
-
-
-
-
Increase(decrease)
(Shareholders' equity)
974,091 - 83.9
- -
1,096,073
(13.4)
0.9 0.1
-
- -
69.0
- -
287,142
-
-
-
301,080 90,013 36,972
47 31,878 75,563
1,779
286,161
(163)
5,142 981
29.8
0.3
468,436
698
1,144
- -
16.1 30.1 473,578
- 0.9
-
-
0.0
- -
10,065 11,585
10,717
1.0 94.4
- - -
176
83,817 53,040
4,161
861
(Liabilities)
As of March 31,2007
As of March 31, 2006
(Minority interests)
1,732 43,684
4,443 3,299
15.7
0.4
Reserve for employees' retiremen and severance benefits
186,435
182,274
- - - -
- -
10,065 11,586
1,220,293 (155,396)
- 1,575,597 100.0
- - - - -
- -
1,086,549
8,898 6,432
- 138 0.0
1,102,018 69.9 -
0.9
- 7 -

<Appendix> Nintendo Co., Ltd.
CONSOLIDATED STATEMENTS OF INCOMEPeriod
Description
million yen % million yen % million yen %
Ⅰ Net salesⅡ Cost of sales
Gross margin
Ⅲ
Operating income
Ⅳ Other income1 Interest income
2 Foreign exchange gains
3 Other
Ⅴ Other expenses1 Sales discount
2 Other
Ⅵ Extraordinary gains1
2
3 Gains on sales of fixed assets
4
5
6
7
Ⅶ Extraordinary losses1 Losses on disposal of fixed assets
2
3
Prior year income taxes
Income taxes deferred
Minority interests
Net income
Provision for income taxes and enterprise taxes
Year endedMarch 31, 2006
Year endedMarch 31, 2007
Reversal of reserve for directors' retirement and severance benefits
Income before income taxes and minority interests
Unrealized losses on investments in securities
Losses on sales of investments in securities
Reversal of unrealized losses on investments in securities
Gains on sales of investments in securities
Gains on redemption of investments in securities
Gains on liquidation of affiliates
Selling, general, and administrative expenses
Income before income taxes and extraordinary items
Reversal of allowance for doubtful accounts
- - 2,379 0.3
(2,761)
52,333
(928) (56.3) 353
(1,047)
70.3
(233)
123,130
77.2
(7,504) 9
75,911
119.3
(627)
(19.8)
2,379 -
(1,408)
74.0
(5)
(1,236)
(82)
245
30
128,080 79.7
(5,877) (79.9)
1,217
528 108.3 497
(7,067) (10.0) 11,489
(19,774)
47,020
135,675
37.7
150.2
89.8 274,588 93.4
182,696 84.9
457,284
(6,292) (46)
98,378 19.3
(0.0) (1.2)
233
166,470 32.7
74,431 14.6
1,648 0.3 31
1,383
966
1,408
5
1,236
6
82
3,653
65
160,759 31.6
7,360 1.4
2,884
487 0.1 422
70,897 14.0 22,497 45,515
124,766
90,349 17.7
24.5
(13,796) (37)
174,290 18.0
(1.4) (0.0)
-
289,601 30.0
126,764 13.1
720 0.1 384 335
338
-
-
-
252
-
891
95
288,839 29.9
1,482 0.2
4,101
1,015 0.1 919
63,830 6.6 33,987 25,741
171,787 17.8
226,024 23.4
58.8
41.2
568,722 397,812
57.8 294,133 215,115 42.2
966,534
%
100.0 509,249 100.0
Amount %
Increase (decrease)
Amount % Amount
- 8 -

<Appendix> Nintendo Co., Ltd.
CONSOLIDATED STATEMENT OF SURPLUS
Period
Description
(Additional paid-in capital) million yen
Ⅰ Additional paid-in capital - Beginning
Ⅱ Increase1 Gains on disposal of treasury stock
Ⅲ Additional paid-in capital - Ending
(Retained earnings)
Ⅰ Retained earnings - Beginning
Ⅱ Increase1 Net income
Ⅲ Decrease1 Cash dividends2 Directors' bonuses
Ⅳ Retained earnings - Ending
35,139
11,585
98,378 98,378
Year endedMarch 31, 2006
Amount
1,096,073
1,032,834
11,584
0 0
170 34,969
- 9 -

<Appendix> Nintendo Co., Ltd.
CONSOLIDATED STATEMENT OF NET ASSETS
Year ended March 31, 2007 (April 1, 2006 - March 31, 2007)million yen
Owners' equity
Balance as of March 31, 2006Amount of changes in the fiscal year* Dividends from retained earnings
Dividends from retained earnings* Directors' bonuses
Net incomePurchase of treasury stockDisposal of treasury stock
Total amount of changes in the fiscal yearBalance as of March 31, 2007
million yen
Balance as of March 31, 2006Amount of changes in the fiscal year* Dividends from retained earnings
Dividends from retained earnings* Directors' bonuses
Net incomePurchase of treasury stockDisposal of treasury stock
Total amount of changes in the fiscal yearBalance as of March 31, 2007[Note] * Allocated at the annual general meeting of shareholders' held in June 2006.
123,937 1,086,549 (155,396)
(284) 1
(283)
- - -
174,290
-
- -
176
1 - -
-
Net amount of changes in the fiscal year other than owners' equity
Valuation and translation adjustments
Minority interests
Net amount of changes in the fiscal year other than owners' equity
- -
- 1 11,586
-
(1,819)
- - -
138
-
- - -
-
(37)
-
(37) 6,432
-
- - -
-
5,670
(40,932)
174,290 (284)
2
(185) (8,953)
-
- - -
(8,953) (40,932)
- (185) -
-
-
-
- - - -
-
Treasury stock Totalowners' equity
1,096,073 (155,112) 962,611
Common stock Additionalpaid-in capital
Retainedearnings
10,065 11,585
124,219 1,220,293 10,065
8,898
Unrealized gainson
other securities
Translationadjustments
(1,819)
10,717 762
5,670
- 10 -

<Appendix> Nintendo Co., Ltd.
CONSOLIDATED STATEMENTS OF CASH FLOWS
Period
Description Amount Amountmillion yen million yen
Ⅰ Cash flows from operating activities: Income before income taxes and minority interestsDepreciation and amortizationIncrease (decrease) in allowance for doubtful accounts
Interest and dividends income Interest expenses Foreign exchange losses (gains) Gains on sales of investments in securitiesUnrealized losses on investments in securities
Decrease (increase) in notes and trade accounts receivable Decrease (increase) in inventories Increase (decrease) in notes and trade accounts payable Increase (decrease) in consumption taxes payable Directors' bonuses paid Other, net
Interest and dividends received Interest paid Income taxes paid
Net cash provided by (used in) operating activities
Ⅱ Cash flows from investing activities:Increase in time deposits Decrease in time deposits Payments for acquisition of securities Proceeds from sales and redemption of securities Payments for acquisition of property, plant and equipment Proceeds from sales of property, plant and equipment Payments for investments in securities Proceeds from sales of investments in securities Payments for investments in affiliatesOther, net
Net cash provided by (used in) investing activities
Ⅲ Cash flows from financing activities:Payments for acquisition of treasury stock Cash dividends paid Other, net
Net cash provided by (used in) financing activities Ⅳ
Ⅴ Net increase (decrease) of cash and cash equivalentsⅥ Cash and cash equivalents - BeginningⅦ Cash and cash equivalents - Ending
(28,679) 198
(170) (1,262)
27,543
295,452 (35,989)
(74,853)
3,591 166,470
5,968 289,601
Year EndedMarch 31, 2006
Year EndedMarch 31, 2007
Sub-total32,921 23,237
97,999 338,037
Equity in losses (earnings) of non-consolidated subsidiary and affiliates
1,089
313
(267)
(1)
(42,687) (54,669)
9,140 21,554
Increase (decrease) in reserve for employees retirement and severance benefits
117,001
651,372 (112,957)
3,416 (185)
24,359
168,070
(96,324) (0)
0 (34,510)
(60,166) Effect of exchange rate changes on cash and cash equivalents
3 (34,943)
2 (49,857)
(798)
(42)
(511)
1,383 335 (3,653)
(46,577) (891)
(21,375)
(23,176) 1
46,382 274,634
(497,914) (776,866)
372 (4,139)
91 (6,144)
6,173 (52,069)
13,940 (9,172)
1,423 (174,603)
(1,485) - (42)
47,003 21,704 (50,137)
(208,807)
(25,227) (282)
792,727 (175,587)
617,139 688,737
71,597 617,139
- 11 -

<Appendix> Nintendo Co., Ltd.
1. Scope of Consolidation
(Changes in accounting policies)
(Accounting standard for directors' bonuses)
(Accounting standard regarding "Net assets" in balance sheets)
NOTES PERTAINING TO CONSOLIDATED FINANCIAL STATEMENTS
(Consolidated balance sheets information) million yen million yenAs of March 31, 2006 As of March 31, 2007
(Consolidated statements of cash flows information)
Reconciliation between cash and cash equivalents - ending and the amount shown on consolidated balance sheets
million yen million yenAs of March 31, 2006 As of March 31, 2007
Cash and deposits accountTime deposits (over 3 months)
Cash and cash equivalents - Ending
CHANGES ON THE BASIS OF CONSOLIDATED FINANCIAL STATEMENTS PREPARATION
617,139 688,737
(234,618) (360,838)
a. Notes pertaining to consolidated balance sheets, statements of income, statements of net assets, and statements of cash flows
Short-term investments due within 3 months after aquisition 39,693 87,378
Accumulated depreciation of property, plant, and equipment 38,693 43,265
812,064 962,197
Effective as of the consolidated accounting period ended March 31, 2007, Nintendo has
adopted the "Corporate Accounting Standard No. 4 regarding directors' bonuses", issued
on November 29, 2005. The impact on operating income, income before income taxes and
extraordinary items, and income before income taxes and minority interests is minor.
The expense amount incurred as directors' bonuses is booked in other current liabilities
as a determinable liability.
Effective as of the consolidated accounting period ended Mar. 31, 2007, Nintendo hasadopted the "Corporate Accounting Standard No. 5 regarding statements of net assets inbalance sheets and its application guidelines No. 8", both issued on December 9, 2005.
Corresponding amount of previously stated "Shareholders' equity" in total is 1,101,880million yen.
Statements of "Net assets" in balance sheets as of the annual fiscal year-end are on thebasis of revised consolidated financial statement regulations.
Nintendo of Korea Co., Ltd. is newly consolidated as of the consolidated accounting period ended March 31, 2007 due tocapital investments.
- 12 -

<Appendix> Nintendo Co., Ltd.
b. Segment Information
1. Segment Information by Business Categories
2. Segment Information by Seller's LocationYear ended March 31, 2006 million yen
Ⅰ Net sales(1)(2)
Total
Operating income
Ⅱ Assets
Year ended March 31, 2007 million yen
Ⅰ Net sales(1)(2)
Total
Operating income (losses)
Ⅱ Assets
3. Overseas salesYear ended March 31, 2006 million yen
The Americas Europe Other TotalⅠ Overseas sales ………………………………………………………Ⅱ Consolidated net sales ………………………………………………Ⅲ Ratio of overseas sales to consolidated net sales ……………………
Year ended March 31, 2007 million yenThe Americas Europe Other Total
Ⅰ Overseas sales ………………………………………………………Ⅱ Consolidated net sales ………………………………………………Ⅲ Ratio of overseas sales to consolidated net sales ……………………
(98)
509,249 6,956 129,869
249,219
266,156
677,783
3,151
16,952
761,223
210,493 161,929 Sales to third parties
686,529 340,345
Sales to third parties 331,385 352,377 Inter-segment sales 567,384 2,345
Operating expenses 1,292,928 (552,418) 898,770 266,171
569,866 1,536,401 16,735
247,508 14,378 212,240
1,335,389 15,247
740,509
Operating expenses
Japan TheAmericas
Consolidated
16,833 354,723
330,148 6,930
TheAmericas
Europe Other Total
251,974 77 8 1,996
212,010 128,694 418,900
Eliminationsor
corporate
(569,866) 966,534
-
(251,974)
83,439
(251,974)
(258,883) 6,909
509,249 -
TotalEliminations
orcorporate
243,472 (17,448) (179,603)
Consolidated
90,349
966,534 (569,866) -
509,249
1,160,703
Japan Europe Other
16,614
7,034 411,819 212,490 129,878
975,312 145,474 81,671 480 1,183 104
36.5% 27.5% 2.5%
643,050 966,534
23,602 353,242 266,205
11,532
1,575,597 1,755,200
66.5%
249,890
2.2%
1,192,666 (31,963) 68,729
15 121 966,534
211,195 129,884
Inter-segment sales
69.2%
352,611 509,249
41.5% 25.5%
-
157,054 226,024
Considering similarities of categories, characteristics, manufacturing method, or sales market of what Nintendo deals in, the electronic
entertainment product segment accounts for over 90% of total sales and operating income of all business category segments, with no
other segments to be reported on the basis of disclosure rules. Therefore, this information is not applicable to Nintendo's business.
- 13 -

<Appendix> Nintendo Co., Ltd.
NON-CONSOLIDATED BALANCE SHEETS
Date
Descriptionmillion yen million yen million yen
Ⅰ Current assets1 Cash and deposits2 Notes receivable3 Trade accounts receivable4 Securities5 Finished goods6 Raw materials7 Goods in process8 Supplies9 Deferred income taxes
10 Other current assets11 Allowance for doubtful accountsTotal current assets
Ⅱ Fixed assets1 Property, plant and equipment
(1) Buildings(2) Structures(3) Machinery and equipment(4) Automobiles(5) Furniture and fixtures(6) LandTotal property, plant and equipment
2 Intangible assets(1) Software(2) Other intangible assetsTotal intangible assets
3 Investments and other assets(1) Investments in securities(2) Investment securities of affiliates(3) Investments in affiliates(4) Non-current receivable(5) Deferred income taxes(6)(7) Allowance for doubtful accountsTotal investments and other assets
Total fixed assets
Total assets 363,262
609 2,707
37,448 38,630 146,767
1,003,005
2,718 7,685
15,077 (2,717)
181 20
As of March 31,2006
Amount
727,679 1,345
%
17,305 2,934
16,135
9 270
53,949
106,271
321
40,417
10,437 95
210
856,237
12,951
(1)
1,568 25,182
15,687
40,225
14.6 10.6
19,138 10,419
261
12,631
51
271 39
3,037 25,077 41,341
84,992
22,002
%
1,517 192,654 55,990
5,146 267 563
1,180,869
As of March 31,2007
Amount
796,140
92,331
13.6
(0)
(320)
324,631
90
337
24 41
1,115
283
66
31,042
(2,708) 2,749
1,366,267
(Assets)
0.0
86.4 85.4
39,678
4.0
0.0
3.1
286
(2)
14,256
22,185
(10) 143,719 185,398
10,419 10
10,434
100.0
5,867
Other investments and other assets
100.0
10.5
51,914
(37)
-
11,321 (5,290)
19 1,468
3,046
353
(104)
Increase(decrease)
Amount
68,460
172
172 152,975 38,685
- 14 -

<Appendix> Nintendo Co., Ltd.
Date
Descriptionmillion yen million yen million yen
Ⅰ Current liabilities1 Notes payable2 Trade accounts payable3 Other accounts payable4 Accrued income taxes5 Advances received6 Reserve for bonuses7 Other current liabilities
Total current liabilities
Ⅱ Non-current liabilities1 Non-current accounts payableTotal non-current liabilities
Total liabilities
Ⅰ Common stockⅡ Additional paid-in capital
1 Capital reserve2 Other additional paid-in capital
(1)Total additional paid-in capital
Ⅲ Retained earnings1 Legal reserve2 Optional reserve
(1) Special reserve(2) General reserve
3 UnappropriatedTotal retained earnings
Ⅳ Unrealized gains on other securitiesⅤ Treasury stock, at cost
Total shareholders' equity
- -
-
-
1,003,005 Total liablities and shareholders' equity
- -
- 100.0
(155,112)
856,501
-
- -
- -
- -
-
(163)
272,688
-
-
Increase(decrease)
272,851
(163)
(Liabilities)
Amount
4,140 75,932
14.5
Amount
As of March 31,2006
0 11,585
844
2,516
146,503
10,065
(Shareholders' equity)
10,900
44 810,000
0.1
228 1,732
844
42,440
11,584
14.6
166,686 979,247 10,716
-
287,029
1,779 16,058
8,919
-
35,853 4,363
47 5,774
30.7
Amount
Gain on disposal of treasury stock
As of March 31,2007
680
419,191
-
-
0.1
-
4,591 78,294
85.4
1.1 (15.5)
- - -
-
21,837
1.0
97.6 -
- - -
%
30.6 418,510
%
10,284 145,659
4,778 211,096 10,937
1.2 -
680
- -
- 15 -

<Appendix> Nintendo Co., Ltd.
Date
Description(Net assets) million yen million yen million yen
Ⅰ Owners' equity1 Common stock2 Additional paid-in capital
(1) Capital reserve(2) Other additional paid-in capitalTotal additional paid-in capital
3 Retained earnings(1) Legal reserve(2) Other retained earnings
Special reserveGeneral reserve
Total other retained earningsTotal retained earnings
4 Treasury stockTotal owners' equity
Ⅱ1 Unrealized gains on other securities
Total net assetsTotal liabilities and net assets
Unappropriated retained earnings
Valuation and translation adjustments
Total valuation and translation adjustments
860,000
- - -
-
- - -
-
- -
- -
-
Increase(decrease)
Amount
2 11,586
2,516
40
-
- - - -
- -
As of March 31,2006
As of March 31,2007
Amount % Amount %
10,065
11,584
209,368 1,069,408 1,071,925 (155,396) 938,181 68.7
8,895
8,895 0.6
947,076 69.3 1,366,267 100.0
-
- -
-
- - -
- - - -
-
-
-
-
-
- 16 -
<Appendix> Nintendo Co., Ltd.
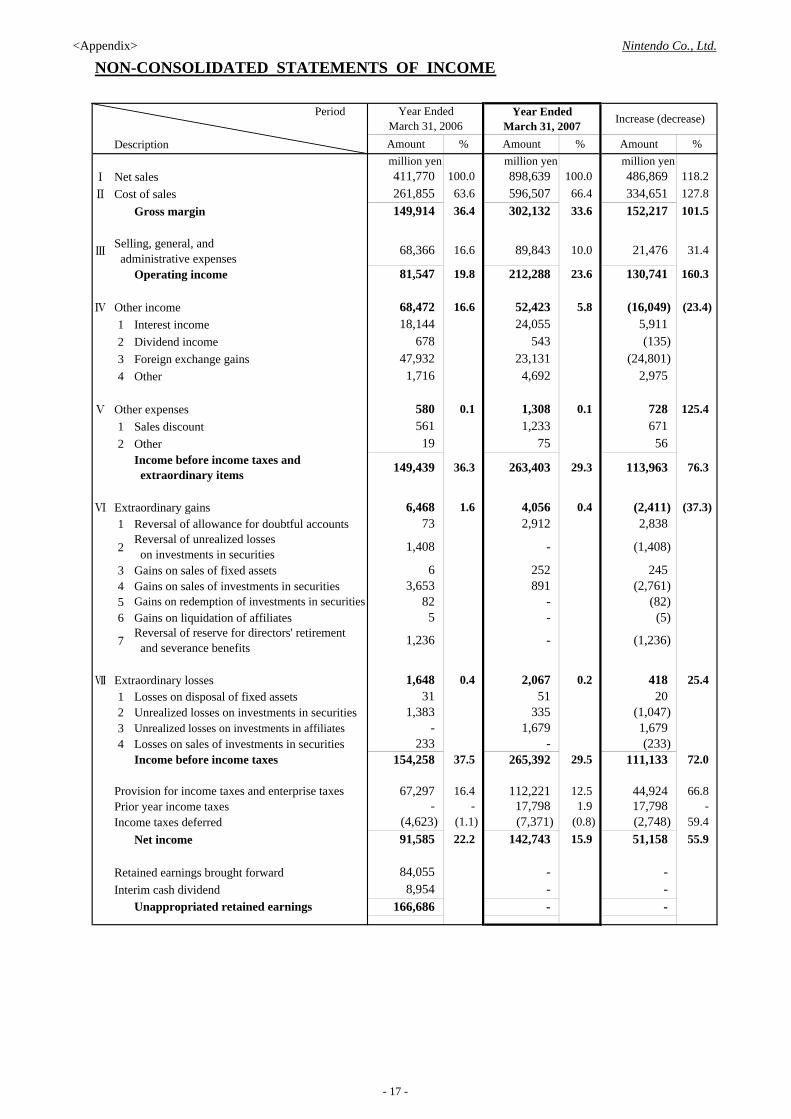
NON-CONSOLIDATED STATEMENTS OF INCOME
Period
Descriptionmillion yen million yen million yen
Ⅰ Net salesⅡ Cost of sales
Gross margin
Ⅲ
Operating income
Ⅳ Other income1 Interest income2 Dividend income3 Foreign exchange gains4 Other
Ⅴ Other expenses1 Sales discount2 Other
Ⅵ Extraordinary gains1 Reversal of allowance for doubtful accounts
2
3 Gains on sales of fixed assets4 Gains on sales of investments in securities5 6 Gains on liquidation of affiliates
7
Ⅶ Extraordinary losses1 Losses on disposal of fixed assets2 Unrealized losses on investments in securities3 Unrealized losses on investments in affiliates4 Losses on sales of investments in securities
Prior year income taxesIncome taxes deferred
Net income
Retained earnings brought forwardInterim cash dividend
Reversal of unrealized losses on investments in securities
12.5 44,924 66.8
37.5
16.4
154,258 Income before income taxes
Provision for income taxes and enterprise taxes 67,297
Selling, general, and administrative expenses
Income before income taxes and extraordinary items 76.3 113,963 29.3 263,403 36.3 149,439
18,144 678
31 1,383
51
891 - -
-
Unappropriated retained earnings
(2,411) (37.3)
55.9 (2,748)
22.2 (1.1)
51,158
73
233
166,686 -
59.4
56
1,648
335 1,679
-
418
72.0
-
160.3
125.4 671
(16,049) (23.4)
(24,801)
25.4
130,741
-
118.2 334,651 127.8 152,217 101.5
486,869
728
8,954 - -
580
111,133
(4,623)
3,653 6
-
84,055
68,472 16.6
47,932 1,716
0.1 561
1.6
19
82
15.9 (0.8)
0.4 2,912
252
0.2
4,056
29.5 265,392
112,221
% Amount
66.4 33.6
100.0
Year EndedMarch 31, 2007
Increase (decrease)
0.1
212,288 23.6
52,423 5.8
10.0 89,843
%
4,692
Gains on redemption of investments in securities
2,067
Reversal of reserve for directors' retirement and severance benefits
6,468
1,408 -
1,308
5
1,236
81,547
75
898,639
1,233
261,855
68,366
411,770
149,914 596,507
23,131
% Amount
24,055 543
100.0 63.6
16.6
36.4 302,132
(1,047) 1,679
Year EndedMarch 31, 2006
-
0.4
(7,371) 142,743 91,585
Amount
19.8
(82)
(1,236)
20
(5)
2,975
(233)
31.4 21,476
5,911 (135)
2,838
(1,408)
245 (2,761)
17,798 - - - 17,798 1.9
- 17 -

<Appendix> Nintendo Co., Ltd.
NON-CONSOLIDATED APPROPRIATION STATEMENT
million yen
Ⅰ Unappropriated retained earnings
Ⅱ Reversal of special reserve
1 Transfer from reserve for deferred fixed assets
Total
Ⅲ Allocation
1 Cash dividends 2 Directors' bonuses
3
(1) General reserve
Ⅳ Retained earnings - carried forward
2
180
Optional reserve
75,576
Total
166,688
Amount
Approved on June 29, 2006 at theAnnual General Meeting of
Shareholders
91,112 50,000
40,932
166,686
- 18 -

<Appendix> Nintendo Co., Ltd.
NON-CONSOLIDATED STATEMENT OF NET ASSETSYear ended March 2007 (April 1, 2006 - March 31, 2007)
million yenOwners' equity
Additional paid-in capital
Balance as of March 31, 2006
* Reversal of special reserveReversal of special reserve
* Dividends from retained earningsDividends from retained earnings
* Directors' bonuses* General reserve
Net incomePurchase of treasury stockDisposal of treasury stock
Balance as of March 31, 2007
million yen
Owners' equity
Retained earningsOther retained earnings
Balance as of March 31, 2006
* Reversal of special reserveReversal of special reserve
* Dividends from retained earningsDividends from retained earnings
* Directors' bonuses* General reserve
Net incomePurchase of treasury stockDisposal of treasury stock
Balance as of March 31, 2007[Note] *Allocated at the annual general meeting of shareholders' held in June 2006.
-
Valuation and translationadjustments
(8,953) - -
845,785
-
11,584
(155,112) 166,686
2,516
- -
-
-
-
40
(4)
-
-
- (2)
-
- -
-
-
-
10,065
-
- 1
0
-
-
-
11,584
-
- -
- -
1 -
- -
- -
General reserve
Treasurystock
Totalowners'equity
10,065 2
Unappropriatedretained earnings
Legal reserve
-
2
(40,932)
- 2 -
-
-
-
-
-
810,000
-
2,516 44
(8,953)
Common stock Other additionalpaid-in capitalCapital reserve
-
- - -
- (2)
-
- -
Amount of changes in the fiscal year
- -
Amount of changes in the fiscal year
Total amount of changes in the fiscal year
Total amount of changes in the fiscal year
Net amount of changes in the fiscal year other than owners' equity
Net amount of changes in the fiscal year other than owners' equity
-
- - -
- 50,000 - - -
-
(180) (50,000) 142,743
- -
- - - - -
50,000
860,000 938,181 (155,396) 209,368
42,681
142,743 (284)
(1,821)
1
92,395 (283)
(1,821)
-
2 (284)
-
-
(180) -
Special reserve
-
(40,932)
-
- - -
8,895
Unrealized gains onother securities
- - - -
10,716
-
-
- 19 -

<Appendix> Nintendo Co., Ltd.
Others
(1)Consolidated sales information million yen
HardwareHandheldConsoleOthers
Hardware totalSoftware
HandheldConsole
Royalty, content income, etc.Software total
Electronic entertainment products totalOther Playing cards, Karuta, etc.
Total
(2)Other consolidated information million yen
Capital investments Depreciation expenses of tangible assets Research and development expenses Marketing expenses Foreign exchange gains Foreign exchange losses Number of employees (At year-end) Average exchange rates 1 US $ =
1 Euro =
(3)Balance of assets in major foreign currencies without exchange contracts (Non-consolidated) million U.S. dollars / eurosAs of March 31, 2006 As of March 31, 2007 As of March 31, 2008Balance Balance Estimated exchange rates
US $ Cash and deposits 1 US $ = 1 US $ = 1 US $ =Trade accounts receivable
Euro Cash and deposits 1 Euro = 1 Euro = 1 Euro =Trade accounts receivable
(Note) Trade accounts payable as of March 31, 2007 : 238 million U.S. dollars.
Exchange rate
693522
807106 142.81 yen
117.47 yen
150.00 yen
2,935116
2,940779
137.86 yen 150.09 yen
115.00 yen
-20,000
-115.00 yen
Exchange rate
5,09337,72582,339
10,0006,500
45,00090,000
3,150 113.31 yen
25,741-
3,373 117.02 yen
30,59655,44245,515
-
507,0722,176
509,249
3,442
2,154966,534
5,597 11,232
82,3615,301
379,578964,379
156,47854,258
584,800
291,916
225,588
374,063
Business category Main products Year endedMarch 31, 2006
Year endedMarch 31, 2007
Electronicentertainment
products
32,947281,484
172,661
157.33 yen
118.05 yen
150.00 yen
223,86924,668
Year endedMarch 31, 2006
Year endedMarch 31, 2007
Year endingMarch 31, 2008
50,5032,423
- 20 -

<Appendix> Nintendo Co., Ltd.
(4) Consolidated sales units, number of new titles, and sales unit forecastSales Units in Ten Thousands
Number of New Titles ReleasedYear ended Year ended Life-to-date Forecast
Apr.-Mar. '06 Apr.-Mar. '07 Mar. '07 Apr. '07-Mar. '08 Game Boy Advance Hardware Japan
The AmericasOtherTotal
of which Game Boy Advance SP JapanThe Americas
OtherTotal
of which Game Boy Micro JapanThe Americas
OtherTotal
Software JapanThe Americas
OtherTotal
New titles JapanThe Americas
Other Nintendo DS Hardware Japan
The AmericasOtherTotal
of which Nintendo DS Lite JapanThe Americas
OtherTotal
Software JapanThe Americas
OtherTotal
New titles JapanThe Americas
Other Nintendo GameCube Hardware Japan
The AmericasOtherTotal
Software JapanThe Americas
OtherTotal
New titles JapanThe Americas
Other Wii Hardware Japan
The AmericasOtherTotal
Software JapanThe Americas
OtherTotal
New titles JapanThe Americas
Other
[Notes]*1 New titles-Other include new titles in the European and Australian markets.*2 The software forecast figures do not include quantity bundled with hardware.
47 48 95 58 3 61
644 369 4,192 176 109 1,195 426 252 2,347
42 8 650 833 434 7,946 -
122 2,171 261
100 11 300
1,666 4,110 472
800
781 1,252 663 1,174
2,388
3,720 5,803
4,029 2,200
7,511
5,085
2
5,936 999
2,356
4,977
126 109 912
3,853
1,608
4,995
172
376
1,235
20
2,152
478 292
1,146
1,602
36,625
728 3,534
255 2,599
7,236 20,857
8,532 1,674
183 59 242 87 79 8
12,355 18,398 13,000 3,658
147 97 84
445 272
402
44 8 476 1,281 63
-298 44 2,741 235 73 2,159
786
350
1,448 13,613 188 4,234
1,680 20,588 592
76 170 170
16
162 262
67
7 40 28
37 84
452
275 549
3,279
992 904
272 157
58 890 948
- 596 - 641 641
596 58 2,128 2,185
- 200 200 - 237 237 - 147 147 - 584 584 1,400 - 612 612 - 1,449 1,449 - 823 823 - 2,884 2,884 5,500 - 38 38 - 47 47 - 45 45
- 21 -
Recommended