Consumer Driven Health Plans:
Empirical evidence of take-up, cost and utilization and HSA policy implications.Stephen T Parente, Roger Feldman, Jon B Christianson
Presentation to the National Association of Business Economics (NABE), Washington, DC, March 13, 2006
Sponsored by the Robert Wood Johnson Foundation’s Health Care Financing & Organization Initiative (HCFO) and the U.S. Department of Health and Human Services
Presentation Overview
What is a Consumer Drive Health Plan (CDHP)?
Policy Questions National CDHP Take-up Cost & Utilization Comparisons Over
Time National HSA Simulation Policy Implications
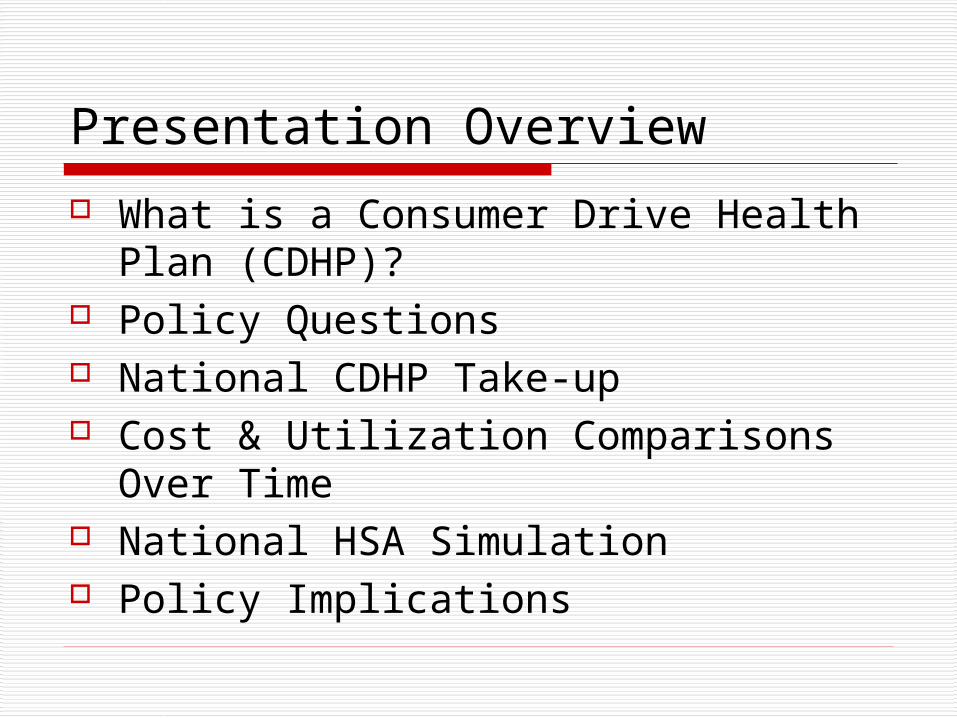
‘Classic’ CDHP Model – Definity Health
Definity Definity HealthHealthCareCare
AdvantageAdvantage
Web- and Web- and Phone-Phone-Based Based ToolsTools
Health ToolsHealth Toolsand Resourcesand Resources
Health Tools and Resources• Care management
program• Internet enabled
Health Coverage• Preventive care covered
100%• Annual deductible• Expenses beyond the
HRA
Health Reimbursement Account (HRA)• Employer allocates HRA1
• Member directs HRA• Roll over at year-end • Apply toward deductible2
Annual Annual DeductibleDeductible
Annual Annual DeductibleDeductible
Pre
ven
tive
Care
10
0%
Pre
ven
tive
Care
10
0%
Health Health CoverageCoverage
An
nu
al
Ded
uct
ible
1 Employer selects which expense apply toward the Health Coverage annual deductible.2 Paid out of employer’s general assets.
HRAHRAHRAHRA
$$

CDHP Version 2.0: The Health Savings Account (HSA)
HSAs legislated in
MMA 2003.
Pretty similar to
Definity Health HRA
Design except
the consumers owns
the account.
Annual Annual DeductibleDeductible
Annual Annual DeductibleDeductible
Pre
ven
tive C
are
P
reven
tive C
are
1
00
%1
00
%
Health Health CoverageCoverage
An
nu
al
Ded
uct
ible
HSAHSAHSAHSA
$$
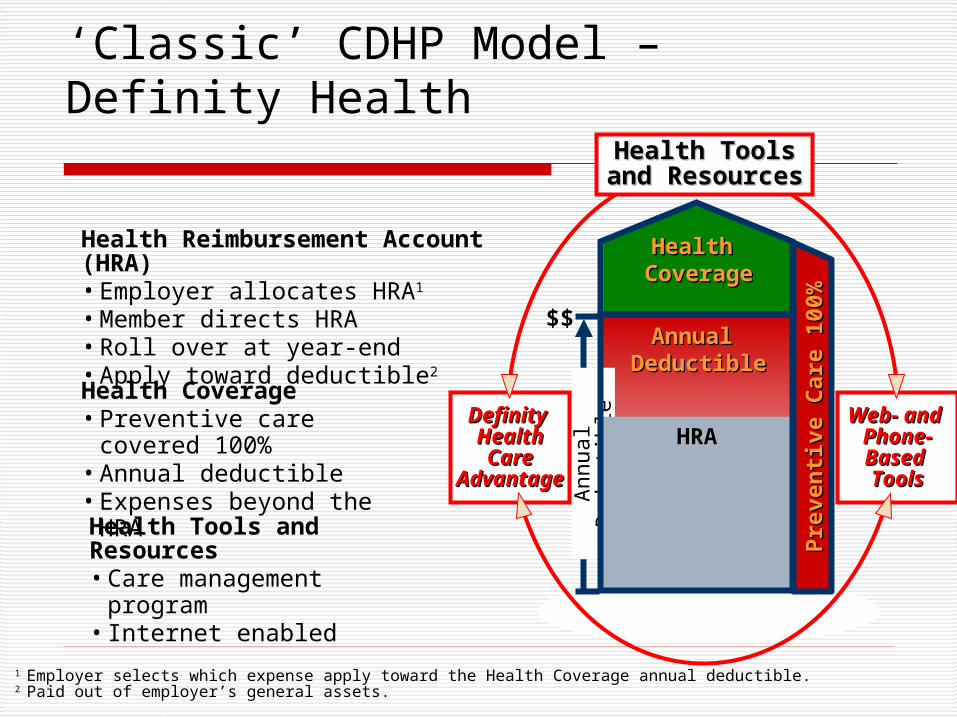
Conceptual Model of CDHPMoney
Medical Care
CDHP Budget
CoinsurancePlan Budget
b
a
c
Low Use Medium Use High Use

Policy Questions to be Addressed Do CDHPs (in the form of HRAs) have
national appeal? What are the longer-run cost & use
consequences of CDHPs? Where do they save money? What is the impact on pharmacy services, where
consumers can act in a ‘directed’ fashion? Do HSAs have potential national appeal? Are HSAs a viable approach to addressing
the problem of the uninsured?FYI: We are just approaching the half-way point of our research.

Nearly National Appeal of HRAs: States where the study employers’ 1st year CDHP take-up was >5%
>5%
0.1 - 5%
0%
Take-up

Employer-based Analysis Overview Analysis started in 2002 with six employers Combined population drawn from 50 states Total covered lives represented: ~250,000 Collect primarily employer HR data and
insurance claims data for all plans. New HCFO grant will create a study panel
with six total years of CDHP experience 2001-2006.

What is the impact of CDHPs on cost & use? Study Design:
First results reported in 2004, August, Health Services Research.
Look at CDHP/PPO/POS cohorts within one large employer for employees over time to see ‘longer run’ impact of CDHP in 2001 - 2003.
Control for several factors to ADJUST cost & use estimates: Health status/illness burden/health shocks
(cancer, catastrophic accident) Income Family size and dependents Age, gender

Study Setting Large employer that offered HMO and PPO in 2000-
2003 and introduced CDHP in 2001 Variation in cost sharing by contract Take-up of CDHP approximately 15% Smaller account/deductible gap, 0% co-insurance on
catastrophic General caveat: ANY Employer’s experience can be
quite different due to: Alternatives offered Plan design Communications with employees Sponsor’s objectives for the plan

New Results: Impact of CDHP and PPO on Cost Compared to POS
NOTES: These are results from a restricted continuously enrolled sample of 26% of the total employee population and are not a reflection of the plans’ expenditures. Bolded numbers are significant at p<.05.
All Annual Plan Effects Using POS Plan as baseline.
2000 Model 2001 2002Health Plan Cohorts Mean Stage Plan Effects Plan Effects Plan Effects
CDHP Cohort N=429Total Expenditure 4,037$ Probit -0.111 0.269 0.187
GLM 4.1% 26.0% 22.6%
Employer Expenditure 3,627$ Probit -0.077 0.222 0.222
GLM 11.2% 38.9% 30.1%Employee Expenditure 410$ Probit -2.083 -2.149 -1.723
GLM 43.0% 36.8% 39.6%
PPO Cohort N=1,025Total Expenditure 4,661$ Probit -0.082 -0.087 -0.161
GLM 8.3% 16.8% 9.5%
Employer Expenditure 4,172$ Probit -0.104 -0.127 -0.183
GLM 11.2% 20.0% 12.4%Employee Expenditure 490$ Probit -0.041 -0.003 -0.060
GLM -7.0% -3.3% -9.6%
Notes:
Regressions adjusted by annual trends, health plan choice, health plan choice interactedwith annual trends, age gender, income, number of covered lives in contract, use of an healthcare flexible spending account.
2003
NOTE: These are results from a restricted continuously enrolled sample of 27% of the total employee population and are not a reflection of the plans’ full prescription drug experience.

Impact of CDHP and PPO on Physician, Hospital and Pharmacy Cost Compared to POS
NOTE: These are results from a restricted continuously enrolled sample of 26% of the total employee population and are not a reflection of the plans’ expenditures.
All Annual Plan Effects Using POS Plan as baseline.
2000 Model 2001 2002Health Plan Cohorts Mean Stage Plan Effects Plan Effects Plan Effects
CDHP Cohort N=429Hospital Expenditure 1,332$ Probit -0.109 0.069 -0.050
GLM 60.8% 119.7% 75.5%
Physician Expenditure 1,891$ Probit -0.089 0.311 -0.007
GLM 10.7% 20.2% 25.1%Pharmacy Expenditure 814$ Probit -0.086 -0.061 0.256
GLM -14.7% -5.1% -3.9%
PPO Cohort N=1,025Hospital Expenditure 1,669$ Probit 0.109 0.106 -0.091
GLM 23.8% 24.4% 29.0%
Physician Expenditure 1,958$ Probit -0.105 -0.055 -0.174
GLM 5.9% 10.2% 6.7%Pharmacy Expenditure 1,034$ Probit -0.029 -0.096 0.047
GLM 8.3% 22.7% 9.9%
Notes:
Regressions adjusted by annual trends, health plan choice, health plan choice interactedwith annual trends, age gender, income, number of covered lives in contract, use of an healthcare flexible spending account.
2003
NOTE: These are results from a restricted continuously enrolled sample of 27% of the total employee population and are not a reflection of the plans’ full prescription drug experience.
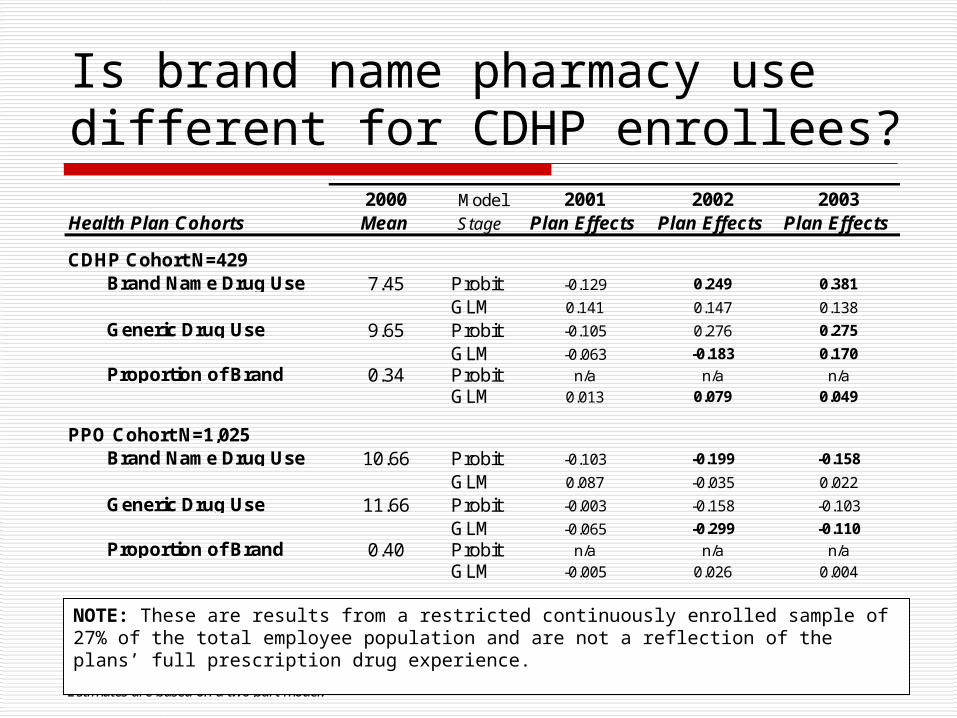
Is brand name pharmacy use different for CDHP enrollees?
2000 Model 2001 2002Health Plan Cohorts Mean Stage Plan Effects Plan Effects Plan Effects
CDHP Cohort N=429Brand Name Drug Use 7.45 Probit -0.129 0.249 0.381
GLM 0.141 0.147 0.138
Generic Drug Use 9.65 Probit -0.105 0.276 0.275
GLM -0.063 -0.183 0.170Proportion of Brand 0.34 Probit n/a n/a n/a
GLM 0.013 0.079 0.049
PPO Cohort N=1,025Brand Name Drug Use 10.66 Probit -0.103 -0.199 -0.158
GLM 0.087 -0.035 0.022
Generic Drug Use 11.66 Probit -0.003 -0.158 -0.103
GLM -0.065 -0.299 -0.110Proportion of Brand 0.40 Probit n/a n/a n/a
GLM -0.005 0.026 0.004
Notes:
Regressions adjusted by annual trends, health plan choice, health plan choice interactedwith annual trends, age gender, income, number of covered lives in contract, use of an healthcare flexible spending account.Estimates are based on a two part model.
2003
NOTE: These are results from a restricted continuously enrolled sample of 27% of the total employee population and are not a reflection of the plans’ full prescription drug experience.

Is there a difference in pharmacy use for CDHP patients with chronic conditions?
NOTE: These are results from a restricted continuously enrolled sample of 27% of the total employee population and are not a reflection of the plans’ full prescription drug experience.
2001 Model 2001 2002 2003Health Plan Cohorts Mean Stage Plan Effects Plan Effects Plan Effects
CDHP Cohort N=429Chronic Medical Rx Use 9.68 Probit -0.037 0.294 0.176 68.00
GLM -0.052 -0.179 0.171Chronic Psych Rx Use 6.90 Probit -0.037 0.294 0.176 88.00
GLM -0.052 -0.179 0.171Non-Chronic Rx Use 7.41 Probit 0.015 -0.063 0.031 108.00
GLM 0.065 0.010 0.222
PPO Cohort N=1,025Chronic Medical Rx Use 14.51 Probit 0.020 0.060 -0.087 71.00
GLM -0.013 -0.274 -0.138
Chronic Psych Rx Use 10.00 Probit -0.066 0.052 -0.023 91.00
GLM -0.032 -0.312 -0.170Non-Chronic Rx Use 7.81 Probit -0.070 -0.121 0.005 111.00
GLM -0.021 -0.237 -0.035
Notes:
Regressions adjusted by annual trends, health plan choice, health plan choice interactedwith annual trends, age gender, income, number of covered lives in contract, use of an healthcare flexible spending account.Estimates are based on a two part model.
NOTE: These are results from a restricted continuously enrolled sample of 27% of the total employee population and are not a reflection of the plans’ full prescription drug experience.

Overall Cost & Use Results Summary
CDHP plan did not have the lowest cost and utilization across all plans.
CDHP best (lowest) cost result was for pharmacy.
CDHP worse (highest) cost result was for hospital expenditures (inpatient & outpatient). – partially explained by pent-up demand for elective procedures & provider pricing differences across years.
Pharmacy Summary
Costs down initially – volume does not decrease at same time – suggests more frugal Rx use (e.g., greater use of mail order).
CDHP chronic condition cohort drug use is generally higher than other health plans, though rarely statistically significant.
Brand name drug use higher in CDHP, but overall cost is lower.
Using HRA Results to Explore HSA Policy Questions
What is the expected take-up rate of HSAs in the individual market?
What is the likely impact of the Administration’s HSA sproposals? Take-up rate of HSAs with subsidies Reduction in the number of uninsured Cost of the subsidy
What is the impact of other possible subsidy designs?

Data Sources
2002 health plan choice data from 3 large employers participating in a Robert Wood Johnson Foundation funded study on CDHPs Employee premium, deductible, coinsurance,
worker’s age, gender, wage income, single/family coverage
2001 Medical Expenditure Panel Survey (MEPS) Household Component Linked Insurance Component
eHealthinsurance.com Individual HSA plan information

Plan Choice Model Analytic Approach Plan Choices: HMO, 3 PPOs (low, medium, high), 2
CDHPs with Health Reimbursement Accounts (low and high)
Utility-maximization assumption where Uhj = j + Zj + Xhj + ehj
Estimate a conditional logit model of plan choice using the pooled, employer data
Explanatory variables Plan attributes (Z)
Annual tax-adjusted employee premium ($1000s dollars) Savings/reimbursement account size ($1000s dollars) Donut hole: difference between annual deductible and
account size ($1000s dollars) Coinsurance rate (i.e., .10 = 10% coinsurance)
Interactions between employee and plan attributes (X) Age, female, wage income, family contract
Plan-specific constants (j )

Price elasticity estimates from the plan choice model
PriceVariable Elasticity
Tax adjusted Employee Premium in $1,000 -0.9213
Employee's Health Account in $1,000 0.0885
∆ Between Deductible and Health Account in $1,000 -0.2430
Coinsurance (e.g., 15% = .15) -0.5405

Policy Simulations Baseline take-up of HSAs from the Medicare
Modernization Act of 2003
Simulation (1): Bush Administration’s 2004 proposal Refundable tax credit up to 90% of premium;
maximum of $1000/adult, $500/child (up to two) Subsidy for singles with no dependents phased out
at $30,000 adjusted gross income and $60,000 for families
Simulation (2): 2006 State of the Union Proposal
Simulation (3): Level the Playing Field
Simulation (4): Full subsidy of HSA premium
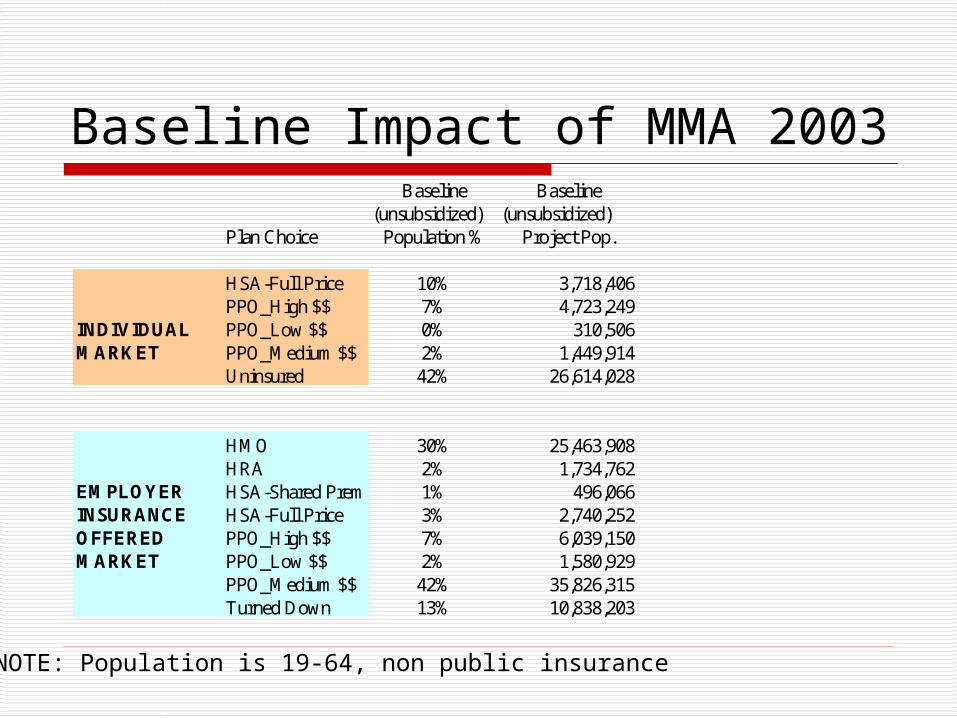
Baseline Impact of MMA 2003
NOTE: Population is 19-64, non public insurance
Baseline Baseline(unsubsidized) (unsubsidized)
Plan Choice Population % Project Pop.
HSA-Full Price 10% 3,718,406PPO_High $$ 7% 4,723,249
INDIVIDUAL PPO_Low $$ 0% 310,506MARKET PPO_Medium $$ 2% 1,449,914
Uninsured 42% 26,614,028
HMO 30% 25,463,908HRA 2% 1,734,762
EMPLOYER HSA-Shared Prem 1% 496,066INSURANCE HSA-Full Price 3% 2,740,252OFFERED PPO_High $$ 7% 6,039,150MARKET PPO_Low $$ 2% 1,580,929
PPO_Medium $$ 42% 35,826,315Turned Down 13% 10,838,203

HSA Summary & Next Steps HSA Plan design matters – We find a
greater take-up from a reduction in the donut hole than an increase in the account size.
Administration proposals to tax advantage HSAs will increase their take-up and reduce the number of uninsured, at the margin.
Look at HSA take-up versus retirement saving choice is a new frontier to examine.

Thank You!
For more information on our research, please visit:
www.ehealthplan.org
Stephen T. Parente, Ph.D., M.P.H., M.S.Assistant Professor, Department of FinanceDeputy Director, Medical Industry Leadership InstituteCarlson School of ManagementUniversity of Minnesota321 19th Ave. South, Room 3-149Minneapolis, MN 55455612-624-1391 (v)[email protected]://www.tc.um.edu/~paren010
Recommended