Continuous measurements of new water-quality parameters
using in-situ optical sensors at the Little Falls Pumping Station
Presented to the Potomac River Basin
Drinking Water
Source Protection Partnership
by Joseph Bell on August 22, 2013
Funding provided by: USGS National Water-Quality Assessment (NAWQA) Program Aquatic Real-Time Carbon Network

In-situ Monitoring: The Lab on a Chip
Image of equipment at Little Falls Pump Station near Washington, D.C USGS ID: 01646500
Fluorescent Dissolved Organic Matter (FDOM)
USGS
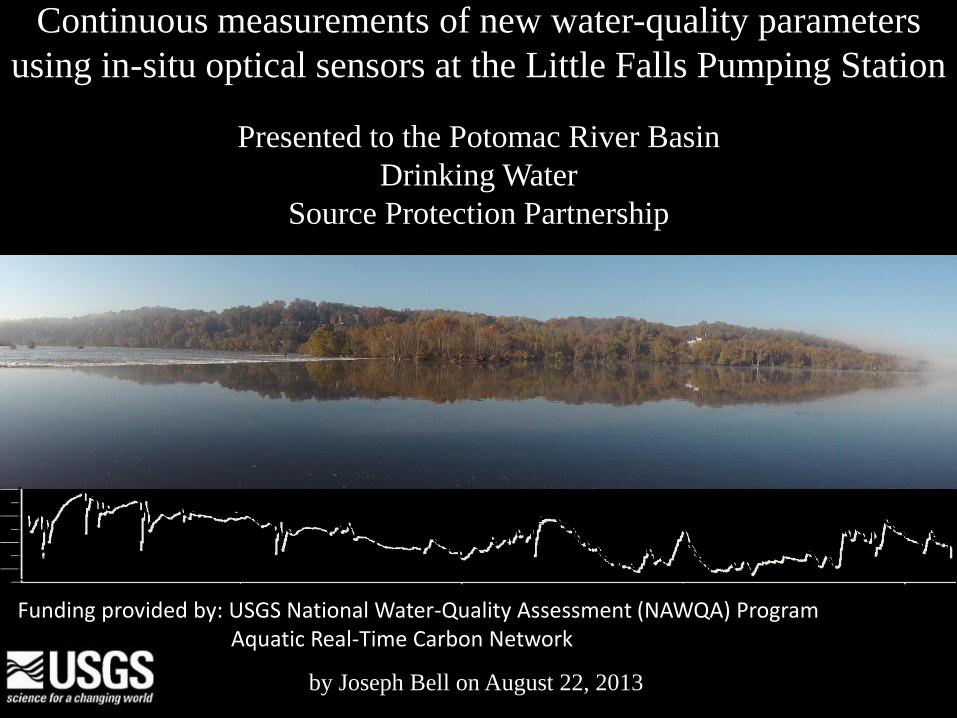
Expanding Optical Sensor Network USGS aquatic real-time monitoring of organic matter and nitrate supported by
NAWQA, Climate Effects Network, WEBB, and USGS Climate and Land Use R&D
FDOM, optical nitrate, turbidity, chlorophyll-a, CO2, etc.
Slide courtesy of Brian Pellerin
CA WSC Sacramento:[email protected]
Practical Application Load accuracy Surrogate relationships Sampling frequency Periodic cycling Early warning system
In-situ Optical Nitrate Sensor http://waterwatch.usgs.gov/wqwatch/

USGS
Accuracy of load estimates
Nov Dec Jan Feb Mar Apr May Jun Jul Aug Sep Oct
Mo
nth
ly N
itra
te-N
Lo
ad
(m
etr
ic t
on
s)
0
20000
40000
60000
80000
100000
Cu
mu
lativ
e N
itrate
-N L
oad
(metric
ton
s)
0
100000
200000
300000
400000
Sensor (2011-12)
LOADEST (2011-12 prelim)
Cumulative (sensor)
Some differences in sensor monthly loads vs. preliminary LOADEST values
Uncertainty is much lower with continuous data (± 5% vs. ± 20%*)
+33%
-22%
LOADEST data from St. Francisville, continuous data from Baton Rouge; http://toxics.usgs.gov/hypoxia/mississippi/flux_ests/delivery/index.html; * http://www.gulfhypoxia.net/
Slide courtesy of Brian Pellerin
CA WSC Sacramento: [email protected]

USGS
12/1/2011 5/4/2012 10/7/2012 3/12/2013 8/15/2013
0.0
0.5
1.0
1.5
2.0
2.5
103
104
105
2
3
4
5678
2
3
4
5678
2
Cu
bic
Fe
et
pe
r S
eco
nd
Nitra
te p
lus N
itri
te,
filte
red
, m
g/l
Nitrate plus Nitrite, filtered, mg/l
Nitrate plus Nitrite, filtered, mg/l
Cubic Feet per Second
Nitrate plus Nitrite values with Discharge: Potomac river near Chain Bridge

USGS
12/1/2011 5/4/2012 10/7/2012 3/12/2013 8/15/2013
0.0
0.5
1.0
1.5
2.0
2.5
103
104
105
2
3
4
5678
2
3
4
5678
2
Cu
bic
Fe
et
pe
r S
eco
nd
Nitra
te p
lus N
itri
te,
filte
red
, m
g/l
Nitrate plus Nitrite, filtered, mg/l
Nitrate plus Nitrite, filtered, mg/l
Cubic Feet per Second
(in-situ)
Nitrate plus Nitrite values with Discharge: Potomac river near Chain Bridge

USGS
Pre
cip
(in
/d)
0
2
4
10/1 11/1 12/1 1/1 2/1 3/1 4/1 5/1 6/1 7/1 8/1 9/1 10/1 11/1 12/1 1/1 2/1 3/1 4/1 5/1
Dis
ch
arg
e (
CF
S)
-40000
-20000
0
20000
40000
60000
80000
100000
120000
DO
C (m
g/L
)
2
3
4
5
6
7
Discharge
DOC
2010 2011
In Situ FDOM (ppb QSE)
10 20 30 40 50 60
DO
C (
mg
/L)
1
2
3
4
5
6
y = 0.0862x + 0.616
r² = 0.97
2012
Large DOC response after leaf fall and muted responses during snowmelt
Variability from storm to storm, snowmelt periods, etc.
DOC transport during large events
Connecticut River at Middle Haddam (01193050)
TS Nicole TS Irene/Leigh
Slide courtesy of Brian Pellerin
CA WSC Sacramento: [email protected]

TS Irene, Aug/Sept 2011 (NASA/NOAA GOES Project)
Differences in C-Q hysteresis during extreme events in the Connecticut River due to
antecedent moisture, DOM availability, or threshold effects?
2
3
4
5
6
7
0 20000 40000 60000 80000 100000 120000 140000
DO
C (
mg
/L)
Discharge (CFS)
TS Nicole (2010)
TS Irene (2011)
TS Lee (2011)
~3” of rain, during leaf fall, dry summer
~10” of rain, before
leaf fall, wet summer
DOC transport during large events
Slide courtesy of Brian Pellerin
CA WSC Sacramento: [email protected]
USGS
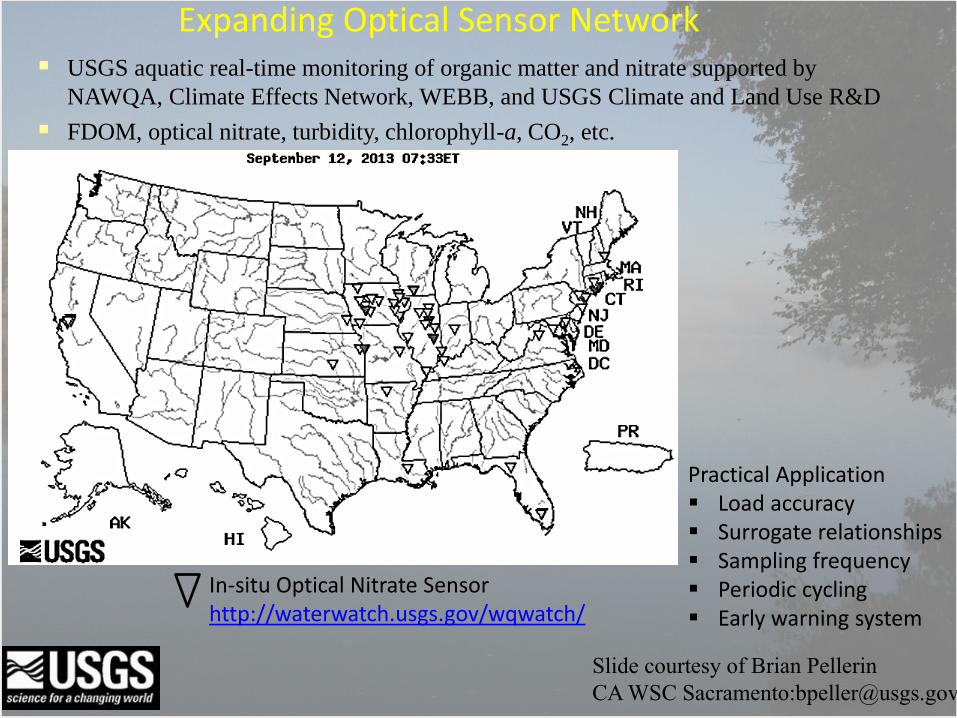
1 = 12/09/2011, 2 = 12/10/2011, 5 = 12/09/2011 @1330: 1.35 mg/l
3 = 12/11/2011, 4 = 12/12/2011,
30000 60000 90000
Cubic Feet per Second
0.9
1.1
1.3
1.5
1.7
Nitra
te p
lus N
itri
te,
filte
red
, m
g/l
86700.00 cfs1.01mg/l52600.00 cfs
1.29 mg/l
58100.00 cfs1.35 mg/l
36200.00 cfs1.42 mg/l
12/8/2011 12/10/2011 12/12/2011
0.9
1.1
1.3
1.5
1.7
Nitra
te p
lus N
itri
te,
filte
red
, m
g/l
10000
30000
50000
70000
90000
Cu
bic
Fe
et
pe
r S
eco
nd
1
2 3
4 5
Nitrate plus Nitrite, filtered, mg/l
Nitrate plus Nitrite, filtered, mg/l
Cubic Feet per Second
Hysteresis pattern during storm event flow: In-situ data from Potomac at Little Falls
(in-situ)
1 2 3 4
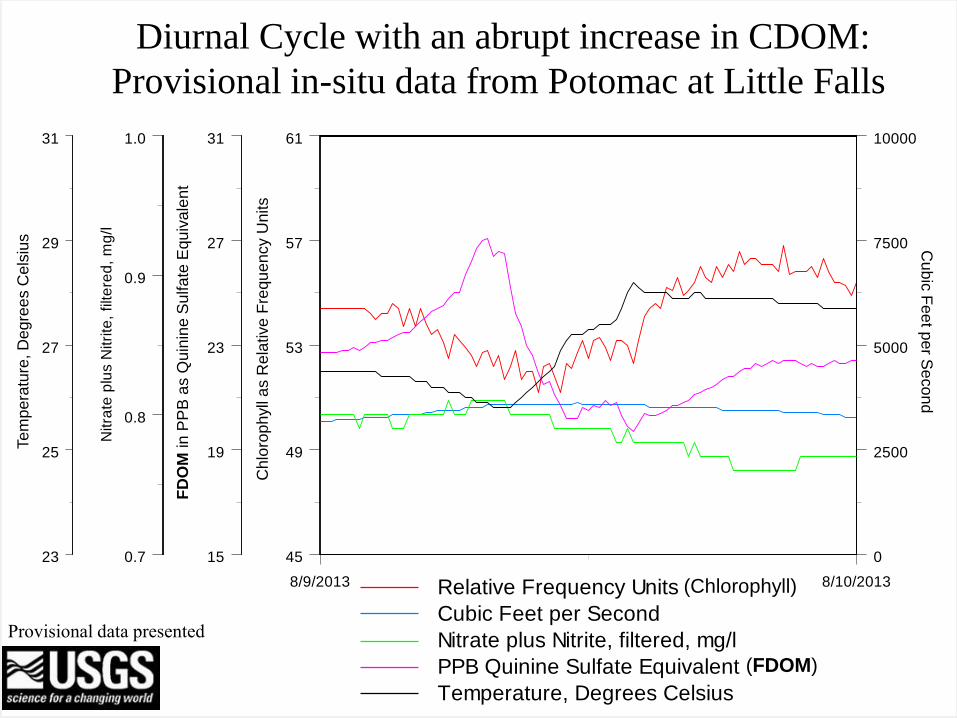
8/9/2013 8/10/2013
45
49
53
57
61
0
2500
5000
7500
10000
Cu
bic
Fe
et
pe
r S
eco
nd
0.7
0.8
0.9
1.0
Nitra
te p
lus N
itri
te,
filte
red
, m
g/l
15
19
23
27
31
23
25
27
29
31
Chlo
rop
hyll
as R
ela
tive
Fre
qu
en
cy U
nits
FD
OM
in
PP
B a
s Q
uin
ine S
ulfa
te E
qu
iva
len
t
Te
mp
era
ture
, D
egre
es C
els
ius
Cub
ic F
ee
t pe
r Se
co
nd
Relative Frequency Units
Cubic Feet per Second
Nitrate plus Nitrite, filtered, mg/l
PPB Quinine Sulfate Equivalent
Temperature, Degrees Celsius
Diurnal Cycle with an abrupt increase in CDOM:
Provisional in-situ data from Potomac at Little Falls
(Chlorophyll)
(FDOM)
Provisional data presented

USGS
Input from C&O Canal into the Potomac River 0.8 km
upstream from monitoring station at Little Falls Pump Station
USGS
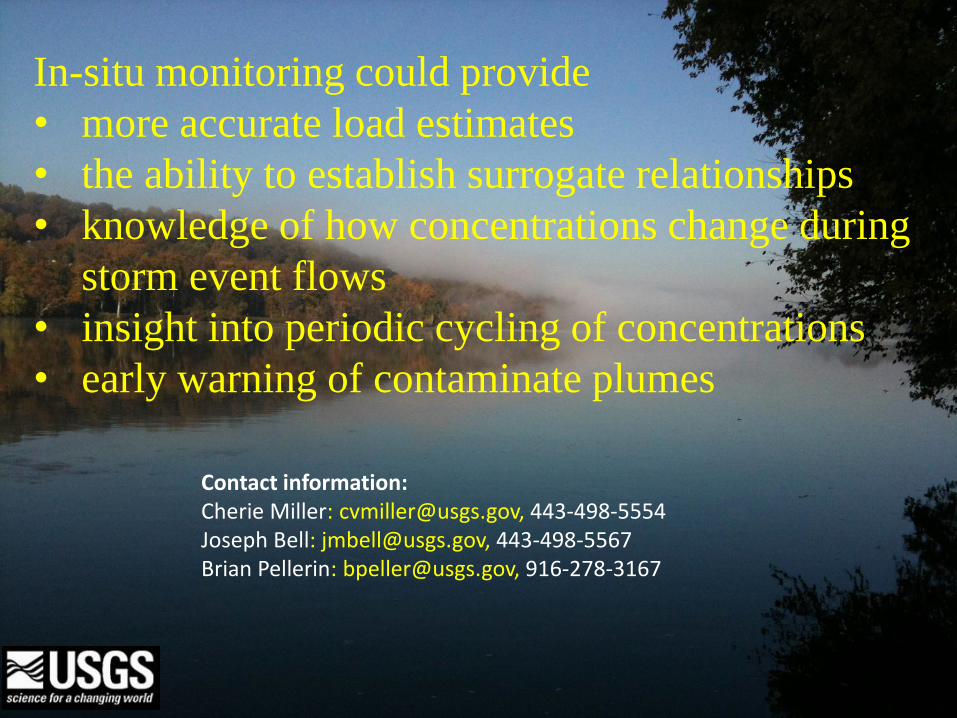
In-situ monitoring could provide
• more accurate load estimates
• the ability to establish surrogate relationships
• knowledge of how concentrations change during
storm event flows
• insight into periodic cycling of concentrations
• early warning of contaminate plumes
Contact information: Cherie Miller: [email protected], 443-498-5554 Joseph Bell: [email protected], 443-498-5567 Brian Pellerin: [email protected], 916-278-3167
Recommended