atmosphere
Article
Contribution of Volcanic and Fumarolic Emission tothe Aerosol in Marine Atmosphere in the CentralMediterranean Sea: Results from Med-Oceanor 2017Cruise Campaign
Sacha Moretti 1, Apostolos Salmatonidis 2, Xavier Querol 2, Antonella Tassone 1,Virginia Andreoli 1, Mariantonia Bencardino 1, Nicola Pirrone 1, Francesca Sprovieri 1 andAttilio Naccarato 1,*
1 CNR-Institute of Atmospheric Pollution Research, Division of Rende, UNICAL-Polifunzionale,I-87036 Arcavacata di Rende, CS, Italy; [email protected] (S.M.); [email protected] (A.T.);[email protected] (V.A.); [email protected] (M.B.); [email protected] (N.P.);[email protected] (F.S.)
2 Institute of Environmental Assessment and Water Research (IDÆA-CSIC), C/Jordi Girona 18,08034 Barcelona, Spain; [email protected] (A.S.); [email protected] (X.Q.)
* Correspondence: [email protected]
Received: 8 January 2020; Accepted: 27 January 2020; Published: 30 January 2020�����������������
Abstract: This work studied the contribution of the geogenic sources volcanoes and fumaroles to theaerosol in marine atmosphere in the central Mediterranean basin. For this purpose, in the frameworkof the Med-Oceanor measurement program, we carried out a cruise campaign in the summer of 2017to investigate the impact to the aerosol of the most important Mediterranean volcanoes (Mount Etna,Stromboli Island, and Marsili Seamount) and solfatara areas (Phlegraean Fields complex, VolcanoIslands, Ischia Island, and Panarea submarine fumarole). We collected PM10 and PM2.5 samples in12 sites and performed chemical characterization to gather information about the concentration ofmajor and trace elements, elemental carbon (EC), organic carbon (OC), and ionic species. The useof triangular plots and the calculation of enrichment factors confirmed the interception of volcanicplume. We integrated the outcomes from chemical characterization with the use of factor analysisand SEM/EDX analysis for the source apportionment. Anthropogenic and natural sources includingshipping emissions, volcanic and fumarolic load, as well as sea spray were identified as the mainfactors affecting aerosol levels in the study area. Furthermore, we performed pattern recognitionanalysis by stepwise linear discriminant analysis to seek differences in the composition of PM10 andPM2.5 samples according to their volcanic or solfatara origin.
Keywords: Mediterranean Sea; particulate matter; volcanic area; air quality; carbonaceous compounds;element analysis
1. Introduction
Advancements in the current state of knowledge of atmospheric aerosols are an important researchtopic because of their implications in environmental and health issues [1]. Nowadays, much of theair pollution results from human activities, but natural sources also contribute to the increase ofthe exposure level of the population and ecosystem to the polluted air. Typically, the major naturalemissions in terms of mass include sea spray (84%) and mineral dust (13%), along with other sourcessuch as biological primary organic aerosols (POA), volcanic emissions, biogenic secondary organicaerosols (SOA), and biogenic sulfate particles [2]. Anthropogenic aerosols contribute only 2% to global
Atmosphere 2020, 11, 149; doi:10.3390/atmos11020149 www.mdpi.com/journal/atmosphere

Atmosphere 2020, 11, 149 2 of 19
emissions, mainly in the form of anthropogenic sulfate (49%) and industrial dust (40%), with additionalemissions of anthropogenic nitrate, SOA, and fossil fuel-derived POA. On a global-scale, primaryaerosols are dominant over secondary species (98% vs. 2%), whereas on the local-scale, this scenario isreversed [2]. Indeed, the source contributions to ambient aerosols may differ from one region to anothersince they are strongly affected by a broad spatial variability. Owing to the importance of aerosolinvestigation on both global and local scales, several international programs aim to assess its chemistryand interaction with the climate, e.g., Charmex (Chemistry-Aerosol Mediterranean Experiment) andIGAC (International Global Atmospheric Chemistry). The study and identification of events affectingair quality are complex tasks in which data handling strategies including aerosol maps, back-trajectoryanalysis, and receptor modeling support the laboratory analysis on the composition of particulatematter (PM). In this respect, the use of mass spectrometry technologies has been giving a considerableimpulse allowing in-depth analyses and characterization of the PM [3] as well as other environmentalmatrices [4,5]. Natural contributions to the levels of ambient air particulate matter (PM) and theirspeciation in Europe have been characterized using different approaches in many studies [2,6–13].The air quality of Mediterranean countries can be affected by four major natural sources of atmosphericaerosol, i.e., African dust, sea spray, wildfire, and volcanic emission [2]. The wind-blow African dust canincrease ambient PM levels even above the PM thresholds [12–15], and its contribution that originatesfrom arid and semiarid areas leads to an increase of mineral dust in the atmosphere. Another importantpollution source is derived from the dispersed PM emitted from the sea surface, generally referred toas sea spray. Sea spray is produced by the bubble-bursting processes or wind-induced wave breaking,resulting in a spray of particles in the size range from sub-micrometers up to a few micrometers [16].Carbonaceous aerosol derived from wildfires is another natural source of aerosol constituents due tothe burning of forests and other vegetation through natural processes [10]. In Mediterranean countries,fire emissions during summer have special relevance because the weather is dry and hot [17], and fireoutbreaks are commonly fanned by strong winds. A further contribution to PM is given by volcanicemissions, which release a considerable variety of compounds, such as water vapor, ash, CO2, SO2,and HCl [18] through the summit of volcanic edifices as well as through fumarolic vents, which aregenerated by surface fractures usually occurring in the neighborhood of volcanoes [19]. Volcanicactivity has not only a local impact on the troposphere but also a global influence since emissions mayreach the stratosphere [20].
The lack of information about the contribution of volcanic activity to the aerosol in the atmospheresignificantly restricts the assessments of environmental and human health risks, which are ofconsiderable concern in the central sector of the Mediterranean Sea because of the presence ofnumerous active volcanoes including Etna and Stromboli and fumaroles such as those on the VolcanoIsland and in the area of Phlegraean Fields, or submarine fumaroles near Panarea Island. Severalstudies focused on the contribution of aerosol emissions from volcanic activities to the ambient airpollutants around the volcanoes or fumaroles using different approaches [21–24]. However, theseworks studied a single area at a time and provided for an on-land sampling of the aerosol, therebyassessing the impact near the sources. In previous work, our group dealt with the influence of volcanicsources on the atmospheric PM during a cruise campaign in the Mediterranean basin [25]; however,the local volcanic impact in the Mediterranean area has not been adequately investigated yet. In theeffort to fill these observation gaps, the Institute of Atmospheric Pollution Research of the NationalResearch Council (CNR-IIA) within the ongoing Med-Oceanor program [26] has started, since 2000,regular cruise measurement campaigns across the Mediterranean Sea. In this context, our work reportsabout the input from volcanoes and fumaroles to the levels and composition of atmospheric aerosolsin the central Mediterranean Sea. We performed this study during the 2017 research cruise campaigncovering the study of trace metals, ionic species, organic carbon (OC), and elemental carbon (EC).Aerosol particulate in its PM10 and PM2.5 fraction was collected and analyzed by different techniquesfor metal and ions determination. We merged the results of the chemical characterization with the PMinvestigation using scanning electron microscopy with energy-dispersive X-ray analysis (SEM/EDX)

Atmosphere 2020, 11, 149 3 of 19
and strategies of data analysis including receptor modeling tools to identify the potential contributionof different sources to the PM in the central Mediterranean area.
2. Studied Area and Measurement Scheme
We performed aerosol sampling from 19 August to 4 September 2017 on-board of the researchvessel “Minerva Uno” of the Italian National Research Council (CNR) during the oceanographiccampaign Med-Oceanor 2017. Except for the last two days of the operation, the local weather conditionswere characterized by low wind speed (between 0.3 and 13.5 m s−1) and by stable average daily valuesof temperature and pressure, ranging between 23.7 and 29.2 ◦C and 1009 and 1019 hPa, respectively.The route involved 12 stops (Figure 1), each belonging to volcanic or fumarole areas. The volcanic areacomprised Mount Etna, Stromboli Island, and Marsili Seamount, while the fumarole area comprised thePhlegraean Fields complex, Vulcano Island, Ischia Island, and Panarea submarine fumarole. To simplifythe identification of the sampling zones, we labeled each stop using the name of the neighboring site.
Atmosphere 2020, 11, x FOR PEER REVIEW 3 of 19
tools to identify the potential contribution of different sources to the PM in the central Mediterranean area.
2. Studied Area and Measurement Scheme
We performed aerosol sampling from 19 August to 4 September 2017 on-board of the research vessel “Minerva Uno” of the Italian National Research Council (CNR) during the oceanographic campaign Med-Oceanor 2017. Except for the last two days of the operation, the local weather conditions were characterized by low wind speed (between 0.3 and 13.5 m s−1) and by stable average daily values of temperature and pressure, ranging between 23.7 and 29.2 °C and 1009 and 1019 hPa, respectively. The route involved 12 stops (Figure 1), each belonging to volcanic or fumarole areas. The volcanic area comprised Mount Etna, Stromboli Island, and Marsili Seamount, while the fumarole area comprised the Phlegraean Fields complex, Vulcano Island, Ischia Island, and Panarea submarine fumarole. To simplify the identification of the sampling zones, we labeled each stop using the name of the neighboring site.
Figure 1. Map of sampling sites; red diamonds represent the volcanic sites while the yellow diamonds represent fumarolic sites: (1) Campania area; (2) Eolian archipelago; (3) Etnean area.
2.1. The Mount Etna
Mount Etna, one of the most active volcanoes in the world, covers an area of about 1250 km2 and reaches an altitude of about 3340 m a.s.l. (37.754193° N, 14.978929° E) (Figure 1). It has been active during historical time, with frequent paroxysmal episodes separated by passive degassing periods. The edifice consists of a lower shield unit overlain by a stratovolcano [27] that is truncated at 2800–2900 m of altitude by the Ellittico caldera and Cratere del Piano, while the upper part of the volcano culminates with a large summit cone endowed with four active craters (Bocca Nuova, Voragine, Northeast, and Southeast Craters). The general atmospheric circulation in the Etnean area is
Figure 1. Map of sampling sites; red diamonds represent the volcanic sites while the yellow diamondsrepresent fumarolic sites: (1) Campania area; (2) Eolian archipelago; (3) Etnean area.
2.1. The Mount Etna
Mount Etna, one of the most active volcanoes in the world, covers an area of about 1250 km2
and reaches an altitude of about 3340 m a.s.l. (37.754193◦ N, 14.978929◦ E) (Figure 1). It has beenactive during historical time, with frequent paroxysmal episodes separated by passive degassingperiods. The edifice consists of a lower shield unit overlain by a stratovolcano [27] that is truncatedat 2800–2900 m of altitude by the Ellittico caldera and Cratere del Piano, while the upper part ofthe volcano culminates with a large summit cone endowed with four active craters (Bocca Nuova,Voragine, Northeast, and Southeast Craters). The general atmospheric circulation in the Etnean area is

Atmosphere 2020, 11, 149 4 of 19
predominantly westerly to northwesterly. According to these considerations, sampling sites in thiszone were located in front of the Acireale and Acicastello coasts.
2.2. Stromboli
Stromboli is an island volcano belonging to the Eolian volcanic arc (926 m a.s.l; 38.7891◦ N,15.2131◦ E) (Figure 1). It is an isolated volcano characterized by permanent activity and continuous gasemissions from potassium-rich basalt. Although Stromboli has a significant hydrothermal system [28],its magma also degasses directly into the atmosphere (i.e., at very high temperature, >1000 ◦C) fromlava-filled vents. Such systems are often described as “open-conduit” volcanoes and can degas verylarge quantities of unerupted magma. Three different sampling sites around the island of Stromboliwere monitored labeled as Stromboli (1), Stromboli (2), and Stromboli (3).
2.3. Marsili
Marsili Seamount is about 60 km long and 20 km wide, rising about 3000 m from the seafloorat over 3500 m water depth (39.236276◦ N, 14.369875◦ E) (Figure 1). The possible existence of a verylarge underwater explosive volcano, together with some encouraging clues that point to Marsili asan important and potential long-lasting-renewable energy resource [29], has reinforced research andexploitation efforts in this area. The existence of an active magmatic chamber at about 2.5 km belowthe summit was proposed on the basis of petrologic studies of basalts [30], and it is compatible withgravimetric and magnetic data modeling [31], as well as geochemical observations on the summit [32].We monitored this area by a sampling stop above the crater of the volcano.
2.4. Phlegraean Fields
Solfatara, a crater located within the Phlegraean Fields (458 m a.s.l.; 40.8271◦ N, 14.1391◦ E),a quaternary volcanic complex near Naples (Figure 1), is renowned for its vigorous, low-temperaturedegassing. Indeed, the term Solfatara is applied to many similar manifestations found in other volcanicregions of the world. The hottest fumaroles at Solfatara reach temperatures of 140–160 ◦C. Previousstudies indicate that gas emissions are dominated by H2O, followed by CO2 and H2S [33]. In this area,sampling was performed at two different sites (labeled as Phlegraean Fields (1) and Phlegraean Fields(2)) along the direction of the inland Solfatara crater at a distance of about 1 km.
2.5. Vulcano
The volcanic island of Vulcano is the southernmost of the seven islands forming the EolianArchipelago in the Tyrrhenian Sea north of Sicily (500 m a.s.l.; 38.4041◦ N, 14.9621◦ E). Since the lasteruption of Vulcano in 1888–1890, a vigorous fumarole field has been developed in the summit crater,known as La Fossa. Numerous geochemical investigations have focused on Vulcano, especially sinceincreases in gas fluxes and temperatures were observed in the 1970s. Similarly to the Solfatara site,Vulcano does not have magma on the surface but its fumaroles reach high temperatures, well over 300 ◦Cat some vents. In Vulcano, we sampled at two sites labeled as Vulcano (1) and Vulcano (2) (Figure 1).
2.6. Ischia
Ischia (40.7352◦ N, 13.8517◦ E) is the westernmost active volcanic complex of the Campania areaand belongs to the Phlegraean volcanic district, which also includes Phlegraean Fields (Figure 1).In Ischia, the last eruption took place in 1301, and since that time, several earthquakes affected theisland. Thermal manifestations characterize Ischia including thermal waters and fumaroles, whichhave been well known since Roman times and are the main economic resource of the island at present.The fumarolic activity is mainly concentrated along the faults affecting Mt. Epomeo (789 m a.s.l.), aresurgent block in the central part of the island. In this area, we performed aerosol sampling in a sitelabeled Ischia (Figure 1).

Atmosphere 2020, 11, 149 5 of 19
2.7. Panarea
Panarea Island (Eolian Archipelago) lies in the western sector of a submarine 120 m deep platformconstituting the 56 km2 wide summit of a 2000 m high seamount (38.6369◦ N, 15.1026◦ E) (Figure 1).Close to Panarea, a group of islets (Dattilo, Panarelli, Lisca Bianca, Bottaro, Lisca Nera, and Le Formiche)forms an archipelago that surrounds a submerged fumarolic area, which is characterized by relativelyshallow depth (<35 m), hosting gas, and thermal water discharges. Geochemical studies of fluids fromthe submarine fumarolic field of this area started in the early 1990s [34], and were then fostered bythe gas burst event that occurred on 3 November 2002 [35]. One sampling site, labeled Panarea, wasselected offshore as a monitoring point.
3. Experiments
3.1. Sampling and Laboratory Analysis
The aerosol sampling equipment was fixed on the deck at about 30 m above the sea level on thefront of the ship to avoid contamination from the ship exhaust. Daily 24-h ambient PM10 and PM2.5
samples were collected on quartz fiber filters of 47 mm in diameter (2500 QAT-UP, Pallflex®, Putnam,CT, USA) using a low volume sampler Echo PM (, TCR Tecora, Cogliate, Italy) operating at a flow of2.3 m3 h−1. In accordance with the European Standard UNI EN 12341:2014, filters were conditionedfor 48 h before and after sampling, at a temperature and relative humidity of 20 ± 1 ◦C and 50 ± 5%,respectively. The conditioned filters were weighed using a microbalance Crystal Micro (Gibertini,Novate, Italy) in order to determine the mass of both the PM fractions by standard gravimetricprocedures, whereupon the filters were analyzed for the determination of the chemical composition.The analysis of the carbonaceous fraction of aerosol (TC = OC + EC) was performed on a 1 cm2 portionof each filter by a thermal-optical transmission (TOT) technique using an OC/EC Analyzer (SunsetLaboratory Company, Tigard, OR, USA) and following the EUSAAR-II temperature protocol [36].Briefly, the small punch of the filter was subjected to two stepwise heating cycles, which favoredthe volatilization and combustion processes of the carbonaceous material. The evolved carbon wasconverted to methane and subsequently detected by a flame ionization detector (FID) during bothtemperature cycles, which occurred in a non-oxidizing and oxidizing atmosphere, respectively. Laserlight of 670 nm continuously monitored the transmittance through the sample filter in order to correctfor pyrolyzed OC conversion to EC.
Chemical characterization of PM samples was performed by Inductively Coupled Plasma AtomicEmission Spectrometry (iCAP 6500, Thermo Scientific) for major elements (Al, Ca, Na, Mg, K, Fe, P, S)and Inductively Coupled Plasma Mass Spectrometry (iCAP-RQ, Thermo Scientific) for trace elements(Li, Ti, V, Cr, Mn, Co, Ni, Cu, Zn, As, Se, Rb, Sr, Cd, Sn, Sb, Ba, La, Ce, Hf, Pb, Bi, Th, U). Half ofeach filter was acid digested with a mixture of HF:HNO3:HClO4 (2.5:1.25:1.25 mL) in a Teflon reactorfor 9 h at a temperature of 90 ◦C. Each digested sample was driven to dryness, re-dissolved with1.25 mL HNO3, and made up to a final volume of 25 mL with ultrapure water [37]. Relative analyticalerrors were estimated using a small amount (15 mg) of the NIST-1633b (fly ash) reference materialloaded on a 1
4 quartz fiber filter. Individual uncertainties were calculated taking into account theanalytical uncertainty and the standard deviations of the element concentrations in the blank filters [38].Since the portions of the PM2.5 filters for the sites Acireale, Panarea, and Vulcano (2) were contaminatedduring the storage, we discarded these samples before the chemical analysis for major and traceelements. For the quantification of ammonium by ion-selective electrode (Orion 9512HPBNWP ofThermo Scientific) and soluble ions, such as sulfate, nitrite, nitrate, fluoride, bromide, chloride, andphosphate, by ion chromatography (Aquion, Thermo Scientific), the leftover filter was water leached in20 mL sealed PVC bottles (for 14 h at 60 ◦C), preceded by an ultrasonic bath of 15 min. Sulfur dioxide(SO2) measurements were performed using a Teledyne UV Fluorescence SO2 Analyzer (API Model100EU) with a sampling flow rate of 0.6 L min−1 and a time resolution of 1 min. A particle samplingcassette system (SKC, inlet diameter 1/8 inch), which housed transmission electron microscope (TEM)

Atmosphere 2020, 11, 149 6 of 19
grids attached to filter support pads (25 mm in diameter), was used to collect particles for offlinecharacterization following a similar procedure described elsewhere [39,40]. The system utilized anSKC Leland pump that was operated at a flow of 5 L min−1 for a duration of 4 h. The grids (AgarScientific Quantifoil 200 Mesh Au) were analyzed offline for morphological and physicochemicalparticle characterization using a Field Emission Scanning Electron Microscope (JEDL J-7100) coupledwith an energy-dispersive X-ray spectroscopy (EDS; retroscattered electron detector) spectrometer.
3.2. Chemical Mass Closure
For the purpose of mass closure, the chemical components were grouped as sea salt (ss), mineraldust, organic matter and elemental carbon (OM + EC), secondary inorganic aerosols (SIA), and traceelements. Each of these components can originate from a variety of sources, some of which play asignificant role in their production.
As regards to the sea salt component, six major ions represent more than 99% of the mass of saltsdissolved in seawater: four cations, i.e., sodium (ss-Na+), magnesium (ss-Mg2+), calcium (ss-Ca2+), andpotassium (ss-K+), and two anions, chloride (ss-Cl−) and sulfate (ss-SO4
2−). Thus, sea salt concentrationwas calculated from Equation (1) [41].
[Sea salt] = [ss-Na+] + [ss-Cl−] + [ss-Mg2+] + [ss-K+] + [ss-Ca2+] + [ss-SO42−] (1)
To calculate the sea salt sodium [ss-Na+], the value of non-sea salt sodium (nss-Na) was subtractedfrom the total Na value ([ss-Na+] = [Na] − [nss-Na]) resulting from the chemical analysis. The [nss-Na]value was obtained from the Al concentration multiplied by the Na/Al ratio in the average crustalcomposition [42]. Based on the seawater composition, the sea salt sulfate [ss−SO4
2−] is calculated as0.2509 times [ss-Na+], sea salt calcium [ss-Ca2+] calculated as 0.038 times [ss-Na+], sea salt potassium[ss-K+] as 0.037 times [ss-Na+], and sea salt magnesium [ss-Mg2+] calculated as 0.1187 times [ss-Na+].For [ss-Cl−], although the unavoidable reaction of NaCl particles with the atmospheric traces of acidicspecies including H2SO4 and HNO3 can lead to the volatilization of Cl− as HCl [37]; thus, determiningthe underestimation of SS component, it can be reasonably assumed that [ss-Cl−] is approximatelyequal to the total [Cl-] in a marine environment. As a consequence, the [Cl-] was used in the estimationof [sea salt].
Mineral dust is generated from the suspension of the minerals constituting the soil and can beexpressed as the sum of the most common oxide forms [37]. In our study, dust content was estimatedusing Equation (2) as the sum of the concentrations of Al, Ca, Mg, K, Fe, P, and Ti, each multiplied byfactors to convert them to their common oxides and SiO2, calculated multiplying [Al2O3] by 2.5.
[Dust] = [Al2O3] + [CaO] + [MgO] + [K2O] + [Fe2O3] + [P2O5] + [TiO2] + [SiO2] (2)
EC was obtained from thermal-optical analysis (as described in Section 3.1), while the OMcontribution, which accounts for the unmeasured H, O, N, and S in organic compounds, was calculatedaccording to Equation (3), which considers also the influence of the water-soluble organic carbon(WSOC) on the mass, that for non-urban aerosol is about 40% of the OC mass.
OM = f × OC (3)
In this equation, OC was experimentally determined by thermal-optical analysis while the fmultiplier is a coefficient that is not site- or time-specific. Depending on the extent of OM oxidationand secondary organic aerosol (SOA) formation, values for f vary from 1.2 for fresh aerosol in urbanareas [43] to 2.6 for aged aerosol [44–46]. The conversion factor f is usually taken in the range from1.4 for urban aerosols to 1.8 for remote aerosols. Turpin et al. revisited these conversion factors andproposed values of 1.6 ± 0.2 and 2.1 ± 0.2 for urban and non-urban aerosols, respectively [46]. Basedon the previous consideration, the f value was set at 2.1 for the calculations in our work.

Atmosphere 2020, 11, 149 7 of 19
The secondary inorganic aerosol was calculated as the sum of non-sea-salt [SO42−], [NO3
−], and[NH4
+]. Sulfate, in turn, is made by a component in both sea salt and non-sea-salt SO42− (ss-SO4
2− andnss-SO4
2−) derived from the atmosphere. With our investigation being in the marine environment, thenon-sea-salt sulfate was calculated as [nss-SO4
2−] = [SO42−] − 0.25094 [Na+], based on [SO4
2−]/[Na+]molar ratio in seawater [37,47,48].
The last contribution to the PM mass closure, which derives from trace elements, was obtained asthe sum of the trace element concentrations. The sum of all the above determinations accounted for 81.9%and 83.0% of the PM10 and PM2.5 average mass, respectively. The remaining undetermined mass canbe attributed to the structural and adsorbed water that is not removed during the sample conditioning.
3.3. Data Analysis and Receptor Modeling
In order to characterize the daily atmospheric scenarios influencing PM levels, we used severalcomplementary tools to interpret the different sources of air masses in the studied area. We calculatedair mass backward trajectories using the US NOAA HYSPLIT model [49] with GDAS meteorologicaldata. The occurrence of African dust outbreaks was also confirmed by the same tools coupled withthe information of the NAAPS aerosol maps from the Naval Research Laboratory, USA (NRL) (NavyAerosol Analysis and Prediction System) and the BSC-DREAM dust maps [50]. Enrichment factors(EFs) and factor analysis (FA) were used for source identification and apportionment of particulateair pollutants at receptor sites, whereas linear discriminant analysis (LDA) was exploited to performsupervised pattern recognition analysis using the chemical descriptors of PM samples according totheir volcanic (Vo) or solfatara (So) origin.
The calculation of EFs is useful to rank the enrichment degree of an element compared to a knownsource; in this case, the Al concentration was considered as the basis for comparison. EF is defined asthe ratio between the concentration of an element i (Ei
sample) and that of a reference element (Alsample) inthe sample, normalized to the same ratio in the Earth’s crust [42]. Specifically, for each element i, theEFi was calculated according to Equation (4).
EFi =Ei
sample/Alsample
Eivolc/Alvolc
(4)
where volc refers to the volcanic rocks (basalt and lava in this case), which were considered as thegeogenic source. In our study, the EFi in Etna and Stromboli plumes was calculated using the aluminumas normalizing element, while the average Etnean lava [23] and the Stromboli basalt [51] were used,respectively, as reference material.
Factor analysis (FA) is widely used to determine the number of independent sources that contributeto the system and elemental source profiles. The association of the factors with the source type ispossible by comparing the elements with the highest loading within each component with the elementscommonly emitted by recognized source types. In our work, the whole dataset was subjected tofactor analysis using the software Statistica (StatSoft,) and Varimax rotation was applied to assure themaximum differentiation between the factors. The number of potential factors was limited to eight,but only six factors were obtained.
Linear discriminant analysis (LDA) is a chemometric tool that defines a set of delimiters thatdivide the multivariate space of the samples into as many subspaces as the number of the classes.Discriminant functions are computed as a linear combination of variables that maximizes the ratio ofvariance between categories to variance within categories. An essential restriction in the application ofLDA concerns the ratio between the number of samples and the number of variables. Indeed, it isrecommended that the number of samples is at least three times the number of variables to obtaina robust model. Therefore, in our study, a stepwise approach (S-LDA) was used for the selection ofthe variables with a major discriminant power. The S-LDA was used to differentiate between the PMsamples collected in the volcanic (Vo) and solfatara (So) sites on the basis of their chemical composition.

Atmosphere 2020, 11, 149 8 of 19
The dataset was slightly different from that used for FA because, for LDA, the variables that can beassociated exclusively with an anthropogenic origin (Mo, EC, and OC) were not included in the dataset.Furthermore, the Acireale sample was excluded because it was affected by the Saharan Dust Outbreak(SDO), as pointed out from chemical characterization (see Section 4.2). Partial Wilks’ λ values wereused to figure out the variables that actually contributed to differentiation, i.e., the closer to zero itsvalue is, the higher is the discriminatory importance of this variable in the model.
4. Results and Discussions
4.1. Meteorological Conditions
The trends of temperature, pressure, and wind speed recorded during the cruise by the on-boardinstrumentation are illustrated in Figure S1. During all the sampling days, the absence of precipitations,low wind intensity (with the maximum speed being 13.5 m s−1), and a mean atmospheric temperatureof 26.1 ◦C characterized the local weather. Information on wind direction and intensity are reportedfor each sampling site by the wind rose diagrams (Figure S2). Based on the average daily wind speedvalues and the Beaufort wind scale, we encountered light breeze for eight sampling days and gentlebreeze for four sampling days. The atmospheric pressure exhibited the lowest average values andthe largest variability between 1 September and 4 September 2017, with a minimum on 2 September,associated with episodes of strong wind and rough sea that forced us to stop in the Harbor of LipariIsland to shelter from the bad weather. The NCEP/NCAR Reanalysis [52] tool shows the compositemeans and anomalies of the sea level pressure over the Mediterranean basin during the campaign,supporting the worsening of the weather (Figure S3). Indeed, while in August the expansion of theAzores Anticyclone characterized the synoptic conditions in line with seasonal climatology in theMediterranean, on 2 September the anticyclonic system was confined over the Atlantic Ocean andNorth of Europe, thus favoring the development of low-pressure systems across Eastern Europe andthe Mediterranean basin.
4.2. Percentage Chemical Composition of PM
The mass concentration values for PM10 and PM2.5 recorded during the campaign ranged between12.3 and 30.7 µg m−3 and 9.4 and 18.3 µg m−3, respectively (Figure 2). The PM10 concentration in eachsite was lower than the daily limit value of 50 µg m-3, as set by the Directive 2015/1480/EC on ambientair quality. It is known that natural episodes, although they occur less frequently than anthropicones, can influence air quality especially in the surroundings of marine areas and zones with tectonicactivity [2]. The percentage chemical composition of the PM samples collected during the cruise issummed up in Table S1 and illustrated in Figure 2.
For the PM10, the main components were carbonaceous (OM + EC) and mineral dust aerosols,with average contributions of 27.2% and 26.6%, respectively. The dust load reached a peak of 44.7%at Acireale, owing to a North African dust outbreak as confirmed by NAAPS, BSC-DREAM, andbackward trajectories maps presented in Figure S4. The carbonaceous fraction was above the 20% forthe whole campaign with the maximum amount of 38.3%, which was found in Phlegraean Fields (1)and may be due to the interception of air masses moving from the urbanized coast near the samplingarea, which is characterized by high vehicular traffic. This assumption is supported by the levelsof EC (0.95 µg m−3) and OC (3.64 µg m−3), which were found at their highest concentrations at thisstop. The SIA component had an average mass contribution to PM10 of 19.9% with a maximum of26.3% at Stromboli (2). Trace elements and sea salt contributed marginally to the mass, with tracersthat accounted for less than 1% and sea salt for about 10%. We detected the maximum value oftrace elements in the Ischia sample, where it represented 1.6% of PM10 mass. The relatively lowcontribution of sea salt compared to what can be expected in a marine atmosphere may be attributedto the stable weather encountered for most of the campaign, except for rough sea and strong blowingwind arose at Vulcano (2), where we recorded a higher percentage of the sea salt component (23.7%).

Atmosphere 2020, 11, 149 9 of 19
Indeed, the occurrence of substantial sea spray production needs wind with an intensity and durationstrong enough to allow its formation [53]. For PM2.5, the component prevailing on average was thecarbonaceous aerosols (35.3%), which reached the maximum value in the Phlegraean Fields (1) (56.2%),thus reinforcing the preceding hypothesis involving the vehicular traffic contribution in this area.For SIA, the average loading reached 24.7%, thereby showing that its components (i.e., SO4
2−, NH4+,
and NO3-) prevailed in the PM2.5 [37,54]. In both fractions, the maximum value of SIA was obtained in
the sample Stromboli (2), where the upwind sampling (wind roses presented in Figure S2) led to abetter interception of volcanic emissions characterized by high SO2 values, which affected the increaseof SO4
2− concentration because of its reaction with the atmospheric water and the condensation onparticles. In support of this, as showed in the time series plots of SO2 (Figure S5), we recorded a peakof SO2 at this site, which lasted for about 5 h during that sampling day. As expected, the averagemineral dust contribution was smaller in PM2.5 than in PM10 (17.6% and 25.6%, respectively), with thehighest value reached in Acireale because of the SDO (Figure S4). Average sea salt contribution toPM2.5 was 4.3%, with the maximum value in Marsili (10.7%), while the trace elements were averagelyhigher in PM2.5 (1.2%) than PM10 (0.9%), with the maximum values recorded in Phlegraean Fields (1)and Phlegraean Fields (2) (1.4% and 1.6%, respectively).
Atmosphere 2020, 11, x FOR PEER REVIEW 8 of 19
The trends of temperature, pressure, and wind speed recorded during the cruise by the on-board instrumentation are illustrated in Figure S1. During all the sampling days, the absence of precipitations, low wind intensity (with the maximum speed being 13.5 m s−1), and a mean atmospheric temperature of 26.1 °C characterized the local weather. Information on wind direction and intensity are reported for each sampling site by the wind rose diagrams (Figure S2). Based on the average daily wind speed values and the Beaufort wind scale, we encountered light breeze for eight sampling days and gentle breeze for four sampling days. The atmospheric pressure exhibited the lowest average values and the largest variability between 1 September and 4 September 2017, with a minimum on 2 September, associated with episodes of strong wind and rough sea that forced us to stop in the Harbor of Lipari Island to shelter from the bad weather. The NCEP/NCAR Reanalysis [52] tool shows the composite means and anomalies of the sea level pressure over the Mediterranean basin during the campaign, supporting the worsening of the weather (Figure S3). Indeed, while in August the expansion of the Azores Anticyclone characterized the synoptic conditions in line with seasonal climatology in the Mediterranean, on 2 September the anticyclonic system was confined over the Atlantic Ocean and North of Europe, thus favoring the development of low-pressure systems across Eastern Europe and the Mediterranean basin.
4.2. Percentage Chemical Composition of PM
The mass concentration values for PM10 and PM2.5 recorded during the campaign ranged between 12.3 and 30.7 µg m−3 and 9.4 and 18.3 µg m−3, respectively (Figure 2). The PM10 concentration in each site was lower than the daily limit value of 50 µg m-3, as set by the Directive 2015/1480/EC on ambient air quality. It is known that natural episodes, although they occur less frequently than anthropic ones, can influence air quality especially in the surroundings of marine areas and zones with tectonic activity [2]. The percentage chemical composition of the PM samples collected during the cruise is summed up in Table S1 and illustrated in Figure 2.
Figure 2. Chemical composition (as a percentage) and mass concentration of particles (expressed in µg m−3) of the PM10 and PM2.5 samples. Figure 2. Chemical composition (as a percentage) and mass concentration of particles (expressed in µgm−3) of the PM10 and PM2.5 samples.
4.3. Volcanic Areas
There are several studies reporting the relevance of volcanic emissions as sources of metal-bearinggases and PM into the atmosphere [51,54–57]. A previous study revealed that volcanogenic tracemetals are injected in the atmosphere as volatile elements, emitted from the silicate melt during magmadegassing, and later dispersed in atmospheric plumes as sub-micron sized volcanic aerosols andlow volatile (refractory or lithophile) elements, transported via coarse volcanic ash fragments [23].The volcanic area monitored during the campaign, as previously discussed, included Etna and
Atmosphere 2020, 11, 149 10 of 19
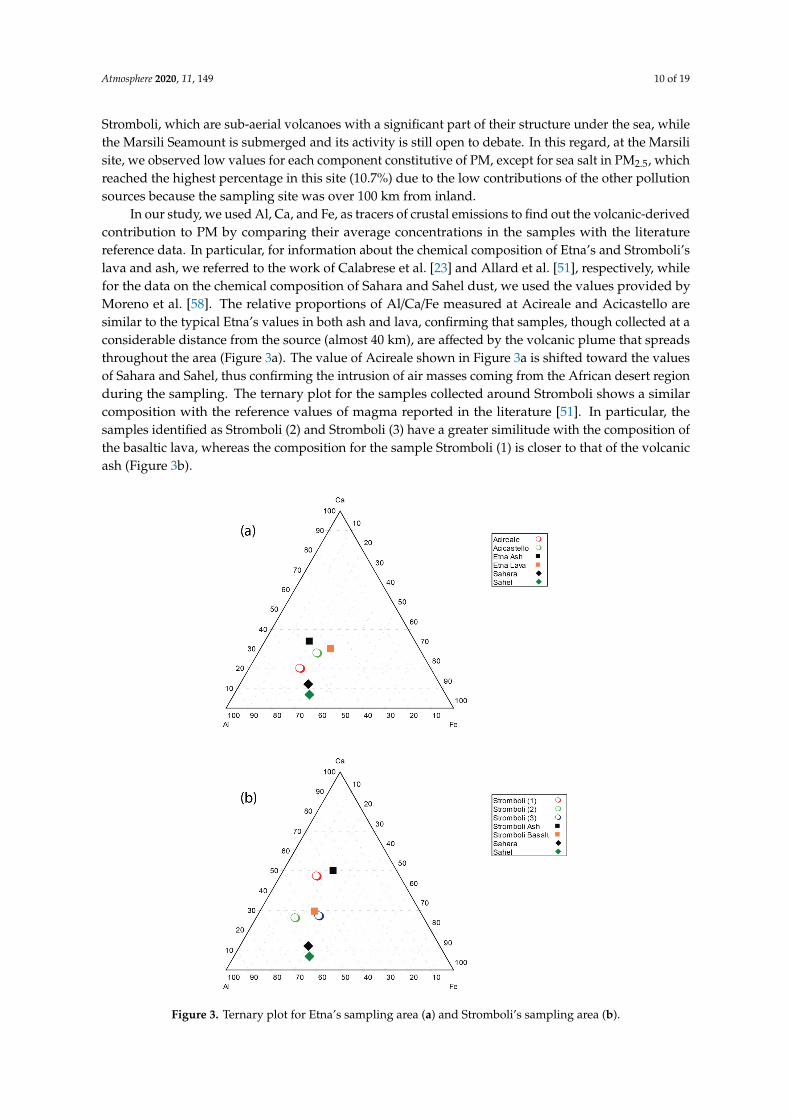
Stromboli, which are sub-aerial volcanoes with a significant part of their structure under the sea, whilethe Marsili Seamount is submerged and its activity is still open to debate. In this regard, at the Marsilisite, we observed low values for each component constitutive of PM, except for sea salt in PM2.5, whichreached the highest percentage in this site (10.7%) due to the low contributions of the other pollutionsources because the sampling site was over 100 km from inland.
In our study, we used Al, Ca, and Fe, as tracers of crustal emissions to find out the volcanic-derivedcontribution to PM by comparing their average concentrations in the samples with the literaturereference data. In particular, for information about the chemical composition of Etna’s and Stromboli’slava and ash, we referred to the work of Calabrese et al. [23] and Allard et al. [51], respectively, whilefor the data on the chemical composition of Sahara and Sahel dust, we used the values provided byMoreno et al. [58]. The relative proportions of Al/Ca/Fe measured at Acireale and Acicastello aresimilar to the typical Etna’s values in both ash and lava, confirming that samples, though collected at aconsiderable distance from the source (almost 40 km), are affected by the volcanic plume that spreadsthroughout the area (Figure 3a). The value of Acireale shown in Figure 3a is shifted toward the valuesof Sahara and Sahel, thus confirming the intrusion of air masses coming from the African desert regionduring the sampling. The ternary plot for the samples collected around Stromboli shows a similarcomposition with the reference values of magma reported in the literature [51]. In particular, thesamples identified as Stromboli (2) and Stromboli (3) have a greater similitude with the composition ofthe basaltic lava, whereas the composition for the sample Stromboli (1) is closer to that of the volcanicash (Figure 3b).
Atmosphere 2020, 11, x FOR PEER REVIEW 10 of 19
volcanic plume that spreads throughout the area (Figure 3a). The value of Acireale shown in Figure 3a is shifted toward the values of Sahara and Sahel, thus confirming the intrusion of air masses coming from the African desert region during the sampling. The ternary plot for the samples collected around Stromboli shows a similar composition with the reference values of magma reported in the literature [51]. In particular, the samples identified as Stromboli (2) and Stromboli (3) have a greater similitude with the composition of the basaltic lava, whereas the composition for the sample Stromboli (1) is closer to that of the volcanic ash (Figure 3b).
Figure 3. Ternary plot for Etna’s sampling area (a) and Stromboli’s sampling area (b).
Besides, the load of the volcanic plume aerosol in the sampled PM was investigated through the calculation of the enrichment factors, which is a useful tool to highlight the enrichment or depletion degree of an element in a geochemical medium relative to reference material. Although the use of EFs could hide some flaws, such as the variable composition of the reference material, or inadequate choice of the element used to normalize the data [59], it provides a first-order insight on the geogenic or anthropogenic origin of the elements. Based on the results of the ternary plot, we calculated the EFs for Acicastello and Stromboli (3), which are the samples identified as those with the greatest volcanic contribution. EFs were computed according to Equation (4) using Al as a reference element because it is a low volatile element at magmatic conditions, and also one of the most immobile elements during the weathering of basalts [60]. Values of EF close to one indicate that there is no enrichment occurring for an element in sampled PM compared to the expected abundance in volcanic basalt. EFs far exceeding one characterize volatile elements enriched in the plume because of their affinity for the magmatic vapor phase or might indicate an anthropogenic origin. Despite some
Figure 3. Ternary plot for Etna’s sampling area (a) and Stromboli’s sampling area (b).

Atmosphere 2020, 11, 149 11 of 19
Besides, the load of the volcanic plume aerosol in the sampled PM was investigated through thecalculation of the enrichment factors, which is a useful tool to highlight the enrichment or depletiondegree of an element in a geochemical medium relative to reference material. Although the use ofEFs could hide some flaws, such as the variable composition of the reference material, or inadequatechoice of the element used to normalize the data [59], it provides a first-order insight on the geogenicor anthropogenic origin of the elements. Based on the results of the ternary plot, we calculated the EFsfor Acicastello and Stromboli (3), which are the samples identified as those with the greatest volcaniccontribution. EFs were computed according to Equation (4) using Al as a reference element because it isa low volatile element at magmatic conditions, and also one of the most immobile elements during theweathering of basalts [60]. Values of EF close to one indicate that there is no enrichment occurring foran element in sampled PM compared to the expected abundance in volcanic basalt. EFs far exceedingone characterize volatile elements enriched in the plume because of their affinity for the magmaticvapor phase or might indicate an anthropogenic origin. Despite some peculiarities, the EFs for thesamples Stromboli (3) and Acicastello are overall consistent. The EFs illustrated in Figure S6 suggestthat, for both volcanoes, the elements can be grouped into four categories according to the EF values.The strongly enriched elements in PM (EFs > 100) were those with a marked volcanic-volatile characteror anthropogenic origin species (i.e., Sn, Sb, Cr, Se). The enriched elements such as Ni, Zn, U, As, Pb,and Tl were those with EFs ranging from 10 to 100, while the elements with EF ≈ 1–10 such as Cu, K,Ba, Rb, and some rare earth elements including Th, Sm, Ce, and La were associated with a geogenicorigin. The elements with EFs < 1, such as Co, Ti, Mg, and Sr, can be considered depleted elementscompared to geogenic elements and indicate a local geological reduction relative to volcanic rocks.The volatile-anthropogenic species, including Sb, Cr, and Sn, were enriched by two to three orders ofmagnitude in the PM of both volcanic sites. Furthermore, another enriched element was Ni whichmay be related to anthropogenic sources and is commonly associated, together with V, to shippingemissions. Among the enriched elements, the presence of Tl only in the Etna sample pointed out thevolcanic contribution to PM [23].
4.4. Fumarole Areas
Sulfur dioxide is a valuable tracer of degassing processes by geothermal sources such as fumarolesand volcanoes. In this work, we averaged on a daily basis the 1 min recorded data obtained from theSO2 analyzer (Figure S5) in order to allow a direct comparison with the nss-SO4
2− concentration values,as obtained from the analysis of the 24 h PM samples. As a result, we found a strong correlation in bothPM fractions between the nss-SO4
2− levels in the fumarole area with the corresponding average dailylevels of SO2 concentration, thus supporting the hypothesis that local SO2 emissions are importantfor the formation of nss-SO4
2− as reported in Section 4.2 about the SIA. In particular, Figures S7a andS5b illustrate the correlation between the concentrations of SO2 and nss-SO4
2− for each site in bothfractions, with R2 = 0.76 for PM10 and R2 = 0.74 for PM2.5. This correlation is further improved byneglecting the Vulcano (2) sample (Figure S7c,d), thus achieving R2 = 0.95 and R2 = 0.92 for PM2.5
and PM10, respectively. The observed increase in correlation may be due to the different atmosphericconditions that occurred during the sampling in Vulcano (2) when the rough sea and wind gusting mayhave affected the nss-SO4
2− by favoring trapping of SO2 with NaCl reactions. This result is confirmedby the concentration of nss-SO4
2− and SO2 reported in Figure 4, showing the larger gap between thesetwo chemical species in Vulcano (2) compared to Vulcano (1).

Atmosphere 2020, 11, 149 12 of 19
Atmosphere 2020, 11, x FOR PEER REVIEW 12 of 19
Figure 4. Concentration of sulfur dioxide and sulfate ions (expressed as µg m−3) in the fumarolic area. The histogram bars represent SO2 average daily concentrations whereas solid line represents nss-SO42− collected in particulate matter (PM) samples.
As concerns Panarea, although it is a submarine fumarole source, a noteworthy value of both SO2 and nss-SO42− was detected, confirming the interception of fumarole degassing process. On the contrary, the analysis of trace metals did not present a significant contribution in PM of the elements typically emitted by natural sources, since they possibly dissolved in the path from the emission site and the seawater surface.
4.5. Factor Analysis and Source Identification
We used factor analysis, a tool for source identification and apportionment of particulate air pollutants, to characterize the different sources of aerosols during the campaign. We subjected the dataset to Varimax-rotated factor analysis identifying six factors with Eigenvalues greater than one (Table 1). The six factors together explain 96.9% of the total variance of our dataset.
Figure 4. Concentration of sulfur dioxide and sulfate ions (expressed as µg m−3) in the fumarolic area.The histogram bars represent SO2 average daily concentrations whereas solid line represents nss-SO4
2−
collected in particulate matter (PM) samples.
As concerns Panarea, although it is a submarine fumarole source, a noteworthy value of bothSO2 and nss-SO4
2− was detected, confirming the interception of fumarole degassing process. On thecontrary, the analysis of trace metals did not present a significant contribution in PM of the elementstypically emitted by natural sources, since they possibly dissolved in the path from the emission siteand the seawater surface.
4.5. Factor Analysis and Source Identification
We used factor analysis, a tool for source identification and apportionment of particulate airpollutants, to characterize the different sources of aerosols during the campaign. We subjected thedataset to Varimax-rotated factor analysis identifying six factors with Eigenvalues greater than one(Table 1). The six factors together explain 96.9% of the total variance of our dataset.

Atmosphere 2020, 11, 149 13 of 19
Table 1. Varimax-rotated factor loadings for the whole dataset of the Med-Oceanor 2017 campaign.Loadings greater than 0.5 are shown in bold.
Variable Factor1 Factor2 Factor3 Factor4 Factor5 Factor6
PMx 0.5 0.5 0.3 0.2 0.6 −0.3OC 0.8 0.2 0.1 0.2 0.4 0.2EC 0.9 0.2 0.2 −0.1 0.0 −0.1
NH4+
−0.1 −0.1 −0.5 0.2 0.8 0.0Al 0.0 0.9 0.0 0.2 0.2 −0.4Fe 0.4 0.8 0.3 0.1 0.2 −0.1Na 0.1 0.2 0.9 −0.2 −0.2 0.0Cl −0.1 0.2 0.7 −0.1 −0.2 −0.6Ca 0.2 0.2 0.0 0.9 0.1 0.0Mg 0.1 0.6 0.7 0.0 0.1 −0.2P 0.0 0.2 −0.1 1.0 0.1 0.1
nss-SO42− 0.1 0.3 −0.1 0.1 0.9 −0.2
NO3- 0.3 0.0 0.9 -0.1 −0.3 0.0
V 0.4 0.2 −0.4 -0.2 0.7 0.0Cr 0.1 0.8 0.5 -0.1 0.0 0.2Mn 0.7 0.6 −0.2 0.2 0.0 0.2Zn 0.1 −0.1 −0.2 1.0 0.0 0.1As 0.8 −0.3 0.2 0.2 0.2 0.1Sb 1.0 0.1 0.1 0.0 0.0 0.1
REEs 0.7 −0.1 0.0 0.0 −0.1 0.6Pb 0.9 0.3 0.0 0.1 0.0 0.3Zr 0.3 −0.1 −0.2 0.2 −0.3 0.9
Eigenvalues 5.7 3.8 3.7 3.1 2.8 2.1%Var 25.9 17.5 17.0 14.3 12.8 9.4
%Cum 25.9 43.4 60.4 74.7 87.5 96.9
• Factor 1: Anthropogenic (pollution). It can be referred to as anthropogenic sources because it hashigh loadings for carbonaceous material (EC, OC), As, Sb, and Pb. This result found a match withintensive vehicular traffic observed during the sampling at the Phlegraean Fields area and is inaccordance with the findings reported in Section 4.2.
• Factor 2: Mineral (e.g., soil, African dust, etc.). This factor is characterized by high loadings forAl, Fe, Mg, Cr, and Mn, and can be associated at the first geogenic source (mineral sources) sincethese elements are common in the crust, basalt of volcanoes, and also in African dust.
• Factor 3: Aged sea salt (marine aerosol). NO3− was added in the FA to describe that this is aged
and not fresh sea salt [37,61], indicating that the sampling was not biased by the source of seaspray (limited freshly emitted sea salt particles).
• Factor 4: Factor with unsure attribution. Due to the presence of Zn, it may be attributed to thefumarolic sources [62,63].
• Factor 5: Shipping emissions. This factor can be attributed to the shipping emissions because ithas high loadings of PMx, nss-SO4
2−, NH4+ and V. The vanadium indeed is used as a tracer of
shipping emission [64].• Factor 6: Rare earth elements. The sixth factor represents a second potential geogenic source
characterized by high loadings of Zr and REEs coming from volcanic ash. Anti-correlated with Cl.
4.6. SEM/EDX Analysis
SEM/EDX analysis is utilized as a complementary tool for the quantitative chemical analysis (ICP).The elemental characteristics of aerosols are apportioned based on the respective sources. SEM/EDXconfirms that particles with the specified compositions were present in the sampling area and theirmorphology is defined. Aerosols with a composition common for volcanic particles (e.g., SiO2, Mg, andFe) have been observed, indicating that they may have originated from the volcanic plume (Figure 5a,d).

Atmosphere 2020, 11, 149 14 of 19
The anthropogenic factor has influenced the sampling (Figure 5f,j) and consequently the experimentalresults both in terms of chemical and microscopy analysis interpretation (i.e., factor and SEM analysis).In agreement with FA, aged sea salt (g) and several minerals were also observed.
Atmosphere 2020, 11, x FOR PEER REVIEW 14 of 19
SiO2, Mg, and Fe) have been observed, indicating that they may have originated from the volcanic plume (Figure 5a,d). The anthropogenic factor has influenced the sampling (Figure 5f,j) and consequently the experimental results both in terms of chemical and microscopy analysis interpretation (i.e., factor and SEM analysis). In agreement with FA, aged sea salt (g) and several minerals were also observed.
Figure 5. Representative particles sampled from different areas: (a,b) Acicastello, (c,d) Acireale, (e–g) Marsili, (h–k), Phlegraean Fields (1), (l) Stromboli (1).
4.7. Stepwise Linear Discriminant (S-LDA) Analysis
To seek which variables best discriminate among samples coming from volcanoes (Vo) and solfatara (So), we performed stepwise linear discriminant analysis (S-LDA). The forward S-LDA (F to enter = 5.00 and F to remove = 4.00) retained six elements, namely Zr, As, Hf, Bi, Ca, and Zn, that allowed the construction of a model with satisfactory statistical parameters (Wilks’ λ = 0.09560; F (6, 13) = 20.497; p < 0.00001). The low Wilks’ λ values suggest that the model is highly discriminating, while the low p-level value shows that the classification, which resulted correct for all the samples, occurred with high reliability. Based on the partial Wilks’ λ, Zn (0.38) is the independent variable that contributes most to the discrimination, followed by Ca (0.50). The scatterplot of canonical scores (Figure S8) on the discriminant function shows the separation between the groups of the volcanic samples (Vo), with negative root values ranging from −4.38 to −1.56 and the solfatara samples (So) with positive root values in the range between 1.39 and 4.69. We found the predominant presence of Zn in solfatara samples, in accordance to Dekov et al. [32], which detected this element in the aerosol of sulfur-rich sites such as Panarea or other fumarole areas because of its presence as sphalerite (ZnS).
Figure 5. Representative particles sampled from different areas: (a,b) Acicastello, (c,d) Acireale, (e–g)Marsili, (h–k), Phlegraean Fields (1), (l) Stromboli (1).
4.7. Stepwise Linear Discriminant (S-LDA) Analysis
To seek which variables best discriminate among samples coming from volcanoes (Vo) andsolfatara (So), we performed stepwise linear discriminant analysis (S-LDA). The forward S-LDA (F toenter = 5.00 and F to remove = 4.00) retained six elements, namely Zr, As, Hf, Bi, Ca, and Zn, thatallowed the construction of a model with satisfactory statistical parameters (Wilks’ λ = 0.09560; F (6, 13)= 20.497; p < 0.00001). The low Wilks’ λ values suggest that the model is highly discriminating, whilethe low p-level value shows that the classification, which resulted correct for all the samples, occurredwith high reliability. Based on the partial Wilks’ λ, Zn (0.38) is the independent variable that contributesmost to the discrimination, followed by Ca (0.50). The scatterplot of canonical scores (Figure S8) on thediscriminant function shows the separation between the groups of the volcanic samples (Vo), withnegative root values ranging from −4.38 to −1.56 and the solfatara samples (So) with positive rootvalues in the range between 1.39 and 4.69. We found the predominant presence of Zn in solfatarasamples, in accordance to Dekov et al. [32], which detected this element in the aerosol of sulfur-rich sitessuch as Panarea or other fumarole areas because of its presence as sphalerite (ZnS). On the contrary, the

Atmosphere 2020, 11, 149 15 of 19
elements Hf and Zr contribute most to characterize volcanic samples. The presence of Hf and Zr agreeswith the study of metal emissions from the Stromboli volcano by Allard et al. [51]. Indeed, Hf is one ofthe elements degassed from magmas as halides, sulfates, sulfides, and/or metals, and is typically foundin the aerosol phase of the airborne plume, while the presence of Zr in volcanic samples can be due toits transport through volcanic ash, supporting the evidence previously obtained from factor analysis.
5. Conclusions
In this study, we investigated the impact of volcanic and fumarole sources on PM level and itschemical characteristics in the central Mediterranean Sea. Aerosol samples in marine atmospherewere collected during the research cruise campaign Med-Oceanor 2017 off the coast of the main activevolcanic and fumarolic areas in the Mediterranean Sea, which included Mount Etna, the Eolian volcanicarc, Marsili Seamount, and the Phlegraean Fields. The mass concentration of collected PM10 resulted,for each site, lower than the daily limit set by the European legislation. The PM10 and PM2.5 sampleswere characterized by quantification of major and trace elements, ionic species, as well as elemental andorganic carbon content. These chemical data were illustrated by descriptive statistics, histograms, andthen analyzed by the computation of mass closure, enrichment factors, factor analysis, and correlationanalysis with the support of the daily SO2 values. The PM10 mainly consisted of carbonaceous materialand dust, which together made up over 50% of the mass, while carbonaceous fraction and SIA, whichreached 60% of the mass, prevalently composed the PM2.5. The trace element was the less abundantcontributor with an average amount of about 1% in both PM fractions. From the EFs, we found that theparticulate from the volcanic areas resulted enriched by Tl, Cu, La, Se, As, and alkali metals, whereasthe chemical characterization of PM in fumarole areas showed a good correlation between the sulfurdioxide gas, emitted from fumaroles and sulfate ion, coming from the SO2 reaction with water andcondensation on particles. FA allowed for the identification of six potential sources that contributeto the PM composition, some of which have a natural origin such as volcanic, marine, and geogenicemissions, while other sources are anthropogenic, such as combustion processes, vehicular traffic,and shipping emissions. The SEM/EDX analysis on the sampled PM confirmed the influence of thesesources identified with the FA. Stepwise linear discriminant analysis (S-LDA), which was used to seekfor a model capable to discriminate between the sample of volcanic and fumarolic origin, pointedout the elements that discriminate the most between these two classes, namely Hf and Zr for volcanosamples and Zn and Ca for solfatara samples.
Further investigation on this topic could be addressed in future research for a more thoroughassessment of the impact of the volcanic and fumarolic emission on the air quality of the MediterraneanSea. In this regard, the use of a high-volume sampler would allow sampling the PM with sufficientsensitivity even with a few hours of collection, thus improving the temporal profile of the impact.Similarly, further advancement of the study would be given by the use of cascade impactors, whosedata could provide new insight to strengthen the characterization of the marine atmosphere in theneighborhood of volcanoes and fumaroles.
Supplementary Materials: The following are available online at http://www.mdpi.com/2073-4433/11/2/149/s1,Figure S1: Hourly mean meteorological data; Temperature and Pressure (up) and wind speed (down), FigureS2: Wind roses for sampling points, Figure S3: NCEP/NCAR reanalysis maps (mean and anomaly) of the periodfrom the start of the campaign to 31 August (up) and 2 September (down), Figure S4: Acireale maps NAAPS, airmass back trajectory and BSC-Dream, Figure S5: Time series plot of SO2 for each of the sampling sites; Y-axis:concentration (ppb), X-axis: sampling time (hours), Figure S6: Enrichment Factors for Etna (Acicastello sample)and Stromboli (Stromboli (3) sample). Dashed lines highlight thresholds for EFs = 10 and EFs = 100, FigureS7: Correlation between SO2 and nss-SO4
2− (as µg m−3) in PM10 and PM2.5. The plots (a) and (b) comprise allthe sampling points, whereas the Vulcano (2) sample is excluded in (c) and (d) plots the plots., Figure S8: LDAscatterplot for aerosol samples collected in volcanic (Vo) or solfatara (So) sites, Table S1: Percentage chemicalcomposition of PM10 and PM2.5 in each sampling site.
Author Contributions: S.M., Conceptualization, investigation, writing—original draft preparation, writing—review and editing; A.S., investigation, writing—review and editing; X.Q., conceptualization, supervision; A.T.,conceptualization, writing—original draft preparation, writing—review and editing; V.A., investigation; M.B.,

Atmosphere 2020, 11, 149 16 of 19
conceptualization; N.P., funding acquisition; F.S., funding acquisition, supervision; A.N., conceptualization,writing—review and editing, supervision, All authors have read and agreed to the published version ofthe manuscript.
Funding: This research was funded by the European Commission—H2020, the ERA-PLANET programme(www.era-planet.eu; contract no. 689443) within the IGOSP project (www.igosp.eu).
Acknowledgments: The authors are grateful to Valentino Mannarino and Giulio Esposito for the logistic supportin the Med-Oceanor campaign.
Conflicts of Interest: The authors declare no conflicts of interest.
References
1. Lelieveld, J.; Evans, J.S.; Fnais, M.; Giannadaki, D.; Pozzer, A. The contribution of outdoor air pollutionsources to premature mortality on a global scale. Nature 2015, 525, 367–371. [CrossRef]
2. Viana, M.; Pey, J.; Querol, X.; Alastuey, A.; de Leeuw, F.; Lükewille, A. Natural sources of atmosphericaerosols influencing air quality across Europe. Sci. Total Environ. 2014, 472, 825–833. [CrossRef]
3. Naccarato, A.; Tassone, A.; Moretti, S.; Elliani, R.; Sprovieri, F.; Pirrone, N.; Tagarelli, A. A green approachfor organophosphate ester determination in airborne particulate matter: Microwave-assisted extractionusing hydroalcoholic mixture coupled with solid-phase microextraction gas chromatography-tandem massspectrometry. Talanta 2018, 189, 657–665. [CrossRef]
4. Naccarato, A.; Elliani, R.; Sindona, G.; Tagarelli, A. Multivariate optimization of a microextraction by packedsorbent-programmed temperature vaporization-gas chromatography–tandem mass spectrometry methodfor organophosphate flame retardant analysis in environmental aqueous matrices. Anal. Bioanal. Chem. 2017,409, 7105–7120. [CrossRef]
5. Talarico, F.; Brandmayr, P.; Giulianini, P.G.; Ietto, F.; Naccarato, A.; Perrotta, E.; Tagarelli, A.; Giglio, A. Effectsof metal pollution on survival and physiological responses in Carabus (Chaetocarabus) lefebvrei (Coleoptera,Carabidae). Eur. J. Soil Biol. 2014, 61, 80–89. [CrossRef]
6. Aleksandropoulou, V.; Torseth, K.; Lazaridis, M. Contribution of natural sources to PM emissions over themetropolitan areas of athens and Thessaloniki. Aerosol Air Qual. Res. 2015, 15, 1300–1312. [CrossRef]
7. Bencardino, M.; Andreoli, V.; D’Amore, F.; De Simone, F.; Mannarino, V.; Castagna, J.; Moretti, S.; Naccarato, A.;Sprovieri, F.; Pirrone, N. Carbonaceous Aerosols Collected at the Observatory of Monte Curcio in the SouthernMediterranean Basin. Atmosphere 2019, 10, 592. [CrossRef]
8. Bencardino, M.M.; Pirrone, N.N.; Sprovieri, F.F. Aerosol and ozone observations during six cruise campaignsacross the Mediterranean basin: temporal, spatial, and seasonal variability. Environ. Sci. Pollut. Res. 2014, 21,4044–4062. [CrossRef] [PubMed]
9. Beuck, H.; Quass, U.; Klemm, O.; Kuhlbusch, T.A.J. Assessment of sea salt and mineral dust contributionsto PM10 in NW Germany using tracer models and positive matrix factorization. Atmos. Environ. 2011, 45,5813–5821. [CrossRef]
10. Dinoi, A.; Cesari, D.; Marinoni, A.; Bonasoni, P.; Riccio, A.; Chianese, E.; Tirimberio, G.; Naccarato, A.;Sprovieri, F.; Andreoli, V.; et al. Inter-comparison of carbon content in PM2.5 and PM10 collected at fivemeasurement sites in Southern Italy. Atmosphere 2017, 8, 243. [CrossRef]
11. Liora, N.; Poupkou, A.; Giannaros, T.M.; Kakosimos, K.E.; Stein, O.; Melas, D. Impacts of natural emissionsources on particle pollution levels in Europe. Atmos. Environ. 2016, 137, 171–185. [CrossRef]
12. Masson, O.; Piga, D.; Gurriaran, R.; D’Amico, D. Impact of an exceptional Saharan dust outbreak in France:PM10 and artificial radionuclides concentrations in air and in dust deposit. Atmos. Environ. 2010, 44,2478–2486. [CrossRef]
13. Querol, X.; Pey, J.; Pandolfi, M.; Alastuey, A.; Cusack, M.; Pérez, N.; Moreno, T.; Viana, M.; Mihalopoulos, N.;Kallos, G.; et al. African dust contributions to mean ambient PM10 mass-levels across the MediterraneanBasin. Atmos. Environ. 2009, 43, 4266–4277. [CrossRef]
14. Bencardino, M.; Sprovieri, F.; Cofone, F.; Pirrone, N. Variability of atmospheric aerosol and ozoneconcentrations at marine, urban, and high-altitude monitoring stations in southern Italy during the2007 summer Saharan dust outbreaks and wildfire episodes. J. Air Waste Manag. Assoc. 2011, 61, 952–967.[CrossRef] [PubMed]

Atmosphere 2020, 11, 149 17 of 19
15. Pey, J.; Alastuey, A.; Querol, X. PM10and PM2.5sources at an insular location in the western mediterraneanby using source apportionment techniques. Sci. Total Environ. 2013, 456, 267–277. [CrossRef]
16. O’Dowd, C.D.; de Leeuw, G. Marine aerosol production: a review of the current knowledge. Philos. Trans. R.Soc. A Math. Phys. Eng. Sci. 2007, 365, 1753–1774. [CrossRef] [PubMed]
17. Faustini, A.; Alessandrini, E.R.; Pey, J.; Perez, N.; Samoli, E.; Querol, X.; Cadum, E.; Perrino, C.; Ostro, B.;Ranzi, A.; et al. Short-term effects of particulate matter on mortality during forest fires in Southern Europe:Results of the MED-PARTICLES project. Occup. Environ. Med. 2015, 72, 323–329. [CrossRef]
18. von Glasow, R. Atmospheric chemistry in volcanic plumes. Proc. Natl. Acad. Sci. 2010, 107, 6594–6599.[CrossRef]
19. Helbert, J. Fumarole. In Encyclopedia of Astrobiology; Gargaud, M., Amils, R., Quintanilla, J.C., Cleaves, H.J.,Irvine, W.M., Pinti, D.L., Viso, M., Eds.; Springer Berlin Heidelberg: Berlin, Germany, 2011; p. 617, ISBN978-3-642-11274-4.
20. Intergovernmental Panel on Climate Change Summary for Policymakers. In Climate Change 2013 - The PhysicalScience Basis; Intergovernmental Panel on Climate Change (Ed.) Cambridge University Press: Cambridge,UK, 2013; pp. 1–30, ISBN 9788578110796.
21. Arndt, J.; Calabrese, S.; D’Alessandro, W.; Planer-Friedrich, B. Using mosses as biomonitors to study traceelement emissions and their distribution in six different volcanic areas. J. Volcanol. Geotherm. Res. 2017, 343,220–232. [CrossRef]
22. Bagnato, E.; Aiuppa, A.; Andronico, D.; Cristaldi, A.; Liotta, M.; Brusca, L.; Miraglia, L. Leachate analysesof volcanic ashes from Stromboli volcano: A proxy for the volcanic gas plume composition? J. Geophys.Res. Atmos. 2011, 116, 1–17. [CrossRef]
23. Calabrese, S.; Aiuppa, A.; Allard, P.; Bagnato, E.; Bellomo, S.; Brusca, L.; D’Alessandro, W.; Parello, F.Atmospheric sources and sinks of volcanogenic elements in a basaltic volcano (Etna, Italy). Geochim.Cosmochim. Acta 2011, 75, 7401–7425. [CrossRef]
24. Chouet, B.; Dawson, P.; Ohminato, T.; Martini, M.; Saccorotti, G.; Giudicepietro, F.; De Luca, G.; Milana, G.;Scarpa, R. Source mechanisms of explosions at Stromboli Volcano, Italy, determined from moment-tensorinversions of very-long-period data. J. Geophys. Res. Solid Earth 2003, 108, ESE 7-1–ESE 7-25. [CrossRef]
25. Castagna, J.; Bencardino, M.; D’Amore, F.; Esposito, G.; Pirrone, N.; Sprovieri, F. Atmospheric mercuryspecies measurements across the Western Mediterranean region: Behaviour and variability during a 2015research cruise campaign. Atmos. Environ. 2018, 173, 108–126. [CrossRef]
26. Pirrone, N.; Ferrara, R.; Hedgecock, I.M.; Kallos, G.; Mamane, Y.; Munthe, J.; Pacyna, J.M.; Pytharoulis, I.;Sprovieri, F.; Voudouri, A.; et al. Dynamic processes of mercury over the Mediterranean region: Resultsfrom the Mediterranean Atmospheric Mercury Cycle System (MAMCS) project. Atmos. Environ. 2003, 37,21–39. [CrossRef]
27. Chester, D.K.; Duncan, A.M.; Guest, J.E.; Kilburn, C.R.J. Mount Etna; Springer: Dordrecht, The Netherlands,1986; ISBN 978-94-010-8309-6.
28. Finizola, A.; Sortino, F.; Lénat, J.F.; Aubert, M.; Ripepe, M.; Valenza, M. The summit hydrothermal system ofStromboli. New insights from self-potential, temperature, CO2 and fumarolic fluid measurements, withstructural and monitoring implications. Bull. Volcanol. 2003, 65, 486–504. [CrossRef]
29. Italiano, F.; De Santis, A.; Favali, P.; Rainone, M.; Rusi, S.; Signanini, P.; Italiano, F.; De Santis, A.; Favali, P.;Rainone, M.L.; et al. The Marsili Volcanic Seamount (Southern Tyrrhenian Sea): A Potential OffshoreGeothermal Resource. Energies 2014, 7, 4068–4086. [CrossRef]
30. Trua, T.; Serri, G.; Marani, M.; Renzulli, A.; Gamberi, F. Volcanological and petrological evolution of MarsiliSeamount (southern Tyrrhenian Sea). J. Volcanol. Geotherm. Res. 2002, 114, 441–464. [CrossRef]
31. Caratori Tontini, F.; Cocchi, L.; Muccini, F.; Carmisciano, C.; Marani, M.; Bonatti, E.; Ligi, M.; Boschi, E.Potential-field modeling of collapse-prone submarine volcanoes in the southern Tyrrhenian Sea (Italy).Geophys. Res. Lett. 2010, 37, 1–5. [CrossRef]
32. Dekov, V.M.; Kamenov, G.D.; Savelli, C.; Stummeyer, J. Anthropogenic Pb component in hydrothermalochres from Marsili Seamount (Tyrrhenian Sea). Mar. Geol. 2006, 229, 199–208. [CrossRef]
33. Chiodini, G.; Avino, R.; Brombach, T.; Caliro, S.; Cardellini, C.; De Vita, S.; Frondini, F.; Granirei, D.;Marotta, E.; Ventura, G. Fumarolic and diffuse soil degassing west of Mount Epomeo, Ischia, Italy. J. Volcanol.Geotherm. Res. 2004, 133, 291–309. [CrossRef]

Atmosphere 2020, 11, 149 18 of 19
34. Italiano, F.; Nuccio, P.M. Geochemical investigations of submarine volcanic exhalations to the east of Panarea,Aeolian Islands, Italy. J. Volcanol. Geotherm. Res. 1991, 46, 125–141. [CrossRef]
35. Caracausi, A.; Ditta, M.; Italiano, F.; Longo, M.; Nuccio, P.M.; Paonita, A.; Rizzo, A. Changes in fluidgeochemistry and physico-chemical conditions of geothermal systems caused by magmatic input: The recentabrupt outgassing off the island of Panarea (Aeolian Islands, Italy). Geochim. Cosmochim. Acta 2005, 69,3045–3059. [CrossRef]
36. Cavalli, F.; Viana, M.; Yttri, K.E.; Genberg, J.; Putaud, J.P. Toward a standardised thermal-optical protocol formeasuring atmospheric organic and elemental carbon: The EUSAAR protocol. Atmos. Meas. Tech. 2010, 3,79–89. [CrossRef]
37. Querol, X.; Alastuey, A.; Rodriguez, S.; Plana, F.; Ruiz, C.R.; Cots, N.; Massagué, G.; Puig, O. PM10 andPM2.5 source apportionment in the Barcelona Metropolitan area, Catalonia, Spain. Atmos. Environ. 2001, 35,6407–6419. [CrossRef]
38. Amato, F.; Pandolfi, M.; Escrig, A.; Querol, X.; Alastuey, A.; Pey, J.; Perez, N.; Hopke, P.K.K. Quantifying roaddust resuspension in urban environment by Multilinear Engine: A comparison with PMF2. Atmos. Environ.2009, 43, 2770–2780. [CrossRef]
39. Salmatonidis, A.; Ribalta, C.; Sanfélix, V.; Bezantakos, S.; Biskos, G.; Vulpoi, A.; Simion, S.; Monfort, E.;Viana, M. Workplace Exposure to Nanoparticles during Thermal Spraying of Ceramic Coatings. Ann. WorkExpo. Health 2019, 63, 91–106. [CrossRef]
40. Salmatonidis, A.; Viana, M.; Pérez, N.; Alastuey, A.; de la Fuente, G.F.; Angurel, L.A.; Sanfélix, V.; Monfort, E.Nanoparticle formation and emission during laser ablation of ceramic tiles. J. Aerosol Sci. 2018, 126, 152–168.[CrossRef]
41. Seinfeld, J.H.; Pandis, S.N. Atmospheric Chemistry and Physics; From Air Pollution to Climate Change; John Wiley& Sons: New York, NY, USA, 2006; ISBN 978-0-471-72018-8.
42. Mason, B. Principles of geochemistry, 3rd ed.; JohnWiley&Sons, Inc.: New York, NY, USA, 1966.43. Chow, J.C.; Watson, J.G.; Edgerton, S.A.; Vega, E. Chemical composition of PM2.5 and PM10 in Mexico City
during winter 1997. Sci. Total. Environ. 2002, 287, 177–201. [CrossRef]44. Robinson, A.L.; Grieshop, A.P.; Donahue, N.M.; Hunt, S.W. Updating the conceptual model for fine particle
mass emissions from combustion systems. J. Air Waste Manag. Assoc. 2010, 60, 1204–1222. [CrossRef]45. Roy, A.A.; Wagstrom, K.M.; Adams, P.J.; Pandis, S.N.; Robinson, A.L. Quantification of the effects of molecular
marker oxidation on source apportionment estimates for motor vehicles. Atmos. Environ. 2011, 45, 3132–3140.[CrossRef]
46. Turpin, B.J.; Lim, H.-J. Species Contributions to PM2.5 Mass Concentrations: Revisiting Common Assumptionsfor Estimating Organic Mass. Aerosol Sci. Technol. 2001, 35, 602–610. [CrossRef]
47. Cheung, K.; Daher, N.; Kam, W.; Shafer, M.M.; Ning, Z.; Schauer, J.J.; Sioutas, C. Spatial and temporalvariation of chemical composition and mass closure of ambient coarse particulate matter (PM10–2.5) in theLos Angeles area. Atmos. Environ. 2011, 45, 2651–2662. [CrossRef]
48. Mkoma, S.L.; Maenhaut, W.; Chi, X.; Wang, W.; Raes, N. Characterisation of PM10 atmospheric aerosols forthe wet season 2005 at two sites in East Africa. Atmos. Environ. 2009, 43, 631–639. [CrossRef]
49. Stein, A.F.; Draxler, R.R.; Rolph, G.D.; Stunder, B.J.B.; Cohen, M.D.; Ngan, F.; Stein, A.F.; Draxler, R.R.;Rolph, G.D.; Stunder, B.J.B.; et al. NOAA’s HYSPLIT Atmospheric Transport and Dispersion ModelingSystem. Bull. Am. Meteorol. Soc. 2015, 96, 2059–2077. (Hybrid Single-Particle Lagrangian IntegratedTrajectories model). Available online: http://ready.arl.noaa.gov/HYSPLIT.php (accessed on 5 June 2018).[CrossRef]
50. Pérez, C.; Nickovic, S.; Pejanovic, G.; Baldasano, J.M.; Özsoy, E. Interactive dust-radiation modeling: A stepto improve weather forecasts. J. Geophys. Res. Atmos. 2006, 111. (BSC Dust Regional Atmospheric Model).Available online: www.bsc.es/projects/earthscience/DREAM/ (accessed on 5 June 2018). [CrossRef]
51. Allard, P.; Aiuppa, A.; Loyer, H.; Carrot, F.; Gaudry, A.; Pinte, G.; Michel, A.; Dongarrà, G. Acid gas andmetal emission rates during long-lived basalt degassing at Stromboli volcano. Geophys. Res. Lett. 2000, 27,1207–1210. [CrossRef]
52. Kalnay, E.; Kanamitsu, M.; Kistler, R.; Collins, W.; Deaven, D.; Gandin, L.; Iredell, M.; Saha, S.; White, G.;Woollen, J.; et al. The NCEP/NCAR 40-Year Reanalysis Project. Bull. Am. Meteorol. Soc. 1996, 77, 437–471.[CrossRef]

Atmosphere 2020, 11, 149 19 of 19
53. Laussac, S.; Piazzola, J.; Tedeschi, G.; Yohia, C.; Canepa, E.; Rizza, U.; Van Eijk, A.M.J. Development of afetch dependent sea-spray source function using aerosol concentration measurements in the North-WesternMediterranean. Atmos. Environ. 2018, 193, 177–189. [CrossRef]
54. Mather, T.A.; Oppenheimer, C.; Allen, A.G.; McGonigle, A.J.S. Aerosol chemistry of emissions from threecontrasting volcanoes in Italy. Atmos. Environ. 2004, 38, 5637–5649. [CrossRef]
55. Aiuppa, A.; Dongarrà, G.; Valenza, M.; Federico, C.; Pecoraino, G. Degassing of Trace Volatile Metals DuringThe 2001 Eruption of Etna. In Geophysical Monograph Series; American Geophysical Union: Washington, DC,USA, 2003; Volume 139, pp. 41–54, ISBN 9781118668542.
56. Allen, A.G.; Mather, T.A.; McGonigle, A.J.S.; Aiuppa, A.; Delmelle, P.; Davison, B.; Bobrowski, N.;Oppenheimer, C.; Pyle, D.M.; Inguaggiato, S. Sources, size distribution, and downwind grounding ofaerosols from Mount Etna. J. Geophys. Res. Atmos. 2006, 111, 1–10. [CrossRef]
57. Bagnato, E.; Aiuppa, A.; Parello, F.; Calabrese, S.; D’Alessandro, W.; Mather, T.A.; McGonigle, A.J.S.;Pyle, D.M.; Wängberg, I. Degassing of gaseous (elemental and reactive) and particulate mercury from MountEtna volcano (Southern Italy). Atmos. Environ. 2007, 41, 7377–7388. [CrossRef]
58. Moreno, T.; Querol, X.; Castillo, S.; Alastuey, A.; Cuevas, E.; Herrmann, L.; Mounkaila, M.; Elvira, J.;Gibbons, W. Geochemical variations in aeolian mineral particles from the Sahara-Sahel Dust Corridor.Chemosphere 2006, 65, 261–270. [CrossRef] [PubMed]
59. Reimann, C.; De Caritat, P. Intrinsic flaws of element enrichment factors (EFs) in environmental geochemistry.Environ. Sci. Technol. 2000, 34, 5084–5091. [CrossRef]
60. Aiuppa, A.; Allard, P.; D’Alessandro, W.; Michel, A.; Parello, F.; Treuil, M.; Valenza, M. Mobility and fluxes ofmajor, minor and trace metals during basalt weathering and groundwater transport at Mt. Etna volcano(Sicily). Geochim. Cosmochim. Acta 2000, 64, 1827–1841. [CrossRef]
61. Piazzola, J.; Mihalopoulos, N.; Canepa, E.; Tedeschi, G.; Prati, P.; Zarmpas, P.; Bastianini, M.; Missamou, T.;Cavaleri, L. Characterization of aerosols above the Northern Adriatic Sea: Case studies of offshore andonshore wind conditions. Atmos. Environ. 2016, 132, 153–162. [CrossRef]
62. Marani, M.P.; Gamberi, F.; Savelli, C. Shallow-water polymetallic sulfide deposits in the Aeolian island arc.Geology 1997, 25, 815–818. [CrossRef]
63. Savelli, C.; Marani, M.; Gamberi, F. Geochemistry of metalliferous, hydrothermal deposits in the Aeolian arc(Tyrrhenian Sea). J. Volcanol. Geotherm. Res. 1999, 88, 305–323. [CrossRef]
64. Viana, M.; Kuhlbusch, T.A.J.; Querol, X.; Alastuey, A.; Harrison, R.M.; Hopke, P.K.; Winiwarter, W.; Vallius, M.;Szidat, S.; Prévôt, A.S.H.; et al. Source apportionment of particulate matter in Europe: A review of methodsand results. J. Aerosol Sci. 2008, 39, 827–849. [CrossRef]
© 2020 by the authors. Licensee MDPI, Basel, Switzerland. This article is an open accessarticle distributed under the terms and conditions of the Creative Commons Attribution(CC BY) license (http://creativecommons.org/licenses/by/4.0/).
Recommended