Copyright © 2009 Pearson Addison-Wesley. All rights reserved.
Chapter 8
Inflation: Its Causes and Cures

Copyright © 2009 Pearson Addison-Wesley. All rights reserved. 8-2
Definition: Inflation
• Inflation is a sustained upward movement in the aggregate price level that is shared by most products.– The price level is notated P
– Inflation is notated p = %∆P
• The Core Inflation Rate is the inflation rate for all products and services other than food and energy.– The Federal Reserve target core inflation rate is about
2%.

Copyright © 2009 Pearson Addison-Wesley. All rights reserved. 8-3
The Output Ratio and Inflation
• The Output Ratio is the ratio of actual real GDP to natural real GDP (i.e. Y/YN ).– If Y/YN = 100%, p is constant
– If Y/YN > 100%, p is accelerating
– If Y/YN < 100%, p is decelerating
• What affects the output ratio?– A Demand Shock is a sustained acceleration or deceleration in
AD, measured most directly as a sustained acceleration or deceleration in the growth of nominal GDP.
– A Supply Shock is caused by a sharp change in the price of an important commodity (e.g. oil) that causes the inflation rate to rise or fall in the absence of demand shocks.
Copyright © 2009 Pearson Addison-Wesley. All rights reserved. 8-4
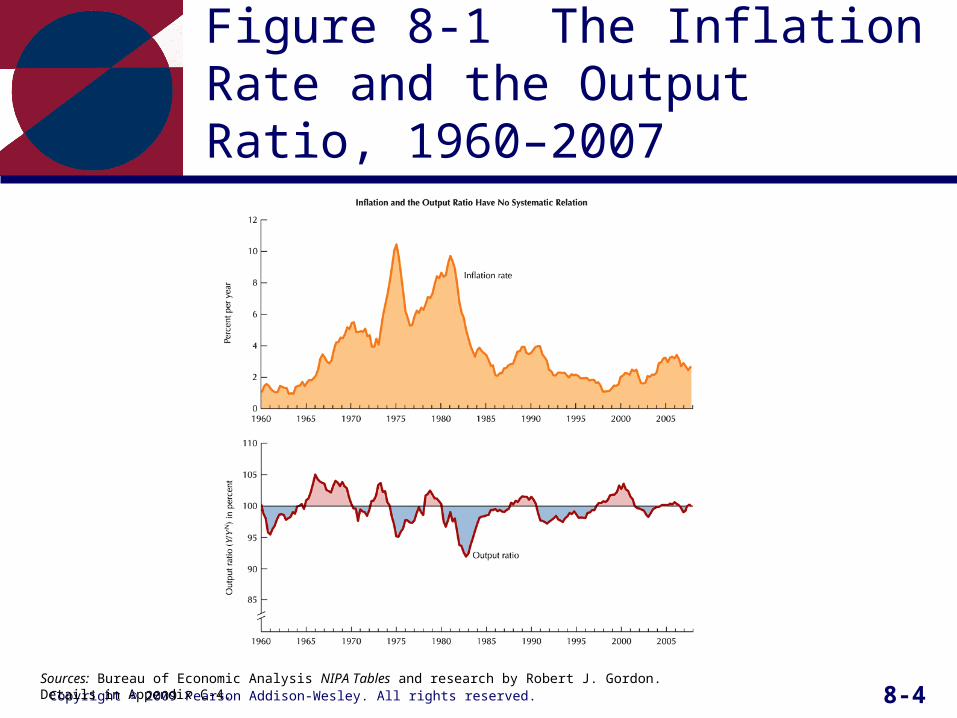
Figure 8-1 The Inflation Rate and the Output Ratio, 1960–2007
Sources: Bureau of Economic Analysis NIPA Tables and research by Robert J. Gordon. Details in Appendix C-4.

Copyright © 2009 Pearson Addison-Wesley. All rights reserved. 8-5
Temporary vs. Continuous Inflation
• A one-shot increase in AD will cause only temporary inflation as the output ratio rises above 100% and pushes up wages causing the SAS curve to shift back.
• A continuous increase in AD can potentially cause continued inflation as wages rise (shifting back the SAS curve) together with continued shifts to the right of the AD curve.

Copyright © 2009 Pearson Addison-Wesley. All rights reserved. 8-6
The Phillips Curve
• The Short-Run Phillips (SP) Curve is the schedule relating the inflation rate and real GDP given a fixed expected rate of inflation.– The Expected Rate of Inflation (pe) is the rate of inflation that is
expected to occur in the future.
– The SP Curve is also known as the Expectations-Augmented Phillips Curve because it shifts its position whenever there is a change in the expected rate of inflation.
• The Long-Run Phillips (LP) Curve gives the output ratio when inflation is accurately anticipated (i.e. pe = p).– Since prices and wages are perfectly flexible in the long-run, the LP
curve is a vertical line at Y/YN = 100%.

Copyright © 2009 Pearson Addison-Wesley. All rights reserved. 8-7
Figure 8-2 Relationship of the Short-Run Aggregate Supply (SAS) Curve to the Short-Run Phillips (SP) Curve
Copyright © 2009 Pearson Addison-Wesley. All rights reserved. 8-8
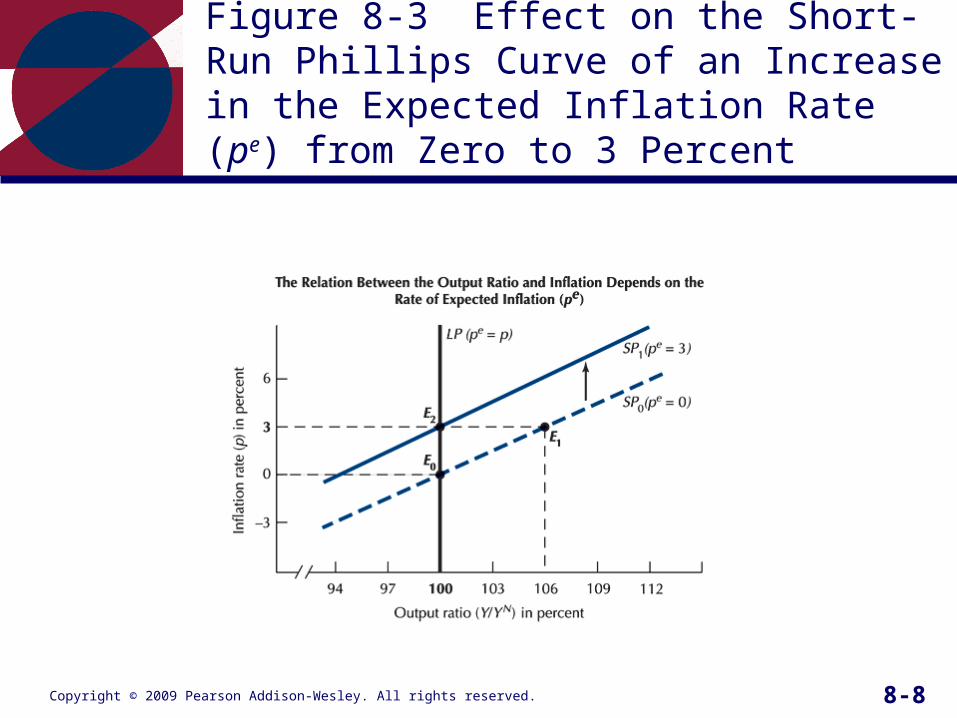
Figure 8-3 Effect on the Short-Run Phillips Curve of an Increase in the Expected Inflation Rate (pe) from Zero to 3 Percent

Copyright © 2009 Pearson Addison-Wesley. All rights reserved. 8-9
Nominal GDP Growth and Inflation
• Recall: Nominal GDP (X) is related to the price level (P) and real GDP (Y) as follows:
X = PY(Note: Lower case letters represent the growth rates of the same variables)
• When is the economy at a long-run equilibrium?– It must be operating on the SP curve.
– Inflation must equal the growth rate of nominal GDP:
x = p real GDP growth = 0
(Or if y > 0 x = p + y)
– The economy must be on the LP line with pe = p.

Copyright © 2009 Pearson Addison-Wesley. All rights reserved. 8-10
Table 8-1 Alternative Divisions of 6 Percent Nominal GDP Growth Between Inflation and Real GDP Growth
Copyright © 2009 Pearson Addison-Wesley. All rights reserved. 8-11
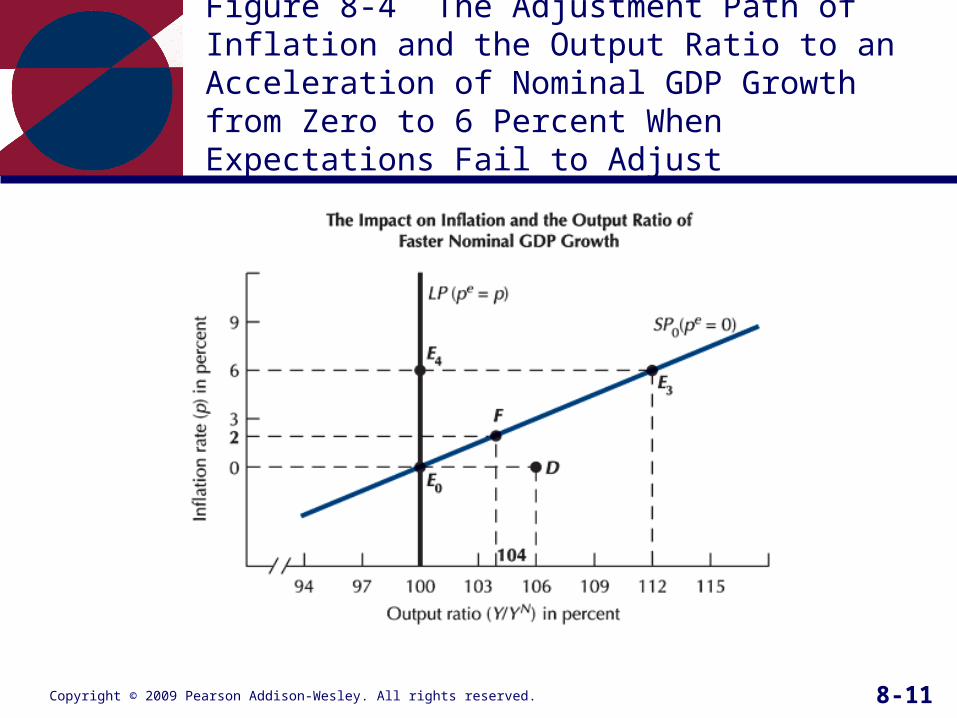
Figure 8-4 The Adjustment Path of Inflation and the Output Ratio to an Acceleration of Nominal GDP Growth from Zero to 6 Percent When Expectations Fail to Adjust

Copyright © 2009 Pearson Addison-Wesley. All rights reserved. 8-12
Figure 8-5 Effect on Inflation and Real GDP of an Acceleration of Demand Growth from Zero to 6 Percent

Copyright © 2009 Pearson Addison-Wesley. All rights reserved. 8-13
Different Types of Expectations
• The speed of adjustment of inflation expectations affects how long Y can be pushed beyond YN.
• 3 Types of Expectations– Forward-looking Expectations attempt to predict
the future behavior of an economic variable using economic models.
– Backward-looking Expectations use only information on the past behavior of economic variables.
– Adaptive Expectations base expectations for next period’s values on an average of actual values during previous periods.

Copyright © 2009 Pearson Addison-Wesley. All rights reserved. 8-14
The Cure for Inflation: Recession
• Theoretically, if an increase in nominal GDP causes inflation, then a recession should do the opposite.– Disinflation is a marked deceleration in the
inflation rate.
• How can disinflation be achieved?– The “Cold Turkey” approach to disinflation operates by
implementing a sudden and permanent slowdown in nominal GDP growth.
• The cost of disinflation is measured by the Sacrifice Ratio, which is the cumulative loss of output incurred during a disinflation divided by the permanent reduction in the inflation rate.
Copyright © 2009 Pearson Addison-Wesley. All rights reserved. 8-15
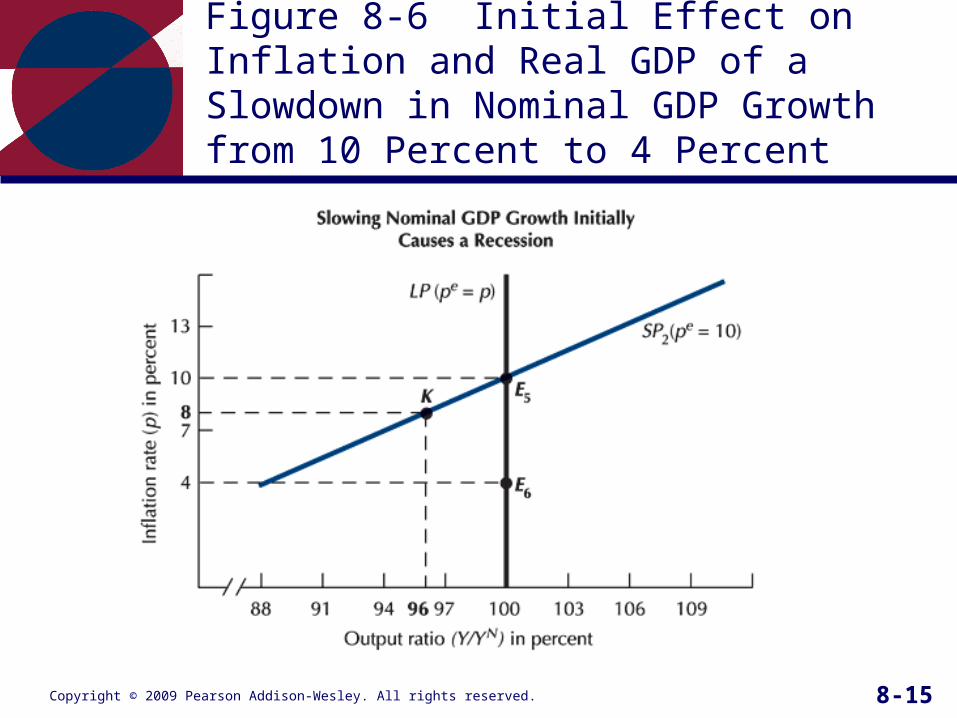
Figure 8-6 Initial Effect on Inflation and Real GDP of a Slowdown in Nominal GDP Growth from 10 Percent to 4 Percent
Copyright © 2009 Pearson Addison-Wesley. All rights reserved. 8-16
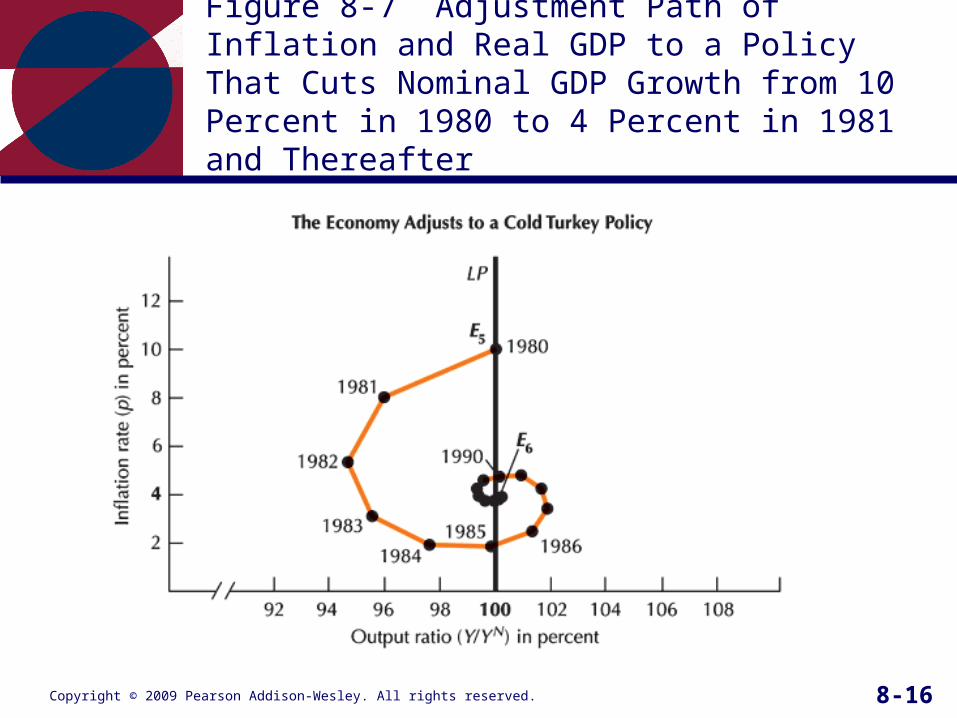
Figure 8-7 Adjustment Path of Inflation and Real GDP to a Policy That Cuts Nominal GDP Growth from 10 Percent in 1980 to 4 Percent in 1981 and Thereafter

Copyright © 2009 Pearson Addison-Wesley. All rights reserved. 8-17
International Perspective: Did Disinflation in Europe Differ from That in the United States?

Copyright © 2009 Pearson Addison-Wesley. All rights reserved. 8-18
Figure 8-8 Four-Quarter Growth Rate of the GDP Deflator and the Level of Nominal and Real Oil Prices, 1970–2007
Sources: Top frame: Bureau of Economic Analysis NIPA Tables. Details in Appendix C-4. Bottom frame: Energy Information Administration Monthly Energy Review. Details in Appendix C-4.
Copyright © 2009 Pearson Addison-Wesley. All rights reserved. 8-19
Demand vs. Supply Inflation
• Demand Inflation is a sustained increase inprices that is preceded by a permanentacceleration of nominal GDP growth.
• Supply Inflation is an increase in prices that stems from an increase in business costs not directly related to prior acceleration of nominal GDP growth.

Copyright © 2009 Pearson Addison-Wesley. All rights reserved. 8-20
Types of Supply Shocks
• Changes in business input costs (like Poil)
• Weather shocks that affect farm prices
• Import price shocks due to fluctuating exchange rates– If the value of the dollar falls, imported goods
become more expensive.
• Productivity growth shocks that change the amount workers can produce

Copyright © 2009 Pearson Addison-Wesley. All rights reserved. 8-21
Figure 8-9 The Effect on the Inflation Rate and the Output Ratio of an Adverse Supply Shock That Shifts the SP Curve Upward by 3 Percent

Copyright © 2009 Pearson Addison-Wesley. All rights reserved. 8-22
Policy Responses to Supply Shocks
• Following a supply shock, there are three possible policy responses:– A Neutral Policy maintains nominal GDP growth so as
to allow a decline in the output ratio equal to the increase in the inflation rate.
– An Accommodating Policy raises nominal GDP growth so as to maintain the original output ratio.
– An Extinguishing Policy reduces nominal GDP growth so as to maintain the original inflation rate.

Copyright © 2009 Pearson Addison-Wesley. All rights reserved. 8-23
Figure 8-10 Effect of Adverse Supply Shock in the 1970s and Beneficial Supply Shocks in the 1990s

Copyright © 2009 Pearson Addison-Wesley. All rights reserved. 8-24
Figure 8-11 Responses of the Inflation Rate (p) and the Output Ratio (Y/YN) to Shifts in Nominal GDP Growth and in the SP Curve (1 of 2)

Copyright © 2009 Pearson Addison-Wesley. All rights reserved. 8-25
Figure 8-11 Responses of the Inflation Rate (p) and the Output Ratio (Y/YN) to Shifts in Nominal GDP Growth and in the SP Curve (2 of 2)

Copyright © 2009 Pearson Addison-Wesley. All rights reserved. 8-26
Figure 8-12 The U.S. Ratio of Actual to Natural Real GDP (Y/YN) and the Unemployment Rate, 1965–2007
Sources: Appendix Table A-1. Bureau of Labor Statistics, Bureau of Economic Analysis, and research by Robert J. Gordon. Details in Appendix C-4.
Copyright © 2009 Pearson Addison-Wesley. All rights reserved. 8-27
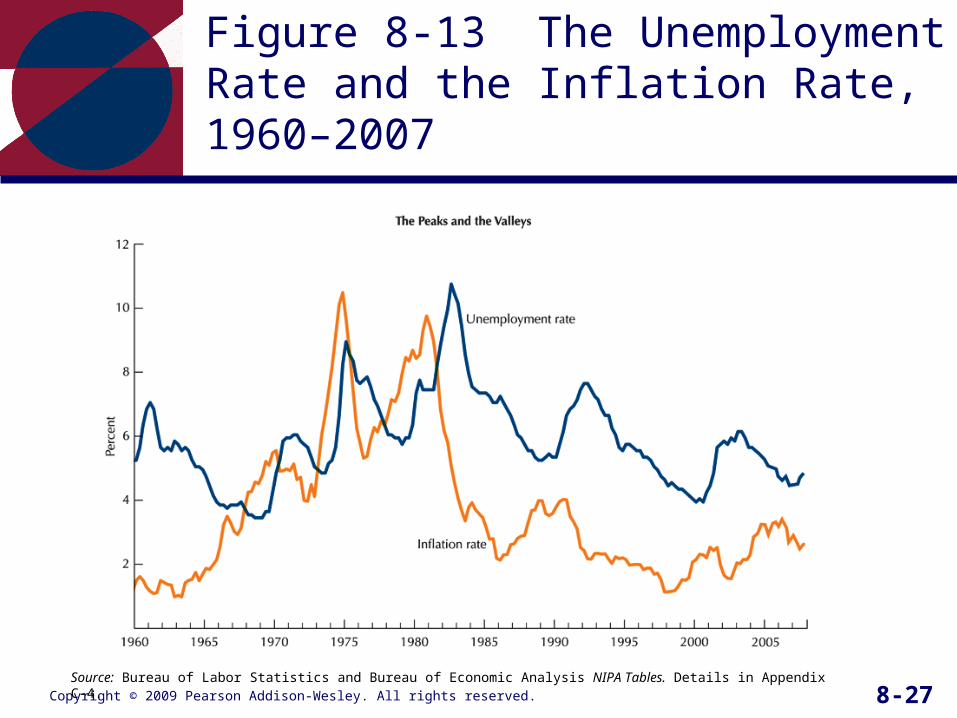
Figure 8-13 The Unemployment Rate and the Inflation Rate, 1960–2007
Source: Bureau of Labor Statistics and Bureau of Economic Analysis NIPA Tables. Details in Appendix C-4.
Copyright © 2009 Pearson Addison-Wesley. All rights reserved. 8-28
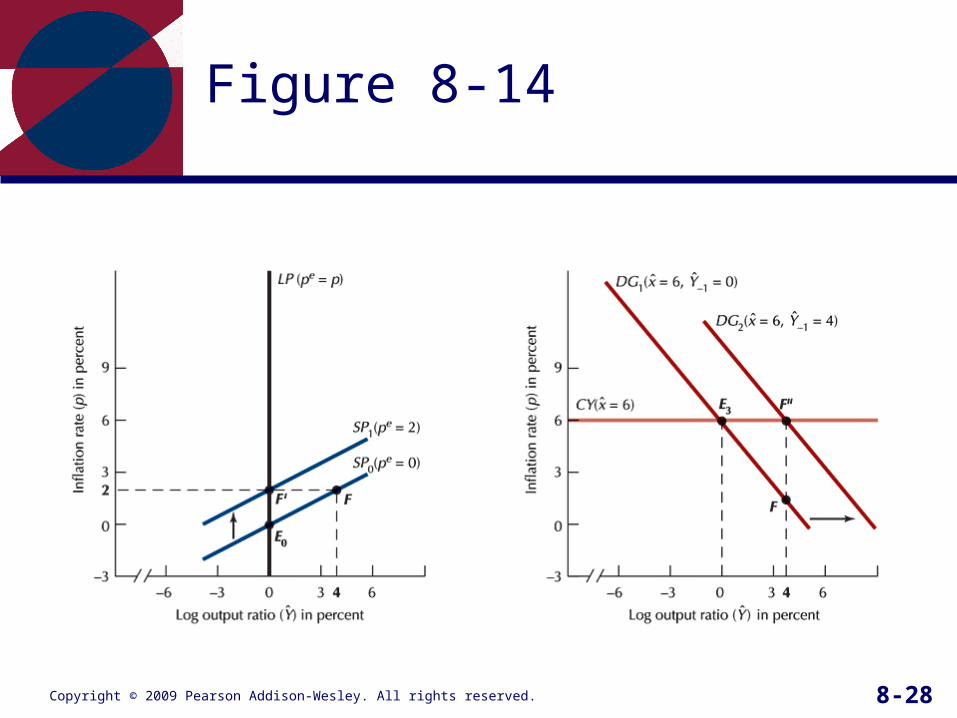
Figure 8-14

Copyright © 2009 Pearson Addison-Wesley. All rights reserved. 8-29
Figure 8-15
Copyright © 2009 Pearson Addison-Wesley. All rights reserved. 8-30
Chapter Equations
Copyright © 2009 Pearson Addison-Wesley. All rights reserved. 8-31
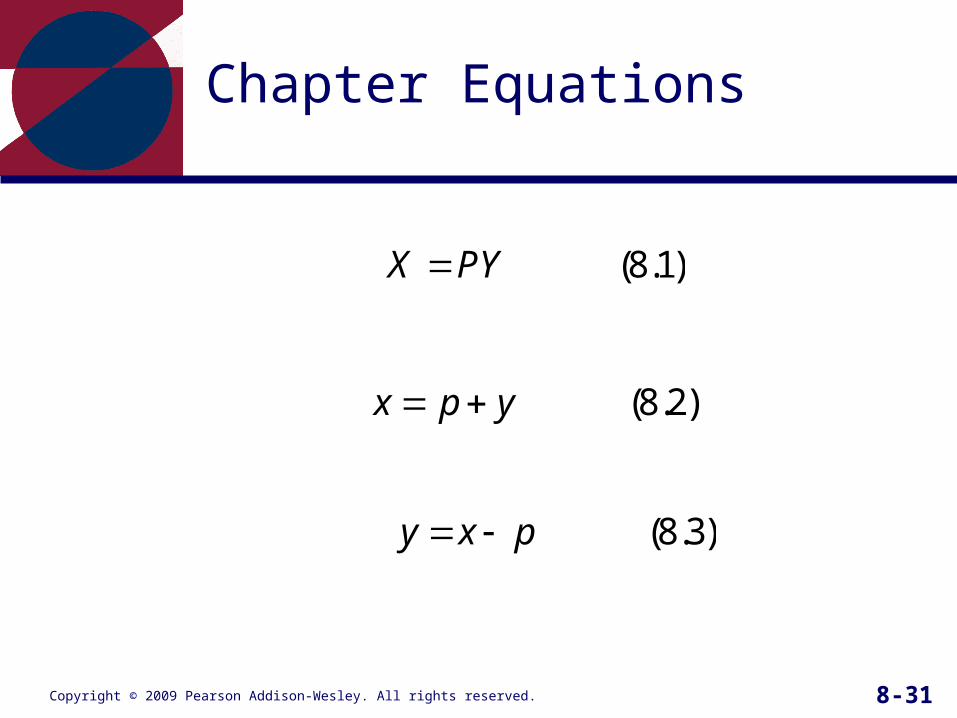
Chapter Equations
(8.1)X PY
(8.2)x p y
(8.3)y x p
Copyright © 2009 Pearson Addison-Wesley. All rights reserved. 8-32
Appendix Equations
General Linear Form Numerical Example
0.5 (1)e ep p gY z p p Y
(4)x p y
(5)N Nx y p y y
1 1 1
General Linear Form Numerical Example
(1 ) (2)e e ep jp j p p p
General Linear Form Numerical Example
0.5 (3)e ep p gY z p p Y
Copyright © 2009 Pearson Addison-Wesley. All rights reserved. 8-33
Appendix Equations
1 (6)x p Y Y
1 (7)Y Y x p
11 1(1 ) ( ) (8)ep jp j p g Y x p z
1 11 1 1
General Linear Form Numerical Example
1 21 0.5 (9)
1 3ep jp j p g Y x z p p Y x
g

Copyright © 2009 Pearson Addison-Wesley. All rights reserved. 8-34
Appendix Equations
11
1(10)
1ep p g Y x z
g
General Linear Form Numerical Example
0.5 (11)N NU U hY U U Y
1 1
General Linear Form Numerical Example
0.5 (12)N NU U h y y U U y y
Recommended