Corrosion and scaling in carbon
steel casing and tubingMarion Seiersten, Institute for Energy Technology
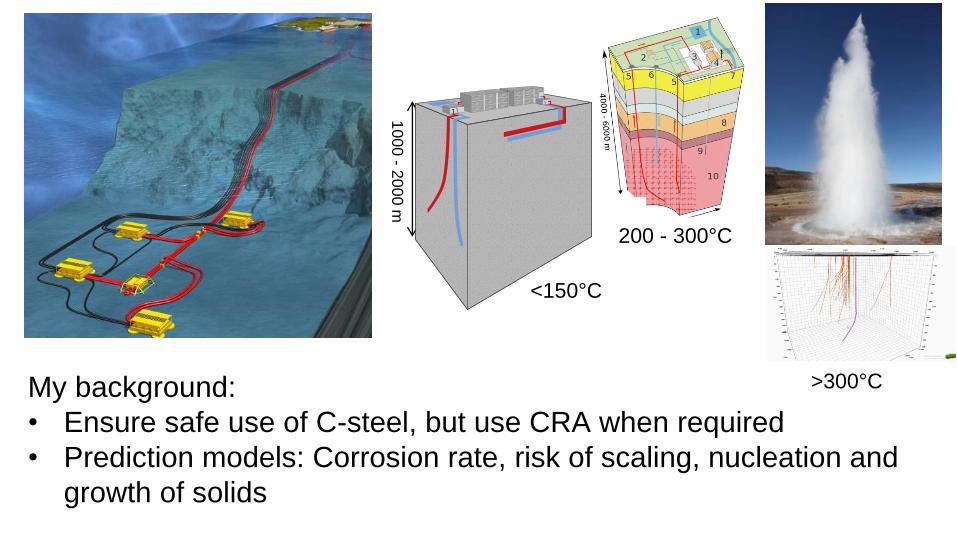
My background:
• Ensure safe use of C-steel, but use CRA when required
• Prediction models: Corrosion rate, risk of scaling, nucleation and
growth of solids
200 - 300°C
<150°C
10
00
-2
00
0 m
>300°C
Outline
Corrosion of carbon steel
• Fundamentals
• Modelling
• Inhibition
Scaling
• How corrosion my affect scaling
Geothermal and oil and gas synergies
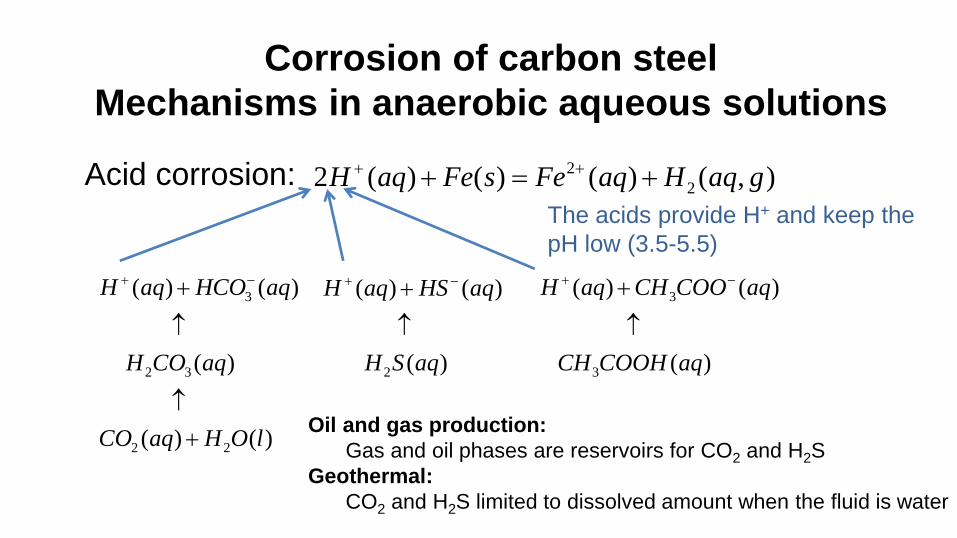
Corrosion of carbon steel
Mechanisms in anaerobic aqueous solutions
Acid corrosion: 2
22 ( ) ( ) ( ) ( , )H aq Fe s Fe aq H aq g
3
2 3
2 2
( ) ( )
( )
( ) ( )
H aq HCO aq
H CO aq
CO aq H O l
2
( ) ( )
( )
H aq HS aq
H S aq
3
3
( ) ( )
( )
H aq CH COO aq
CH COOH aq
The acids provide H+ and keep the
pH low (3.5-5.5)
Oil and gas production:
Gas and oil phases are reservoirs for CO2 and H2S
Geothermal:
CO2 and H2S limited to dissolved amount when the fluid is water
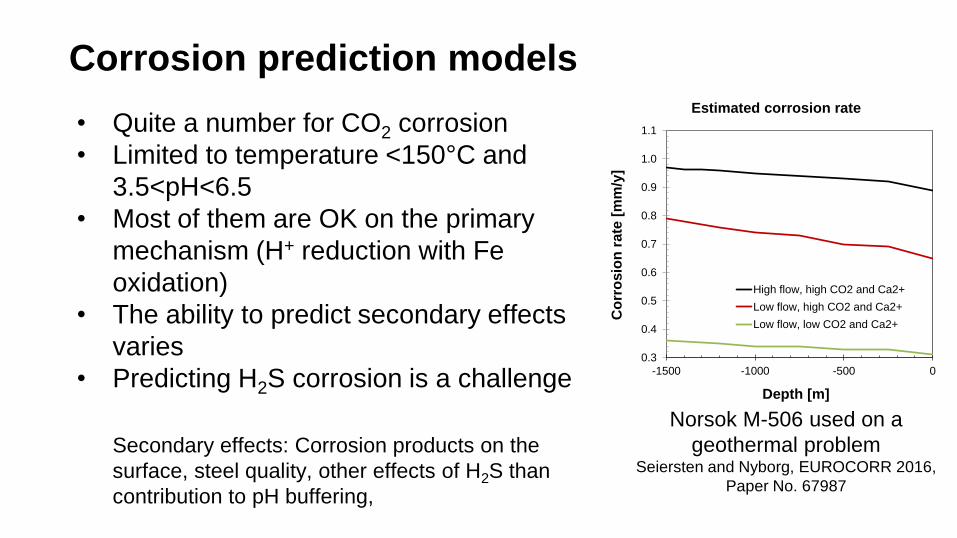
Corrosion prediction models
• Quite a number for CO2 corrosion
• Limited to temperature <150°C and
3.5<pH<6.5
• Most of them are OK on the primary
mechanism (H+ reduction with Fe
oxidation)
• The ability to predict secondary effects
varies
• Predicting H2S corrosion is a challenge
Secondary effects: Corrosion products on the
surface, steel quality, other effects of H2S than
contribution to pH buffering,
Norsok M-506 used on a
geothermal problemSeiersten and Nyborg, EUROCORR 2016,
Paper No. 67987
0.3
0.4
0.5
0.6
0.7
0.8
0.9
1.0
1.1
-1500 -1000 -500 0
Co
rro
sio
n r
ate
[m
m/y
]
Depth [m]
Estimated corrosion rate
High flow, high CO2 and Ca2+
Low flow, high CO2 and Ca2+
Low flow, low CO2 and Ca2+
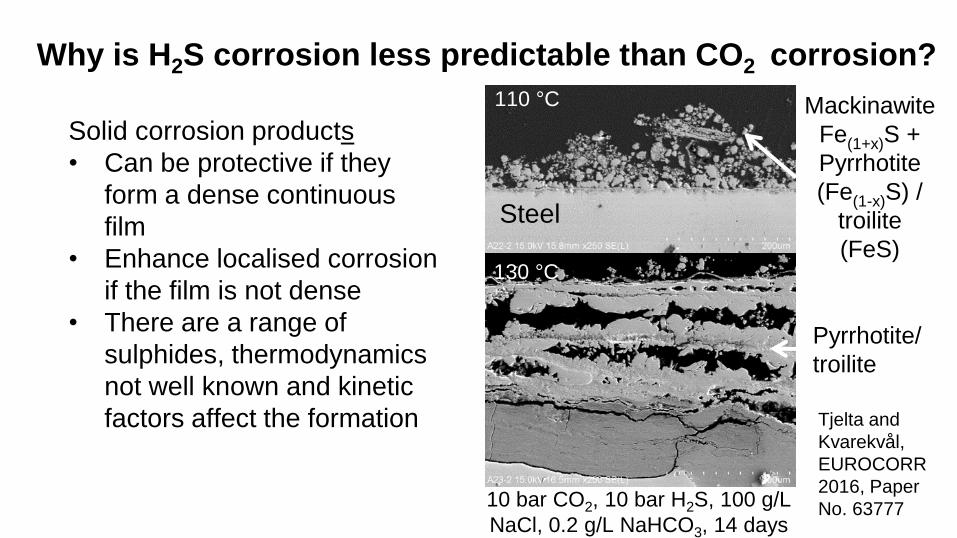
Why is H2S corrosion less predictable than CO2 corrosion?
Solid corrosion products
• Can be protective if they
form a dense continuous
film
• Enhance localised corrosion
if the film is not dense
• There are a range of
sulphides, thermodynamics
not well known and kinetic
factors affect the formation
10 bar CO2, 10 bar H2S, 100 g/L
NaCl, 0.2 g/L NaHCO3, 14 days
Steel
110 °C
130 °C
Mackinawite
Fe(1+x)S +
Pyrrhotite
(Fe(1-x)S) /
troilite
(FeS)
Pyrrhotite/
troilite
Tjelta and
Kvarekvål,
EUROCORR
2016, Paper
No. 63777

H2S – Sulphide stress cracking (SSC)
Factors that affect the susceptibility
of metallic materials:
• Materials properties
• H2S partial pressure
• In situ pH
• Concentration of dissolved Cl- (or
other halide)
• Presence of elemental sulphur or
other oxidant
• Temperature
• Galvanic effects
• Mechanical stress
• Time of exposure

Inhibiting corrosion
Steel pipe wall
Polar head group
Hydrocarbon chain
Synergist
• Filmer: Organic molecules
with polar head group and
hydrocarbon chain
• Synergist
• Solvent
• Biodegradable
Inhibitor 1
Inhibitor 2
Baseline
0.1
1
10
100
80 °C100 °C
120 °C150 °C
Co
rro
sio
n r
ate
, mm
/y
Temperature
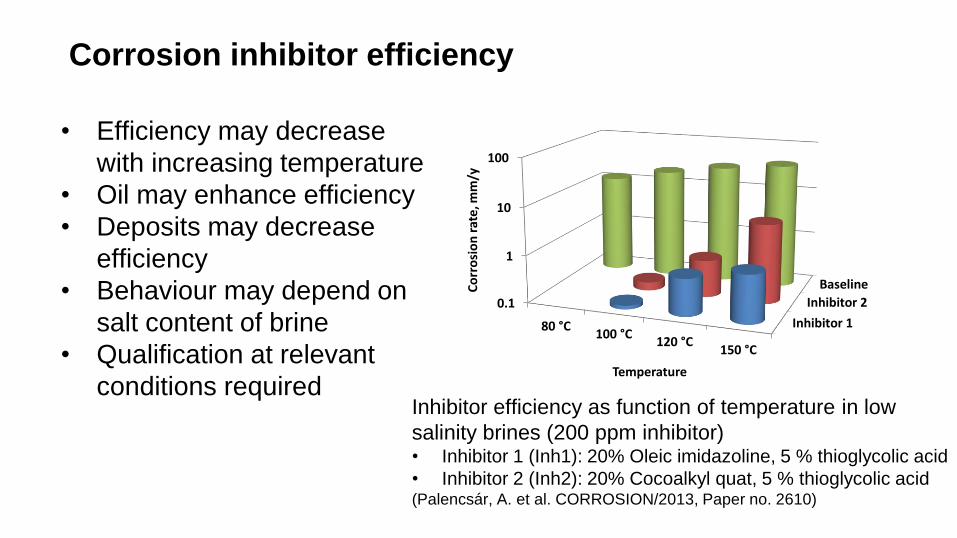
Corrosion inhibitor efficiency
Inhibitor efficiency as function of temperature in low
salinity brines (200 ppm inhibitor)• Inhibitor 1 (Inh1): 20% Oleic imidazoline, 5 % thioglycolic acid
• Inhibitor 2 (Inh2): 20% Cocoalkyl quat, 5 % thioglycolic acid(Palencsár, A. et al. CORROSION/2013, Paper no. 2610)
• Efficiency may decrease
with increasing temperature
• Oil may enhance efficiency
• Deposits may decrease
efficiency
• Behaviour may depend on
salt content of brine
• Qualification at relevant
conditions required
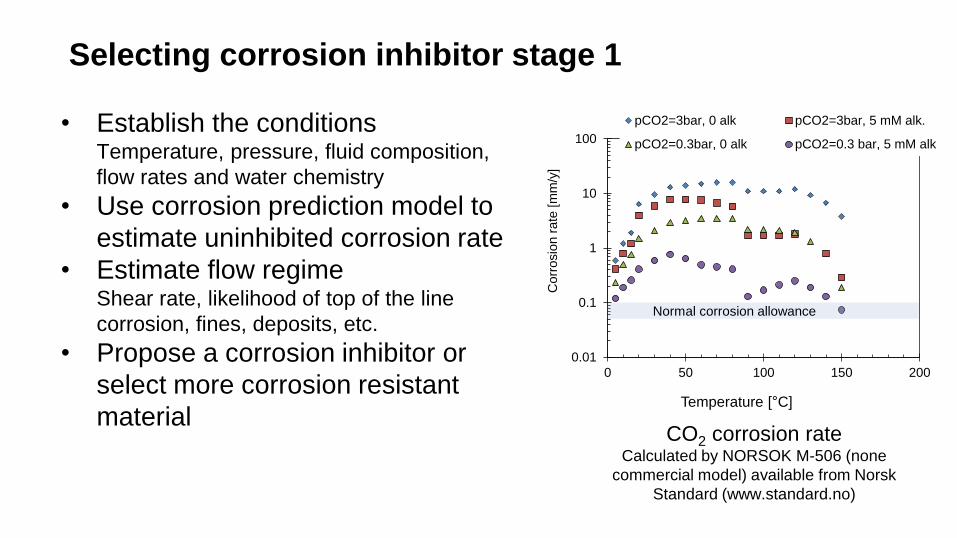
Selecting corrosion inhibitor stage 1
• Establish the conditions Temperature, pressure, fluid composition,
flow rates and water chemistry
• Use corrosion prediction model to
estimate uninhibited corrosion rate
• Estimate flow regime Shear rate, likelihood of top of the line
corrosion, fines, deposits, etc.
• Propose a corrosion inhibitor or
select more corrosion resistant
material
0.01
0.1
1
10
100
0 50 100 150 200
Co
rro
sio
n r
ate
[m
m/y
]
Temperature [ C]
Shear stress 5 PapCO2=3bar, 0 alk pCO2=3bar, 5 mM alk.
pCO2=0.3bar, 0 alk pCO2=0.3 bar, 5 mM alk
CO2 corrosion rate Calculated by NORSOK M-506 (none
commercial model) available from Norsk
Standard (www.standard.no)
Normal corrosion allowance
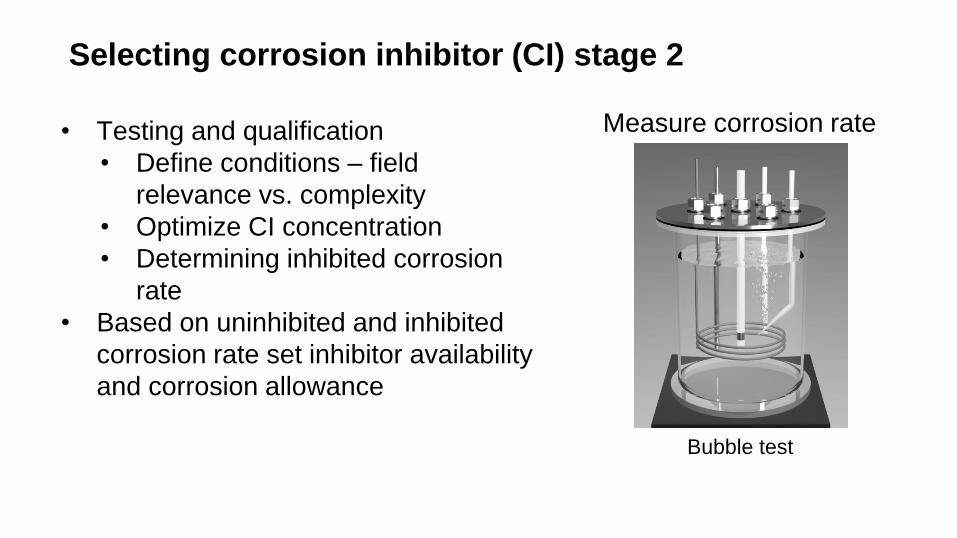
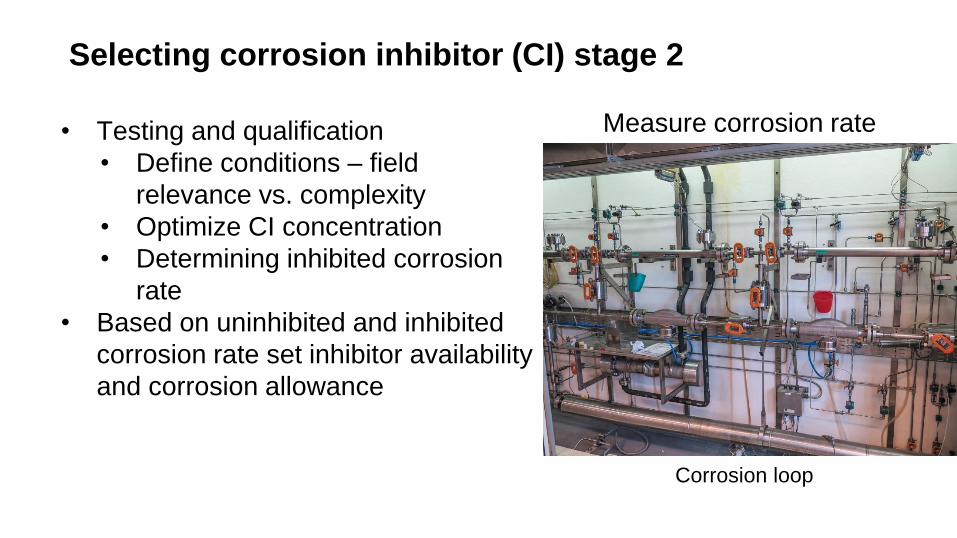
Selecting corrosion inhibitor (CI) stage 2
• Testing and qualification
• Define conditions – field
relevance vs. complexity
• Optimize CI concentration
• Determining inhibited corrosion
rate
• Based on uninhibited and inhibited
corrosion rate set inhibitor availability
and corrosion allowance
Measure corrosion rate
Bubble test
Selecting corrosion inhibitor (CI) stage 2
• Testing and qualification
• Define conditions – field
relevance vs. complexity
• Optimize CI concentration
• Determining inhibited corrosion
rate
• Based on uninhibited and inhibited
corrosion rate set inhibitor availability
and corrosion allowance
Measure corrosion rate
Autoclave testCorrosion loop

Effect of scale on corrosion
• Siderite (FeCO3) protects carbon
steel
• Require high HCO3- concentration to
form
• Proven to 150 °C, but above?
• Other scales as protective?
• Protective scale and scale inhibition?
• Scale and corrosion inhibition?
Steel
Cross-section pictured in SEM
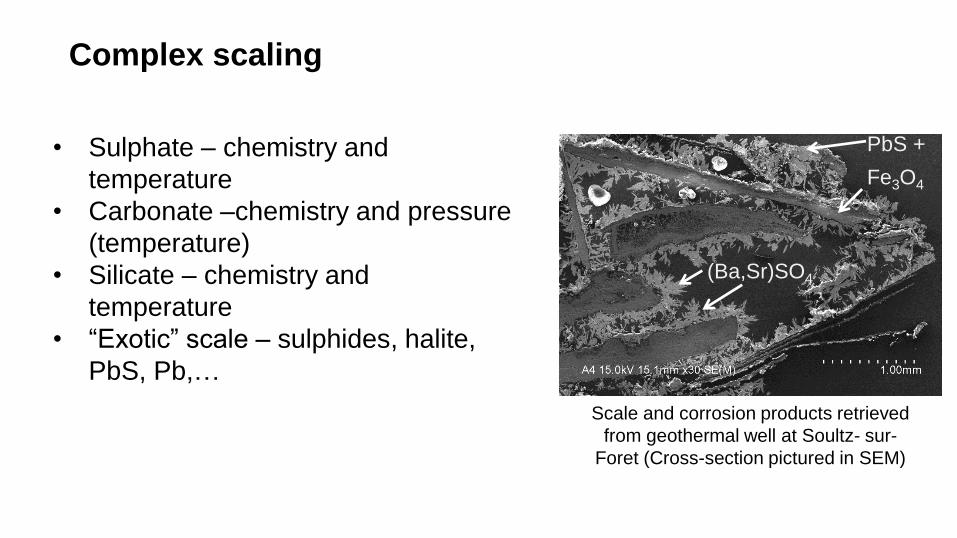
Complex scaling
• Sulphate – chemistry and
temperature
• Carbonate –chemistry and pressure
(temperature)
• Silicate – chemistry and
temperature
• “Exotic” scale – sulphides, halite,
PbS, Pb,…
Scale and corrosion products retrieved
from geothermal well at Soultz- sur-
Foret (Cross-section pictured in SEM)
(Ba,Sr)SO4
Fe3O4
PbS +

Carbonate scale affected by corrosion
2
22 ( ) ( ) ( ) ( , )H aq Fe s Fe aq H aq g
3
2 3
2 2
( ) ( )
( )
( ) ( )
H aq HCO aq
H CO aq
CO aq H O l
pH
increase
Consumed by corrosion

Estimating CO2 corrosion rate and scaling in
geothermal wells
5.8
5.9
5.9
6.0
6.0
6.1
6.1
6.2
6.2
6.3
6.3
-1500 -1000 -500 0
pH
Depth [m]
pH
High flow, high CO2 and Ca2+
Low flow, high CO2 and Ca2+
Low flow, low CO2 and Ca2+
0.3
0.4
0.5
0.6
0.7
0.8
0.9
1.0
1.1
-1500 -1000 -500 0
Co
rro
sio
n r
ate
[m
m/y
]
Depth [m]
Corrosion
High flow, high CO2 and Ca2+
Low flow, high CO2 and Ca2+
Low flow, low CO2 and Ca2+
Corrosion pH Scale0.9
1.0
1.1
1.2
1.3
1.4
1.5
1.6
1.7
1.8
-1500 -1000 -500 0
SR
Depth [m]
CaCO3 saturation ratio
High flow, high CO2 and Ca2+
Low flow, high CO2 and Ca2+
Low flow, low CO2 and Ca2+
2 23
( )
Ca CO
SP
a aSR
K calcite
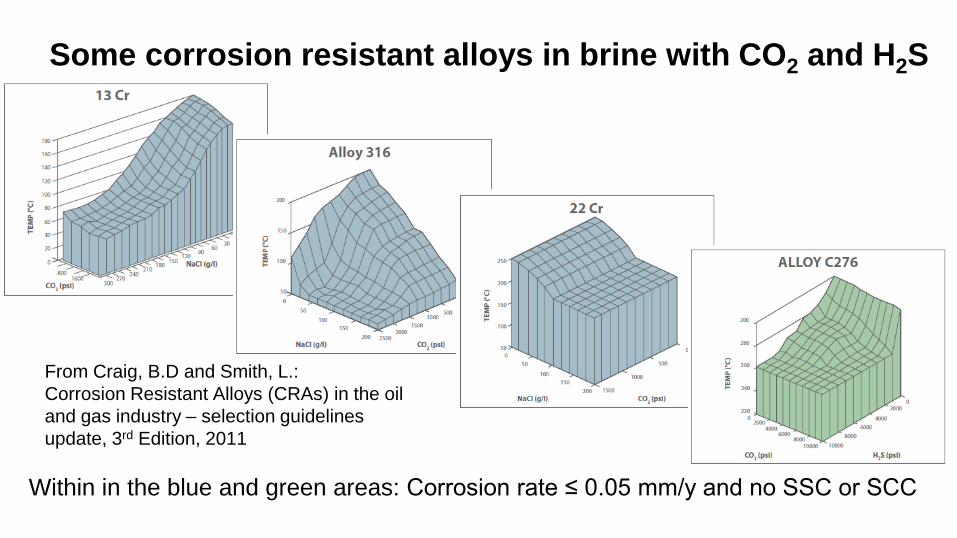
Some corrosion resistant alloys in brine with CO2 and H2S
Within in the blue and green areas: Corrosion rate ≤ 0.05 mm/y and no SSC or SCC
From Craig, B.D and Smith, L.:
Corrosion Resistant Alloys (CRAs) in the oil
and gas industry – selection guidelines
update, 3rd Edition, 2011
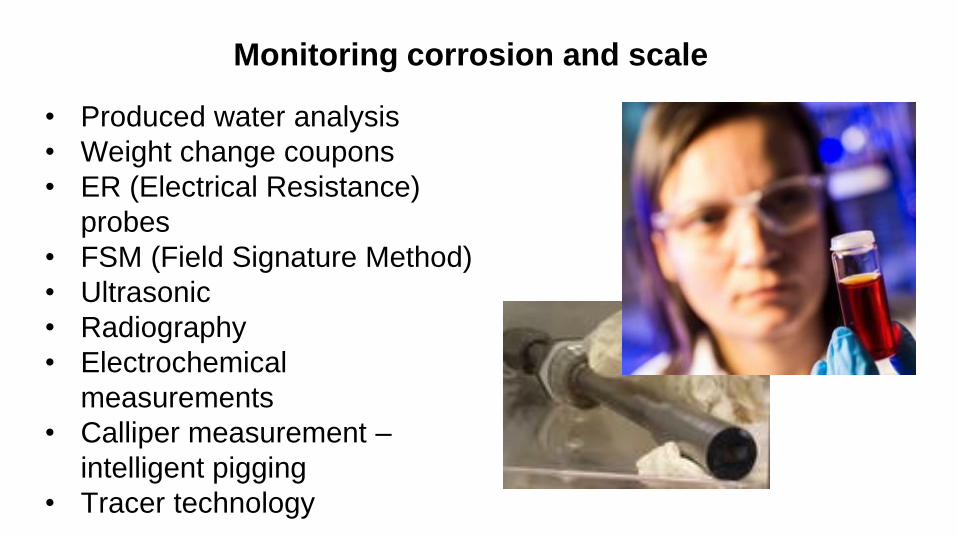
Monitoring corrosion and scale
• Produced water analysis
• Weight change coupons
• ER (Electrical Resistance)
probes
• FSM (Field Signature Method)
• Ultrasonic
• Radiography
• Electrochemical
measurements
• Calliper measurement –
intelligent pigging
• Tracer technology

Geothermal and oil and gas synergies in
corrosion and scaling – Modelling
• CO2 corrosion models have a proven record
within their limits
• Thermodynamic equilibrium models are able to
predict risk of scaling
• Challenges:
• Stochastic behaviour: Pitting corrosion,
nucleation and growth of solids
• High temperature
• Complex production fluids – high salt content
Recommended