Corrosion of Nickel-Base Alloys in Supercritical CO2 Environment
David AdamJacob Mahaffey
Arjun KalraDr. Mark Anderson
Dr. Kumar Sridharan
EPRI International Conference on Corrosion in Power Plants, October 12-15, 2015, San Diego, CA

Outline• Motivation/Background• Testing Facility and Procedure• Results• Discussion• Conclusions
11/9/2015 University of Wisconsin–Madison 2

Motivation/Background• High temperature, high pressure
conditions of SCO2 Brayton cycle environments require suitable materials
• Must understand corrosion phenomena to withstand these extreme environments
• Long-term corrosion can lead to:• Reduction in effective wall
thickness• Reduction of thermal conductivity• Corrosion debris
11/9/2015 University of Wisconsin–Madison 3
Estimated Data for IN740, Haynes 282 from:Weitzel, P., Steam Generator for Advanced Ultra Supercritical Power Plants 700C to 760C, Proceedings of the ASME 2011 Power ConferenceJuly 12-14, 2011, Denver, Colorado, USA
Allowable Stresses for Alloys of Interest
0
5
10
15
20
25
30
35
40
45
50
0 200 400 600 800 1000
Allo
wab
le S
tress
[ksi
]
Temperature [C]
Haynes 230 Haynes 625 Haynes 282
Inconel 740 T91 316SS

High Temperature, High Pressure SCO2 Test Facility
• Testing temperature up to 750ºC
• Temperature control allows system to operate within ±1ºC
• Pressures up to 3600±2 psi (temperature dependent)
• System operates at an average flow rate of .11kg/hr• CO2 refresh rate every two
hours
11/9/2015 University of Wisconsin–Madison 4

Sample Holder with Samples
11/9/2015 University of Wisconsin–Madison 5
• Sample holder made out of Haynes 625 alloy• Samples are 0.5”x0.5”x0.0625” square coupons• Alumina rod suspends samples in continuous stream of CO2• Alumina spacers separate samples• Fits up to 70 samples

Testing Procedure• Untested samples polished to 800 grit, then
cleaned with ethanol and DI water• Weight measurements are accurate to ± 2µg and
dimensions have an accuracy of ± 2µm• Samples are tested at 20 MPa and 450ºC-750ºC
at 200 hour intervals up to 1000 hours• Samples analyzed using SEM, EDS, XRD, etc.
611/9/2015 University of Wisconsin–Madison

Composition of Alloys by Weight %
11/9/2015 University of Wisconsin–Madison 7
C Mn Fe Si Cu Ni Cr Al Ti Co Mo Nb W
IN740(Special Metals)
0.023 0.245 0.1491 0.17 0.015 50.04 24.57 1.33 1.33 20.09 0.35 1.46 0.022
H230(Haynes) 0.1 0.52 1.02 0.31 0.04 Bal~59.94 22.08 0.37 0.01 0.21 1.23 14.17
H625(Haynes) 0.02 0.26 5 0.25 Bal~59.63 21.89 0.22 0.29 0.28 8.59 3.51
H282*(Haynes) 0.06 0.3 1.5 0.15 57 20 1.5 2.1 10 8.5
Ni-20Cr* 80 20
* - nominal composition
Trace Elements:Alloy S Ta P B N V Zr LaIN740 0.003 0.004 0.0023 0.0013 0.0038 0.012 0.021
H230 0.002 0.002 0.012
H625 0.002 0.05 0.006

Research and Industrial Grade CO2 Gas Certificates
11/9/2015 University of Wisconsin–Madison 8
Research Grade CO2
Industrial Grade CO2
Component Purity Limits Purity Limits
CO2 99.999% 99.5%
Ar+O2+CO <1 ppm <50 ppm
Total Hydrocarbons <1 ppm <50 ppm
Moisture <3 ppm <32 ppm
Nitrogen <5 ppm
Gas analysis has been conducted by third party
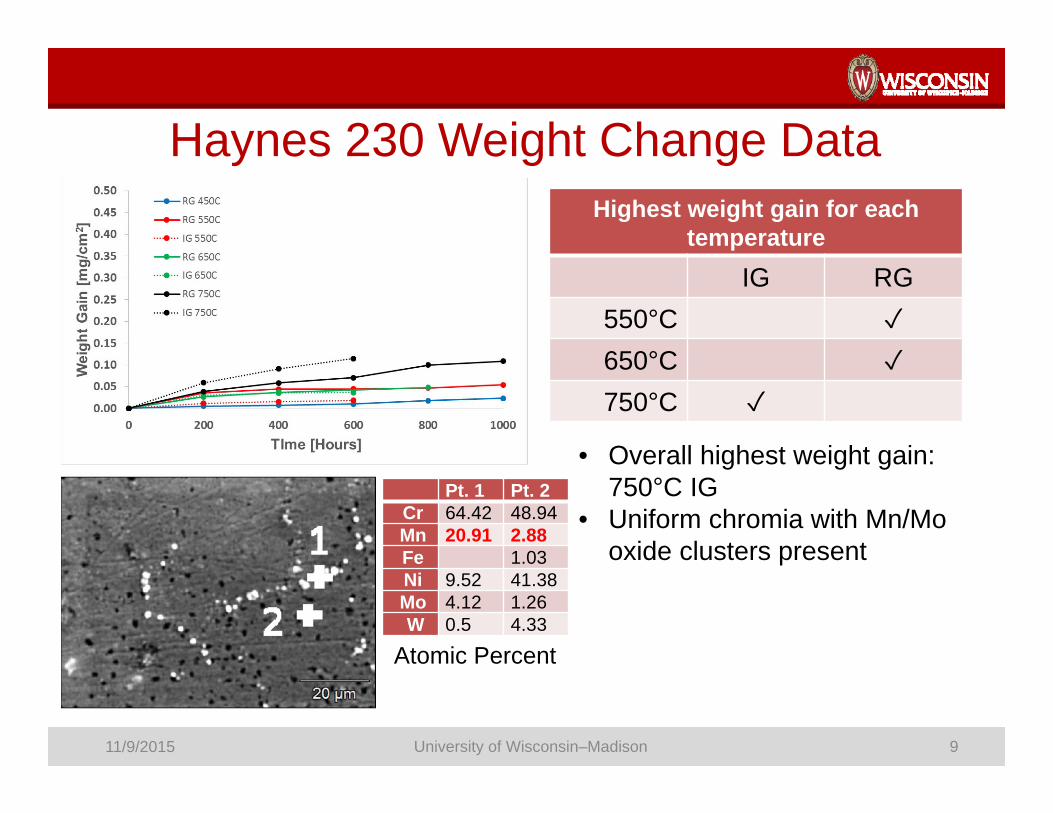
Haynes 230 Weight Change Data
11/9/2015 University of Wisconsin–Madison 9
Atomic Percent
• Overall highest weight gain: 750°C IG
• Uniform chromia with Mn/Mo oxide clusters present
Pt. 1 Pt. 2Cr 64.42 48.94Mn 20.91 2.88Fe 1.03Ni 9.52 41.38Mo 4.12 1.26W 0.5 4.33
Highest weight gain for each temperature
IG RG550°C ✓650°C ✓750°C ✓

Haynes 625 Weight Change Data
11/9/2015 University of Wisconsin–Madison 10
Atomic Percent
Highest weight gain for each temperature
IG RG550°C ✓650°C Similar Similar750°C Similar Similar
• Overall highest weight gain: 750°C RG
• Very little difference between 650°C RG, and 650°C IG
• Very little difference between 750°C RG, and 750°C IG
• Uniform chromia with Ti/Mnoxide clusters present
PointTi 24.95Cr 63.24Mn 4.06Ni 5.99Nb 0.32Mo 0.98

Haynes 282 Weight Change Data
11/9/2015 University of Wisconsin–Madison 11
Highest weight gain for each temperature
IG RG650°C ✓750°C ✓
• Overall highest weight gain: 750°C RG
• Uniform chromia with Ti oxide clusters present
• Highest weight gain of all alloys at 750°C

Inconel 740 Weight Change Data
11/9/2015 University of Wisconsin–Madison 12
Highest weight gain for each temperature
IG RG650°C ✓750°C ✓
• Overall highest weight gain: 750°C RG
• Uniform chromia with Ti/Mo oxide clusters present
• Increased corrosion along grain boundaries

Ni-20Cr Binary Alloy Weight Change Data
11/9/2015 University of Wisconsin–Madison 13
Highest weight gain for each temperature
IG RG750°C ✓
• Highest weight gain: 750°C RG• Uniform chromia with Mo oxide
clusters present• Mo oxide clusters believed to be
from volatilized Mo oxide from other samples or from Haynes 625 autoclave†
† - Smolik, G.R., Petti, D.A., Schuetz, S.T., (2000). “Oxidation, Volatilization, and Redistribution of Molybdenum from TZM Alloy in Air.” Idaho National Engineering and Environmental Laboratory, INEEL/EXT-99-01353

Surface SEM of H230 in IG/RG CO2 after 400 hours at 650C
11/9/2015 University of Wisconsin–Madison 14
• Large carbon clusters observed on the surface of the sample tested in RG-CO2• Clusters reduced significantly for IG sample• Caused by compositional differences in gas (O2, N2, H2O, Hydrocarbons)• Phenomena believed to be attributable to Boudouard reaction

Gibbs Free Energy Diagram for Carbon Removal in Carbon Dioxide
• HSC Chemistry used for thermodynamic modeling of Boudouard Reaction
• CO2 + C 2CO becomes thermodynamically favorable at 700ºC
• Reaction believed to be present in 750ºC testing, removing free carbon and thus impacting weight gain as seen in H230 and H625
11/9/2015 University of Wisconsin–Madison 15
0 100 200 300 400 500 600 700 800 900 100011001200
-15
-10
-5
0
5
10
15
20
25
30
35
Gib
bs F
ree
Ene
rgy
[Kca
l]
Temperature[ºC]
CO2 C⇌2CO

Graphite Testing
Surface Roughness Measurements [µm]
Untested Graphite
200 hrs at 650ºC
200 hrs at 750ºC
Average 0.357 0.648 4.01
St-Dev 0.0808 0.222 1.02
Relative Roughness 1.82 11.2
• 750ºC graphite samples lost 15 times more weight than samples exposed to 650ºC CO2
• 750ºC samples have 6 times the surface roughness than those exposed to 650ºC
• Carbon is removed from graphite at a much faster rate at temperatures above 700ºC
Untested 200 hours at 750ºC
400 hours at 750ºC
11/9/2015 University of Wisconsin–Madison 16
-0.25
-0.20
-0.15
-0.10
-0.05
0.00200 hours 400 hours
Wei
ght C
hang
e [m
g/m
m2 ]
RG 650CRG 750C

Extrapolated Weight Gain• Weight gain data fit using power
law to give yearly extrapolated weight gain
·• W = weight change [mg/cm2]• a = pre-exponential factor• t = time [hours]• n = growth parameter
11/9/2015 University of Wisconsin–Madison 17

Extrapolated Oxide Thickness• Method to evaluate oxide thickness of alloys investigated• Calculation of effective oxide density:
EffectiveOxideDensityExperimentalWeightChangeExperimentalOxideThickness
• Use effective oxide density to calculate extrapolated oxide thickness
ExtrapolatedThicknessExtrapolatedWeightGainEffectiveOxideDensity
11/9/2015 University of Wisconsin–Madison 18

Effective Oxide Density Calculation
11/9/2015 University of Wisconsin–Madison 19
Cu 230
Processed Image
Cu O
Cr
Ni
Example: From Processed Image: 0.799 ± 0.123 µm Weight Gain of H230: 1.23 µg/cm2
Effective Density of H230: 1.54 g/cm3
Averaging across all 230 and 625 alloys,Effective Density: 1.79 ± .25 g/cm3
Effective Oxide Thickness for Example: 0.573 µm/year
Haynes 230, 650ºC RG SC-CO2, 600 hours
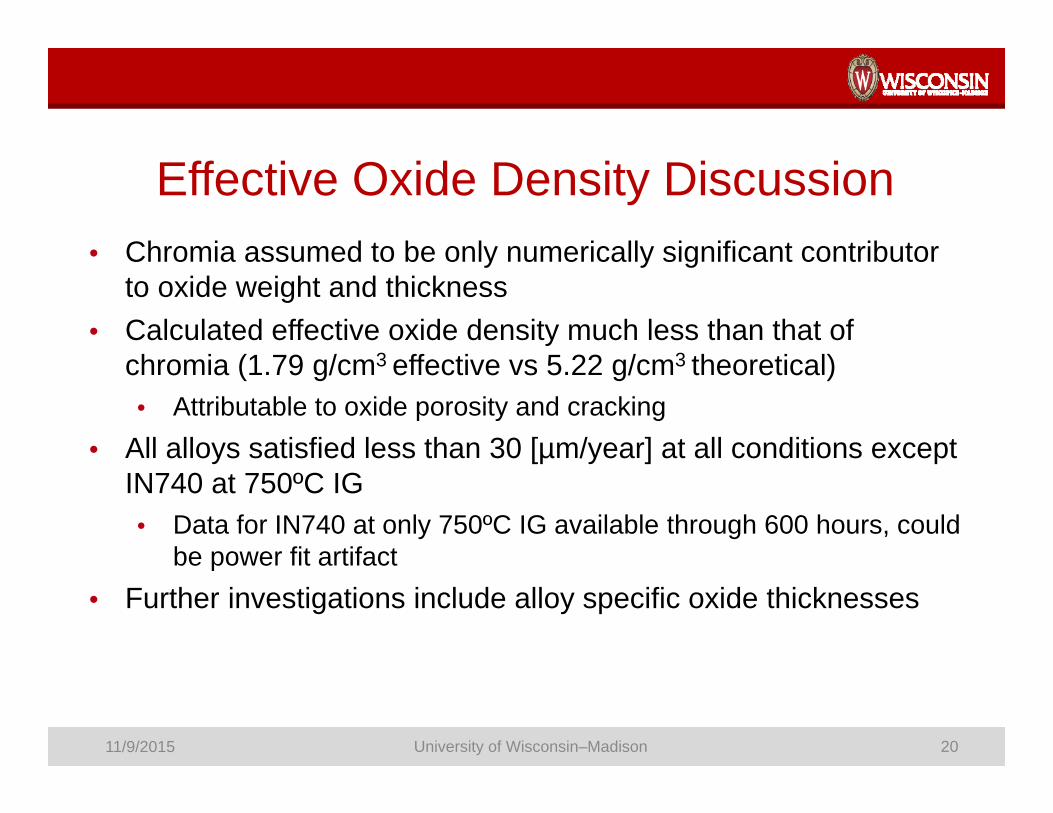
Effective Oxide Density Discussion• Chromia assumed to be only numerically significant contributor
to oxide weight and thickness• Calculated effective oxide density much less than that of
chromia (1.79 g/cm3 effective vs 5.22 g/cm3 theoretical)• Attributable to oxide porosity and cracking
• All alloys satisfied less than 30 [µm/year] at all conditions except IN740 at 750ºC IG • Data for IN740 at only 750ºC IG available through 600 hours, could
be power fit artifact• Further investigations include alloy specific oxide thicknesses
11/9/2015 University of Wisconsin–Madison 20
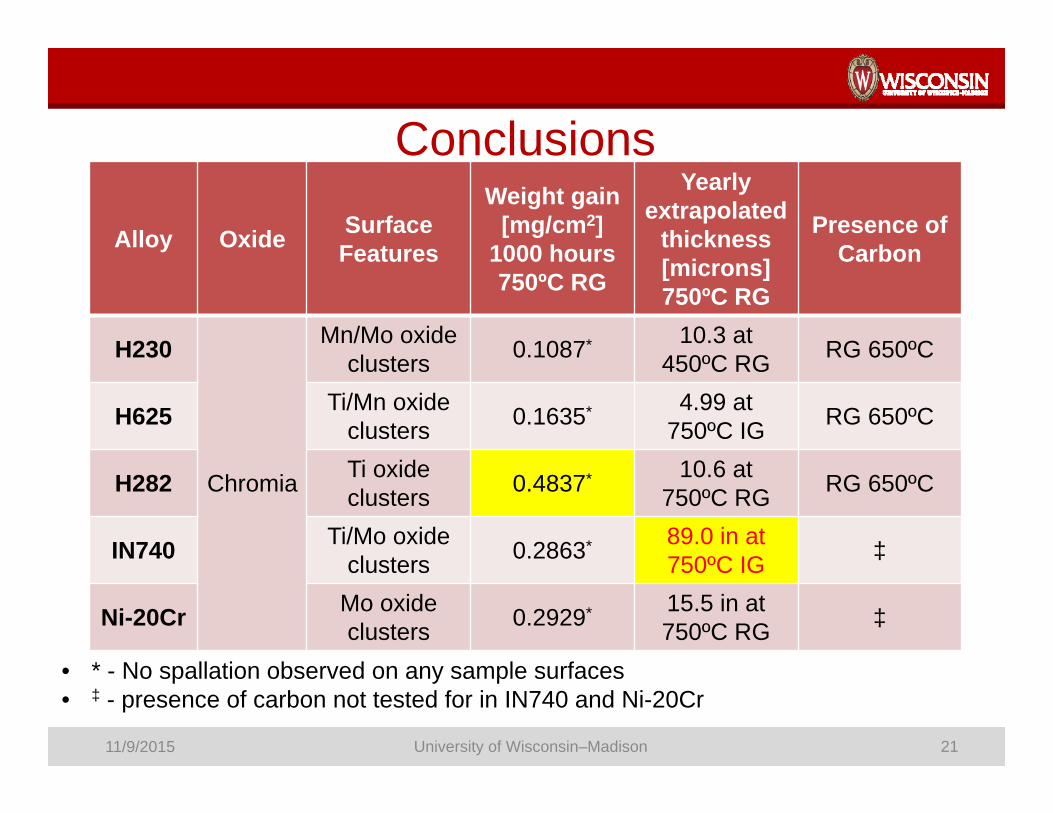
Conclusions
Alloy Oxide Surface Features
Weight gain [mg/cm2]
1000 hours750ºC RG
Yearlyextrapolated
thickness [microns] 750ºC RG
Presence of Carbon
H230
Chromia
Mn/Mo oxide clusters 0.1087* 10.3 at
450ºC RG RG 650ºC
H625 Ti/Mn oxide clusters 0.1635* 4.99 at
750ºC IG RG 650ºC
H282 Ti oxide clusters 0.4837* 10.6 at
750ºC RG RG 650ºC
IN740 Ti/Mo oxide clusters 0.2863* 89.0 in at
750ºC IG ‡
Ni-20Cr Mo oxide clusters 0.2929* 15.5 in at
750ºC RG ‡
11/9/2015 University of Wisconsin–Madison 21
• * - No spallation observed on any sample surfaces• ‡ - presence of carbon not tested for in IN740 and Ni-20Cr

Conclusions
Alloy Oxide Surface Features
Weight gain [mg/cm2]
1000 hours750ºC RG
Yearlyextrapolated
thickness [microns] 750ºC RG
Presence of Carbon
H230
Chromia
Mn/Mo oxide clusters 0.1087* 10.3 at
450ºC RG RG 650ºC
H625 Ti/Mn oxide clusters 0.1635* 4.99 at
750ºC IG RG 650ºC
H282 Ti oxide clusters 0.4837* 10.6 at
750ºC RG RG 650ºC
IN740 Ti/Mo oxide clusters 0.2863* 89.0 in at
750ºC IG ‡
Ni-20Cr Mo oxide clusters 0.2929* 15.5 in at
750ºC RG ‡
11/9/2015 University of Wisconsin–Madison 22
• * - No spallation observed on any sample surfaces• ‡ - presence of carbon not tested for in IN740 and Ni-20Cr

Backup Slides
11/9/2015 University of Wisconsin–Madison 23

Presence of Molybdenum on Ni-20Cr Alloys Exposed to CO2 at 750ºC
Add explanatory text here
11/9/2015 University of Wisconsin–Madison 24

310SS (750ºC/1000hr) Moly Evidence
Molybdenum Oxide
11/9/2015 University of Wisconsin–Madison 25

Trends observed through weight gains450°C
550°C
650°C
750°C
H230 vs H625
11/9/2015 University of Wisconsin–Madison 26
H230 H625Higher weight gain environment RG-CO2 RG-CO2
H230 H625 H282 IN740Higher weight gain environment
RG-CO2 RG-CO2 RG-CO2 RG-CO2
H230 H625Notes Similar weight change, less than 0.02 mg/cm2 difference
H230 H625 H282 IN740 Ni-20CrHigher weight gain environment
IG-CO2 Similar RG-CO2 RG-CO2 RG-CO2
H230 H625Notes Exhibited similar/lesser weight gain at 750°C than 650°C

Research and Industrial Grade CO2 Gas Certificates
Airgas Certificates Isotech Labs Analysis
Research Grade CO2
Industrial Grade CO2
*Limit of detection: 100 ppm
11/9/2015 University of Wisconsin–Madison 27
Research Grade CO2
Industrial Grade CO2
Component Purity Limits Purity Limits
CO2 99.999% 99.5%
AR+O2+CO <1 ppm <50 ppm
Total Hydrocarbons <1 ppm <50 ppm
Moisture <3 ppm <32 ppm
Nitrogen <5 ppm

Trends observed through weight gains450°C• H230 and H625 exhibited similar weight gains in RG-CO2 on the order of 0.02 mg/mm2 after 1000
hours of exposure 550°C
• H230 and H625 exhibited higher weight gains in RG-CO2 compared to IG-CO2
650°C• H230, H625, H282, IN740 exhibited higher weight gains in RG-CO2 compared to IG-CO2
750°C• H282, IN740, Ni-20-Cr exhibited higher weight gains in RG-CO2 compared to IG-CO2
• H625 exhibited similar weights gains between RG-CO2 and IG-CO2
• H230 exhibited lower weight gains in RG-CO2 compared to IG-CO2
H230 vs H625• H230 and H625 exhibited similar or lower weight gains at 750°C compared to 650°C for RG-CO2
11/9/2015 University of Wisconsin–Madison 28
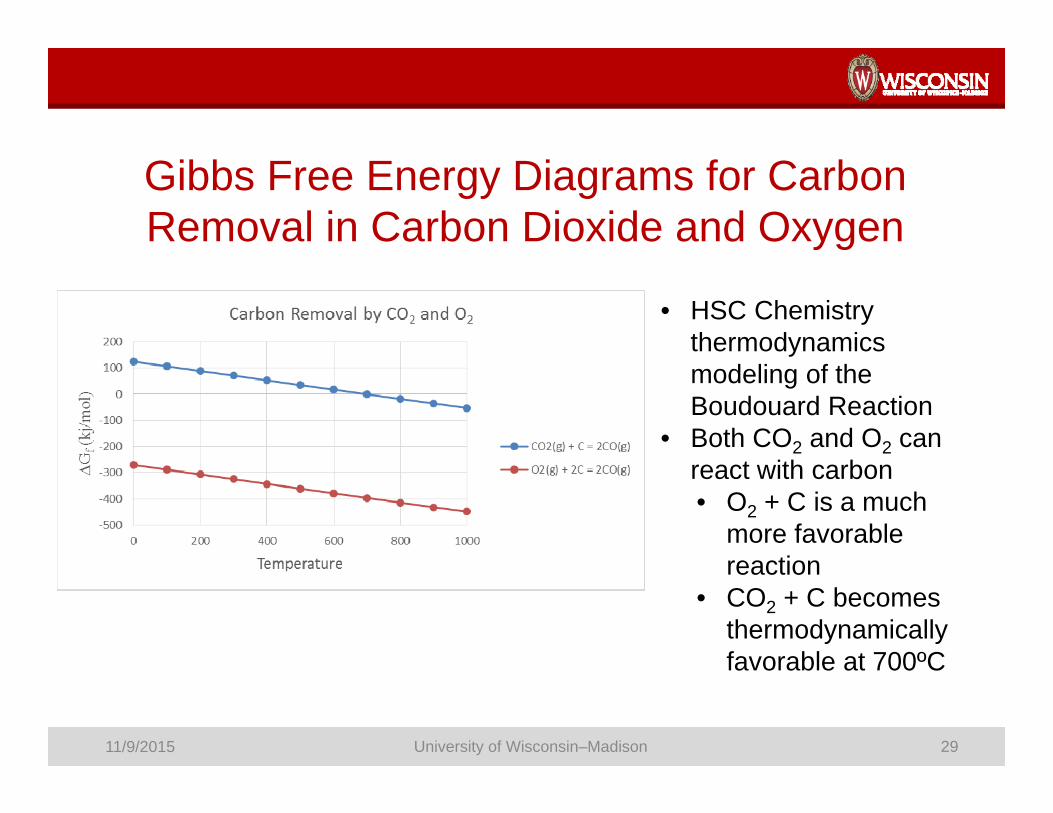
Gibbs Free Energy Diagrams for Carbon Removal in Carbon Dioxide and Oxygen
• HSC Chemistry thermodynamics modeling of the Boudouard Reaction
• Both CO2 and O2 can react with carbon• O2 + C is a much
more favorable reaction
• CO2 + C becomes thermodynamically favorable at 700ºC
11/9/2015 University of Wisconsin–Madison 29

Gibbs Free Energy Diagrams for Carbon Removal in CO2 and Metal Carbides
• Free carbon has been observed to form carbides along grain boundaries
• CO2 can react with carbides to remove carbon
• Consistent with weight loss in SiCsamples
11/9/2015 University of Wisconsin–Madison 30
Recommended