Cost-effective Metamorphic Testing Techniques for Failure
Detection in Software with Oracle Problem
Sim Kwan Yong
Faculty of Engineering, Computing and Science
Swinburne University of Technology Sarawak Campus
Kuching, Malaysia
Submitted for the degree of Doctor of Philosophy
2015

II
“Italwaysseemsimpossibleuntilit’sdone”
―NelsonMandela
III
Abstract
As hardware speed advances, software applications are developed to undertake more complex
computation tasks and process larger amount of data. However, the oracles (correct expected outputs)
of complex software are often unknown or cannot be derived feasibly by other means. Therefore,
testing and detecting failures (incorrect outputs) in software applications in the absence of oracle has
become an increasingly common yet challenging problem.
In recent years, metamorphic testing has become a prominent approach to detect failures in
software with oracle problem. In the absence of oracle, metamorphic testing can make use of the
necessary properties (known as metamorphic relations) of the software under test to detect failures.
Although metamorphic testing approach is effective in detecting failures in software with oracle
problem, it incurs additional costs compared to the conventional software testing process where oracle
is available. In addition to the cost of identifying metamorphic relations, the number of test cases to be
generated and executed is also at least double of those in conventional software testing process where
oracle is available.
This study aims to address the cost problem in metamorphic testing by analyzing the various
costs incurred in the metamorphic testing procedures and their functional components. Six novel cost
saving strategies have been proposed in this study to reduce or eliminate the costs incurred in
metamorphic testing. Based on these six cost saving strategies, cost-effective metamorphic testing
techniques have been designed and developed for four different software applications with oracle
problem, namely, edge detection program in image processing domain, financial charting software
components, real-time technical indicators and finite state machines. For the edge detection program,
financial charting software components and real-time technical indicators, experiments have been
conducted to evaluate the failure detection capability of the proposed cost-effective metamorphic
testing techniques by using faulty versions of these software applications which contain seeded faults
or real faults. For the finite state machine, theoretical analyses have been performed to prove that the
proposed cost-effective metamorphic testing technique can guarantee the detection of transfer faults,
in addition to output faults.

IV
In conclusion, the six cost saving strategies proposed for metamorphic testing and their
adoption to develop the new cost-effective metamorphic testing techniques developed have formed
the main novelty of this study. Overall, this study has contributed towards advancing the state-of-the-
art of testing software with oracle problem in general and the cost-effectiveness of metamorphic
testing specifically.
V
Acknowledgements
First and foremost, I would like to express my greatest gratitude to my coordinating supervisor,
Prof. Anatoli Vakhguelt for his trust, support and mentorship in my journey to pursue PhD and my
career. I also would like to sincerely thank my associate supervisor Dr. Diana Fei-Ching Kuo for her
support, patient guidance, valuable suggestions and constructive comments throughout my long part-
time PhD candidature. Special appreciation also goes to Prof. Tsong Yueh Chen who introduced me
to the wonderful world of software testing research 12 years ago and continues to inspire my research
in this area.
I would like to extend my gratitude to my friends and associates, both from academia and from
industry, who supported my work in this thesis in one way or another. Thanks to my workplace
supervisor Associate Prof. Dennis Wong for his support and for sharing his technical expertise in
image processing. Special thanks to Mr. Chin Seng Low from Nextwave Software and Mr. Edwin Hii
for allowing me to use the software artefacts they have developed as subjects of testing in my research
work. I would also like to thank Dr. Tan Eng Hoo for introducing me to the theory of inventive
problem solving. My appreciation also goes to my wonderful colleagues at Swinburne Sarawak who
helped and supported me directly or indirectly throughout my PhD study.
I must give my utmost appreciation to my family, particularly to my parents, Sim Woon Phiaw
and Chan Chiaw Yun, for supporting me in everything I do and for being there for me all the time. To
my wife, Ivy Tan, thanks for your endless love and for accepting me as the person I am. To our lovely
son, Eythan, thank you for adding new colors into our life.
Sim Kwan Yong
Kuching, Sarawak, Malaysia
July 2015

VII
Table of Contents
Abstract…… ....................................................................................................................................... III
Acknowledgements ............................................................................................................................... V
Declaration.. ........................................................................................................................................ VI
Table of Contents ............................................................................................................................... VII
List of Tables ..................................................................................................................................... XII
List of Figures ................................................................................................................................... XIII
1 Introduction ...................................................................................................................... 1
1.1 Background ................................................................................................................... 3
1.1.1 Why is it so difficult to detect failures in software? .............................................. 3
1.1.2 Oracle Problems ..................................................................................................... 4
1.1.3 How to detect software failures in the absence of oracle? ..................................... 5
1.2 Problem Statements ....................................................................................................... 6
1.3 Objectives ..................................................................................................................... 8
1.4 Contributions ................................................................................................................. 8
1.5 Scope ........................................................................................................................... 10
1.6 Structure of the Thesis ................................................................................................ 10
2 Background and Literature Review ................................................................................ 12
2.1 Oracle Problems .......................................................................................................... 12
2.1.1 Pseudo Oracle ...................................................................................................... 14
2.1.2 N-version Programming ....................................................................................... 15
2.1.3 Previous Versions ................................................................................................ 16
2.1.4 Assertion Conditions ............................................................................................ 17
VIII
2.1.5 Contracts .............................................................................................................. 18
2.1.6 Program Invariants ............................................................................................... 20
2.1.7 Anomalies ............................................................................................................ 21
2.1.8 Special Values ...................................................................................................... 22
2.1.9 Human Oracle ...................................................................................................... 22
2.1.10 Crowdsourced Oracle ........................................................................................... 23
2.1.11 Program Checkers ................................................................................................ 23
2.1.12 Semi Proving ........................................................................................................ 24
2.2 Metamorphic Testing .................................................................................................. 24
2.2.1 History .................................................................................................................. 24
2.2.2 Advantages over Other Approaches ..................................................................... 25
2.2.3 Application Areas ................................................................................................ 27
2.2.4 Progresses in Metamorphic Testing Methodologies ............................................ 40
2.3 Summary ..................................................................................................................... 44
3 Cost Saving Strategies for Metamorphic Testing ........................................................... 47
3.1 Metamorphic Testing – Concepts, Definitions and Procedures .................................. 47
3.2 Cost Analysis of Metamorphic Testing ....................................................................... 49
3.2.1 Analysis of Testing Procedures ............................................................................ 50
3.2.2 Analysis of Functional Components .................................................................... 53
3.3 Cost Saving Strategies ................................................................................................ 55
3.3.1 Cost Saving Strategy I: Reuse Existing Metamorphic Relations from Similar or
Related Software Applications ............................................................................. 55
IX
3.3.2 Cost Saving Strategy II: Use Readily Available Test Cases or Reuse Existing Test
Cases as Source Test Cases .................................................................................. 57
3.3.3 Cost Saving Strategy III: Reuse or Partly Reuse Source Test Case as Follow Up
Test Case .............................................................................................................. 57
3.3.4 Cost Saving Strategy IV: Reuse The Output of Source Test Case as Follow Up
Test Case .............................................................................................................. 59
3.3.5 Cost Saving Strategy V: Pairing Existing Test Cases .......................................... 59
3.3.6 Cost Saving Strategy VI: Partial Checking of Test Outputs ................................ 60
3.4 Adopting Cost Saving Strategies in Developing Cost-effectiveness Metamorphic
Testing Techniques ................................................................................................... 61
4 Cost-effective Metamorphic Testing Technique for Edge Detection Programs ............ 63
4.1 Introduction ................................................................................................................. 63
4.2 Metamorphic Relations for Failure Detection in Edge Detection Programs ............... 65
4.3 Faulty Edge Detection Programs ................................................................................ 67
4.3.1 Programs with Seeded Single Operator Fault ...................................................... 67
4.3.2 Program with Real Fault - Stride Implementation Fault ...................................... 68
4.4 Experiments ................................................................................................................ 69
4.4.1 Test Inputs ............................................................................................................ 69
4.4.2 Results .................................................................................................................. 71
4.4.3 Observations on the Detection of Faulty Programs with a Single Operator Fault 72
4.4.4 Observations on the Detection of Faulty Program with Stride Implementation
Fault ..................................................................................................................... 72
4.5 Discussions ................................................................................................................. 73
5 Cost-effective Metamorphic Testing Technique for Financial Charting Components... 76
X
5.1 Introduction ................................................................................................................. 76
5.1.1 Test Target – Financial Charting Software Components ..................................... 79
5.2 Testing Technique ....................................................................................................... 84
5.2.1 Developing Cost-effective Metamorphic Testing Technique .............................. 84
5.2.2 Defining Assertion Conditions ............................................................................. 90
5.3 Experiments ................................................................................................................ 91
5.3.1 Setup..................................................................................................................... 91
5.3.2 Selection of Source Test Cases ............................................................................ 93
5.3.3 Experimental Results ........................................................................................... 95
5.4 Debugging ................................................................................................................... 98
5.5 Reusability of the Metamorphic Relations and Assertion Conditions Proposed to Other
Financial Charts....................................................................................................... 101
5.5.1 Renko Chart ....................................................................................................... 101
5.5.2 Kagi Chart .......................................................................................................... 102
5.5.3 Three-line Break Chart ....................................................................................... 103
5.6 Discussions ............................................................................................................... 104
6 Cost-effective Metamorphic Testing Technique for Real-time Technical Indicators .. 107
6.1 Introduction ............................................................................................................... 107
6.2 Test Targets - Technical Indicators ........................................................................... 109
6.2.1 Moving Averages ............................................................................................... 109
6.2.2 Relative Strength Index ...................................................................................... 112
6.3 Testing Technique ..................................................................................................... 113
6.4 Experiments .............................................................................................................. 117
XI
6.5 Discussions ............................................................................................................... 119
7 Cost-effective Metamorphic Testing Technique for Finite State Machines ................. 121
7.1 Introduction ............................................................................................................... 121
7.2 Background – Finite State Machine .......................................................................... 124
7.2.1 Preliminaries ...................................................................................................... 124
7.3 Assumptions .............................................................................................................. 126
7.4 Limitation of Transition Tour ................................................................................... 127
7.5 Cost-effective Metamorphic Testing Technique based on Transition Tour.............. 129
7.6 Proof of Fault Detection Capability for all Transfer Faults ...................................... 131
7.7 Reusability to Detect RESET Fault .......................................................................... 133
7.8 Discussions ............................................................................................................... 133
8 Conclusions and Recommendations ............................................................................. 135
8.1 Conclusions ............................................................................................................... 135
8.2 Recommendations of Future Work ........................................................................... 138
References… ..................................................................................................................................... 141
List of Publications ........................................................................................................................... 159
XII
List of Tables
Table 2-1 Application areas in which successful deployment of metamorphic testing have been
reported ............................................................................................................................... 28
Table 3-1 A comparison of testing procedures between metamorphic testing and conventional testing
............................................................................................................................................ 50
Table 4-1 Collection of 30 images used as test inputs .......................................................................... 70
Table 4-2 Fault detection effectiveness of the four metamorphic relations .......................................... 71
Table 4-3 Overall fault detection effectiveness .................................................................................... 71
Table 4-4 Detection of faulty program with stride implementation error ............................................. 73
Table 5-1 Six data series used as source test cases in the experiments ................................................. 93
Table 5-2 Test result for DJI30 and KS11 data series .......................................................................... 95
Table 5-3 Test results for MSFT data series ......................................................................................... 95
Table 5-4 Test results for randomized data series: DJI30-R, MSFT-R and KS11-R ............................ 95
Table 6-1 The sliding windows approach to calculate Simple Moving Average ............................... 111
Table 6-2 Faulty versions for each technical indicator and the violations of metamorphic relations . 118
Table 7-1 Corresponding state table of the FSM in Figure 7-1 .......................................................... 126
XIII
List of Figures
Figure 3-1 Functional components of metamorphic testing ................................................................. 54
Figure 4-1 Conventional manual testing rely on subjective human judgment to detect failure in image
processing program using standard test images such as “Lena” ......................................... 64
Figure 4-2 An original image with the dimension of 283 x 212 pixels. Note that the image width is not
multiple of four which is the stride width. When the image is saved, the horizontal
dimension of this image will be padded until 284 which is the closest multiple of four .... 68
Figure 4-3 The circled diagonal line is an additional line resulted from the stride implementation error
in Sobel edge detection program ......................................................................................... 69
Figure 5-1 Line chart of daily closing price data of Dow Jones Industry 30 Index from 2008 to 200982
Figure 5-2 Point and Figure chart of Dow Jones Industry 30 Index from 2008 to 2009, with box size =
200 and reversal amount = 3 ............................................................................................... 82
Figure 5-3 Point and Figure chart of Dow Jones Industry 30 Index from 2008 to 2009, with box size =
300 and reversal amount = 5 ............................................................................................... 82
Figure 5-4 Algorithm for constructing Point and Figure chart ............................................................. 83
Figure 5-5. The experiment set up for testing of Point and Figure charting component ...................... 92
Figure 5-6 Screen capture of output from charting component for Seoul Composite Index (KS11)
closing price from June 2008 to May 2009. The box size and the reversal amount are set to
40 and 3, respectively ......................................................................................................... 92
Figure 5-7 Line chart for the original data series that consist of 40 data points in chronological order
............................................................................................................................................ 92
Figure 5-8 Line chart for the data series that consist of the same 40 data points in Figure 5-7, but in
randomized order ................................................................................................................ 93
Figure 5-9 Omission error in the implementation of Step 4 of the Point and Figure chart algorithm 100
Figure 5-10 Misplace of “increment i” statement in the implementation of Step 4 of the Point and
Figure chart algorithm ....................................................................................................... 100
XIV
Figure 5-11 Initialization errors in the implementation of Step 2 of the Point and Figure chart
algorithm ........................................................................................................................... 100
Figure 5-12 Insertion error in the implementation of Step 4 of the Point and Figure chart algorithm 101
Figure 5-13 Renko chart with a brick size of 300 ............................................................................... 103
Figure 5-14 Kagi chart with a minimum reversal of 500 .................................................................... 103
Figure 5-15 Three-line-break chart ..................................................................................................... 104
Figure 6-1 A 100-day simple moving average (the smoothed line) as the technical indicator for EUR-
to-USD daily exchange rate .............................................................................................. 111
Figure 6-2 A 14-day relative strength index (in the lower Windows) as the technical indicator for the
EUR-to-USD daily exchange rate ..................................................................................... 113
Figure 6-3 Alert messages on the MetaTrader 4 Client Terminal when the MRs for SMA are violated
during testing .................................................................................................................... 118
Figure 7-1 Transition diagram of an FSM, MS .................................................................................... 126
Figure 7-2 Specification machine of an FSM, MS ............................................................................... 128
Figure 7-3 Faulty implementation 1, MI1 (output fault from State 2 to State 3) ................................. 128
Figure 7-4 Faulty implementation 2, MI2 (transfer fault from State 3/input b) ................................... 128
1 Introduction
More than ever, human being are relying on software driven systems to in day-to-day
activities, ranging from social, entertainment, communication, business, finance, to mission
and safety critical activities. Despite advances in software development technologies and
processes, software failures remain a common problem in increasingly complex software
applications. Errors committed by programmers leave faults, bugs or defects in software
codes which cause software to fail during runtime. Such failures include software crashes,
incorrect behaviors, incorrect outputs or other forms of malfunctions. Software failures not
only result in inconveniences, but also lost of productivity, business opportunity, reputation
or even human live in mission or safety critical systems.
While no comprehensive study has been done to estimate the global economic loss
caused by software failures, a study conducted by the National Institute of Standards and
Technology (NIST) in 2002 reported that the economical lost caused by software failures in
USA alone is estimated to be $56 Billion a year (Newman, 2002). The losses incurred in
past and recent incidents of software failures suggest that this is not an over estimation. In
1996, an Inertial Reference System (IRS) software failure aboard Ariane 501 satellite
launcher resulted in catastrophic failure of the rocket 40 seconds after launch and caused a
US$370 million loss (Dowson, 1997). In UK, software bugs caused warehouses to disappear
from the supply-chain management system of British food retailer J Sainsbury PLC. As a
result, the British food retailer was forced to write off its US$526 million investment in the
automated supply-chain management system (Charette, 2005). Software bugs also
contributed to US$3.45 billion tax-credit overpayment by UK Inland Revenue in year 2004
and 2005. More recently, Knight Capital Group, an American stock market brokering
company, lost US$440 million in the first 20 minutes trading on 1 August 2012 due to a bug
in the new trading software it began to use on that day (Ogheneovo, 2014).
2
Software failures may also result in far reaching consequences beyond financial
losses. In 2010, car manufacturer, Toyota, suffered a major blow in its reputation when a
problem in software system that caused sudden acceleration in a model of Toyota cars was
widely reported by media worldwide (Cumming, 2010). Consequently, Toyota had to settle
a lawsuit arising from the sudden acceleration problem after a US$3-million verdict (Hirsch
and Bensinger, 2013). In June 2011, cloud-based file storage provider Dropbox suffered a
backlash in its user confidence when software bugs temporarily allowed users to log in to
any of its 25 million users’ accounts using any arbitrary password (Cachin and Schunter,
2011). These incidents of software failures not only caused damage to the reputation of a
company, but also could lead to further legal ramifications.
In mission and safety critical software, software failures could lead to injuries or even
loss of human lives. From 1985 to 1987, at least three patients in the United States and
Canada were killed by massive radiation overdose from defective computer-controlled
radiation therapy machines manufactured by the Atomic Energy of Canada (Ogheneovo,
2014). In 2006, a bug in software aboard a Boeing 777 commercial jet provided incorrect
speed and acceleration data to the aircraft computer system and caused an out-of-control
3000 feet climb over the Indian Ocean during a flight from Perth, Australia to Kuala
Lumpur, Malaysia (Michaels and Pasztor, 2006). Fortunately, the pilots were able to regain
control and manually flew the plane carrying 177 passengers safely back to Australia.
While economic and reputation losses can be recovered, loss of lives caused by
software failures would be a risk that is unacceptable and unbearable by both the software
producers and users. Therefore, testing software to detect failures prior to its release is one
of the most important processes in a typical software life-cycle that involves planning,
requirement analysis, design of requirements, implementation, testing and maintenance
(Everett and McLeod Jr, 2007). Past study by Collofello and Woodfield (1989) showed that
50% or more of software project costs were attributed for testing and debugging the
software. Evidently, software testing is an expensive but crucial and inevitable process that
3
incurs substantial costs in software projects. In view of this, the cost-effectiveness of
software testing techniques is of utmost concern to software testing practitioners and project
managers alike.
1.1 Background
1.1.1 Whyisitsodifficulttodetectfailuresinsoftware?
There are two fundamental problems in detecting software failures (Chen et al.,
2003). Firstly, it is not possible or prohibitively expensive to test a software application for
all possible input combinations (that is, all possible ways it interacts with its users). For
instance, for a simple alarm clock software on smartphone that accepts time (in mm/hh
format) and date (in dd/mm/yyyy format) as its inputs, there are more than 5.3 billion inputs
(60*24*31*12*9999 for combination of all possible values of mm/hh and dd/mm/yyyy) to
test. For that reason, despite extensive testing, stringent software quality control and failure
free operation for years, a bug in week-number algorithm remained undetected and
reportedly caused Apple iPhone™ 4 alarm clock application failed to work on 1st January
2011. From this example, it is evident that exhaustive testing to detect all software failures
is prohibitively expensive and practically infeasible even in simple software like Apple
iPhone™ 4 alarm clock with limited input variables and values, not to mention more
complex software systems. Therefore, it is known that non-exhaustive software testing can
only show the presence of failures, but never the absence of failures (Buxton and Randell,
1970). This is a fundamental limitation of software testing.
The second fundamental problem in software testing is the oracle problem (Weyuker,
1982), where testers are not able to determine the correctness of the outputs produced by the
software. Given a test case as input, an oracle is the mechanism to specify the correct
expected output for the software or component under test, given an arbitrary input. Oracle
problems occur when the correct outputs are either unknown or too expensive to derive by
4
other means. As a result, testers are not able to detect the presence of software failures
during the testing process.
1.1.2 OracleProblems
Oracle problem has been a long standing fundamental problem in software testing
because many software applications are developed to find answers to unsolved problems in
the first place (Weyuker, 1982). If the answers are known, there would be no need to
develop the software. Software applications with oracle problems are commonly found in
many domains, including numerical computing, scientific computing, simulation and
modelling, embedded system, machine-learning, just to name a few. In these software
applications, the correct outputs are either unknown or too expensive to derive by other
means.
On the other hand, with the advent of big data, many information processing software
applications have also been designed to read and process a huge amount of raw data into
useful information in forms of graphics and charts. However, verifying the correctness of
such software applications is a very challenging task. Due to the complex and graphical
nature of the software outputs, testers have to manually inspect the outputs produced by the
software and exercise their judgment to determine the correctness of the output for each test
input. They may have to manually construct the output and judge the difference between the
constructed output and the output produced by the software. This approach is known as
manual oracle. This is a tedious and error-prone task for any non-trivial inputs and outputs.
To make it worse, the correct outputs are also often unknown or too expensive to derive by
other means. In this situation, testers will not be able to determine the correctness of the
outputs produced by the software.
As hardware speed advances, software systems are developed to undertake more
complex computation tasks and process larger amount of data than ever. As a result, oracle
problem will become a more widespread and common problem in software testing.
5
1.1.3 Howtodetectsoftwarefailuresintheabsenceoforacle?
In the absence of oracle, verifying the correctness of software outputs cannot be done
unless there exist some “pseudo oracles” (Davis and Weyuker, 1981), in which multiple
independently-developed implementations of the same software application are used to
compare the outputs produced for a given input. However, past study by Knight and
Leveson (1986) suggested that pseudo oracles not only are expensive to deploy, but also
may not be feasible or effective. This is because multiple implementations may not exist.
Even if they do exist, they may have been created by the same group(s) of developers who
are prone to commit the same type of error. As a result, the pseudo oracle may not be
trustable.
Apart from pseudo oracle, partial oracles (Young, 2008) have also been proposed to
address the oracle problem in software testing. In the absence of oracle, there can still be a
limited set of special and simple input values for which the output values is known or can be
easily derived. This set of special input values form the partial oracle of the software under
test. However, this limited set of special and simple input values have been shown to have
very limited failure detection capability (Weyuker, 1982; Murphy and Kaiser, 2008).
In the absence of both trustable pseudo oracle and complete oracle, metamorphic
testing (Chen et al., 1998) has emerged as a way not only to detect failures in software under
test in the absence of oracle but also to generate follow up test cases from existing ones. In
metamorphic testing, if input x produces an output f(x), the necessary property (known as
“metamorphic relation”) of the software under test can be used to generate a follow test
case x’ for which the output f(x’) can be determined or predicted based f(x). If the output
f(x’) is not as expected according to the metamorphic relation, then we can conclude that the
software under test has failed.
The following example illustrates how metamorphic testing can be used to detect
failure in a program that has been written to compute the mean for a set of 1000 whole
numbers. When set A = {a1, a2, …, a1000} is used as the test input to the program and the
6
program produces 699.6 as the computed output. However, the correctness of this output
cannot be verified because the expected correct output is unknown and too expensive to be
computed manually (in other words, the oracle is absence). Fortunately, we know that if we
add 1 to each element in set A, the computed mean will also increase by 1. Using this
necessary property of mean computation as the “metamorphic relation”, we can detect a
failure in this program whenever this metamorphic relation is violated. In this case, the
program should produce 699.6+1 = 700.6 as the computed output when set B = {a1+1, a2+1,
…, a1000+1} is used as test input. In metamorphic testing, set A serves as the source test
case, while set B serves as the follow up test case. If the mean computed for set B is not
larger than set A by exactly 1, then we can conclude that the software under test has failed
because the metamorphic relation is violated. Therefore, metamorphic testing provides a
reliable way to detect any failure that causes violation to the metamorphic relation without
the presence of oracles. Furthermore, metamorphic testing does not require multiple-
implementations to provide pseudo-oracle. Hence, it is less expensive to deploy in testing
compared to constructing complete or pseudo-oracle.
1.2 Problem Statements
Even though metamorphic testing approach is effective in detecting failures in
software with oracle problem, this failure detection capability comes with additional costs
which are inherent parts of the metamorphic testing approach. While metamorphic testing is
less expensive to deploy in testing compared to constructing complete oracle or pseudo-
oracle, it has a few additional costs that do not exist in the conventional software testing
process where oracles are available.
The first additional cost of metamorphic testing is the cost to identify metamorphic
relations for the software under test. The second additional cost is the cost of generating one
or more follow test cases for each source test case. As a result, the total number of test cases
to be generated in metamorphic testing is at least double of those in the conventional
7
software testing process. Lastly, the third additional cost of metamorphic testing is the cost
of running or executing the additional follow up test cases generated. Therefore, the total
number of test cases to be run or executed in metamorphic testing is also at least double of
those in conventional software testing process.
Early studies related to metamorphic testing have been focusing primarily on using
this innovative testing approach to alleviate oracle problems in a wide range of application
domains such as numerical computation (Chan et al., 1998; Chen et al., 2002a; Sim et al.,
2005; Aruna and Prasad, 2014a), web services and applications (Chan et al., 2007b; Zhou et
al., 2007; Castro-Cabrera and Medina-Bulo, 2011; Sun et al., 2012; Zhou et al., 2012; Aruna
and Prasad, 2014b), machine learning (Murphy and Kaiser, 2008; Murphy et al., 2008; Xie
et al., 2011), simulation and modelling (Chen et al., 2009b; Murphy et al., 2011; Segura et
al., 2011; Ding et al., 2011; Li and Offutt, 2014; Núñez and Hierons, 2014), embedded
systems (Tse and Yau, 2004; Chan et al., 2005a; Chan et al., 2006; Chan et al., 2007a; Kuo
et al., 2011; Jiang et al., 2013) and bio-medical systems (Chen et al., 2009a; Pullum and
Ozmen, 2012; Ramanathan et al., 2012). Attempts have also been made to improve the
failure detection effectiveness of metamorphic testing through selection of metamorphic
relations (Chen et al., 2004a; Liu et al., 2014) and test case diversity (Chen et al., 2012;
Asrafi et al., 2011).
Despite intensive research efforts in the area of metamorphic testing, little attention
has been paid to address the problem of additional costs incurred in the metamorphic testing
process. In view that software testing and debugging may account for 50% or more of
software project costs (Collofello and Woodfield, 1989), improving the cost-effectiveness of
metamorphic testing is crucial for its successful deployment beyond research labs and wide
adoption in the software testing industry. Therefore, studies in this thesis focus on reducing
or eliminating the additional costs of metamorphic testing and proposing cost-effective
metamorphic testing techniques.

8
1.3 Objectives
In order to address the additional cost problems in metamorphic testing, studies
presented in this thesis aims to improve the cost-effectiveness of metamorphic testing. More
specifically, this thesis has the following objectives:
1. to analyze metamorphic testing procedures and functional components to
identify the additional costs incurred,
2. to propose cost saving strategies to reduce or eliminate the additional costs
of metamorphic testing,
3. to design and develop cost-effective metamorphic testing techniques by
incorporating the cost saving strategies proposed to detect failures in
software with oracle problem, and
4. to evaluate the failure detection capability of the proposed cost-effective
metamorphic testing techniques.
1.4 Contributions
This thesis attempts to tackle the problem of additional costs incurred in metamorphic
testing and presents the first extensive study on improving the cost-effectiveness of
metamorphic testing. The contributions of this thesis are as follow:
1. This thesis presents the first attempt to analyze the costs incurred in metamorphic
testing procedures and functional components. Based on the cost analysis, six novel
cost-saving strategies are proposed to improve the cost-effectiveness of
metamorphic testing by reducing or eliminating the additional costs incurred in the
metamorphic testing procedures and functional components. Of the six cost-saving
strategies, four are proposed based on the notion of “reuse”, which has been a
prevalent concept in improving cost-effectiveness in the software engineering
industry (Boehm, 1981; Frakes and Kang, 2005). These cost-saving strategies are
namely, reuse existing metamorphic relations, reuse existing test cases as source test
9
cases, reuse or partly reuse source test case as follow up test case, and lastly, reuse
the output of source test case as follow up test case. Apart from these four reuse-
based cost-saving strategies, two additional cost-saving strategies have also been
proposed to improve the cost-effectiveness of metamorphic testing. These strategies
are namely, pairing existing test cases to form source and follow up test case pair
and partial checking of test outputs. The proposed cost-saving strategies can be used
in isolation or in combination to reduce the additional costs incurred in the
metamorphic testing procedures and functional components, hence, improve the
cost-effectiveness of the metamorphic testing techniques developed.
2. New cost-effective metamorphic testing techniques have been proposed in this
thesis to detect failures in four different software applications with oracle problems,
namely, edge detection program (image processing software), financial charting
software component, real-time technical indicator and finite state machines (FSM).
Studies conducted in these four software applications have demonstrated that the six
generic cost saving strategies proposed in this thesis can be used to detect failures in
software with oracle problem from four different application domains, either in
isolation or in combination to effectively improve the cost-effectiveness of
metamorphic testing. Furthermore, the proposed metamorphic testing techniques
also demonstrated for the first time how metamorphic relations identified for a
software application can be reused in other software application, how source test
case and its output can be reused or partially reused as follow up test case to reduce
and eliminate the cost of generating following up test cases and how pairing of
existing test cases can totally eliminate the needs to generate source test cases and
follow up test cases.
Additionally, experiments and theoretical analysis have also been conducted to
evaluate the effectiveness of the proposed cost-effective metamorphic testing
techniques. The experiment results have shown that the proposed cost-effective
10
metamorphic testing techniques have successfully detected failures caused by real
or seeded faults in these four software applications
3. Through the proposed cost-effective metamorphic testing technique to detect
failures caused by transfer fault in FSM, this thesis has also made a contribution to
overcome a long standing fundamental limitation of transition tour in detecting
failures caused by transfer fault in FSMs.
1.5 Scope
This thesis focuses on cost saving strategies for metamorphic testing and cost-
effective metamorphic testing techniques. As metamorphic testing is generally regarded as a
highly and easily automatable testing approach (Xie et al., 2009), studies presented in this
thesis will not include automation as a strategy to improve the cost effectiveness of
metamorphic testing. In addition, testing techniques proposed in this thesis focus on
detecting subtle failures that are otherwise difficult to detect. In order to preserve the
coherency of the thesis, detection of obvious failures such as software crashes is excluded
from this thesis even though cost-effective testing technique to detect such failures has also
been developed as part of my PhD study. Interested readers are referred to Sim et al. (2011)
for details of this work.
1.6 Structure of the Thesis
The remaining of this thesis is organized as follow:
Chapter 2 reviews literatures on progresses made in addressing the oracle problem as
well as past and recent research work done in the area of metamorphic testing. Cost analyses
on metamorphic testing procedures and functional components are then presented in
Chapter 3 of this thesis. Based on these analyses, six generic cost saving strategies for
metamorphic testing approach are then proposed in the same chapter. In Chapter 4, a cost-
effective metamorphic testing technique is proposed to detect failure in edge detection
program. Reuse of metamorphic relations from related application is adopted as the primary
11
strategy to reduce the cost of identifying metamorphic relation. In addition, the metamorphic
testing technique proposed also makes use of existing real life images to totally eliminate
the cost of generating the source test cases. In Chapter 5, a cost-effective metamorphic
testing technique is proposed in combination with assertion testing to detect failures in
financial charting software. The metamorphic relations are proposed based on three of the
six cost saving strategies to improve its cost-effectiveness. In addition, readily available
historical financial time series data are used as source test cases to further save the cost of
metamorphic testing. Furthermore, partial checking of test output through data label
extraction is proposed as a strategy to save the cost of output checking. Subsequently,
Chapter 6 presents a new metamorphic testing technique to detect failures in real-time
technical indicator financial trading software. As real-time data cannot be manipulated to
generate follow-up test cases, pairing of real-time test cases that satisfy the metamorphic
relation is proposed to totally eliminate the cost of generating source test cases and follow
up test cases. Chapter 7 presents an innovative and cost-effective metamorphic testing
technique to detect failure caused by transfer fault in FSM based on the transition tour
technique. The transition tour which serves as the source test case is reused as the follow-up
test case to eliminate the cost of generating follow up test case while guaranteeing the
detection of transfer faults. Apart from improving cost-effectiveness, this innovative
technique also overcomes a long standing fundamental limitation of transition tour in
detecting transfer fault in FSMs.
Chapter 8 concludes the thesis and recommends the future working directions.
12
2 Background and Literature Review
This chapter presents the background and literature review for the work presented in
this thesis. An overview of oracle problem and previous works done to address this problem
in the field of software testing are first presented in Section 2.1. This is followed by Section
2.2 which reviews the applications of metamorphic testing since the inception of this testing
approach as well as the progresses made in improving its methodologies of implementation.
Section 2.3 summaries the literatures reviewed to highlight the problems that have yet to be
addressed in the previous work in this area.
2.1 Oracle Problems
The term “oracle” was first used by Howden (1978) in the context of software testing.
In a later study on testing of non-testable program, Weyuker (1982) defined “oracle” as a
mechanism which checks the correctness of program outputs. The “oracle problem” in
software testing generally refers to the challenge or difficulty of distinguishing the correct
expected behavior or output from incorrect behavior or output for a given input (Weyuker,
1982; Barr et al., 2015). Oracle problems may occur in software testing when the oracle is
either not available (absence of oracle), theoretically available but practically too expensive
to derive, or available but too expensive to apply to distinguish correct outputs from the
incorrect ones. In these circumstances, testers are not able to decide if the software under
test have produced the correct outputs or behaved correctly for an arbitrary test input.
Progresses made in addressing these three circumstances that cause oracle problems are
presented in the following subsections.
In software testing, the test oracles are normally be derived from the specifications of
the software under testing. However, in practice, there are a few problems that hinder the
derivation test oracle from specifications. Although there exist formal specification
languages such as Boolean specifications (Leveson et al., 1994; Tai, 1996; Mano, 2002),
model-based specification (Bouquet et al., 2007; Fitzgerald and Larsen, 2009; Utting and
13
Legeard, 2010) and algebraic specification (Bernot et al., 1991; Doong and Frankl, 1994; Le
Gall and Arnould, 1996), software specifications are often not specified in the forms
required by formal specification languages (Hall, 1990; Chen et al., 2009d), hence, making
deriving oracles from formal specification not possible. Even if formal specifications are
available, they may suffer from omission problem when the specifications fail to capture all
the behaviors relevant to a requirement (Singhal and Bansal, 2014). Last but not least,
specifications may become out-of-date rapidly as software adapt to changing requirements
and environment (Mens et al., 2005). Therefore, deriving of complete oracles from
specifications may not be viable in reality, resulting in the absence of complete oracles for
testing.
In addition to the absence of complete oracle due to the challenges in deriving
complete oracle from formal specifications, oracle problem could also occur even if
complete oracles are theoretically available but too expensive to be derived. For example,
oracle for a program that is developed to solve the travelling salesman problem (that is, to
find the shortest path in a graph that goes through every vertex exactly once, and returns to
the starting vertex) is theoretically available. However, as the travelling salesman problem is
NP-complete, deriving the oracle (definite shortest path) for a large graph is prohibitively
expensive computationally (Laporte, 1992). Therefore, oracle is practically not available for
this case.
In certain software applications, oracle might be available but too expensive to apply
to distinguish correct outputs from the incorrect ones. For instance, information processing
software such as Open Office Calc may accept a large amount of raw data points as inputs
and plot a line graph as output. While oracle may be available by reproducing the same line
chart by using Microsoft Excel, it is too expensive to be applied because of the large number
of data points. Moreover, automated image to image comparison is not possible because the
line graphs produced by Open Office Calc and Microsoft Excel have different formats,
colors and scales. Therefore, detecting failures in such software application is also
14
challenging because even though the oracle is available, it is too expensive to apply to
distinguish correct outputs from the incorrect one.
In view of these challenges, various approaches have been proposed to derive the
oracle for testing purposes from alternative sources. These approaches include pseudo
oracle, N-version programming, previous versions, special values, assertion condition,
contract, program invariants, human oracles and semi-proving. While none of these
approaches are adequate to provide complete oracle for the software under test, theoretical
and empirical studies have shown that these approaches have provided some forms
incomplete oracles that provided varying levels of failure detection capabilities. The
following subsections provide a brief review on the related work done in each of these
approaches to address the oracle problems. This is followed by a comprehensive review on
progresses made in metamorphic testing in Section 2.2.
2.1.1 PseudoOracle
The term “pseudo oracle” refers to an alternative version of software that satisfies the
same specifications of the software under test. This equivalent version could be developed
independently by a different team of programmers or developed in another programming
language. Pseudo oracle was first proposed by Davis and Weyuker (1981) and Weyuker
(1982) in one of the earliest attempts to test “non-testable programs”, that is, the types of
programs which were developed to find the correct answer in the first place. If the correct
answer were known, there would be no need to write such programs.
Even though pseudo oracle can be used to derive oracle for software under test, its
trust-worthiness and effectiveness remain questionable. Past study by Knight and Leveson
(1986) suggested that pseudo oracles not only are expensive to deploy, but also may not be
feasible or effective. This is because pseudo oracle requires multiple implementations of the
same program which hardly exist in reality due to excessive duplicated cost it incurs to the
software project. Even if it does exist, it may have been created by the same group(s) of
15
programmers who are likely to commit the same type of error. As a result, the pseudo oracle
may not be trustable.
To address these issues in pseudo oracle, McMinn (2011) proposed a testability
transformations approach to automatically generate pseudo oracles. In this study, two
source-to-source program transformations were used to generate pseudo oracles. The first
transformation, Convert-to-Big Decimal Transformation, was designed to detect
inaccuracies numerical computations. On the other hand, the second transformation, Add-
Synchronization Transformation, was designed to detect race conditions in multi-threaded
computing. Random testing and genetic algorithms were then used to automatically select
and run test cases in order to detect differences between outputs of the pseudo oracles and
the software under test. However, the proposed techniques to generate pseudo oracles are
specific to numerical computation and multi-threaded applications, hence, are not applicable
beyond these domains.
2.1.2 N‐versionProgramming
N-version programming (Chen and Avizienis, 1978; Avizienis, 1985) is similar to
pseudo oracle where multiple versions of the software are developed in different ways from
the same software specifications. However, N-version programming differs from pseudo
oracle in the sense that these multiple versions are executed in parallel with the aim to
improve fault-tolerance. It also emphasizes on "independent generation of programs" where
the programing efforts should be carried out by N individuals or groups that do not interact
with each other in the programing process. While it was first introduced as an approach to
fault-tolerant computing, N-version programming can also be used to provide oracle to the
software under test whenever more than one versions of the software are available. In order
to reduce the cost of N-version programming, Feldt (1998) attempted to automatically
generate diverse N-versions of the software using genetic programming. In this study,
16
genetic programming was used to generate 80 versions of a program within an aircraft
arresting system.
2.1.3 PreviousVersions
In regression testing, previous version of the software under test can be used to
provide test oracles for unmodified functionalities of the new version of software under test
(Yoo and Harman, 2012). Although the most straight forward way to detect failures is to
compare the outputs of the software under test and its previous version, failure detections by
comparing other program elements have also been proposed. For example, Harrold et al.
(2000) proposed an approach to detect regression-fault by evaluating differences in code
execution profile (spectra) between the software under test and its previous version.
Even though previous versions can be used provide oracle for unmodified
functionalities of the software under test, executing all test cases from the previous versions
in the regression testing process can be costly. For that reason, a vast proportion of research
efforts in regression testing have been focusing on improving its cost-effectiveness. This is
primarily done through three approaches, namely, test case prioritization, test suite reduction
and test case selection. Test case prioritization studies by Rothermel et al. (2001) and
Elbaum et al. (2002) attempted to optimize the test case execution sequence so that failures
can be detected as early as possible (with fewer test cases executed) in the regression testing
process. On the other hand, studies on test suite reduction for regression testing (Chen and
Lau, 1998; Korel et al., 2002; Smith and Kapfhammer, 2009) attempted to reduce the
number of test cases to be executed in regression testing by removing test cases that
redundant or have become obsolete. Lastly, studies have also been conducted to develop test
case selection techniques that select and execute only a subset of test cases that target the
modified functionality of the software under test (Rothermel and Harrold, 1996; Rothermel
and Harrold, 1997; Graves et al., 2001). It is worth noting because of the modified
17
functionality, such test case selection technique does not have the oracle from the previous
version of the software under test.
Over the last decade, a large number of contributions and literatures have been
published in the area of regression testing indicating that this topic warrants a standalone
review paper on its own. Interested readers are referred to the comprehensive survey
conducted by Yoo and Harman (2012).
2.1.4 AssertionConditions
In the absence of oracles, assertion checking verifies execution of a test case against
some expected and necessary properties during run time (Taylor, 1980; Binder, 2000).
Assertion conditions have been used by Turing (1989) for checking of large routines.
Turing suggested that assertions were first written by software developers and then checked
by software testers as a mean of quality control for large routines. It is a property-based
testing technique, where properties of software under test are identified as assertion
conditions, which are boolean expressions that evaluate to either true or false. An assertion
condition must be satisfied (that is, evaluate to true) for correct implementation and
execution of the software. If the assertion condition evaluates to false, the assertion is
violated and it implies that the software under test has failed. Therefore, assertion checking
does not require a test oracle to detect failures in the software under test. Assertion checking
can be done not only on the output of the software, but also intermediate program states and
variable values. Normally, assertion checking is directly embedded in the code of the
software developed. It is widely supported by popular programming platforms such as the
Microsoft .Net and Java platforms. In C language, GNU Nana (Maker, 1998) has also been
developed to provide support for embedding assertion checking for the programming
language.
To illustrate the use of assertion checking to test software without the presence of
oracles, consider a program that has been developed to compute the cos(x) function. Let x =
18
24° be a test input to the program. As the expected output is unknown (in other words, the
oracle is absence), the computed output cannot be verified. However, we can use the
trigonometry property of sine function -1≤ cos(x) ≤ 1 as an assertion condition for assertion
checking. We know that if the program is implemented correctly, then the program output
must satisfy this assertion condition (that is, the assertion condition must evaluate to true). If
the program output is not between -1 and 1 (both inclusive), then the assertion condition will
evaluate to false and cause an assertion error message to be prompted on most programming
platforms. In that way, we will know that the software under test has a fault even though the
expected output is unknown.
Assertion checking has been successfully deployed to detect state-related errors in
object-oriented program (Helm et al., 1990) as well as analyze the state-based behaviors
(Briand et al., 2004). Assertion conditions have also been used to detect failures in
regression testing process by automatic expansion of unit-test suites (Xie, 2006). More
recently, assertion checking has also been proposed to monitor software runtime behaviors
in order to check whether metamorphic relations hold during program execution (Murphy et
al., 2009).
The use of assertion condition as test oracle has been proposed in numerous studies in
software testing. In a study on conducting unit testing using JUnit (Cheon and Leavens,
2002), the author proposed the use of assertion conditions to provide test oracle on JML.
Later, Coppit and Haddox-Schatz (2005) proposed the use of specification-based assertion
conditions as test oracle.
2.1.5 Contracts
Contract-based programming languages like Eiffel (Meyer, 1988) take the idea of
assertion a step further by defining pre-conditions and post-conditions of routine or
methods, class invariants, loop variants and invariants and check instructions that serve as
the contracts in design. Like assertion conditions, these design contracts which form the
19
semantic of the software can also serve as test oracles for software under test because
violation of design contracts indicates faulty implementation which may lead to software
failures during executions.
An early attempt to apply design contracts in testing was presented by Aichernig
(2003) where the author showed how test cases could be derived from contracts using a
refinement calculus. Since then, contract-based testing has gained momentum in the
software testing research community particularly to provide test oracle in the testing process
of web services and software components. In 2005, Heckel and Lohmann (2005) proposed
the use of graph transformation rules to visualize contracts for testing of web services which
requires service specifications in forms of contracts specifying pre-condition and post-
conditions of the required and the provided service operations. This was followed by the
work of Dai et al. (2007) which extended traditional content of design contract to include
more information such as process control and proposed automatic generation of test cases as
well as test oracles in testing of web services. In a related study, Bai et al. (2007) proposed a
new framework for contract-based collaborative verification and validation of web services.
Contract-based testing has also been deployed in testing of software components. In
2005, Jiang et al. (2005) proposed a cost-effective contract-based component testing which
makes use of mutation operators to reduce the number of mutants generated. At the same
time, Valentini et al. (2005) presented a testing framework for software components named
CrashIt which made use of expandable contract-checkers to detect violation of contracts
through communication between the supplier and the client software components.
Subsequently, an automated, contract-based user testing of commercial-off-the-shelf
components was proposed by Briand et al. (2006) to enable component users to test the
component provided by the component vendors through contract specifications. The use of
contracts in testing software components was then extended into integration testing and
architecture design (Damm et al., 2011), where contracts for functional and real-time
20
aspects of software components are deployed in a novel approach for integration testing of
systems that are composed from these software components.
2.1.6 ProgramInvariants
Program invariants refer to program properties or conditions must remain true for the
whole or a portion of the execution life time of the software under test. Therefore, violation
of program invariants during run time can be used as oracle to detect failure in the software
under test. However, just like formal specifications, program invariants are often not
specified explicitly. Therefore, research efforts in this area have been focusing on obtaining
or inferring program invariants from the software under test.
The initial attempt to infer program invariants from the software under test was
presented by Ernst et al. (2001). In this study, dynamic analyses were proposed to mine
potential program invariants based on execution traces for small programs where program
invariants were automatically and accurately inferred to detect program failures in new
version by checking if these inferred program invariants were still intact in the new version
of software under test through regression testing. Later, this approach of inferring program
invariants was implemented into an automated tool named Daikon (Ernst et al., 2007).
A main challenge in inferring program invariant through dynamic analysis is the
accuracy of the inferred invariants. While it is true that running more test data may improve
the accuracy of the inferred program invariants (Ernst et al., 2001), empirical study by
Polikarpova et al. (2009) reported that automated techniques can only discover about 60%
of the program invariants or contracts discovered by human programmers. Conversely,
about 33% of the discovered program invariants or contracts discovered by automated
techniques are falsely classified as program invariants. More recent empirical study by
Staats et al. (2012) reported that about 50% of program invariants discovered through
automated tools are false discovery. In view of that, techniques to infer accurate program
21
invariant are far from maturing despite their promising prospects to provide oracle in the
testing process.
Apart from attempts to improve the accuracies of the inferred program invariants
(Wei et al., 2011a; Wei et al., 2011b), numerous other studies have also been conducted to
enhance the cost-effectiveness of inferring program invariants. For example, a tool named
Houdini (Flanagan and Leino, 2001) has been developed to automatically generate a large
number of program invariants for model checker ESC/Java using static analysis instead of
more costly dynamic analysis technique. This was followed by DySy (Csallner et al., 2008),
an automated tool that made use of dynamic symbolic execution to infer program invariants.
Despite being less costly computationally, DySy was able to infer most of the program
invariant discovered by the Daikon (Ernst et al., 2007) while reducing the number of false
discovery at the same time.
2.1.7 Anomalies
Program anomalies such as program crash, force close or other forms of abnormal
termination are clear indication of software failures. Detection of such failures does not
require oracles derived from specifications or other sources. A common method to discover
program anomalies is by fuzzing (Miller et al., 1990; McNally et al., 2012), a process where
a large amount of random inputs are used to run the software under test with the aim to
crash it. Apart from using random inputs, more cost-effective fuzzing techniques have also
been developed using adaptive random test case generation technique detect failures in
embedded system (Sim et al., 2011).
In addition to detect obvious failures like crashing, program anomalies has also been
used widely in other types of testing. For example, in security testing, anomalies such as
memory leaks, buffer overflows and unhandled exceptions are clear indication of security
vulnerability (Bekrar et al., 2011). On the other hand, in non-functional testing such as
22
performance testing, anomalies in performance metrics can be used to detect degradation
errors in the server system under test (Malik et al., 2013).
2.1.8 SpecialValues
In the absence of complete oracle, special values for which the correct outputs are
known can be used to construct subsets of the complete oracle. For instance, consider a
program that has been developed to compute the trigonometry function cos(x). Although the
correct outputs of any arbitrary values of x are generally unknown, there exist a set of
special values of x for which the correct outputs are known. These special values of input x
include 0°, 30°, 45°, 60°, 90° etc. because the results for cos (0°), cos (30°), cos (45°), cos
(60°), cos (90°) etc. are well known. The use of special values to software with oracle
problem first appeared in Weyuker (1982). However, the use of special values was shown to
be inadequate to detect failures that exist in software with oracle problem in a later study on
testing of numerical program where oracle is not available (Chen et al., 2002a). The same
finding was reiterated in case studies on testing of trigonometric program and search
program in the absence of oracle by Chen et al. (2004b) and in a later study by Peng et al.
(2005).
2.1.9 HumanOracle
When no other sources or artifacts from which oracle can be derived, testers often
have to fallback to manual construction of test oracle and subjective evaluation to judge the
correctness of test outputs. This approach is known as human oracle (McMinn et al., 2010).
Human oracle is not only expensive, but also prone to misjudgment errors for any non-
trivial software. Furthermore, when human oracle is used, tester may tend to use trivial
values as test inputs to make manual construction of test oracle easier. Such biased selection
of trivial test input indirectly jeopardizes the chance of detecting failures (Hamlet, 1994).
In order to address this problem, McMinn et al. (2012) later proposed to source
realistic test cases from the web by mining string inputs entered by human users. Such

23
realistic test cases are not only free from tester’s bias, but also more easily understood by
testers compared to randomly generated strings which usually have poor semantic and
meaningless. Moreover, it is also easier for tester to manual construct oracle from such
realistic test cases compared to randomly generated test cases. Apart from benefiting the
processes required for human oracle, empirical study by Bozkurt and Harman (2011) also
showed that realistic test cases mined from web services are more effective in detecting
failures that are being triggered by users compared to randomly generated test cases.
2.1.10 CrowdsourcedOracle
Crowdsourcing is an innovative way to solve problems that requires substantial
human involvements to solve. Such problem is split into small portions that can be delivered
through internet to a crowd of users to solve. Crowdsourcing was first used in software
testing for non-functional testing, particularly usability testing. In a recent study, Liu et al.
(2012a) leveraged on the Amazon Mechanical Turk and CrowdFlower to perform usability
testing for a graduate school website and compared its effectiveness with traditional face-to-
face usability test in the lab. A separate study by Nebeling et al. (2012) demonstrated
crowdsourced testing of web interfaces using CrowdStudy toolkit under many different
conditions.
In addition to usability testing, the use of crowdsourcing has also been extended to
functional testing to provide test oracle. In a study to obtain crowdsourced oracle (Pastore et
al., 2013), crowd users are asked to detect failure in the software under test if an assertion
does not match the behavior described in the code documentation provided to them. As
crowdsourced oracles are derived directly from human crowd, it can be considered an
augmentation to human oracles described in the previous subsection.
2.1.11 ProgramCheckers
Program checkers were first proposed in 1990’s to automate and enable failure
detection without human oracle. Blum and Kannan (1995) proposed program checkers as
24
part of “programs that check their work” where program checkers for sorting, matrix rank
and greatest common divisor were designed based on probabilistic interactive proof in
modern cryptography. This work was extended by Adleman et al. (1995) who proposed
more efficient program checkers for number-theoretic computation.
2.1.12 SemiProving
Semi-proving was first proposed by Chen et al. (2002b) to show the absence of
certain failures by verifying necessary properties for program correctness without having to
specify the complete oracle for the software under test. This approach combined global
symbolic evaluation with property-based testing of the software under test. Semi-proving is
also easier than the conventional proving because verifying necessary properties for
program correctness is weaker than verifying program correctness. In addition to proving
and testing, they further developed this approach to integrate debugging into the semi-
proving through the identification of constraints for failure-causing inputs (Chen et al.,
2011b).
2.2 Metamorphic Testing
Metamorphic testing has been proposed to alleviate the oracle problem in software
testing in addition to the approaches presented in Section 2.1. As the proposed testing
techniques in thesis will be based metamorphic testing, this subsection is designated to
present the history and a comprehensive review of progresses made in metamorphic testing.
2.2.1 History
Metamorphic testing was initially introduced as a mechanism to generate new test
cases from existing test cases that have not revealed any failures (Chen et al., 1998). Its aim
was to augment the existing test suite with the aim to detect additional failures. However, in
doing so, the authors also found that metamorphic testing could detect failures in the
absence test oracles (that is, when the correct expected outputs of the software under test are
25
unknown). This is because it only requires violation of the necessary relations (known as
metamorphic relation) between inputs and outputs of the existing and newly generated test
cases to detect failures.
In metamorphic testing, metamorphic relation is first defined based on the relation
between a set of test inputs and their corresponding outputs. The metamorphic relations can
be identified from the necessary properties of the software under test. From a test case
(called source test case) with unverifiable output, the metamorphic relation can be used to
generate follow up test cases such that the outputs of the source test case and follow up test
cases can be checked against the metamorphic relation. If the metamorphic relation is
violated, then we know that the software under test has failed. Therefore, metamorphic
testing can detect failures in the software under test without requiring test oracles.
2.2.2 AdvantagesoverOtherApproaches
Since its introduction, metamorphic testing has gained increasing popularity and
emerged into a testing approach used predominantly to detect failures in software with
oracle problems. Its success can be attributed to a few competitive advantages it has over
other approaches that have been developed to address the oracle problems.
Unlike the pseudo oracle, N-version programming and previous versions approaches
reviewed in Section 2.1, metamorphic testing does not rely on the existence of multiple
versions of the same software to address the oracle problem. Hence, the associated costs to
create and maintain multiple version of the same software can be eliminated. In fact,
metamorphic testing only requires execution of multiple test cases on the version under test
to detect failure.
On the other hand, similar to assertion checking, contracts and program invariants,
metamorphic testing makes use of the necessary property of the software under test to detect
failures. However, metamorphic testing is more versatile and less restrictive than assertion
checking, contracts and program invariants. Firstly, unlike assertion which must be
26
embedded in source code of the software under test to detect violation of assertion condition
during runtime, metamorphic testing does not have such restriction. It can be implemented
as an independent black box testing approach that does not require access to the source code
of the software under test. Furthermore, empirical studies by Zhang et al. (2009) have
reported that metamorphic testing can potentially detect more failures than assertion
checking. Secondly, in metamorphic testing, metamorphic relations are not restricted only to
design contracts such as pre-condition and post-condition. Other forms of necessary
properties or conditions derived from either white box or black box knowledge of the
software under test can be used as metamorphic relation. Thirdly, unlike program invariants
that rely on properties and conditions that must be preserved during the whole or a portion
of the execution life time, metamorphic testing are not restricted to checking of these
properties and conditions during execution life time. Failures can also be detected by solely
examining the outputs produced by two or more test cases based on violation of a
metamorphic relation.
As compared failure detections through anomalies such as software crash,
metamorphic testing is normally used to detect more subtle failures that are otherwise
undetected. Other types of less obvious anomalies such as anomalies in performance metrics
can also be used as a metamorphic relation in metamorphic testing.
Even though special values can be used to detect failures in the absence of oracle,
past studies have shown that special values were inadequate to detect failures that exist in
software with oracle problem (Chen et al., 2002a; Chen et al., 2004b). However, it is worth-
noting that in these studies, metamorphic testing were used to supplement special values to
detect subtle failures that are undetectable with special values in numerical program,
trigonometric programs and search programs in the absence of oracle.
Although human oracle can be used to detect failures in the absence of oracle, it
cannot be automated and up scaled for a large number of test cases. Crowdsourced oracle
may address the up scaling problem. However, its accuracy in detecting failures relies on the
27
clarity and adequacy of problem specifications and documentation presented to the crowd
(Pastore et al., 2013). In both cases of human oracle and crowdsource oracle, false positives
in failure detection (categorizing pass test cases as fail test cases) and false negatives in
failure detection (categorizing fail test cases as pass test cases) may occur because of
subjective human judgment. However, even though false negative in failure detection
cannot be eliminated in metamorphic testing, failures detected using the metamorphic
testing approach is free from false positive error.
Although program checkers can provide probabilistic proofs that can estimate
program correctness, its application is limited to few number-theoretic computations such as
sorting, matrix rank and greatest common divisor. On the other hand, using an approach
known as semi proving (Chen et al., 2002b), metamorphic testing can be used combination
with global symbolic evaluation to show the absence of certain failures in any program by
verifying necessary properties for program correctness without having to specify the oracle
for the software under test.
In view of these advantages over other approaches, metamorphic testing has been
adopted to detect failures in a wide range of software applications with oracle problems. The
application areas in which successful deployments of metamorphic testing have been
reported are presented in the next subsection.
2.2.3 ApplicationAreas
Though the notion of metamorphic testing was introduced in 1998, literatures on its
deployment to test software application only started to appear four years later in 2002. Since
then, more than 50 publications have reported the deployment of metamorphic testing,
primarily to address the oracle problems in these application areas. An analysis of these
publications and the corresponding application areas is presented in Table 2-1. These
application areas are broadly grouped into 15 categories, namely, thermodynamics,
embedded system, service-oriented and web application, image processing, end-user
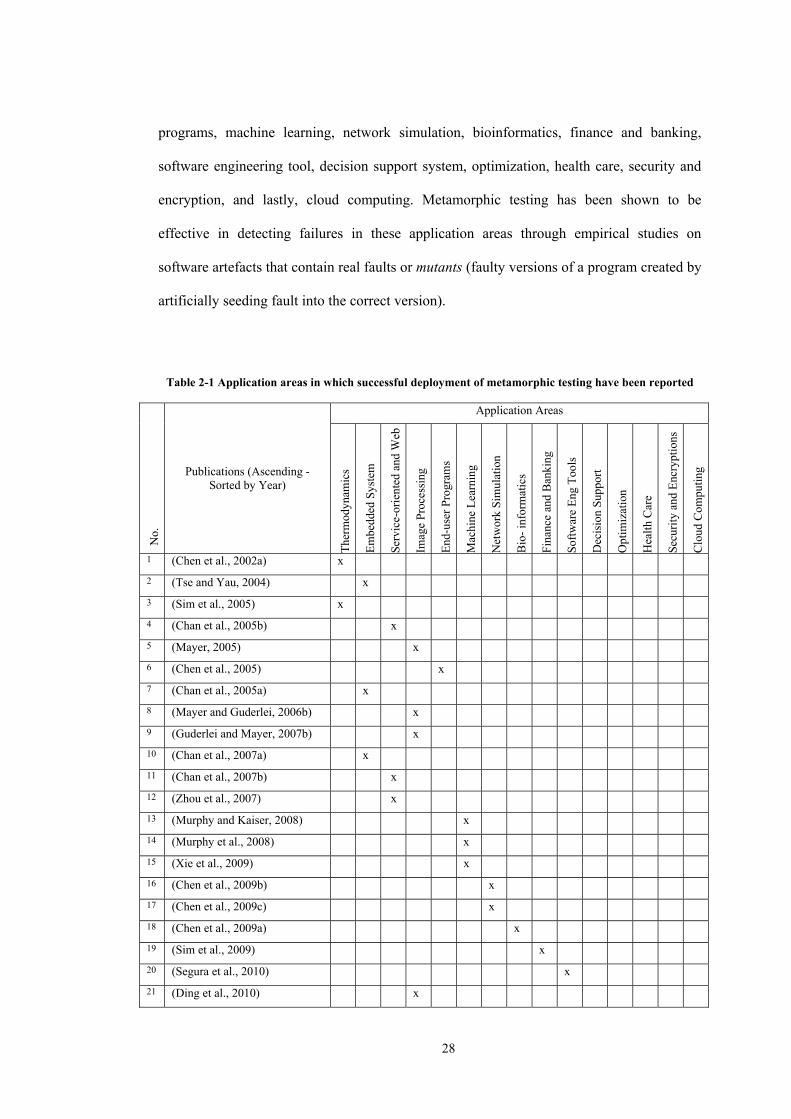
28
programs, machine learning, network simulation, bioinformatics, finance and banking,
software engineering tool, decision support system, optimization, health care, security and
encryption, and lastly, cloud computing. Metamorphic testing has been shown to be
effective in detecting failures in these application areas through empirical studies on
software artefacts that contain real faults or mutants (faulty versions of a program created by
artificially seeding fault into the correct version).
Table 2-1 Application areas in which successful deployment of metamorphic testing have been reported
No.
Publications (Ascending - Sorted by Year)
Application Areas
The
rmod
ynam
ics
Em
bedd
ed S
yste
m
Serv
ice-
orie
nted
and
Web
Imag
e Pr
oces
sing
End
-use
r P
rogr
ams
Mac
hine
Lea
rnin
g
Net
wor
k S
imul
atio
n
Bio
- in
form
atic
s
Fin
ance
and
Ban
king
Sof
twar
e E
ng T
ools
Dec
isio
n S
uppo
rt
Opt
imiz
atio
n
Hea
lth
Car
e
Secu
rity
and
Enc
rypt
ions
Clo
ud C
ompu
ting
1 (Chen et al., 2002a) x
2 (Tse and Yau, 2004) x
3 (Sim et al., 2005) x
4 (Chan et al., 2005b) x
5 (Mayer, 2005) x
6 (Chen et al., 2005) x
7 (Chan et al., 2005a) x
8 (Mayer and Guderlei, 2006b) x
9 (Guderlei and Mayer, 2007b) x
10 (Chan et al., 2007a) x
11 (Chan et al., 2007b) x
12 (Zhou et al., 2007) x
13 (Murphy and Kaiser, 2008) x
14 (Murphy et al., 2008) x
15 (Xie et al., 2009) x
16 (Chen et al., 2009b) x
17 (Chen et al., 2009c) x
18 (Chen et al., 2009a) x
19 (Sim et al., 2009) x
20 (Segura et al., 2010) x
21 (Ding et al., 2010) x
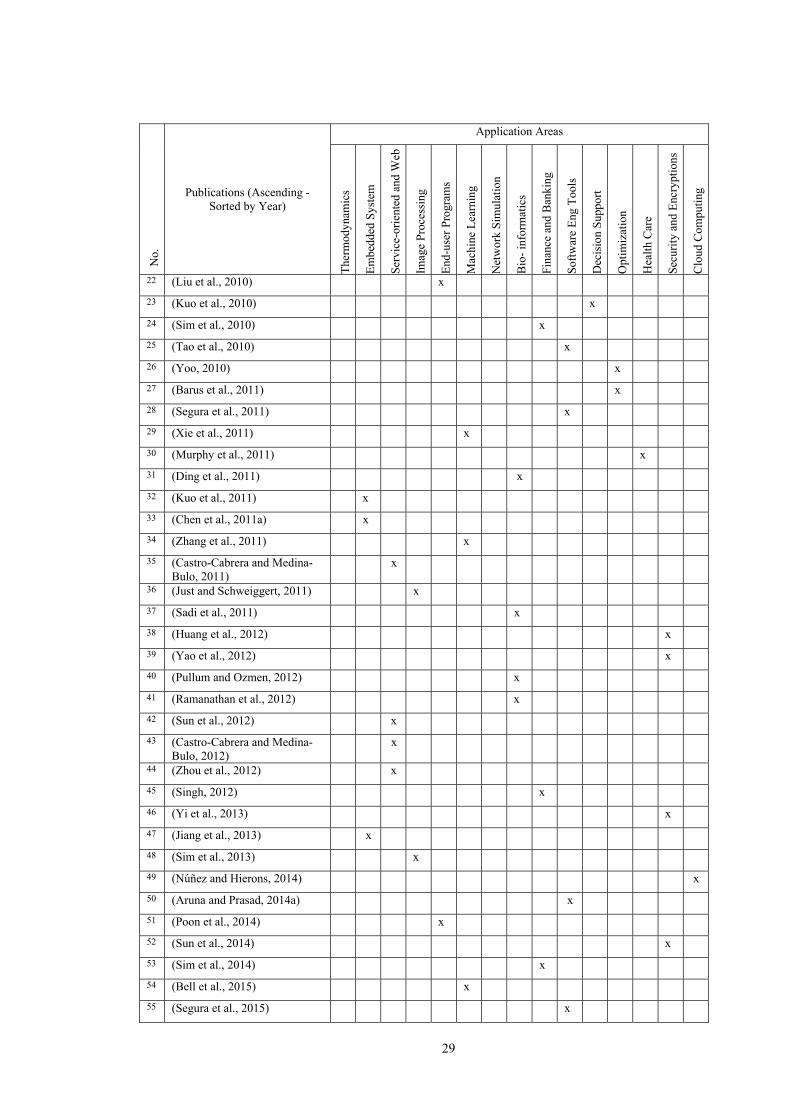
29
No.
Publications (Ascending - Sorted by Year)
Application Areas
The
rmod
ynam
ics
Em
bedd
ed S
yste
m
Serv
ice-
orie
nted
and
Web
Imag
e Pr
oces
sing
End
-use
r P
rogr
ams
Mac
hine
Lea
rnin
g
Net
wor
k S
imul
atio
n
Bio
- in
form
atic
s
Fin
ance
and
Ban
king
Sof
twar
e E
ng T
ools
Dec
isio
n S
uppo
rt
Opt
imiz
atio
n
Hea
lth
Car
e
Secu
rity
and
Enc
rypt
ions
Clo
ud C
ompu
ting
22 (Liu et al., 2010) x
23 (Kuo et al., 2010) x
24 (Sim et al., 2010) x
25 (Tao et al., 2010) x
26 (Yoo, 2010) x
27 (Barus et al., 2011) x
28 (Segura et al., 2011) x
29 (Xie et al., 2011) x
30 (Murphy et al., 2011) x
31 (Ding et al., 2011) x
32 (Kuo et al., 2011) x
33 (Chen et al., 2011a) x
34 (Zhang et al., 2011) x
35 (Castro-Cabrera and Medina-Bulo, 2011)
x
36 (Just and Schweiggert, 2011) x
37 (Sadi et al., 2011) x
38 (Huang et al., 2012) x
39 (Yao et al., 2012) x
40 (Pullum and Ozmen, 2012) x
41 (Ramanathan et al., 2012) x
42 (Sun et al., 2012) x
43 (Castro-Cabrera and Medina-Bulo, 2012)
x
44 (Zhou et al., 2012) x
45 (Singh, 2012) x
46 (Yi et al., 2013) x
47 (Jiang et al., 2013) x
48 (Sim et al., 2013) x
49 (Núñez and Hierons, 2014) x
50 (Aruna and Prasad, 2014a) x
51 (Poon et al., 2014) x
52 (Sun et al., 2014) x
53 (Sim et al., 2014) x
54 (Bell et al., 2015) x
55 (Segura et al., 2015) x
30
2.2.3.1 Thermodynamics
The first deployment of metamorphic testing to address oracle problems was reported
in the area of thermodynamics in 2002. First of all, Chen et al. (2002a) presented a
metamorphic testing technique testing of a program that could detect failures in a computer
program that was developed to estimate the distribution of temperatures on a square plate by
solving an elliptic partial differential equation with Dirichlet boundary conditions. They
showed that in the absence of analytical solution for the partial differential equation and
pseudo oracle for the numerical computation, metamorphic testing can successfully detect
failures in the program.
In a later study, Sim et al. (2005) studied the intrinsic properties of Medial Axes
Transformation and used these properties as metamorphic relations to detect failures in heat
analysis in sand casting simulation program to alleviate the oracle problem.
2.2.3.2 EmbeddedSystems
Due to the complexity in hardware-software interactions and real-time computing
constraints, embedded systems often suffer from oracle problem. To address this problem,
Tse and Yau (2004) proposed a metamorphic testing technique to detect failures in context-
sensitive middleware-based software applications for a system of smart streetlights. This
was further extended in a later study by Chan et al. (2005a) to perform integration testing of
context-sensitive middleware application.
More recently, Chen et al. (2011a) studied the oracle problem in testing software-
based Proportional-Integral-Derivative (PID) controllers. They proposed four metamorphic
relations that can be used to detect failures in eight mutants of the software-based PID
controllers. As PID controllers are widely used as embedded systems in industrial
applications, the authors suggested that suitable metamorphic relations can be easily
proposed by domain experts who use PID controllers in their applications. They found that
the most effective metamorphic relation was the one that was related to the integral term
31
which consisted of the behavior of the controller over the entire time scale). This
metamorphic relation was able to detect all eight mutants under test. This was followed by
the metamorphic relation related to the proportional term which depends only on the
instantaneous error. However, their study only focused on software failures and assumed
that the hardware was free from any fault. However, they noted that metamorphic testing
could also be used to test a complete embedded system consisting of both software and
hardware.
The use of metamorphic testing to detect failures in complete embedded system was
first demonstrated by Kuo et al. (2011). They made use of metamorphic testing to detect real
failures in a commercial wireless metering system. In particular, this study showed how
metamorphic testing can be used to test “RF-Soft” embedded software in the within the
wireless meter which has limited user interface and strict timing requirements.
In a separate study, Jiang et al. (2013) used metamorphic testing to detect failures in
the Highest Response Ratio Next (HRRN) scheduling algorithm of a Central Processing
Unit. In addition to successful detection of seeded faults, the experiments conducted on two
open source simulators found two real failures in one of the simulators.
2.2.3.3 Service‐orientedandWebApplications
Service-oriented and web applications are the third application area where successful
deployment of metamorphic testing has been reported. Chan et al. (2005b) addressed the
oracle problem in testing applications in service-oriented architecture (SOA) environments
by proposing a metamorphic testing oriented methodology where follow-up test cases for
the integration test phase were generated from the test cases from the unit testing phase.
Metamorphic relations were then used to detect failures when these test cases were executed
by the relevant services. Chan et al. (2007b) further extended the use of metamorphic testing
for online testing of service-oriented software application by generating follow up test cases
for online testing from offline testing test cases as source test cases.
32
In the same year, Zhou et al. (2007) started to use metamorphic testing test popular
search engines on the web which include Google, MSN Live Search and Yahoo for potential
failures. Due to the large amount information resources on the web, oracles are not available
for search engines. Their study found that there were inconsistencies in search results
returned when follow-up searches were conducted based on metamorphic relation identified.
A more comprehensive study by Zhou et al. (2012) was conducted later to present a
metamorphic testing technique to Yahoo, Google and MSN Live search engines. Among the
failures reported were failures to return webpages that exist in their own repositories and
inconsistency in search result ranking.
Castro-Cabrera and Medina-Bulo (2011) proposed a metamorphic testing technique to
test web services composed by using the Web Service Business Process Execution
Language (WS-BPEL) for business processes where peculiarities must be considered.
Further to that, a test framework for metamorphic testing was presented by Castro-Cabrera
and Medina-Bulo (2012) with a case study on Loan Approval service composition.
In a separate study, Sun et al. (2012) presented a metamorphic relation-based
approach to testing web services without oracles. In addition to addressing the oracle
problem in testing service-oriented application, the authors also proposed a framework and a
prototype to automate a large part of the testing process for service oriented applications.
Experiments were conducted to evaluate the effectiveness of the proposed technique in
detecting failures in the balance transfer transaction within a general ATM (Automatic
Teller Machine) system is implemented as a web service in the Tomcat server.
2.2.3.4 ImageProcessing
Testing of image processing was started in 2005 by Mayer (2005) who proposed a
statistical property based testing technique for testing of dilation (an image processing
operator) software. A year later, Mayer and Guderlei (2006b) proposed a metamorphic
testing technique to test another image processing operator, namely, Euclidean distance
33
transform using model generated images. His study demonstrated that failures in image
processing software can be automatically detected using metamorphic relations without
relying on subject human visual inspection on the output images produced by the software
under test. Testing of imaging software is a challenging task, which is usually done
manually. For this purpose, well-known test images are generally used whose expected
output can be specified in advance or the actual result is visually inspected by the tester. In
two subsequent studies by Guderlei and Mayer (2007a) and Guderlei and Mayer (2007b),
metamorphic testing was combined with random testing and statistical hypothesis test
respectively to automatically detect failures in image processing software.
Ding et al. (2010) proposed a self-checked metamorphic testing technique for an
image processing program used to reconstruct 3D structure of biology cells based on a stack
of confocal images. In addition to use of metamorphic relation to detect failure, the
proposed technique also integrate structural testing to detect failures based on code
coverage. Subsequently, Just and Schweiggert (2011) studied the effectiveness of
metamorphic testing in detecting failures in JPEG2000 encoder.
More recently, Sim et al. (2013) evaluated the effectiveness of reusing metamorphic
relations proposed for Euclidean distance transformation in the work of Mayer and Guderlei
(2006b) on edge detection program. Their empirical study showed that real images (as
opposed to model generated images) and reused of metamorphic relations from Euclidean
distance transformation can effectively detect failures caused by seeded and real faults in
edge detection program.
2.2.3.5 End‐userProgram
While end-user programs such as spreadsheet are widely used in many businesses,
their dependability are questionable because testing and quality assurance of programs
created by end users are usually little to none existence (Burnett et al., 2004). To this end,
metamorphic testing has been advocated as a suitable and effective testing approach for end-
34
user programmers for spreadsheet, database, simulation and scientific application (Chen et
al., 2005). This is because end-user programmers have the domain specific knowledge that
can be easily used to derive the metamorphic relations required for metamorphic testing.
Moreover, end-user programmers can also distinguish good metamorphic relations based on
program structures. This was evidenced in a study by Liu et al. (2010) which showed that
even undergraduate students with little testing experience were able to identify metamorphic
relations and automate metamorphic testing of spreadsheet. Motivated by this finding, Poon
et al. (2014) conducted a detailed study to demonstrate how non-technical end-users could
effectively test the spreadsheet created by themselves.
2.2.3.6 MachineLearning
Since 2008, the deployment of metamorphic testing has been reported in the area of
machine learning. Murphy et al. (2008) proposed a generic metamorphic relations for
machine learning applications and demonstrated their effectiveness in detecting certain real
failures in three machine learning applications, namely, MartiRank (Gross et al., 2006),
SVM-Light (Joachims, 1999) and PAYLoad-based Anomaly Detector (PAYL) (Wang and
Stolfo, 2004). This was followed by a study conducted by Bell et al. (2015) which proposed
a novel metamorphic runtime checking approach that is applicable for both application level
and function level testing. Experiments conducted on nine machine-learning applications
found that the proposed metamorphic runtime checking approach successfully detected
170% more mutants compared to application level testing alone.
In a separate study, Xie et al. (2009) applied metamorphic testing to detect failures in
k-nearest neighbors and Naïve Bayes supervised classifiers. Subsequently, Xie et al. (2011)
reported the effectiveness of metamorphic testing to detect real failures in WEKA (Witten
and Frank, 2005) and BioWEKA (Gewehr et al., 2007) supervised classifiers.
35
Recently, with the advent of data mining, metamorphic testing has also been used to
detect failures in machine learning algorithms in data mining. Metamorphic testing has been
proposed to test association rules algorithms on Weka platform (Zhang et al., 2011).
2.2.3.7 NetworkSimulation
Chen et al. (2009b) presented a metamorphic testing based technique to perform
conformance testing for an ad-hoc on-demand distance vector (AODV) network simulator.
In a subsequent study, Chen et al. (2009c) further presented a metamorphic testing
technique for both open Queuing Network Modelling (QNM) and close Queuing Network
Modelling (QNM) for computer and communication (C&C) systems. Even though testing
conducted on open QNM of the Java Model View Adapter (JMVA) module of Java
Modelling Tools (JMT) did not find any real failure, the proposed technique successfully
detected failures in 20 mutants created by seeding faults in the system.
2.2.3.8 Bioinformatics
Advances in software and hardware speed have enabled many biological experiments
to be conducted through bioinformatics simulation software. However, detecting failures is
difficult because the simulations are conducted for the very reason that the correct
experimental results are unknown. To address this problem, Chen et al. (2009a) proposed a
novel metamorphic testing technique that can detect failures in bioinformatics software.
Studies conducted on two open-source bioinformatics programs, namely, GNLab (Ho and
Charleston, 2007) and SeqMap (Jiang and Wong, 2008) successfully detected failures
caused by real and artificially seeded faults in these software.
Sadi et al. (2011) proposed the use of metamorphic testing to detect failures in
phylogenetic inference programs. In bioinformatics field, phylogenetic inference programs
are commonly used to infer evolutionary history of species using aligned sequences DNA or
amino acids. However, due to the large amount of genetic data complicated search and
scoring algorithms used, it is impossible to manually check the correctness of the results
36
returned by these phylogenetic inference programs. The failure detection effectiveness of
the proposed metamorphic testing technique was evaluated on faulty phylogenetic inference
programs using both real and randomly generated test inputs. Their experiment results
showed that the proposed metamorphic testing technique can detect failures in all faulty
phylogenetic inference programs under test.
In a separate study, Ding et al. (2011) proposed and studied the effectiveness of
metamorphic testing technique to detect failures in Monte Carlo modeling program that
simulates photon propagation in biological tissues (human skins). They identified five
metamorphic relations to test the Monte Carlo modelling program developed in Fortran 90.
Their experiments showed that the proposed metamorphic relations successful detected
failures in the modelling program used to simulate photon propagation in human skins.
2.2.3.9 FinanceandBanking
Financial markets and banking sector are where software failures can result in
enormous loss. Successful deployment of metamorphic testing in this area was first reported
by Sim et al. (2009) which presented an automatic testing technique based on metamorphic
testing and assertion checking for financial charting software. The proposed testing
technique successfully detected real failures in pre-released versions of a commercial point
and figure charting software component. Motivated by this success, Sim et al. (2014) further
extended the study to other types of financial charts including Renko-chart, three-line break
chart and Kagi chart.
In a separate study on testing of real time technical indicator for financial trading, Sim
et al. (2010) proposed a metamorphic testing based self-checking approach for a real time
financial trading software known as Metatrader 4.
In the banking sector, application of metamorphic testing was reported in a study on
an automated metamorphic testing technique for designing effective metamorphic relations
(Singh, 2012). In this study, the metamorphic testing technique proposed was applied to four
37
modules within a banking system, namely, deposit module, withdrawal module, loan
module and fixed deposit module.
2.2.3.10 SoftwareEngineeringTools
Metamorphic testing has also been applied to test tools in software engineering.
Segura et al. (2010) first proposed a metamorphic testing technique to test feature model of
a software product line. A set of metamorphic relations were proposed and a test data
generator were design to automatically generate test data based on these metamorphic
relations. The proposed technique was successfully used to detect failures caused by both
real and artificial faults seeded in Feature Models that represents millions of products.
Further study by Segura et al. (2011) found two real failures in two automated analysis tools
for feature models, namely, Feature Modelling Analyser (FaMa) and Software Product
Lines Online Tools (SPLOT). The experimental study also found that test data automatically
generated from metamorphic testing out-perform manually derived test suite for detecting
failures in automated analysis of feature models. This automated metamorphic testing
technique was later extended to 15 other analysis tools in the variability domains, namely,
feature models, common upgradeability description format documents and Boolean
formulas (Segura et al., 2015). Experiments conducted on these 15 variability tools have
successfully detected 19 failures in seven of the variability tools under test.
On the other hand, Tao et al. (2010) presented an automatic testing approach for
compiler-based on metamorphic testing. They proposed the use of equivalence-preservation
relation as the metamorphic relation and three techniques for automatically generating
equivalent program codes as test cases. A testing tool named Mettoc was developed to test
open source compilers such as GCC-4.4.3 and UCC-1.6 based on the proposed metamorphic
testing technique. The experiments conducted on these compilers have successfully detected
two real failures in these open source compilers.
38
Recently, Aruna and Prasad (2014a) conducted an in-depth study on Multi Precision
Arithmetic in the development of scientific software. They proposed metamorphic relations
that can be used to detect failures in Multi Precision Arithmetic. Experiments were
conducted on four C projects, each of which has 15 to 20 programs with Multi Precision
Arithmetic. The results showed that the proposed metamorphic relations were more accurate
than other system level approaches such as Support Vector Machine (SVM), Arhant-II,
Gradient Boosting Trees (GBT) and PAYLoad-based Anomaly Detector (PAYL).
2.2.3.11 DecisionSupport
Decision support systems are commonly used guide decision makers to arrive at
better decisions from complex information available to the system. To address the oracle
problem testing decision support systems, Kuo et al. (2010) conducted a case study on a
multi-criteria group decision making (MCGDM) tool named Decider, which was developed
in 2008 by the Decision Making and e-Service Intelligence Research Group, Faculty of
Engineering and Information Technology, University of Technology, Sydney (UTS),
Australia. They proposed 11 metamorphic relations to detect failures in 10 mutants of the
MCGDM tool under test which were created through seeding of artificial faults.
Experiments conducted on these mutants showed that all mutants have been successfully
detected by at least two of the proposed metamorphic relations.
2.2.3.12 Optimization
Metamorphic testing has also been used to test implementations of optimization
algorithms. Yoo (2010) proposed a statistical metamorphic testing technique (SMT) which
combined of metamorphic testing and statistical hypothesis testing to detect failures in
implementations of stochastic optimization algorithms. The empirical study conducted on
mutants of Next Release Problem (NRP) and Simulated Annealing programs showed that
the proposed statistical metamorphic testing technique effectively detected failures caused
by operator insertion and replacement faults in these mutants.
39
In a separate study, Barus et al. (2011) applied metamorphic testing to test heuristic
method used in optimization. Specifically, they proposed nine metamorphic relations to test
five mutants of a Greedy Algorithm implementation that was developed to solve the Set
Covering Problem (SCP). Experiments conducted on these mutants showed that all mutants
were successfully detected by two or more of the proposed metamorphic relations.
2.2.3.13 HealthCare
In the area of health care, metamorphic testing has been used to test numerous
simulation software packages. Work in this area was done by Murphy et al. (2011) who
proposed metamorphic testing technique to detect failures in two simulators named JSim
and Glycemic Control Simulator (GCS). JSim is a Discrete Event Simulation (DEVS)
engine that is commonly used to model and simulate human-centric processes in the health
care industry. On the other hand, GCS is a MATLAB program that is used to simulate the
behavior of different closed-loop insulin titration algorithms on a virtual patient. Using the
mutation technique, 104 and 950 mutants were created for JSim and GCS respectively to
evaluate the effectiveness of the proposed metamorphic testing techniques in detecting
failures in these mutants. Experiment results showed that the proposed metamorphic testing
technique successfully detected all mutants for JSim and 65% of the mutants for GCS.
2.2.3.14 SecurityandEncryption
Numerous instances of successful deployment of metamorphic testing in security and
encryption related area have been reported in recent years. Works in this area were first
presented by Huang et al. (2012) and Yao et al. (2012) who proposed the use of
metamorphic testing based approaches to detect invisible integer bugs which may affect not
only functionality but the security of software. A case study on integer bugs in programs
that calculated the area on Cartesian coordinate was presented by Yi et al. (2013).
In encryption applications, the use of metamorphic testing to detect failures in
implementation of encryption algorithms was first reported by Sun et al. (2014). In this
40
study, they proposed a metamorphic testing based testing framework to detect failures in
implementations of two well-known encryption algorithms, namely, Hill algorithm and the
RSA algorithm. Experiments conducted on mutants generated from implementation of both
Hill and RSA algorithms showed that results show 50% of mutants can be successfully
detected by using three metamorphic relations proposed.
2.2.3.15 CloudComputing
The latest application area reported in the literature for metamorphic testing is cloud
computing. Testing of cloud models suffers from oracle problem because of the large
number of parameters that cloud systems typically have and the challenge in determining
the correct behavior of cloud systems. To this end, Núñez and Hierons (2014) proposed the
combination of simulation and metamorphic testing technique to partially automate testing
and validation of cloud models. They used metamorphic testing based technique to test and
validate cloud systems simulated on iCanCloud simulation platform. Experiments conducted
demonstrated that the proposed testing and validation technique could effectively detect
poorly designed cloud models with inappropriate values for parameters even in the absence
of test oracle.
2.2.4 ProgressesinMetamorphicTestingMethodologies
Even though a large number of literatures have been focusing on the deployment of
metamorphic testing to solve oracle problem in various application areas, relatively less
progresses have been made over the last decade in improving the methodologies for
implementing metamorphic testing. However, there have been some significant and worth-
noting contributions towards improving the selection and generation of metamorphic
relations with the aim to improve failure detection capability. Numerous studies have also
been conducted to improve the test case generation process for metamorphic testing. These
progresses in metamorphic testing methodologies are reviewed in the following subsections.
41
2.2.4.1 DiversityofMetamorphicRelations
Metamorphic testing relies on violation of metamorphic relations to detect failures in
the software under test. Therefore, identification and selection of metamorphic relations is
the first and foremost important step in metamorphic testing that has been intensively
studied.
The initial studies on metamorphic relation (Chen et al., 2004a; Mayer and Guderlei,
2006a) focused on the failure detection capability metamorphic relations. The case studies
conducted by the authors revealed that in addition to domain specific black box knowledge,
white box information such as program structure is useful to identify metamorphic relation
with good failure detection capability. This is because metamorphic relations that cause
different parts of the program code have better chance of executing the faulty part of
program code, hence causing failures that can be detected. Based on the same intuition, they
further suggested that different metamorphic relations are required to detect different
failures in the software under test.
Later case studies on aircraft Traffic Collision Avoidance System (TCAS) program
and KNAPSACK optimization program by Asrafi et al. (2011) also concurred with these
findings. They further reported that metamorphic relations with lower code coverage general
detect fewer failures than those with higher code coverage. This was supported by a
comprehensive empirical studies reported by Cao et al. (2013) which found a strong positive
correlation between the dissimilarities of source and follow up test case executions and the
failure detection capability of the corresponding metamorphic relations. In a separate study
involving human assessors, Liu et al. (2014) found that diverse metamorphic relations
tended to detect failures caused by different types of faults.
2.2.4.2 GranularityofMetamorphicRelations
Apart from diversity in code coverage, the failure detection capability of
metamorphic testing is also affected by the granularity of the metamorphic relations
42
identified. Empirical studies were conducted by Just and Schweiggert (2011) on an object-
oriented image processing system to examine and compare the failure detection capability of
metamorphic relations that were derived for unit level testing with those derived for
integration testing. Specifically, they found that the failure detection capability of
metamorphic relations varies from one part of the program to another. Moreover,
metamorphic relations that are effective in detecting failures at unit level testing do not
necessarily have the same failure detection capability for integration testing.
Subsequently, Singh (2012) proposed to identify metamorphic relations with good
failure detection capability by analyzing of individual modules of the system and
determination of their target function. The control flow the module under test is examined to
identify its necessary properties that can be used as metamorphic relations.
This was further investigated by Xie et al. (2014) based on the motivation that
metamorphic relations are more difficult to derive for system level testing without bottom-
up integration testing. Empirical studies conducted on four feature selection algorithms
implemented on WEKA machine learning framework showed that metamorphic relations
derived for a specific component of the system under test are can detect more failures than
those derived at system level. These findings concurred with the successes reported in
related works that proposed the use of metamorphic testing in testing software components
(Beydeda, 2006; Sim et al., 2009; Lu et al., 2010).
2.2.4.3 AutomaticDerivationofMetamorphicRelations
Although some guidelines on identification and selection of metamorphic relations
have been established (Chen et al., 2004a; Mayer and Guderlei, 2006a), this process remains
a manual process which requires the involvement of human intelligence. However,
numerous attempts have been made to partly or fully automate the derivation of
metamorphic relations. Work in this area was started by Liu et al. (2012b) who proposed a
novel method named “composition of metamorphic relations” to derive new metamorphic
43
relations from the existing ones. With this method, new metamorphic relations can be
derived by cascading two or more existing metamorphic relations. Effectively, the new
metamorphic relation will combine all necessary properties of the existing metamorphic
relations. Empirical studies conducted on bioinformatics programs found that the new
metamorphic relations derived have better or at least the same failure detection capabilities
compared to the existing metamorphic relations.
The first attempt to automatically generate metamorphic relations was reported by
Kanewala and Bieman (2013). Two machine learning approaches, namely, support vector
machine (SVM) and decision trees, were proposed to build a predictive model to predict
three types of metamorphic relations, namely, permutative, additive and inclusive
metamorphic relations, based on features extracted from control flow graph (CFG) of the
function under test. They showed that the proposed machine learning approaches produced
the same predictions as those produced for the original correct program in at least 95% of
the cases when applied to programs with seeded faults. Finally, they showed that among the
metamorphic relations automatically identified, permutative metamorphic relations were
most effective by detecting 66% of the 988 mutants generated from 48 mathematical
programs while additive metamorphic relations were the least effective with only 23% of
the mutants detected.
Recently, Zhang et al. (2014) proposed a search-based inference approach to
automatically identify polynomial metamorphic relations using Particle swarm optimization
(PSO). They proposed the notion of polynomial metamorphic relations, where a set of
parameters were used to represent the metamorphic relations. By doing so, particle swarm
optimization (PSO) can be used to analyze the execution of the program and search for
suitable values for the parameters for the polynomial metamorphic relations. Three
empirical studies conducted on 189 scientific functions from four scientific libraries showed
that the proposed search-based inference approach could infer metamorphic relations within
reasonable search time of 9.8 second to 1231.2 seconds.
44
2.2.4.4 TestCaseSelectionandGeneration
As in any software testing methods, test cases used in the testing process play has
direct impact on the failure detection effectiveness in metamorphic testing. This is because
different test cases may execute different parts of the program code and hence, detect
different failures. In view of this, numerous studies have been conducted to improve test
case selection and generation with the aim to detect more failures. In particular, studies in
this area have been focusing on selection and generation source test cases with strong failure
detection capabilities because the selection and generation of follow up test cases are
determined by the metamorphic relations used in metamorphic testing.
Based on the observations that diversity and higher code coverage improve the failure
detection capability of metamorphic relations, Batra and Sengupta (2011) proposed the use
of genetic algorithm to optimize the source test case selection with the aim to maximize the
coverage with the minimum amount of source test cases. Subsequently, Chen et al. (2012)
proposed a criterion called Equivalence-Class Coverage for Every Metamorphic Relation
(ECCEM) to select and generate source test cases with the aim to maximize the diversity in
path executed by these test cases. By doing so, they showed that the number of sources test
cases can be effectively reduced while detecting the same amount of mutants.
2.3 Summary
The oracle problems remain a challenging fundamental problem in software testing
due to increased complexity of the software developed. Furthermore, many software
applications are developed to find solutions to unanswered problems. Therefore, the oracle
or corrected expected outputs for an arbitrary input is unknown. Enormous research efforts
have been dedicated to address the oracle problem since it was highlighted by Weyuker
(1982). As presented in the review in Section 2.1, more than 10 categories of approaches
have been proposed to address the oracle problems. However, some of these approaches
such as pseudo oracle, N-version programming and previous versions rely on the existence
45
of costly multiple implementations of the same software to provide test oracles. The other
approaches are either restricted to specific types of programs, rely on subjective human
judgment, or have limited failures detection capabilities.
Since its inception in 1998, metamorphic testing (Chen et al., 1998) has emerged into
a prominent testing approach to detect failures in software with oracle problems due to the
inherent advantages it poses over other approaches proposed to address the oracle problems.
In comparison with other approaches, metamorphic testing not only does not require the
existence of multiple implementations to provide test oracle, but also is more versatile and
less restrictive. It has been proven to have better capabilities to detect subtle failures than
other property and special value based testing approaches. Furthermore, unlike subjective
human judgment, failures detected using metamorphic testing does not suffer from false
positive problem. More importantly, empirical studies by Liu et al. (2014) have found that,
with only a small number of metamorphic relations, metamorphic testing is almost as good
as complete oracles in failure detection. This near optimal failure detection capability makes
metamorphic testing an outstanding technique in terms of testing accuracy compared to
existing approaches.
In view of the advantages it has over the other approaches in detecting failures in
software with oracle problem, metamorphic testing has gained increasing popularity in a
wide range of application domains. Over the period of 1998 to 2015, successful deployment
of metamorphic testing to detect failures in software with oracle problems have been
reported in more than 50 publications across 15 diverse application areas, ranging from
thermodynamics, embedded systems, bioinformatics, finance and banking, to health care
applications.
Despite an overwhelming amount of research efforts in deploying metamorphic
testing in various applications, relatively fewer attempts have been made to advance the
methodologies of implementing metamorphic testing. Having said that, numerous
progresses have been reported on selecting and generating metamorphic relations and test
46
cases with better failure detection capability for metamorphic testing. Additionally, attempts
to automatically derive metamorphic relations for certain type of applications have also been
made. However, derivation of metamorphic relations and generation of follow up test cases
remain the additional costs incurred in the metamorphic testing process. Based on the
extensive literatures reviewed, no concerted effort has been made to address the problem of
additional costs incurred in the metamorphic testing process. Therefore, this thesis aims to
further analyze the cost incurred in metamorphic testing and propose cost saving strategies
as well as cost-effective metamorphic testing techniques to address this problem.
47
3 Cost Saving Strategies for Metamorphic Testing
This chapter addresses the additional cost problem in metamorphic testing by first
analyzing the costs incurred in metamorphic testing procedures and functional components.
Based on the analyses, six generic cost saving strategies are proposed to improve the cost-
effectiveness of metamorphic testing.
This chapter is organized as follow: Section 3.1 first formally introduces the concept,
definitions and procedures of metamorphic testing. This is followed by an analysis of costs
incurred in the procedures and functional components metamorphic testing in Section 3.2.
Section 3.3 then presents six cost saving strategies that aim to reduce or eliminate the costs
incurred in the procedures and functional components of metamorphic testing. Section 3.4
provides a brief overview of the adoptions of these cost saving strategies in developing cost-
effective metamorphic testing techniques that are presented in Chapter 4 to Chapter 7.
3.1 Metamorphic Testing – Concepts, Definitions and Procedures
Metamorphic testing was first coined by Chen et al. (1998) as a new approach to
generate the next test case from existing test case, especially one that has not revealed any
failure. In particular, metamorphic testing can detect failures based on the necessary
properties of the software under test in the absence of oracle (that is, when the correct
expected output is unknown). The following example illustrates how metamorphic testing
can be used to detect failure in a program that has been developed to compute the cos(x)
function. When x = 24° is used as the test input to the program, the program produces
0.9135 as the computed output. Assume that the correctness of this output cannot be verified
because the expected correct output is unknown (in other words, the oracle is absence).
However, it is known that cos(x) function must observe the trigonometry identity of cos(x)
= -cos(x+180°). Using this necessary property of cos(x) as the metamorphic relation,
failures in this program can be detected whenever this metamorphic relation is violated. In
this case, the program should produce -0.9135 as output when 204° (that is 24°+180°) is
48
used as test input. In metamorphic testing, 24° serves as the source test case, while 204°
serves as the follow up test case. If the program outputs for these two test cases are different
in absolute value, then it can be concluded that the software under test has failed because the
metamorphic relation is violated. However, it is worth noting that while violation of
metamorphic relation can be used to detect failure, non-violation of metamorphic relation
does not guarantee the correctness of the outputs produced by the program for source test
case, 24°, and follow up test cases, 204°, respectively.
To formally define a metamorphic relation, let:
P be the software under test that implement function f.
I1 = {T1, T2, . . . , Tk} be a set of test cases as inputs to a function f, where k ≥ 1. I1 is
known as the source test cases.
O1 = {f(T1), f(T2), . . . , f(Tk)} be the set of outputs produced by f corresponding to
test cases in I1.
S = {f(Ts1 ), f(Ts2), . . . , f(Tsm)} be a subset of O1 where m ≥ 0.
I2 = {Tk+1, Tk+2, . . . , Tn} be another set of test cases as inputs to f, where n ≥ k+1. I2 is
known as the follow up test cases.
O2 = {f(Tk+1), f(Tk+2), . . . , f(Tn)} be the corresponding set of outputs for test cases in
I2.
RI(T1, T2, . . . , Tk, f(Ts1), f(Ts2), . . . , f(Tsm), Tk+1, Tk+2, . . . , Tn) be a relation among
I1, S and I2. RI is known as the test input relation.
RO(T1, T2, . . . , Tn , f(T1), f(T2), . . . , f(Tn)) be the relation among I1, I2, O1 and O2.
RO is known as the test output relation.
To formally define a metamorphic relation, assume that there exists a relation RI
among I1, S and I2, and another relation RO among I1, I2, O1 and O2 such that RO must be
satisfied whenever RI is satisfied. The metamorphic relation (MR) can then be defined as:
MR: If RI(T1, T2, . . . ,Tk, f(Ts1), f(Ts2), . . . , f(Tsm), Tk+1, Tk+2, . . . , Tn), then RO(T1,
T2, . . . , Tn, f(T1), f(T2), . . . , f(Tn)).
49
Metamorphic relations can normally be sourced from stakeholders of the software
under test who have the knowledge in the application domain. In addition, previous studies
(Zhang et al., 2009; Liu et al., 2014) have shown that software testers who have been briefly
introduced to metamorphic testing are also able to identify metamorphic relations for
software under test.
The following procedures can then be used to conduct metamorphic testing:
1. Identify one or more metamorphic relations (MRs).
2. Generate source test cases, I1, according to predefined testing criteria such as
coverage criteria, or select some arbitrary test cases as the source test cases,
I1.
3. Run program P with I1 as source test cases. Record the corresponding outputs
O1.
4. Generate follow up test cases I2 using the MR and I1.
5. Run program P using I2 as follow up test case. Record the corresponding
outputs O2.
6. Check the test outputs in O1 and O2 against the MR.
If MR is violated, then failure has been detected in program P. Otherwise, no failure
is detected by test cases in I1 and I2.
3.2 Cost Analysis of Metamorphic Testing
Even though metamorphic testing can detect failures in software in the absence of
oracle, its procedures and functional components incur additional costs compared to
conventional testing where test oracle is available. This subsection presents the cost analysis
of metamorphic testing from two perspectives, firstly, testing procedures and secondly,
functional components.
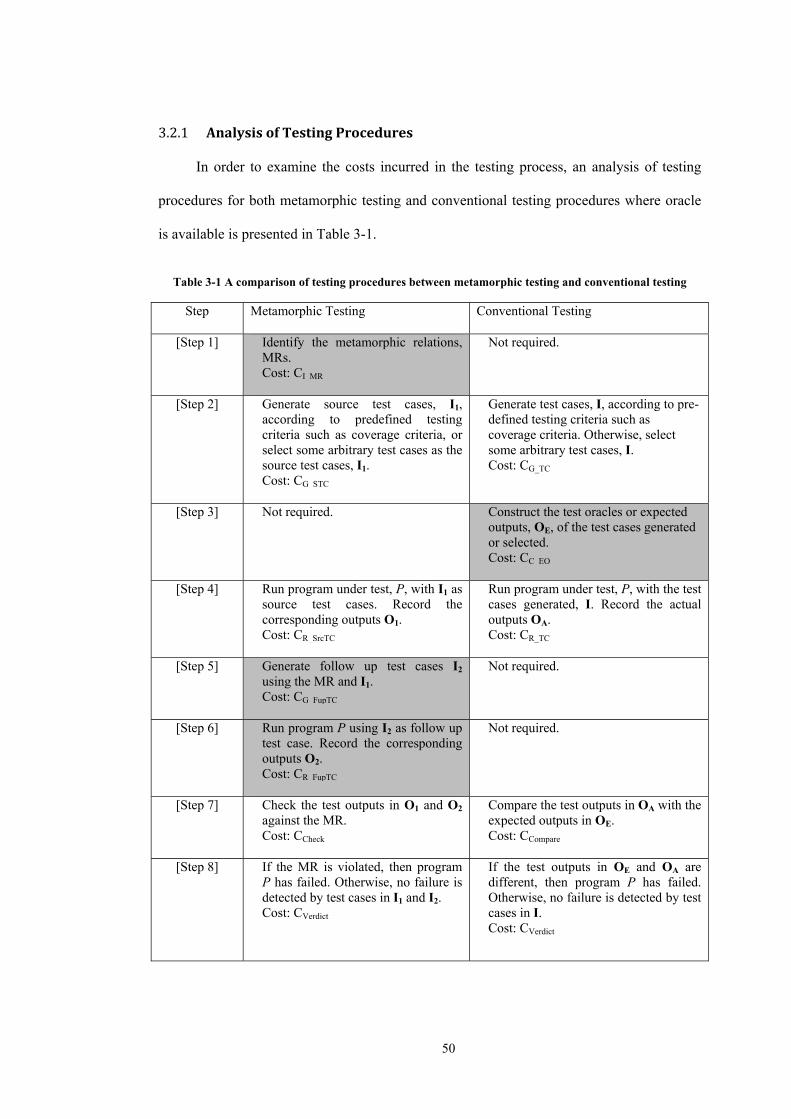
50
3.2.1 AnalysisofTestingProcedures
In order to examine the costs incurred in the testing process, an analysis of testing
procedures for both metamorphic testing and conventional testing procedures where oracle
is available is presented in Table 3-1.
Table 3-1 A comparison of testing procedures between metamorphic testing and conventional testing
Step Metamorphic Testing Conventional Testing
[Step 1] Identify the metamorphic relations, MRs. Cost: CI_MR
Not required.
[Step 2] Generate source test cases, I1, according to predefined testing criteria such as coverage criteria, or select some arbitrary test cases as the source test cases, I1. Cost: CG_STC
Generate test cases, I, according to pre-defined testing criteria such as coverage criteria. Otherwise, select some arbitrary test cases, I. Cost: CG_TC
[Step 3] Not required. Construct the test oracles or expected outputs, OE, of the test cases generated or selected. Cost: CC_EO
[Step 4] Run program under test, P, with I1 as
source test cases. Record the corresponding outputs O1. Cost: CR_SrcTC
Run program under test, P, with the test cases generated, I. Record the actual outputs OA. Cost: CR_TC
[Step 5] Generate follow up test cases I2 using the MR and I1. Cost: CG_FupTC
Not required.
[Step 6] Run program P using I2 as follow up test case. Record the corresponding outputs O2. Cost: CR_FupTC
Not required.
[Step 7] Check the test outputs in O1 and O2 against the MR. Cost: CCheck
Compare the test outputs in OA with the expected outputs in OE. Cost: CCompare
[Step 8] If the MR is violated, then program P has failed. Otherwise, no failure is detected by test cases in I1 and I2. Cost: CVerdict
If the test outputs in OE and OA are different, then program P has failed. Otherwise, no failure is detected by test cases in I. Cost: CVerdict
51
In [Step 1] of metamorphic testing, metamorphic relations have to be identified. This
is not required in conventional testing where oracle is available. Therefore, the cost of
identifying metamorphic relations, CI_MR, is an additional cost incurred in metamorphic
testing compared to conventional testing. Subsequently, in [Step 2], test cases will be
generated for both metamorphic testing and conventional testing. In metamorphic testing,
these test cases serve as the source test cases that will be used to generate follow-up test
cases. The source test case generation cost for metamorphic testing, CG_STC, and test case
generation cost for conventional testing, CG_TC, are subjected to the testing criteria used to
generate the test cases. For example, the cost of model based test case generation
(Apfelbaum and Doyle, 1997; Dalal et al., 1999; Utting and Legeard, 2010) will be higher
compared to arbitrary or random test cases generation. Having said that, if the same testing
criteria are used to generate test cases in [Step 2] for both metamorphic testing and
conventional testing, then there should be no difference in the costs incurred (that is, CG_STC
= CG_TC).
In [Step 3] of conventional testing, the test oracles or correct expected outputs of the
test cases generated will need to be constructed. This step is not required for metamorphic
testing since failure detection is solely based on violation of one or more metamorphic
relations. Hence, the cost of constructing the test oracle, CC_EO, is an additional cost for
conventional testing compared to metamorphic testing. For both metamorphic testing and
conventional testing, [Step 4] is a common step where the generated test cases are run.
Therefore, the costs involved are the same (CR_SrcTC = CR_TC). On the other hand, [Step 5]
and [Step 6] where follow up test cases are generated and run are additional steps that are
required only in metamorphic testing but not in conventional testing. Therefore, the cost of
generating follow up test cases, CG_FupTC, and the cost of running the follow up test cases,
CG_FupTC, are additional costs incurred only in metamorphic testing but not in conventional
testing.

52
In [Step 7], outputs of the test cases run are examined to detect failures. For
metamorphic testing, the outputs of source test cases in O1 and follow up test cases in O2 are
checked against the metamorphic relation. For conventional testing, the actual outputs of the
test cases in OA are compared against the expected outputs (test oracle) in OE. In this step,
the cost to check the test outputs in O1 and O2 against the metamorphic relations, Ccheck, can
be higher or lower than the cost to compare the actual outputs in OA against the expected
outputs in OE, CCompare. In cases where the outputs are complex or consist of a large amount
of data, CCheck for metamorphic testing can be lower than CCompare for conventional testing if
the metamorphic relation only needs to check a small part of the outputs to detect failure.
This will be relatively cheaper than conventional testing where the entire actual output
needs to be compared with the correct expected output to detect failure. On the other hand,
in other cases where the outputs are simple but the metamorphic relations make use of
complex properties that are computationally expensive, CCompare for conventional testing can
be cheaper than CCheck for metamorphic testing. Lastly, [Step 8] represents the cost of
verdict, CVerdict. This is a Boolean decision which is equal in cost for metamorphic testing
and conventional testing.
Overall, based on the comparison in Table 3-1, there are three additional testing steps
in metamorphic testing which do not exist in conventional testing. The shaded cells in Table
3-1 indicate these additional testing steps which incur extra costs to metamorphic testing
and conventional testing respectively. Based on the analysis in Table 3-1, additional costs
that incurred in metamorphic testing are as follow:
1. [Step 1] Cost of identifying metamorphic relations, CI_MR.
2. [Step 5] Cost of generating follow-up test cases, CG_FupTC.
3. [Step 6] Cost of running follow-up test cases, CR_FupTC.
The first additional cost of metamorphic testing is the cost to identify one or more
metamorphic relations for the software under test, CI_MR. The second additional cost is the
cost of generating one or more follow up test cases for each source test case, CG_FupTC, for a
53
metamorphic relation. As a result, the total number of test cases to be generated in
metamorphic testing is at least double of those in the conventional software testing process.
Lastly, the third additional cost component of metamorphic testing is the cost of running or
executing the additional follow up test cases generated, CR_FupTC. Therefore, the total number
of test cases to be executed in metamorphic testing is also at least double of those in
conventional software testing process.
On the other hand, metamorphic testing process does not require the construction of
expected output (test oracle) for each test case in [Step 3]. In comparison to metamorphic
testing, the cost to construct the expected output for all test cases, CC_EO, is an additional
cost in the conventional testing procedure. In view of this, metamorphic testing is an
attractive alternative to conventional testing when the cost of constructing the expected
outputs, CC_EO, is excessively higher than the total additional costs incurred in metamorphic
testing (that is, CC_OE >> CI_MR + CG_FupTC + CR_FupTC). In this situation, it can be
prohibitively expensive to construct the expected outputs (test oracle). This makes
metamorphic testing a more viable and cheaper alternative to the conventional testing
process in detecting failures in the software under test.
3.2.2 AnalysisofFunctionalComponents
From functional component perspective, three components are required in
metamorphic testing, namely, the source test case generator, the follow up test case
generator and the output checker, as shown in Figure 3-1. These functional components
could exist in the form of software tools in cases where testing is fully or partly automated
or in the form of manual tasks if testing is conducted manually.
The first functional component is the source test case generator. It is equivalent to test
case generator in conventional testing process. Therefore, it is not an additional component
that is required only in metamorphic testing. As metamorphic testing does not prescribe how
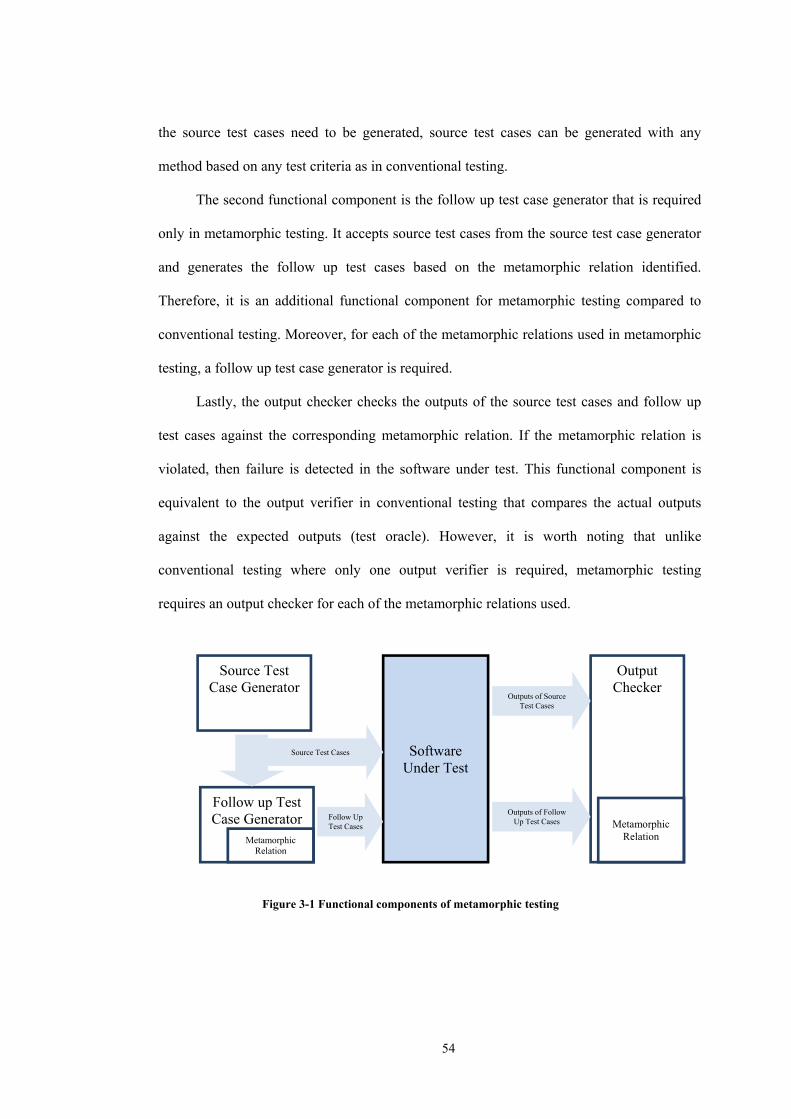
54
the source test cases need to be generated, source test cases can be generated with any
method based on any test criteria as in conventional testing.
The second functional component is the follow up test case generator that is required
only in metamorphic testing. It accepts source test cases from the source test case generator
and generates the follow up test cases based on the metamorphic relation identified.
Therefore, it is an additional functional component for metamorphic testing compared to
conventional testing. Moreover, for each of the metamorphic relations used in metamorphic
testing, a follow up test case generator is required.
Lastly, the output checker checks the outputs of the source test cases and follow up
test cases against the corresponding metamorphic relation. If the metamorphic relation is
violated, then failure is detected in the software under test. This functional component is
equivalent to the output verifier in conventional testing that compares the actual outputs
against the expected outputs (test oracle). However, it is worth noting that unlike
conventional testing where only one output verifier is required, metamorphic testing
requires an output checker for each of the metamorphic relations used.
Figure 3-1 Functional components of metamorphic testing
Software Under Test
Source Test Case Generator
Output Checker
Metamorphic Relation
Follow up Test Case Generator
Metamorphic Relation
Outputs of Follow Up Test Cases
Source Test Cases
Follow Up Test Cases
Outputs of Source Test Cases
55
3.3 Cost Saving Strategies
Based on the cost analyses of metamorphic testing, it is evident that the costs of
metamorphic testing can be reduced by reducing one or more of the costs incurred in the
testing procedures as well as its functional components. In this section, six cost-saving
strategies will be proposed to reduce or eliminate the cost incurred at various steps of testing
procedures or functional components of metamorphic testing with the aim to improve its
cost-effectiveness. Four out of the six cost saving strategies are based on the notion of
“reuse”. The notion of “reuse” has been a prevalent concept in improving cost-effectiveness
in the software engineering industry (Boehm, 1981; Frakes and Kang, 2005). It is a core
concept widely used in various popular approaches in software engineering such as object-
oriented programming (Rentsch, 1982; Ten Dyke and Kunz, 1989; Smith, 2015),
component-based software engineering (Heineman and Councill, 2001; Jifeng et al., 2005)
and regression testing (Leung and White, 1989; Rothermel and Harrold, 1996; Wong et al.,
1997; Yoo and Harman, 2012).
3.3.1 Cost Saving Strategy I: Reuse Existing Metamorphic Relations from
SimilarorRelatedSoftwareApplications
Metamorphic relation serves two functions in metamorphic testing. Firstly, it is used
to generate follow up test cases from source test cases. Secondly, it is also used to check the
outputs produced by the source test cases and follow-up test cases to detect failures in the
software under test. Metamorphic relations are normally sourced from stakeholders of the
software under test who have the knowledge in the application domain. Alternatively,
previous study by Zhang et al. (2009) had shown that software testers who had been briefly
introduced to metamorphic testing were also able to identify metamorphic relations for
software under test.
Once identified, metamorphic relation needs to be coded or deployed into the follow
up test case generator to generate the follow-up test cases based on the metamorphic
56
relations. Additionally, the metamorphic relation also needs to be coded or deployed in the
output checker to detect violation of metamorphic relation in the outputs of source test cases
and follow up test cases. The costs of identifying metamorphic relations and deploying
metamorphic relations in follow up test case generator and output checker are reflected as
CI_MR, CG_FupTC and CCheck in Section 3.2.1 on cost analysis for metamorphic testing
procedures.
In view of this, reuse of existing metamorphic relations from similar or related
software applications can effectively reduce the additional costs incurred in metamorphic
testing. This strategy is possible because successful deployment metamorphic testing in
many software applications have been reported in over 50 software applications spreading
over 15 areas ranging from thermodynamics, finance and banking to health care (refer to
Section 2.2.3 for details). With the widespread adoption of metamorphic testing in diverse
software and application areas, it is more likely for software tester to find similar or related
software applications and source and reuse existing metamorphic relations from these
software applications.
By reusing metamorphic relations from software application that shares the same
necessary properties with the software under test, the cost of identifying metamorphic
relation, CI_MR, can be reduced. More importantly, whenever a metamorphic relation is
being reused, the corresponding functional components, namely the follow-up test case
generator and the output checker tools can also be reused. This will reduce or eliminate the
cost of generating follow up test cases and output checking, represented respectively by
CG_FupTC and CCheck. In many cases, if the metamorphic relations can be reused from a similar
or related application, the source test cases can also be reused, which lead to the next cost
saving strategy as elaborated in Section 3.3.2.
As a general guideline, this cost saving strategy should be considered whenever
metamorphic testing has been successfully deployed in similar or related software
57
applications. This strategy is most suitable for software applications where follow up test
case generator and/or output checker are costly to develop.
3.3.2 CostSavingStrategyII:UseReadilyAvailableTestCasesorReuseExisting
TestCasesasSourceTestCases
Metamorphic testing does not prescribe the way how source test cases must be
selected or generated. As a matter of fact, it is not necessary to generate source test cases
specifically for the purpose of metamorphic testing. Readily available test cases such as
logged user data, databases as well as any existing and historical data can be used as source
test cases in metamorphic testing. Furthermore, existing test cases such as regression test
suites (Leung and White, 1989; Wong et al., 1997; Yoo and Harman, 2012) can also be
reused as source test cases in metamorphic testing.
By using readily available test cases or reusing existing test cases as source test
cases, the cost of generating source test cases, CG_STC, can be effectively reduced or
eliminated. From functional component perspective, this cost saving strategy effectively
eliminates the need to code or deploy a source test case generator.
As a general guideline, this cost saving strategy should be considered whenever there
are readily available or existing test cases for the software under test. This strategy is most
suitable for software applications where test cases are costly to generate.
3.3.3 CostSavingStrategyIII:ReuseorPartlyReuseSourceTestCaseasFollow
UpTestCase
Reusing source test cases as follow up test is possible for certain metamorphic
relations that make use of invariant properties of the software under test. Such metamorphic
relations may check for equality or inequality of the outputs produced by sequential multiple
executions of the same test case as source test case and follow up test case. State-based
system where the same input produces different outputs in different states of the system may

58
also exploit this cost saving strategy to reduce or eliminate the cost of generating follow up
test cases.
For a source test case that consists of multiple components, it can also be partly
reused as follow up test by preserving the more complex components while altering the less
complex component to generate follow up test cases. For example, in an image processing
program that changes the contrast of an image, the source test case consists of an image and
its contrast level. This source test case can be partly reused as follow up test cases by
reusing the same image in the source test case while altering the contrast level. This is
because changing the contrast level (which is a single numeric value) is less costly than
generating a new image or altering the source test case image into a follow up test case
image.
By reusing or partly reusing source test case as follow up test case, the cost of
generating follow up test cases, CG_FupTC, can be effectively reduced or eliminated. From
functional component perspective, this cost saving strategy can effectively eliminates the
need to code or deploy a follow up test case generator or at least reduce the computation
cost of the follow up test case generator.
As a general guideline, this cost saving strategy should be considered whenever the
software under test has an invariant property. This strategy is also suitable for state-based
system where the same input produces different outputs in different states of the system.
Additionally, for software applications where test case consists of multiple components, this
strategy should also be considered to partially reuse the source test cases. This cost saving
strategy is most suitable for software applications where follow up test cases are costly to
generate.

59
3.3.4 CostSavingStrategyIV:ReuseTheOutputofSourceTestCaseasFollow
UpTestCase
The cost saving strategy of reusing output of source test case as follow up test case is
inspired by iterative metamorphic testing (IMT) proposed by Wu (2005). In IMT, the follow
up test case of a metamorphic relation is reused as the source test case of the next
metamorphic relation. Even though this strategy can reduce the cost of generating source
test cases for the next metamorphic relations, it cannot reduce or eliminate the cost of
generating follow up test cases.
In order to reduce or eliminate the cost of generating follow up test cases, the outputs
of source test cases can be reused as follow up test cases if the data format of the output is
the same as input for the software under test. An example of metamorphic relation that can
capitalize on this cost saving strategy is the one that is based on invariant property such as
f(source test case) = f n(source test case).
By reusing the output of source test case as follow up test case, the cost of
generating follow up test cases, CG_FupTC, can be effectively eliminated. From functional
component perspective, this cost saving strategy effectively eliminates the need to code or
deploy a follow up test case generator.
As a general guideline, this cost saving strategy should be considered whenever the
output of the software under test is a valid input. Examples of such software applications are
implementations of filtering algorithms, sorting algorithms and compression algorithms.
This strategy is most suitable for software applications where follow up test cases are costly
to generate.
3.3.5 CostSavingStrategyV:PairingExistingTestCases
While the previous four reuse-based cost saving strategies can effectively reduce or
eliminate the costs of either source test case generation, CG_STC, or follow test case
generation, CG_FupTC, or both, however they cannot reduce or eliminate the additional costs
60
incurred in running the follow up test cases, CR_FupTC, in metamorphic testing. This is
because even though these reuse strategies can save the cost of generating follow up test
cases, these follow up test cases are still additional test cases that need to be run by the
software under tests for failure detection.
In order to reduce and eliminate the costs of generating follow up test case and
running follow up test case, test cases from an existing test suite, for example those
generated and run as test cases using code coverage criteria, can be paired using the
metamorphic relation to form a source test case and follow up test case pair. In this way, no
additional follow up test case needs to be generated or run. For example, if an existing test
suite consisting of 5 test cases {5°, -3°, 146°, 185°, 234°} have been generated and run as to
test a program that computes sin(x), test case 5° and test case 185° can be paired to form
source test case and follow up test case pair for metamorphic relation sin(x) = -sin(x+180°)
without having to generate or run additional follow up test cases.
By pairing existing test cases to form source and follow up test case pairs, both
the cost of generating follow up test cases, CG_FupTC, and the cost of running follow up test
cases, CR_FupTC, can be effectively reduced or eliminated. From functional component
perspective, this cost saving strategy effectively eliminates the need to code or deploy a
follow up test case generator.
As a general guideline, this cost saving strategy should be considered whenever there
are existing test suites that have been generated and executed, for example those generated
and run as test cases using code coverage criteria. Other than that, this strategy is also
suitable for applications with real-time streaming inputs, such as real-time time series data,
audio or video, which cannot be manipulated in real-time to generate follow up test cases.
3.3.6 CostSavingStrategyVI:PartialCheckingofTestOutputs
In cases where the test outputs are complex or consist of a large amount of data, the
cost to check the outputs of source test case and the follow up test case against the
61
metamorphic relation, CCheck, can be reduced if the metamorphic relation only needs to
check a small part of the outputs instead of the entire output to detect failure. For instance,
in a software application that accepts a large amount of raw data and produces a chart as
graphical output, a metamorphic relation can be chosen to target properties related only to
the initial or final points on the chart instead of all the points on the chart or the entire chart
image. Therefore, software applications with complex multi-value or multi-point outputs
will benefit the most from this cost saving strategy. However, software applications that
produce single point or single value outputs cannot exploit this cost saving strategy.
By using partial checking of test outputs, the cost of checking the outputs of source
test case and follow up test case against the metamorphic relation, CCheck, can be effectively
reduced. From functional component perspective, this cost saving strategy does not
eliminate the need to code or deploy an output checker. However, it will effectively reduce
the computation cost of the output checker as only part of the entire output need to be
checked.
As a general guideline, this cost saving strategy should be considered whenever the
test outputs are complex or consist of a large amount of data. This strategy is suitable for
data processing software with graphical outputs such as charting software.
3.4 Adopting Cost Saving Strategies in Developing Cost-effectiveness
Metamorphic Testing Techniques
The six cost saving strategies proposed above reduce one or more additional costs in
metamorphic testing, namely, the cost to identify metamorphic relation, CI_MR, the cost to
generate follow up test cases, CG_FupTC, and the cost to run the follow up test cases, CR_FupTC.
Additionally, the cost of checking the outputs of source test case and follow up test case
against the metamorphic relation, CCheck, can also be reduced if Cost Saving Strategy VI is
adopted. At minimum, the adoption of one or more of these strategies will guarantee the
reduction in the overall cost of metamorphic testing. In the ideal best case scenario where
62
CI_MR, CG_FupTC and CR_FupTC are reduced to zero (that is, totally eliminated), there will be no
additional cost incurred in metamorphic testing.
In view of this, the generic cost saving strategies proposed in this chapter can be
adopted to develop cost-effective metamorphic testing techniques for failure detection in
software with oracle problem. In Chapter 4, reuse of metamorphic relations (Cost Saving
Strategy I) and use of readily available test cases (Cost Saving Strategy II) are adopted to
develop a cost-effective metamorphic testing technique for an edge detection program in
image processing domain. In Chapter 5, a novel cost-effective metamorphic testing
technique is proposed to detect failures in financial charting software. The metamorphic
testing technique proposed adopts the use of existing test cases as source test cases (Cost
Saving Strategy II), partial reuse of source test case as follow up test case (Cost Saving
Strategy III), reuse of the output of source test case as follow up test case (Cost Saving
Strategy IV) and partial checking of test outputs (Cost Saving Strategy VI) to reduce the
cost of metamorphic testing. In addition, the viability of reusing the metamorphic relations
proposed (Cost Saving Strategy I) in other charting software components is also being
examined. Chapter 6 presents a novel cost-effective metamorphic testing technique for
computation of real-time technical indicator for trading software based on pairing of real-
time streaming test cases (Cost Saving Strategy V) which effectively eliminate the need to
generate follow up test cases. Finally, in Chapter 7, reuse of source test case as follow up
test case (Cost Saving Strategy III) is adopted to develop a new metamorphic testing
technique to detect transfer fault in finite state machine (FSM). Apart from improving cost-
effectiveness, the proposed technique also overcomes a long standing fundamental
limitation of the existing transition tour testing technique in detecting transfer faults in FSM.
63
4 Cost-effective Metamorphic Testing Technique
for Edge Detection Programs
Edge detection is an important and widely used pre-processing operation in digital
image processing. However, programmer’s errors in implementing edge detection
algorithms could cause failures in edge detection programs. In this chapter, two cost saving
strategies proposed in Chapter 3 are deployed to develop a cost-effective metamorphic
testing technique to detect failures in edge detection programs in the absence of oracle.
These strategies are namely, reuse of metamorphic relations (Cost Saving Strategy I in
Section 3.3) and use of readily available test cases (Cost Saving Strategy II in Section 3.3).
By using Sobel edge detection programs developed in C as test subject, experiments are
conducted to evaluate the effectiveness of metamorphic testing technique in detecting
failures in faulty edge detection programs. Based on the experiment results, general
guidelines for using metamorphic testing to detect failures in edge detection programs are
also proposed.
4.1 Introduction
In digital image processing, an edge can be defined as the boundary between two
regions separated by two relatively distinct gray levels (Gonzalez and Woods, 2002). Hence,
edge detection is the process of localizing the abrupt changes in the gray level of an image
(Gudmundsson et al., 1998). Edge detection is an important pre-processing step in many
digital image processing and computer vision operations such as feature extraction and
detection, image enhancement, compression, retrieval, watermarking, hiding, restoration and
registration (Ziou and Tabbone, 1998).
Well-known algorithms such as Canny and Sobel have been developed to perform
edge detection (Canny, 1986; Umbaugh, 1997). However, programmer’s errors in
implementing these algorithms could induce faults in edge detection programs that cause
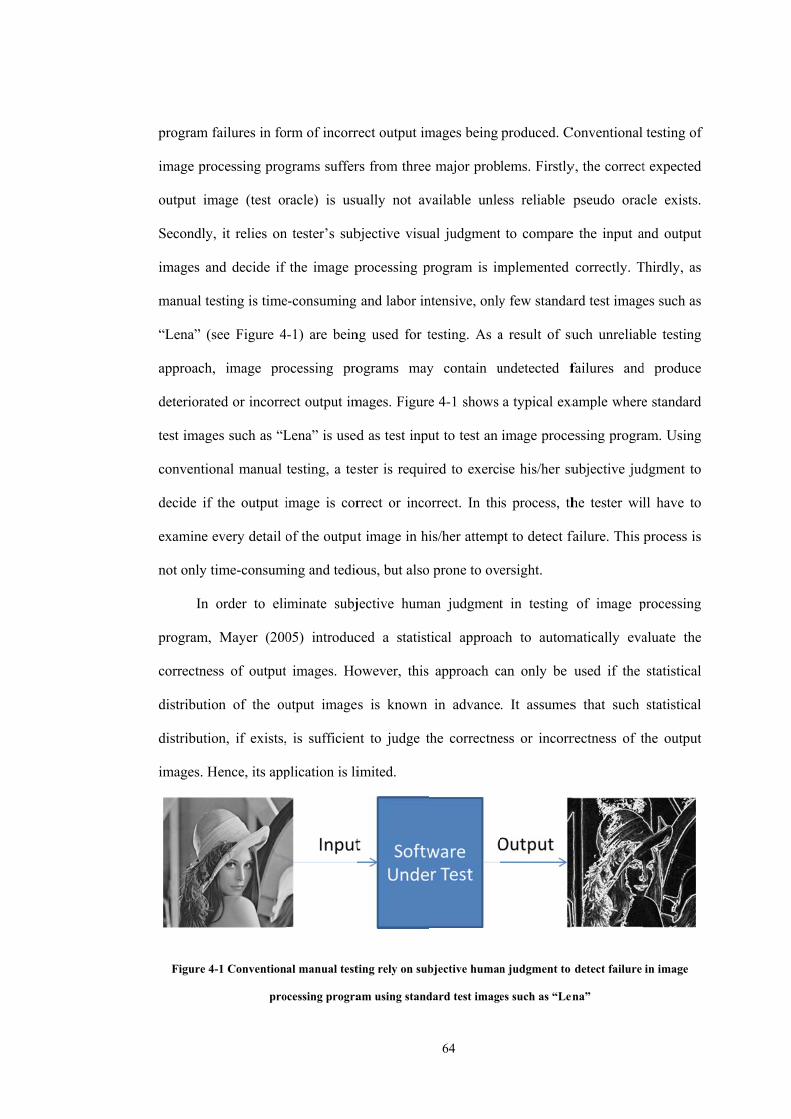
program f
image pro
output im
Secondly,
images an
manual te
“Lena” (s
approach,
deteriorat
test image
conventio
decide if
examine e
not only t
In
program,
correctnes
distributio
distributio
images. H
Figure 4
failures in fo
ocessing prog
mage (test or
, it relies on
nd decide if
esting is time
see Figure 4
, image pro
ed or incorre
es such as “L
onal manual
the output i
every detail o
time-consum
order to eli
Mayer (200
ss of output
on of the ou
on, if exists,
Hence, its app
-1 Convention
pro
orm of incorr
grams suffer
racle) is usu
n tester’s sub
the image p
e-consuming
4-1) are bein
ocessing pro
ect output im
Lena” is used
testing, a tes
image is cor
of the output
ming and tedio
iminate subj
05) introduc
t images. Ho
utput image
, is sufficien
plication is li
al manual test
ocessing progra
rect output im
rs from three
ually not av
bjective visu
processing p
and labor in
ng used for t
ograms may
mages. Figure
d as test inpu
ster is requir
rrect or inco
t image in hi
ous, but also
jective huma
ced a statist
owever, this
s is known
nt to judge t
imited.
ting rely on sub
am using stand
64
mages being
e major prob
vailable unle
ual judgment
program is im
ntensive, only
testing. As a
y contain u
e 4-1 shows
ut to test an
red to exerci
orrect. In thi
is/her attemp
o prone to ove
an judgment
tical approac
approach c
in advance
the correctne
bjective human
dard test image
produced. C
lems. Firstly
ess reliable
to compare
mplemented
y few standa
a result of su
undetected f
a typical exa
image proce
ise his/her su
s process, th
pt to detect f
ersight.
t in testing
ch to autom
an only be
. It assumes
ess or incorr
n judgment to
es such as “Len
Conventional
y, the correct
pseudo orac
e the input a
correctly. T
ard test image
uch unreliab
failures and
ample where
essing progra
ubjective jud
he tester wil
failure. This
of image p
matically eva
used if the
s that such
rectness of t
detect failure
na”
testing of
t expected
cle exists.
and output
Thirdly, as
es such as
ble testing
d produce
e standard
am. Using
dgment to
ll have to
process is
processing
aluate the
statistical
statistical
the output
in image
65
In a subsequent study, Mayer and Guderlei (2006b) proposed random (King and
Offutt, 1991) and binary (Stoyan et al., 1995) models to randomly generate a large quantity
of binary images to test Euclidian Distance Transformation (Danielsson, 1980) program.
The use of random and binary models to generate images as test cases was proposed to
overcome the reliance on few standard test images such as “Lena”. Metamorphic testing
approach was adopted to generate follow up test cases and detect failures in the test output
images. Through metamorphic testing and model generated images, they successfully
automated the test case generation and failure detection process for Euclidean Distance
Transformation programs.
Even though edge detection is an important and widely used pre-processing operation
in digital image processing, the correctness of edge detection programs is often taken for
granted. As edge detection is among the first pre-processing steps in image processing
applications such as feature extraction and detection, image enhancement, compression,
retrieval, watermarking, hiding, restoration and registration, incorrect or poor edge detection
will have significant impacts on subsequent operations in these applications.
To address these problems, a cost-effective metamorphic testing technique to detect
failures in edge detection program is therefore proposed and presented in the next section.
4.2 Metamorphic Relations for Failure Detection in Edge Detection
Programs
As metamorphic testing approach has been successfully deployed to detect failures in
similar image processing software applications, reuse of metamorphic relations (Cost
Saving Strategy I in Section 3.3) can be adopted as a cost saving strategy in developing
cost-effective metamorphic testing technique for edge detection program. More importantly,
by reusing the metamorphic relations from other image processing software applications, the
corresponding follow-up test case generators and output checkers can also be reused, hence
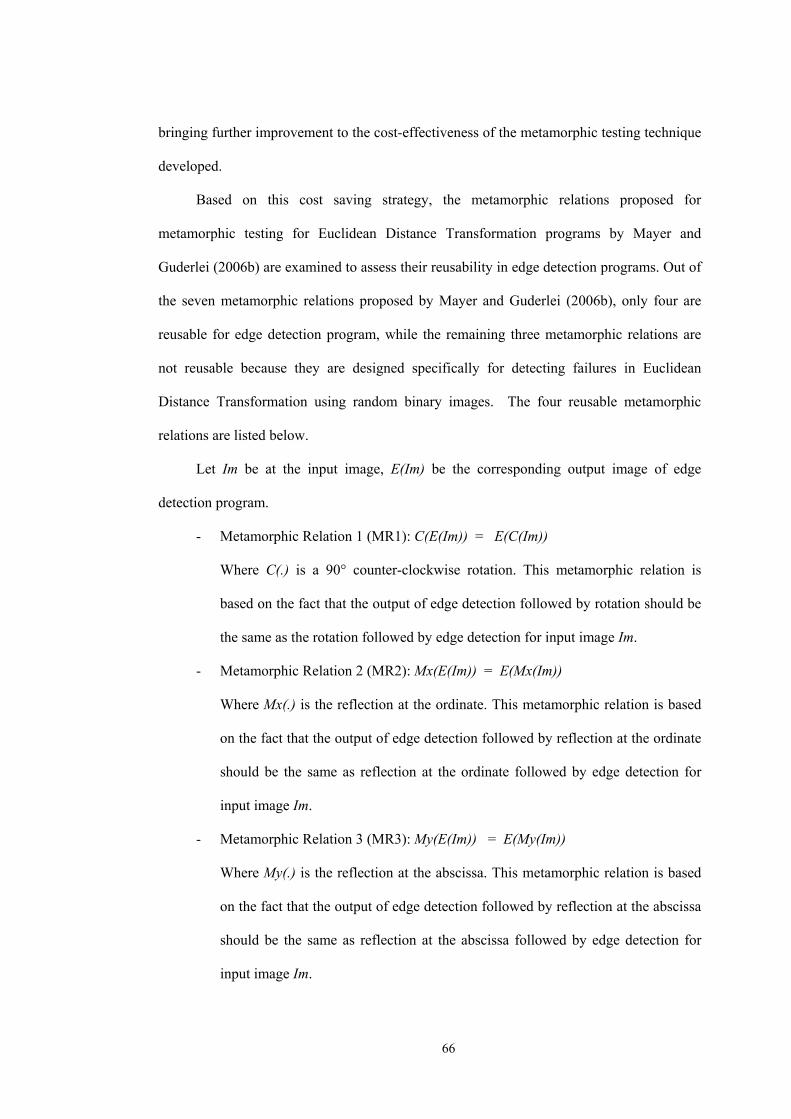
66
bringing further improvement to the cost-effectiveness of the metamorphic testing technique
developed.
Based on this cost saving strategy, the metamorphic relations proposed for
metamorphic testing for Euclidean Distance Transformation programs by Mayer and
Guderlei (2006b) are examined to assess their reusability in edge detection programs. Out of
the seven metamorphic relations proposed by Mayer and Guderlei (2006b), only four are
reusable for edge detection program, while the remaining three metamorphic relations are
not reusable because they are designed specifically for detecting failures in Euclidean
Distance Transformation using random binary images. The four reusable metamorphic
relations are listed below.
Let Im be at the input image, E(Im) be the corresponding output image of edge
detection program.
- Metamorphic Relation 1 (MR1): C(E(Im)) = E(C(Im))
Where C(.) is a 90° counter-clockwise rotation. This metamorphic relation is
based on the fact that the output of edge detection followed by rotation should be
the same as the rotation followed by edge detection for input image Im.
- Metamorphic Relation 2 (MR2): Mx(E(Im)) = E(Mx(Im))
Where Mx(.) is the reflection at the ordinate. This metamorphic relation is based
on the fact that the output of edge detection followed by reflection at the ordinate
should be the same as reflection at the ordinate followed by edge detection for
input image Im.
- Metamorphic Relation 3 (MR3): My(E(Im)) = E(My(Im))
Where My(.) is the reflection at the abscissa. This metamorphic relation is based
on the fact that the output of edge detection followed by reflection at the abscissa
should be the same as reflection at the abscissa followed by edge detection for
input image Im.
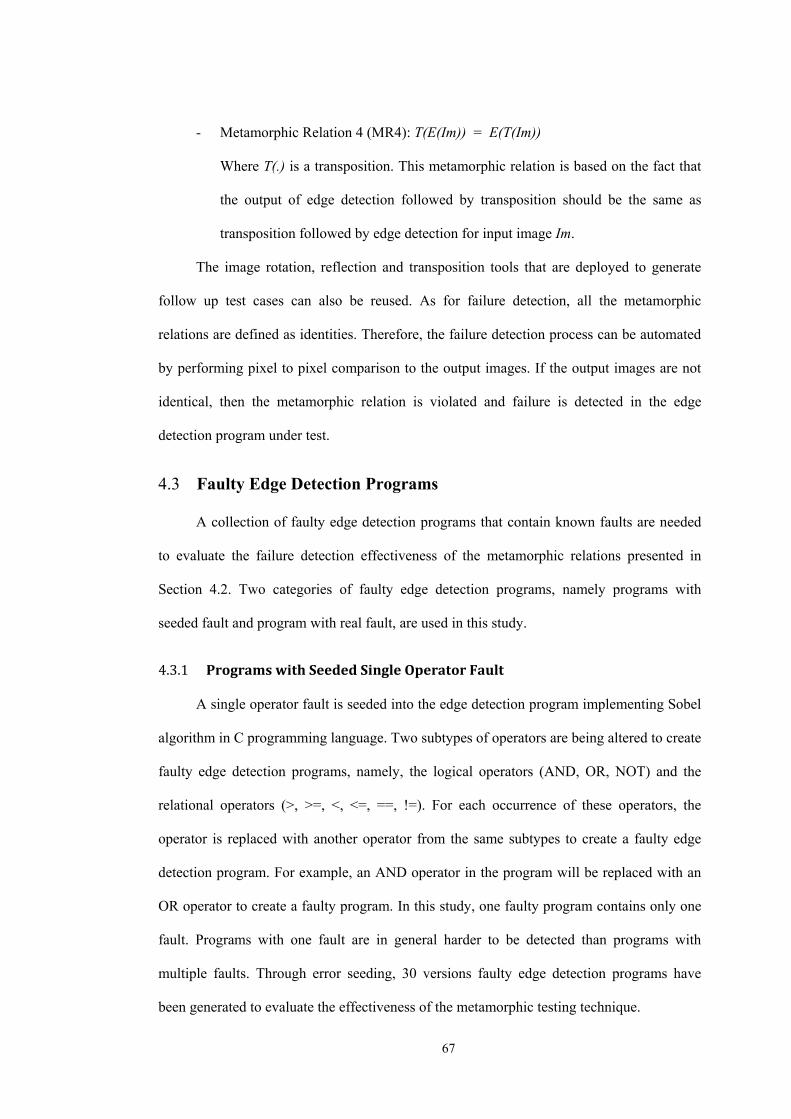
67
- Metamorphic Relation 4 (MR4): T(E(Im)) = E(T(Im))
Where T(.) is a transposition. This metamorphic relation is based on the fact that
the output of edge detection followed by transposition should be the same as
transposition followed by edge detection for input image Im.
The image rotation, reflection and transposition tools that are deployed to generate
follow up test cases can also be reused. As for failure detection, all the metamorphic
relations are defined as identities. Therefore, the failure detection process can be automated
by performing pixel to pixel comparison to the output images. If the output images are not
identical, then the metamorphic relation is violated and failure is detected in the edge
detection program under test.
4.3 Faulty Edge Detection Programs
A collection of faulty edge detection programs that contain known faults are needed
to evaluate the failure detection effectiveness of the metamorphic relations presented in
Section 4.2. Two categories of faulty edge detection programs, namely programs with
seeded fault and program with real fault, are used in this study.
4.3.1 ProgramswithSeededSingleOperatorFault
A single operator fault is seeded into the edge detection program implementing Sobel
algorithm in C programming language. Two subtypes of operators are being altered to create
faulty edge detection programs, namely, the logical operators (AND, OR, NOT) and the
relational operators (>, >=, <, <=, ==, !=). For each occurrence of these operators, the
operator is replaced with another operator from the same subtypes to create a faulty edge
detection program. For example, an AND operator in the program will be replaced with an
OR operator to create a faulty program. In this study, one faulty program contains only one
fault. Programs with one fault are in general harder to be detected than programs with
multiple faults. Through error seeding, 30 versions faulty edge detection programs have
been generated to evaluate the effectiveness of the metamorphic testing technique.
68
4.3.2 ProgramwithRealFault‐StrideImplementationFault
Wrong interpretation or incorrect implementation of algorithm specifications can also
result in faulty program. In a related study by Chong et al. (2010), a real stride
implementation fault had been encountered in the early stage of Sobel algorithm
implementation in C. In this study, a stride implementation fault occurs when the image is
processed up to the visible horizontal width instead of the “stride” width. The stride width is
the actual horizontal dimension of the image data array. When an image is saved, the
horizontal dimension of the image will be padded until the closest multiple of four for
efficiency purpose. As far as known, the stride implementation fault has not been previously
reported in the literatures of testing or image processing.
Figure 4-2 An original image with the dimension of 283 x 212 pixels. Note that the image width is not
multiple of four which is the stride width. When the image is saved, the horizontal dimension of this image
will be padded until 284 which is the closest multiple of four
69
Figure 4-3 The circled diagonal line is an additional line resulted from the stride implementation error in
Sobel edge detection program
4.4 Experiments
Experiments are conducted to evaluate the effectiveness of the metamorphic relations
in detecting failures in these faulty edge detection programs. The failure detection
effectiveness, E, is defined by (Equation 4-1).
%100ProgramsFaulty ofNumber Total
ProgramsFaulty Detected ofNumber E X (Equation 4-1)
The failure detection effectiveness is evaluated for each metamorphic relation
presented in Section 4.2. A faulty program is said to be detected by a metamorphic relation
if the metamorphic relation is violated.
4.4.1 TestInputs
A collection of images need to be selected or generated as source test inputs to
conduct metamorphic testing. In order to improve the cost-effectiveness of metamorphic
testing technique for edge detection programs, Cost Saving Strategy II presented in Section
3.3 is adopted. This strategy suggests the use of readily available test cases or reuse of
existing test cases as source test cases. Attempt to deploy this strategy is made by exploring
the possibility to reuse images generated in the work conducted by Mayer and Guderlei
(2006b) as source test cases. However, upon assessment, it was found that binary images
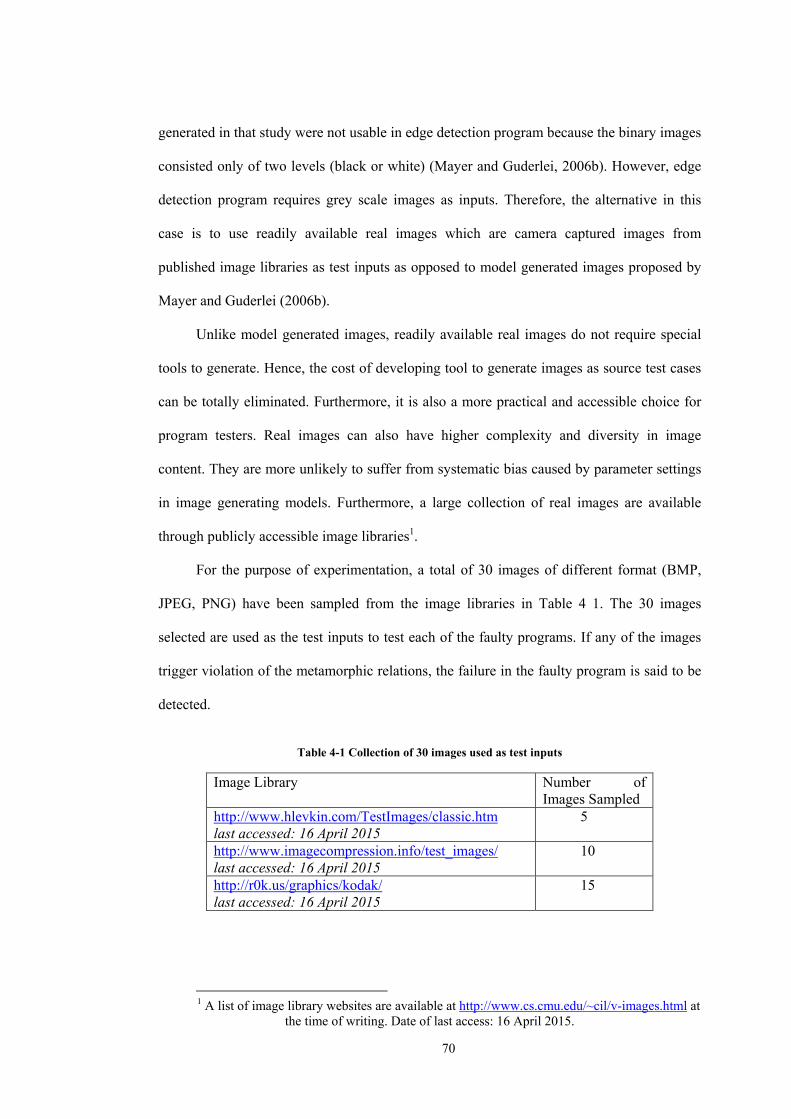
70
generated in that study were not usable in edge detection program because the binary images
consisted only of two levels (black or white) (Mayer and Guderlei, 2006b). However, edge
detection program requires grey scale images as inputs. Therefore, the alternative in this
case is to use readily available real images which are camera captured images from
published image libraries as test inputs as opposed to model generated images proposed by
Mayer and Guderlei (2006b).
Unlike model generated images, readily available real images do not require special
tools to generate. Hence, the cost of developing tool to generate images as source test cases
can be totally eliminated. Furthermore, it is also a more practical and accessible choice for
program testers. Real images can also have higher complexity and diversity in image
content. They are more unlikely to suffer from systematic bias caused by parameter settings
in image generating models. Furthermore, a large collection of real images are available
through publicly accessible image libraries1.
For the purpose of experimentation, a total of 30 images of different format (BMP,
JPEG, PNG) have been sampled from the image libraries in Table 4 1. The 30 images
selected are used as the test inputs to test each of the faulty programs. If any of the images
trigger violation of the metamorphic relations, the failure in the faulty program is said to be
detected.
Table 4-1 Collection of 30 images used as test inputs
Image Library Number of Images Sampled
http://www.hlevkin.com/TestImages/classic.htm last accessed: 16 April 2015
5
http://www.imagecompression.info/test_images/ last accessed: 16 April 2015
10
http://r0k.us/graphics/kodak/ last accessed: 16 April 2015
15
1 A list of image library websites are available at http://www.cs.cmu.edu/~cil/v-images.html at
the time of writing. Date of last access: 16 April 2015.
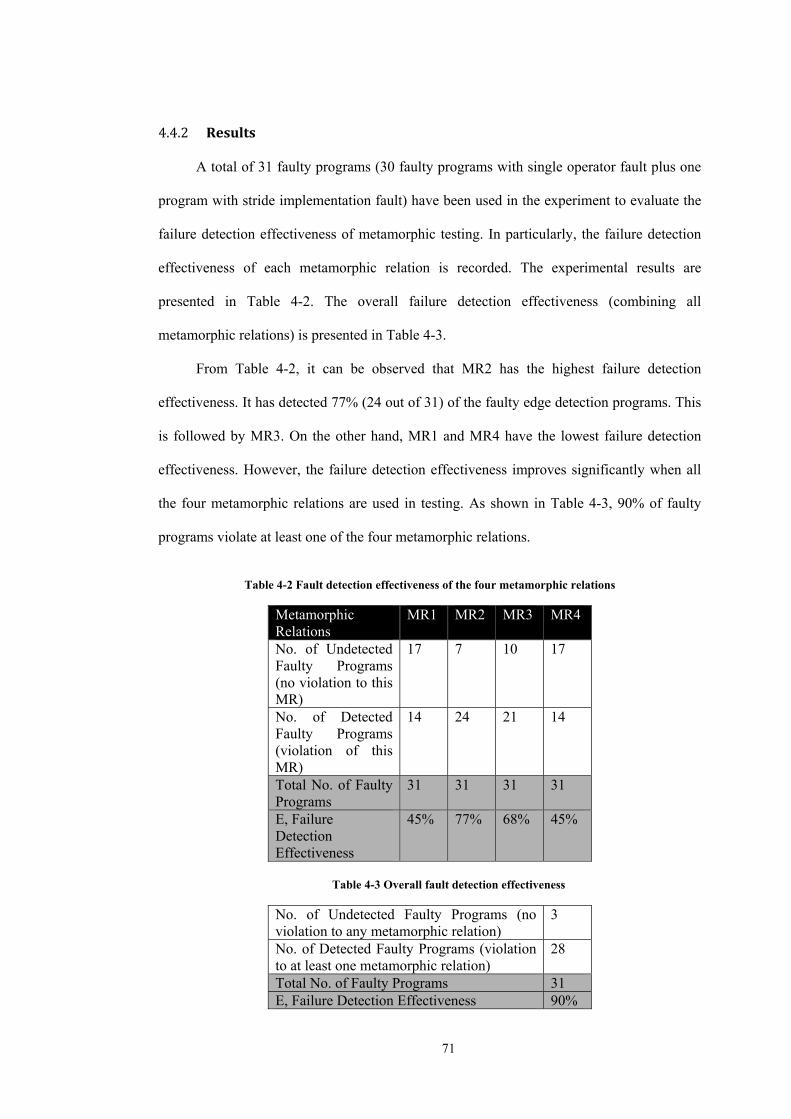
71
4.4.2 Results
A total of 31 faulty programs (30 faulty programs with single operator fault plus one
program with stride implementation fault) have been used in the experiment to evaluate the
failure detection effectiveness of metamorphic testing. In particularly, the failure detection
effectiveness of each metamorphic relation is recorded. The experimental results are
presented in Table 4-2. The overall failure detection effectiveness (combining all
metamorphic relations) is presented in Table 4-3.
From Table 4-2, it can be observed that MR2 has the highest failure detection
effectiveness. It has detected 77% (24 out of 31) of the faulty edge detection programs. This
is followed by MR3. On the other hand, MR1 and MR4 have the lowest failure detection
effectiveness. However, the failure detection effectiveness improves significantly when all
the four metamorphic relations are used in testing. As shown in Table 4-3, 90% of faulty
programs violate at least one of the four metamorphic relations.
Table 4-2 Fault detection effectiveness of the four metamorphic relations
Metamorphic Relations
MR1 MR2 MR3 MR4
No. of Undetected Faulty Programs (no violation to this MR)
17 7 10 17
No. of Detected Faulty Programs (violation of this MR)
14 24 21 14
Total No. of Faulty Programs
31 31 31 31
E, Failure Detection Effectiveness
45% 77% 68% 45%
Table 4-3 Overall fault detection effectiveness
No. of Undetected Faulty Programs (no violation to any metamorphic relation)
3
No. of Detected Faulty Programs (violation to at least one metamorphic relation)
28
Total No. of Faulty Programs 31 E, Failure Detection Effectiveness 90%
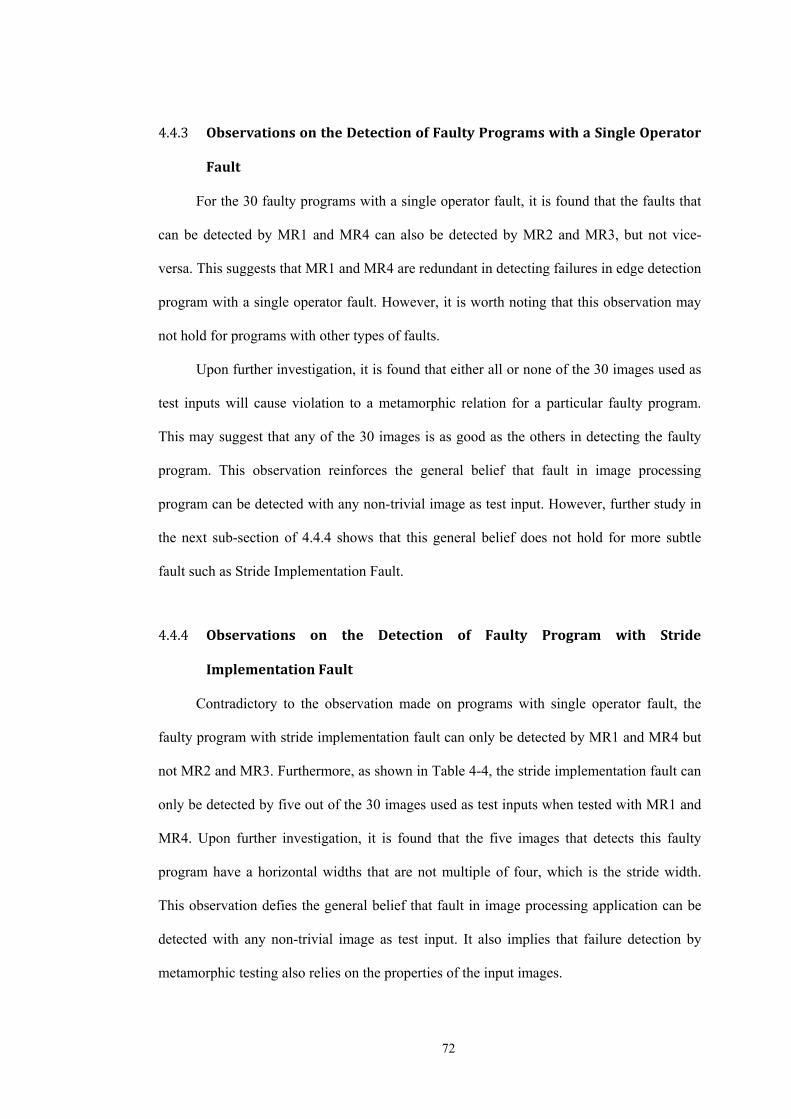
72
4.4.3 ObservationsontheDetectionofFaultyProgramswithaSingleOperator
Fault
For the 30 faulty programs with a single operator fault, it is found that the faults that
can be detected by MR1 and MR4 can also be detected by MR2 and MR3, but not vice-
versa. This suggests that MR1 and MR4 are redundant in detecting failures in edge detection
program with a single operator fault. However, it is worth noting that this observation may
not hold for programs with other types of faults.
Upon further investigation, it is found that either all or none of the 30 images used as
test inputs will cause violation to a metamorphic relation for a particular faulty program.
This may suggest that any of the 30 images is as good as the others in detecting the faulty
program. This observation reinforces the general belief that fault in image processing
program can be detected with any non-trivial image as test input. However, further study in
the next sub-section of 4.4.4 shows that this general belief does not hold for more subtle
fault such as Stride Implementation Fault.
4.4.4 Observations on the Detection of Faulty Program with Stride
ImplementationFault
Contradictory to the observation made on programs with single operator fault, the
faulty program with stride implementation fault can only be detected by MR1 and MR4 but
not MR2 and MR3. Furthermore, as shown in Table 4-4, the stride implementation fault can
only be detected by five out of the 30 images used as test inputs when tested with MR1 and
MR4. Upon further investigation, it is found that the five images that detects this faulty
program have a horizontal widths that are not multiple of four, which is the stride width.
This observation defies the general belief that fault in image processing application can be
detected with any non-trivial image as test input. It also implies that failure detection by
metamorphic testing also relies on the properties of the input images.
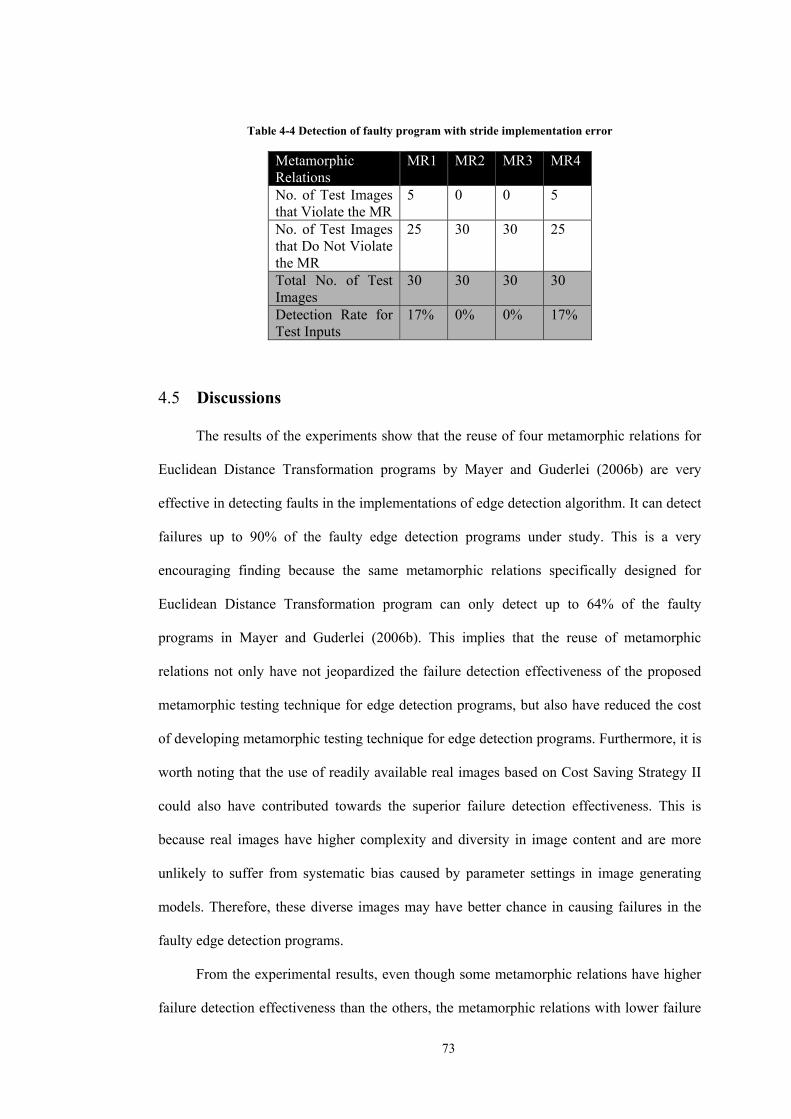
73
Table 4-4 Detection of faulty program with stride implementation error
Metamorphic Relations
MR1 MR2 MR3 MR4
No. of Test Images that Violate the MR
5 0 0 5
No. of Test Images that Do Not Violate the MR
25 30 30 25
Total No. of Test Images
30 30 30 30
Detection Rate for Test Inputs
17% 0% 0% 17%
4.5 Discussions
The results of the experiments show that the reuse of four metamorphic relations for
Euclidean Distance Transformation programs by Mayer and Guderlei (2006b) are very
effective in detecting faults in the implementations of edge detection algorithm. It can detect
failures up to 90% of the faulty edge detection programs under study. This is a very
encouraging finding because the same metamorphic relations specifically designed for
Euclidean Distance Transformation program can only detect up to 64% of the faulty
programs in Mayer and Guderlei (2006b). This implies that the reuse of metamorphic
relations not only have not jeopardized the failure detection effectiveness of the proposed
metamorphic testing technique for edge detection programs, but also have reduced the cost
of developing metamorphic testing technique for edge detection programs. Furthermore, it is
worth noting that the use of readily available real images based on Cost Saving Strategy II
could also have contributed towards the superior failure detection effectiveness. This is
because real images have higher complexity and diversity in image content and are more
unlikely to suffer from systematic bias caused by parameter settings in image generating
models. Therefore, these diverse images may have better chance in causing failures in the
faulty edge detection programs.
From the experimental results, even though some metamorphic relations have higher
failure detection effectiveness than the others, the metamorphic relations with lower failure

74
detection effectiveness are not redundant. This is because there are certain faulty programs
that can only be detected by these metamorphic relations. Furthermore, the experimental
results have also shown that the stride implementation fault is a subtle fault that can only be
detected when images with certain properties are used as test inputs.
From the above observations, the following general guides can be used when
deploying the proposed metamorphic testing technique to detect failures in edge detection
programs:
1. All metamorphic relations identified should be used to test edge detection
programs because the metamorphic relations may work in complementary to
detect different failures that may exist in the edge detection program. As each
metamorphic relation has different failure detection effectiveness, it is
recommended that testing is conducted with metamorphic relations with higher
failure detection effectiveness first, and then followed by the lower ones. Such
prioritization will improve the probability of detecting more failure at the earlier
stage in the testing process and further enhance the cost-effectiveness of the
metamorphic testing proposed for edge detection programs.
2. Real images can be used as source test cases for metamorphic testing instead of
model generated images. A large collection of real images are publicly accessible
to testers. The use of these readily available real images can save the cost of
generating source test cases. Furthermore, real images are more unlikely to suffer
from constraints that exist on model generated images.
3. A variety of real images should be selected as test inputs (source test cases).
Images with different dimensions, color depth and formats should be used as test
inputs. This is because there may exist certain subtle faults that can only be
detected by images with certain properties.
In summary, this chapter has presented a cost effective metamorphic testing technique
for edge detection program that has been developed by reusing metamorphic relations
75
proposed for a related software application, namely, the Euclidean Distance Transformation
program. The reuse of metamorphic relations as a cost saving strategy not only reduces the
cost of identifying metamorphic relations for edge detection programs, but also enables the
corresponding follow up test cases generators and output checkers to be reused for further
cost saving. In addition, the cost saving strategy of using readily available real images is
adopted to save the cost of generating source test cases. The experimental results have
shown that the reuse of metamorphic relations can detect failures up to 90% of the faulty
edge detection programs, which is significantly higher compared to 64% in Euclidean
Distance Transformation programs where the metamorphic relations are obtained from.
Even though the failure detection effectiveness of metamorphic relations varies, they are
complementary in detecting different faulty edge detection programs. Contrary to common
belief that failure in image processing program can be detected with any non-trivial image
as test input, it has been found in this study that there exists subtle fault that can only be
detected when images with certain properties are used as test inputs. Based on these
findings, general guides have been drawn for using the proposed metamorphic testing
technique to detect failures in edge detection programs.
76
5 Cost-effective Metamorphic Testing Technique
for Financial Charting Components
Financial charting software is widely used in share, commodity and foreign currency
exchange markets to visualize and analyze price movements. Its quality is critical because
incorrect outputs may lead to wrong analysis and trading decisions, and consequently
substantial financial losses. Human visual judgment is often required to test financial
charting software because of the graphical complexity of software outputs and the correct
expected outputs (oracles) are unknown. Such approach is labor intensive and error-prone.
In this chapter, a cost-effective metamorphic testing technique in combination with assertion
checking is proposed to alleviate the oracle problem in testing financial charting software.
Experiments are conducted on pre-release builds of a commercial Point and Figure charting
software component to evaluate the failure detection effectiveness of the proposed
technique. The results show that the proposed technique can effectively detect actual
failures in the software component. In addition, how the metamorphic relations proposed
can be reused to test other charting software components are also discussed in this chapter.
5.1 Introduction
The quality of software tools used in financial markets is of outmost importance
because millions of dollars may be at stake if the software tools fail. Financial charts have
been widely used as the primary tool in technical analysis of price movement in share,
commodity and foreign currency exchange (also known as forex) markets. Previous study
by Taylor and Allen (1992) found that over 90% of dealers in forex market use financial
charts to perform technical analysis prior to making trading decisions. Gehrig and Menkhoff
(2006) further reported that financial charts have been commonly used by forex dealers and
fund managers to forecast short-term price movements in various financial markets.
77
The main function of financial charting software is to process a large amount of time-
series price data and translate it into visual representations in the form of charts, which are
more meaningful to its users. For instance, Point and Figure chart, Renko chart, Kagi chart
and Three-line-break chart are widely used to visually highlight major trends and turning
points in share, commodity and forex prices. Such visual presentation provides the essential
information needed for analysis and decision making in trading and investment sectors.
Therefore, financial charts are often integrated into the market analysis and trading software
used by dealers, fund managers and retail clients in financial markets.
As a crucial tool in financial trading, any failure in the financial charting software
components can incur financial losses to the users. Therefore, testing of financial charting
software components used in market analysis and trading software is crucial to ensure that
failures are detected and eliminated before the software are released to the end users.
However, testing of financial charting software components encounters a few
challenges. Due to the graphical nature of the software outputs, testers have to manually
inspect the chart produced by the software as outputs and exercise their visual judgment to
determine the correctness of the chart. They may have to manually construct a chart and
spot out any difference between the constructed chart and the chart produced by the
software. This approach is known as manual oracle (Marick, 1998). This is a tedious and
error-prone task for any non-trivial chart with a substantial number of data points in its
outputs. To make it worse, charting component also suffers from the oracle problem
(Weyuker, 1982) because the correct charting outputs are often unknown or cannot be
derived easily. In the absence of oracle that specifies the expected output for the software or
component under test, testers will not be able to determine the correctness of the outputs
produced by the charting component accurately. Such problem is common in financial
charts such as Point and Figure chart, Renko chart, Kagi chart and Three-Point-Break chart.
Test automation can be an effective solution to eliminate error-prone human visual
judgment from testing of financial charting components. However, automatic testing
78
normally requires a complete oracle so that every test output can be verified. In the absence
of oracle, automatic pixel to pixel verification cannot be done unless some “pseudo oracles”
(Davis and Weyuker, 1981) exist, in which multiple independently-developed
implementations of the same chart are used to compare the charting outputs for a given
input. Past study conducted by Knight and Leveson (1986) suggested that pseudo oracles
not only were expensive to deploy, but also might not be feasible or effective. This is
because multiple implementations may not exist. Even if they do exist, they may have been
created by the same group(s) of developers who are prone to making the same types of
mistakes. As a result, the pseudo oracle may not be trustable.
In the absence of both complete oracle and trustable pseudo oracle, metamorphic
testing can be used as a reliable way to detect failures in software under test (Chen et al.,
1998). On the other hand, assertion checking (Taylor, 1980; Binder, 2000; Alakeel, 2010)
can also be used to verify whether the execution of a test case satisfies some expected and
necessary properties even though test oracles (pseudo or non-pseudo) are not available.
Properties such as correct program states, variable initialization as well as lower or upper
bounds of variable value and program output can be used as assertion conditions. These
assertion conditions must be satisfied for correct program implementation and execution.
Even though the expected output is unknown, any violation to the assertion conditions
implies the presence of faults in the software under test. Therefore, assertion checking can
be used to test software with oracle problem. In an empirical study to compare the use of
metamorphic testing and assertion checking, Zhang et al. (2009) suggested that even though
metamorphic testing was more effective than assertion checking in fault detection, assertion
checking was found to be more efficient in terms of time and cost of implementation and
could provide finer granularity in testing.
In an early study conducted to test software with graphical output, Takahashi (2001)
proposed a coordinate and projection-based approach to automate the verification for
Graphical User Interface (GUI) objects in software such as Microsoft PowerPoint. In
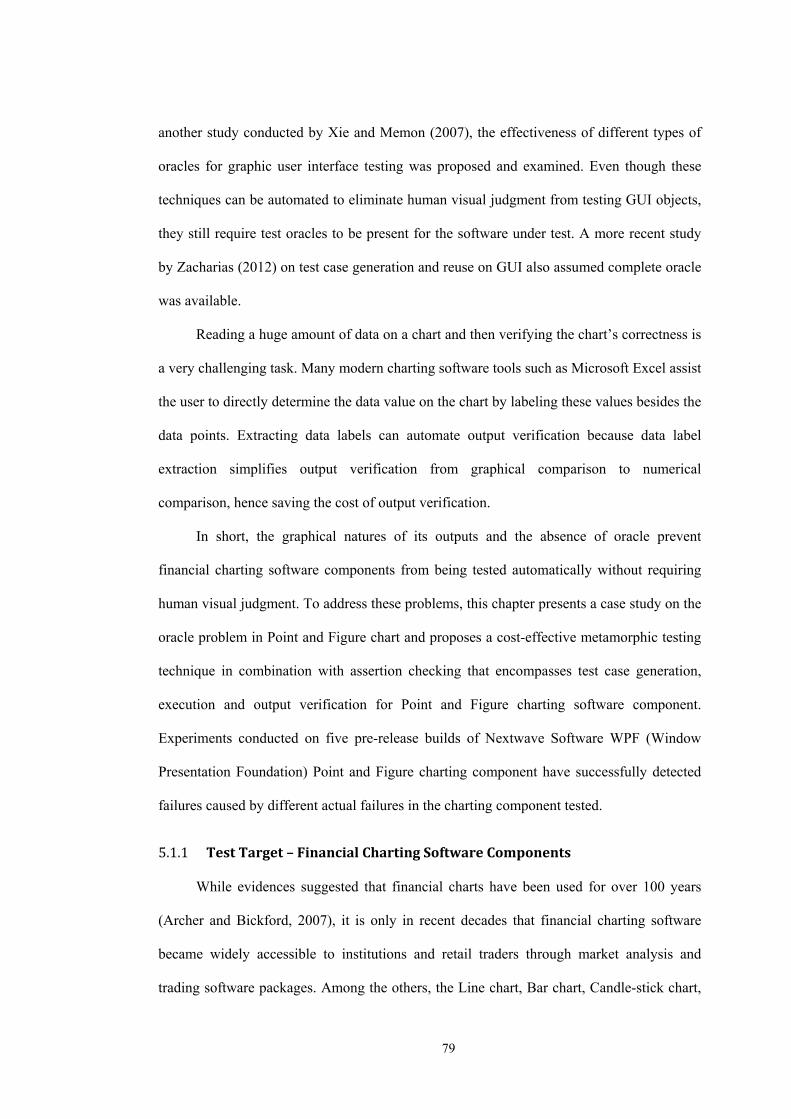
79
another study conducted by Xie and Memon (2007), the effectiveness of different types of
oracles for graphic user interface testing was proposed and examined. Even though these
techniques can be automated to eliminate human visual judgment from testing GUI objects,
they still require test oracles to be present for the software under test. A more recent study
by Zacharias (2012) on test case generation and reuse on GUI also assumed complete oracle
was available.
Reading a huge amount of data on a chart and then verifying the chart’s correctness is
a very challenging task. Many modern charting software tools such as Microsoft Excel assist
the user to directly determine the data value on the chart by labeling these values besides the
data points. Extracting data labels can automate output verification because data label
extraction simplifies output verification from graphical comparison to numerical
comparison, hence saving the cost of output verification.
In short, the graphical natures of its outputs and the absence of oracle prevent
financial charting software components from being tested automatically without requiring
human visual judgment. To address these problems, this chapter presents a case study on the
oracle problem in Point and Figure chart and proposes a cost-effective metamorphic testing
technique in combination with assertion checking that encompasses test case generation,
execution and output verification for Point and Figure charting software component.
Experiments conducted on five pre-release builds of Nextwave Software WPF (Window
Presentation Foundation) Point and Figure charting component have successfully detected
failures caused by different actual failures in the charting component tested.
5.1.1 TestTarget–FinancialChartingSoftwareComponents
While evidences suggested that financial charts have been used for over 100 years
(Archer and Bickford, 2007), it is only in recent decades that financial charting software
became widely accessible to institutions and retail traders through market analysis and
trading software packages. Among the others, the Line chart, Bar chart, Candle-stick chart,
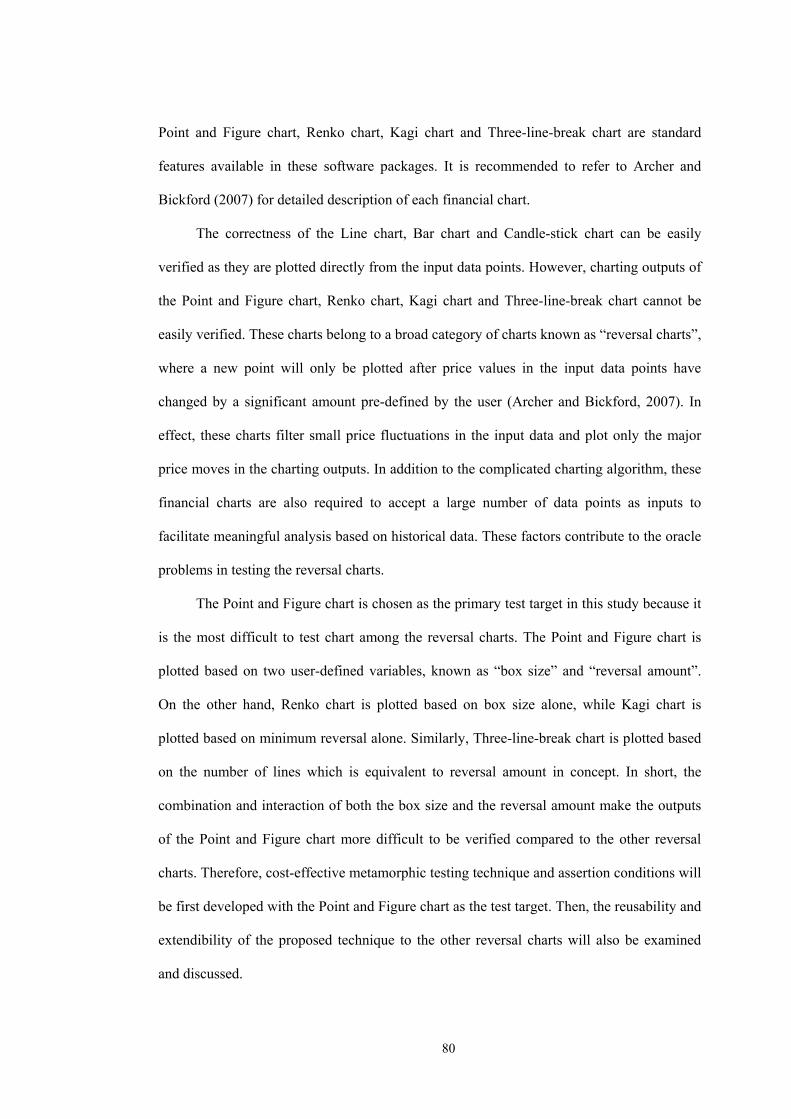
80
Point and Figure chart, Renko chart, Kagi chart and Three-line-break chart are standard
features available in these software packages. It is recommended to refer to Archer and
Bickford (2007) for detailed description of each financial chart.
The correctness of the Line chart, Bar chart and Candle-stick chart can be easily
verified as they are plotted directly from the input data points. However, charting outputs of
the Point and Figure chart, Renko chart, Kagi chart and Three-line-break chart cannot be
easily verified. These charts belong to a broad category of charts known as “reversal charts”,
where a new point will only be plotted after price values in the input data points have
changed by a significant amount pre-defined by the user (Archer and Bickford, 2007). In
effect, these charts filter small price fluctuations in the input data and plot only the major
price moves in the charting outputs. In addition to the complicated charting algorithm, these
financial charts are also required to accept a large number of data points as inputs to
facilitate meaningful analysis based on historical data. These factors contribute to the oracle
problems in testing the reversal charts.
The Point and Figure chart is chosen as the primary test target in this study because it
is the most difficult to test chart among the reversal charts. The Point and Figure chart is
plotted based on two user-defined variables, known as “box size” and “reversal amount”.
On the other hand, Renko chart is plotted based on box size alone, while Kagi chart is
plotted based on minimum reversal alone. Similarly, Three-line-break chart is plotted based
on the number of lines which is equivalent to reversal amount in concept. In short, the
combination and interaction of both the box size and the reversal amount make the outputs
of the Point and Figure chart more difficult to be verified compared to the other reversal
charts. Therefore, cost-effective metamorphic testing technique and assertion conditions will
be first developed with the Point and Figure chart as the test target. Then, the reusability and
extendibility of the proposed technique to the other reversal charts will also be examined
and discussed.
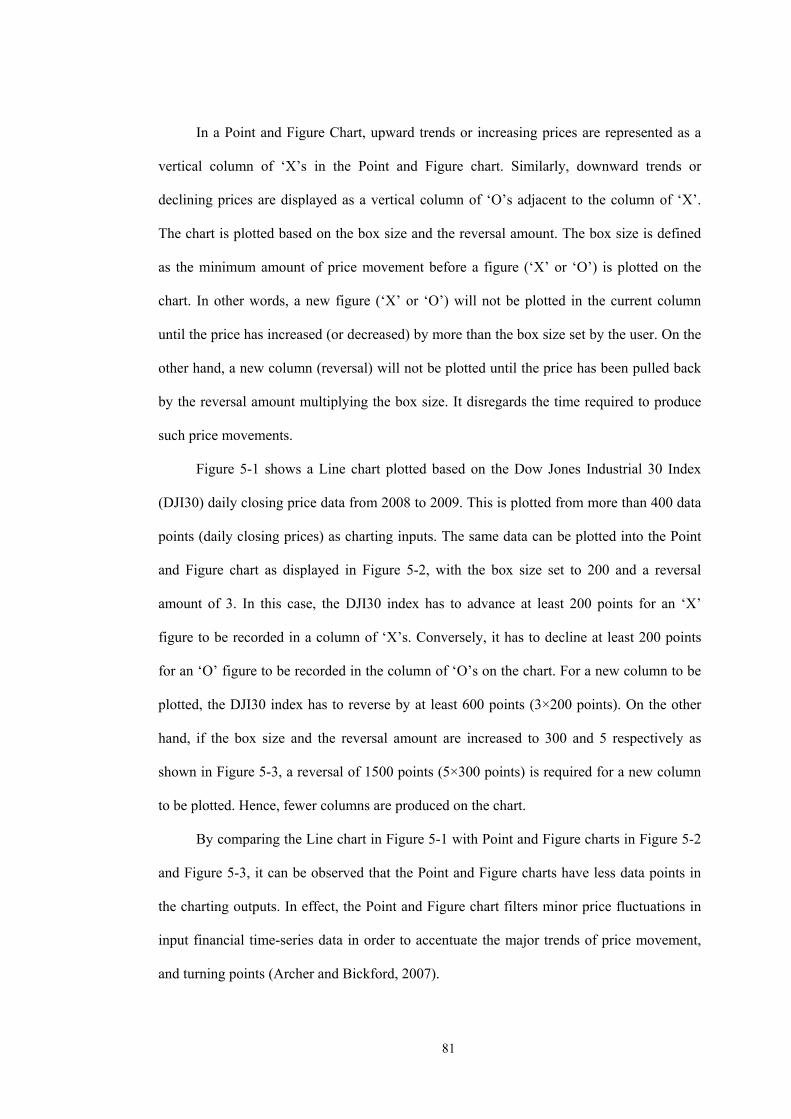
81
In a Point and Figure Chart, upward trends or increasing prices are represented as a
vertical column of ‘X’s in the Point and Figure chart. Similarly, downward trends or
declining prices are displayed as a vertical column of ‘O’s adjacent to the column of ‘X’.
The chart is plotted based on the box size and the reversal amount. The box size is defined
as the minimum amount of price movement before a figure (‘X’ or ‘O’) is plotted on the
chart. In other words, a new figure (‘X’ or ‘O’) will not be plotted in the current column
until the price has increased (or decreased) by more than the box size set by the user. On the
other hand, a new column (reversal) will not be plotted until the price has been pulled back
by the reversal amount multiplying the box size. It disregards the time required to produce
such price movements.
Figure 5-1 shows a Line chart plotted based on the Dow Jones Industrial 30 Index
(DJI30) daily closing price data from 2008 to 2009. This is plotted from more than 400 data
points (daily closing prices) as charting inputs. The same data can be plotted into the Point
and Figure chart as displayed in Figure 5-2, with the box size set to 200 and a reversal
amount of 3. In this case, the DJI30 index has to advance at least 200 points for an ‘X’
figure to be recorded in a column of ‘X’s. Conversely, it has to decline at least 200 points
for an ‘O’ figure to be recorded in the column of ‘O’s on the chart. For a new column to be
plotted, the DJI30 index has to reverse by at least 600 points (3×200 points). On the other
hand, if the box size and the reversal amount are increased to 300 and 5 respectively as
shown in Figure 5-3, a reversal of 1500 points (5×300 points) is required for a new column
to be plotted. Hence, fewer columns are produced on the chart.
By comparing the Line chart in Figure 5-1 with Point and Figure charts in Figure 5-2
and Figure 5-3, it can be observed that the Point and Figure charts have less data points in
the charting outputs. In effect, the Point and Figure chart filters minor price fluctuations in
input financial time-series data in order to accentuate the major trends of price movement,
and turning points (Archer and Bickford, 2007).
82
Figure 5-1 Line chart of daily closing price data of Dow Jones Industry 30 Index from 2008 to 2009
Figure 5-2 Point and Figure chart of Dow Jones Industry 30 Index from 2008 to 2009, with box size = 200
and reversal amount = 3
Figure 5-3 Point and Figure chart of Dow Jones Industry 30 Index from 2008 to 2009, with box size = 300
and reversal amount = 5
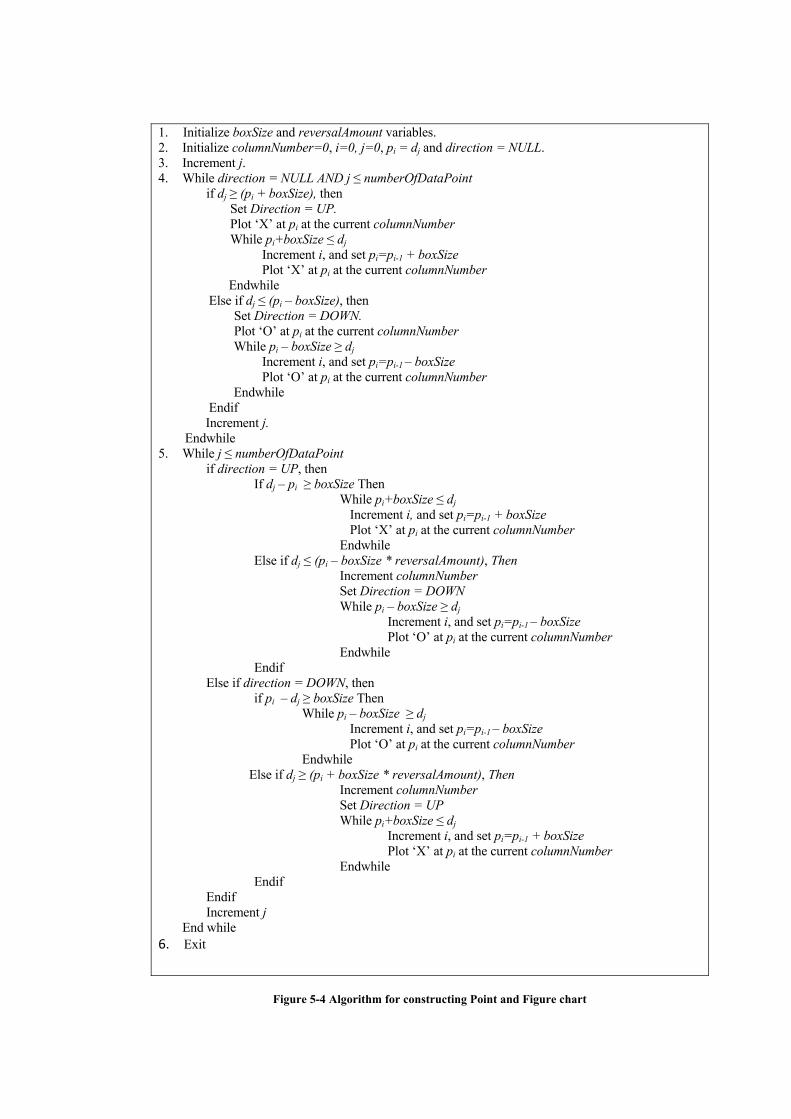
1. Initialize boxSize and reversalAmount variables. 2. Initialize columnNumber=0, i=0, j=0, pi = dj and direction = NULL. 3. Increment j. 4. While direction = NULL AND j ≤ numberOfDataPoint
if dj ≥ (pi + boxSize), then Set Direction = UP. Plot ‘X’ at pi at the current columnNumber While pi+boxSize ≤ dj
Increment i, and set pi=pi-1 + boxSize Plot ‘X’ at pi at the current columnNumber
Endwhile Else if dj ≤ (pi – boxSize), then
Set Direction = DOWN. Plot ‘O’ at pi at the current columnNumber While pi – boxSize ≥ dj
Increment i, and set pi=pi-1 – boxSize Plot ‘O’ at pi at the current columnNumber
Endwhile Endif Increment j.
Endwhile 5. While j ≤ numberOfDataPoint
if direction = UP, then If dj – pi ≥ boxSize Then
While pi+boxSize ≤ dj Increment i, and set pi=pi-1 + boxSize Plot ‘X’ at pi at the current columnNumber
Endwhile Else if dj ≤ (pi – boxSize * reversalAmount), Then
Increment columnNumber Set Direction = DOWN While pi – boxSize ≥ dj
Increment i, and set pi=pi-1 – boxSize Plot ‘O’ at pi at the current columnNumber
Endwhile Endif
Else if direction = DOWN, then if pi – dj ≥ boxSize Then
While pi – boxSize ≥ dj Increment i, and set pi=pi-1 – boxSize Plot ‘O’ at pi at the current columnNumber
Endwhile Else if dj ≥ (pi + boxSize * reversalAmount), Then
Increment columnNumber Set Direction = UP While pi+boxSize ≤ dj
Increment i, and set pi=pi-1 + boxSize Plot ‘X’ at pi at the current columnNumber
Endwhile Endif
Endif Increment j
End while 6. Exit
Figure 5-4 Algorithm for constructing Point and Figure chart
The technique for constructing Point and Figure charts has remained substantially
unchanged since the methodology was first illustrated by De Villiers (1933). To define the
algorithm required to plot a Point and Figure chart, let array pi denote the price value for
figure-i (‘X’ or ‘O’) plotted on the chart where i=0, 1, 2…, and dj denote the data point j of
the financial time-series data input where j = 0, 1, 2…. The algorithm for constructing the
Point and Figure chart is outlined in Figure 5-4.
The algorithm in Figure 5-4 is adapted from the Point and Figure chart reversal
algorithm as proposed by Archer and Bickford (2007) with additional sub-steps for plotting
‘X’s and ‘O’s on the Point and Figure chart. It is worth noting that there exist other variants
of algorithms to construct a Point and Figure chart. However, this study will be based on the
algorithm outlined in Figure 5-4, which is used in the commercially available test target
developed by Nextwave Software.
5.2 Testing Technique
The testing technique proposed in this section combines cost-effective metamorphic
testing and assertion checking with the aims to detect failures in Point and Figure chart.
Metamorphic testing can be applied without the source code of the software under test,
while the assertion checking requires assertion conditions to be inserted into the source
code, but the conditions are not generated based on the program codes. Therefore, the
testing technique proposed here is a black-box testing approach (Beizer, 1995) that is, by
definition, independent of the source-code of the software under test. Upon detection of
failure in the chart, then the source code will be examined for debugging.
5.2.1 DevelopingCost‐effectiveMetamorphicTestingTechnique
The metamorphic testing technique developed in this section adopts three of the six
cost saving strategies proposed in Chapter 3 (Section 3.3) to improve its cost-effectiveness.
These cost saving strategies for metamorphic testing are:

85
i. Cost Saving Strategy III: Reuse or Partly Reuse Source Test Case as Follow up
Test Case
ii. Cost Saving Strategy IV: Reuse The Output of Source Test Case as Follow up
Test Case
iii. Cost Saving Strategy VI: Partial Checking of Test Outputs
These cost saving strategies are adopted primarily in designing the metamorphic
relation and the output checker.
The preliminary step in metamorphic testing is to identify and design metamorphic
relations. By adopting the Cost Saving Strategy III and IV, seven metamorphic relations,
MR1 to MR7, are proposed to test the Point and Figure charting software component in this
study.
Let f be the function that represents the Point and Figure charting software
component. Let Ts and Tf denote the source test case and follow up test case, respectively,
for each metamorphic relation. Furthermore, let f(Ts) and f(Tf) be the outputs produced by
the software under test for Ts and Tf respectively. In line with the notations used in Figure
5-4, dj denotes the data point j of the financial time-series data input (j = 0, 1, 2…).
The seven metamorphic relations and the method for generating follow up test cases
from the metamorphic relations are outlined below:
1. Metamorphic Relation 1 (MR1)
This metamorphic relation is designed based on Cost Saving Strategy IV, which is
reusing the output of source test case as follow up test case. By reusing the output of
source test case as follow up test case, the cost of generating follow up test cases can be
eliminated.
Let Ts be the financial time-series data used as the source test case, execute the software
to obtain its output, f(Ts). Let Tf equal to f(Ts). If the software is executed again with Tf
using the same box size and reversal amount to obtain the output f(Tf), then f(Tf) must be
equal to f(Ts). This metamorphic relation is derived from the invariant property f(Ts)=f
86
n(Ts), where n>1, for the Point and Figure chart. In other words, if the output of a Point
and Figure chart is applied as the input to the Point and Figure chart again as follow up
test case, then the resulting output must be identical to the output of the source test case.
Therefore, MR1 is defined as:
MR1: If Tf= f(Ts), then f(Tf)= f(Ts)
For MR1, generation of follow up test case is not required because the output f(Ts) of
source test case can be reused directly as the follow up test case, Tf. Note that both Ts
and Tf have the same box size and reversal amount.
2. Metamorphic Relation 2 (MR2)
This metamorphic relation is designed based on Cost Saving Strategy III, which is
reusing or partly reusing source test case as follow up test case. By doing this, the cost
of generating follow up test cases can be reduced.
Let Ts =(d0, d1, . . . , dk) be the financial time-series data used as the source test case,
where dj+1 > dj for all 0 ≤ j ≤ k-1. If the follow up test case is generated by inserting a
random value between every pair of adjacent data points in the source test case, such
that the random value is between the data points before and after it, then the output of
the follow up test case must be identical to the output of the source test case. This
metamorphic relation is identified based on the algorithm to plot a new figure (‘X’ or
‘O’) where no new figure will be plotted if the price has not advanced or declined by
more than the box size. In short, MR2 can be defined as:
MR2: if Ts=(d0, d1, . . . , dk), Tf=(d0, d(0,1), d1, . . ., dk-1, d(k-1,k), dk) where k ≥ 1 | dj < d(j, j+1)
< dj+1, 0 ≤ j ≤ k-1, then f(Tf)=f(Ts).
To generate the follow up test case for this metamorphic relation, simply reuse the
source test case and insert a random value between every pair of adjacent data points in
the source test case, such that the random value is between the data points before and
after it. Note that both Ts and Tf have the same box size and reversal amount.

87
3. Metamorphic Relation 3 (MR3)
This metamorphic relation is designed based on Cost Saving Strategy III, which is
reusing or partly reusing source test case as follow up test case. By doing this, the cost
of generating follow up test cases can be reduced.
The same box size and reversal amount are used for both the source test case and follow
up test case. If the follow up test case is generated by deleting one data point that has a
value between the data point before and after it, then the output of the follow up test
case must be the same as the output of the source test case. Similar to MR2, this
metamorphic relation is also identified based on the algorithm to plot a new figure (‘X’
or ‘O’) where no new figure will be plotted if the price has not advanced or declined by
more than the box size. In short, MR3 can be defined as:
MR3: if Ts(d0, . . ., dj, . . . , dk), Tf(d0, . . ., dj-1, d(j+1) , . . ., dk) where k ≥ 1 | dj-1 < dj < dj+1,
1 ≤ j ≤ k-1, then f(Tf)=f(Ts).
To generate the follow up test case for this metamorphic relation, simply reuse the
source test case and delete a data point from the source test case if the data point has a
value between the data point before and after it. Note that both Ts and Tf have the same
box size and reversal amount.
4. Metamorphic Relation 4 (MR4)
This metamorphic relation is designed based on Cost Saving Strategy III, which is
reusing or partly reusing source test case as follow up test case. By doing this, the cost
of generating follow up test cases can be reduced.
If the source test case is reused as the follow up test case and the reversal amount is
incremented by one, then the output of the follow up test case must have a smaller or the
same number of columns as the output of the source test case. MR4 is defined as:
MR4: if Tf=Ts, reversalAmountTs=a, reversalAmountTf=a+1, where a>0, then
columnNumberf(Ts) ≥ columnNumberf(Tf).

88
For MR4, generation of follow up test case is not required because the source test case,
Ts, can be reused directly as the follow up test case, Tf. Then, add one to the reversal
amount of the follow up test case.
5. Metamorphic Relation 5 (MR5)
This metamorphic relation is designed based on Cost Saving Strategy III, which is
reusing or partly reusing source test case as follow up test case. By doing this, the cost
of generating follow up test cases can be reduced.
If the source test case is reused as the follow up test case and the reversal amount is
decremented by one, then the output of the follow up test case must have more or the
same number of columns as the output of the source test case. MR5 is defined as:
MR5: if Tf=Ts, reversalAmountTs=a, reversalAmountTf=a-1, where a>1, then
columnNumberf(Tf) ≥columnNumberf(Ts).
For MR5, generation of follow up test case is not required because the source test case,
Ts, can be reused directly as the follow up test case, Tf. Then, minus one from the
reversal amount of the follow up test case.
6. Metamorphic Relation 6 (MR6)
This metamorphic relation is designed based on Cost Saving Strategy III, which is
reusing or partly reusing source test case as follow up test case. By doing this, the cost
of generating follow up test cases can be reduced.
If the source test case is reused as the follow up test case but the box size is reduced by
half, then the output of the follow up test case must have more or the same number of
columns as the output of the source test case. MR6 is defined as below:
MR6: if Tf=Ts, boxsizeTs = b, boxsizeTf = 0.5b, b>0, then columnNumberf(Tf) ≥
columnNumberf(Ts).
For MR6, generation of follow up test case is not required because the source test case,
Ts, can be reused directly as the follow up test case, Tf. Then, set the box size of the
follow up test case to be half of the box size of the source test case.
89
7. Metamorphic Relation 7 (MR7)
This metamorphic relation is designed based on Cost Saving Strategy III, which is
reusing or partly reusing source test case as follow up test case. By doing this, the cost
of generating follow up test cases can be reduced.
If the source test case is reused as the follow up test case but the box size is doubled,
then the output of the follow up test case must have a smaller or equal number of
columns as the output of the source test case. MR7 is defined as below:
MR7: if Tf=Ts, boxsizeTs = b, boxsizeTf = 2b, b>0, then columnNumberf(Ts)
≥columnNumberf(Tf).
For MR7, generation of follow up test case is not required because the source test case,
Ts, can be reused directly as the follow up test case, Tf. Then, set the box size of the
follow up test case to be double the box size of the source test case.
The seven metamorphic relations defined above serve two purposes in metamorphic
testing. Firstly, the follow up test cases can be obtained or generated from the definition of
each metamorphic relation. Secondly, they serve as the references for output verifications in
the metamorphic testing procedure. These metamorphic relations are designed specifically
to detect failures in the Point and Figure chart that cause any violation to the metamorphic
relations defined. It is worth noting that there could be other metamorphic relations that can
be used to test Point and Figure chart as the seven metamorphic relations proposed above
are not exhaustive.
After injecting the source test case and follow up test case into the charting
component as test inputs, the respective outputs, which are in the form of Point and Figure
charts need to be checked for possible violation of metamorphic relations. Here, Cost
Saving Strategy VI, which is partial checking of test outputs is adopted to further improve
the cost-effectiveness of the metamorphic testing technique proposed. Instead of checking
the entire graphical output of the chart pixel-by-pixel, the data labels of the figures (‘X’ or
‘O’) to be plotted on the Point and Figure chart will be extracted from the charting
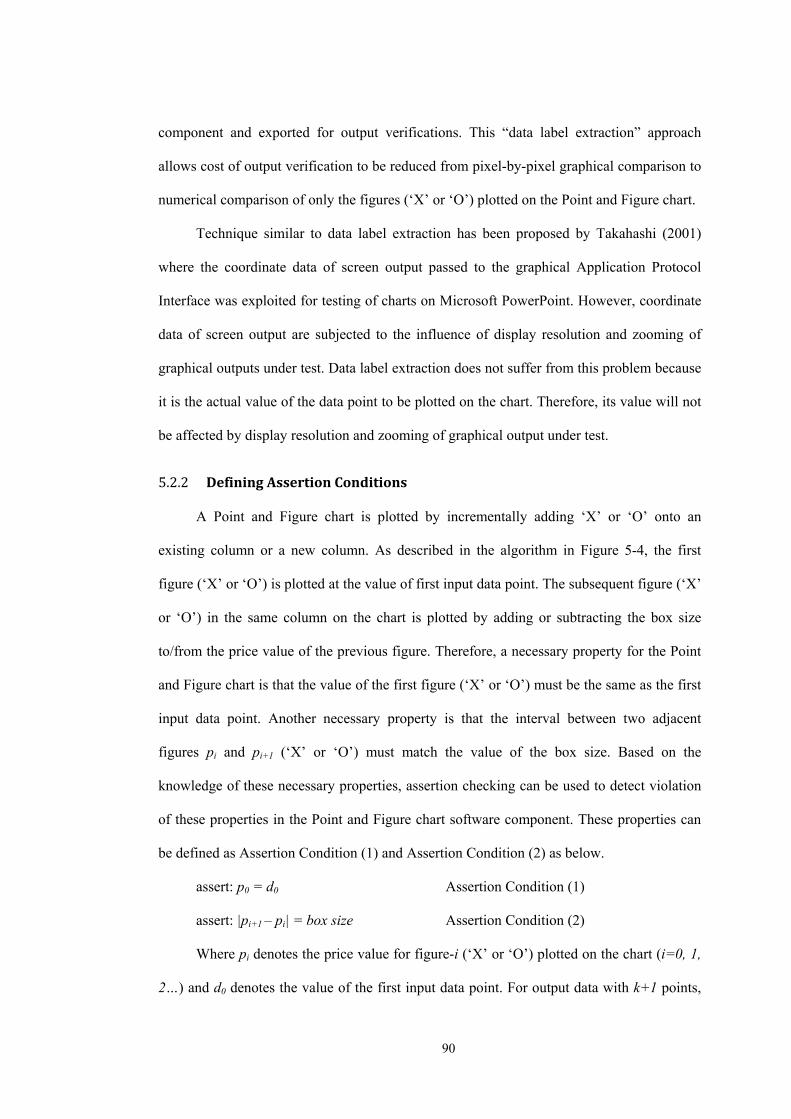
90
component and exported for output verifications. This “data label extraction” approach
allows cost of output verification to be reduced from pixel-by-pixel graphical comparison to
numerical comparison of only the figures (‘X’ or ‘O’) plotted on the Point and Figure chart.
Technique similar to data label extraction has been proposed by Takahashi (2001)
where the coordinate data of screen output passed to the graphical Application Protocol
Interface was exploited for testing of charts on Microsoft PowerPoint. However, coordinate
data of screen output are subjected to the influence of display resolution and zooming of
graphical outputs under test. Data label extraction does not suffer from this problem because
it is the actual value of the data point to be plotted on the chart. Therefore, its value will not
be affected by display resolution and zooming of graphical output under test.
5.2.2 DefiningAssertionConditions
A Point and Figure chart is plotted by incrementally adding ‘X’ or ‘O’ onto an
existing column or a new column. As described in the algorithm in Figure 5-4, the first
figure (‘X’ or ‘O’) is plotted at the value of first input data point. The subsequent figure (‘X’
or ‘O’) in the same column on the chart is plotted by adding or subtracting the box size
to/from the price value of the previous figure. Therefore, a necessary property for the Point
and Figure chart is that the value of the first figure (‘X’ or ‘O’) must be the same as the first
input data point. Another necessary property is that the interval between two adjacent
figures pi and pi+1 (‘X’ or ‘O’) must match the value of the box size. Based on the
knowledge of these necessary properties, assertion checking can be used to detect violation
of these properties in the Point and Figure chart software component. These properties can
be defined as Assertion Condition (1) and Assertion Condition (2) as below.
assert: p0 = d0 Assertion Condition (1)
assert: |pi+1 – pi| = box size Assertion Condition (2)
Where pi denotes the price value for figure-i (‘X’ or ‘O’) plotted on the chart (i=0, 1,
2…) and d0 denotes the value of the first input data point. For output data with k+1 points,
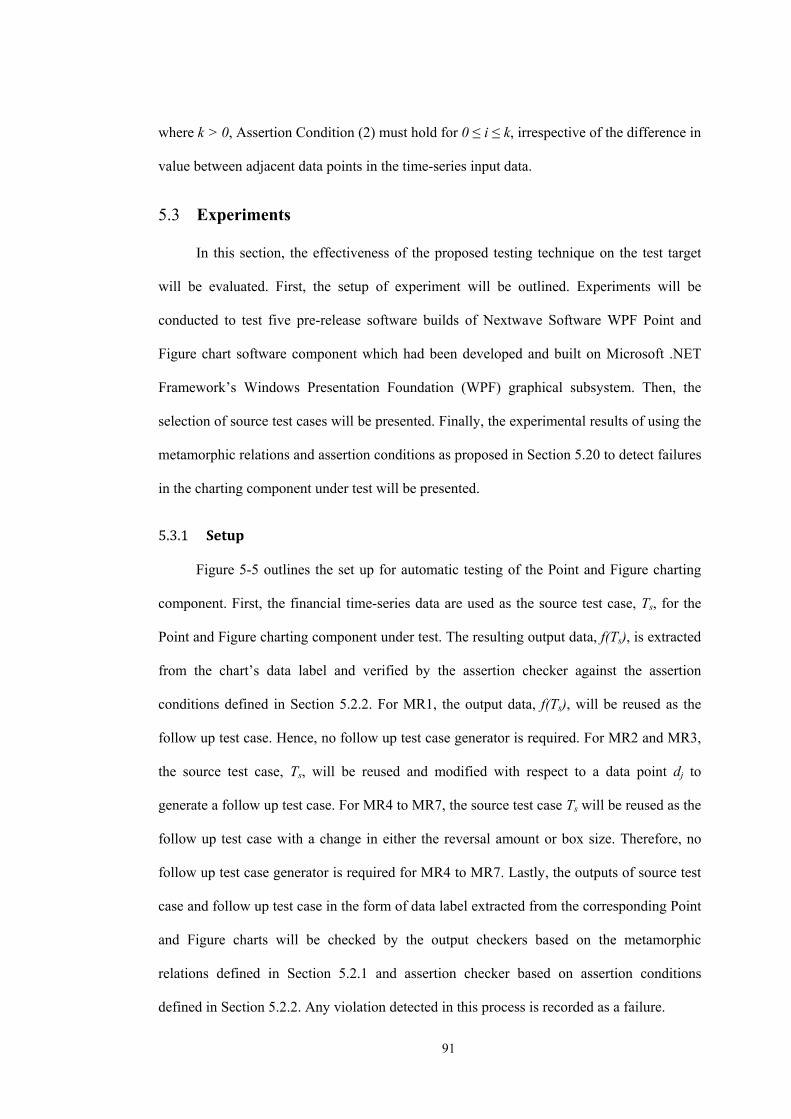
91
where k > 0, Assertion Condition (2) must hold for 0 ≤ i ≤ k, irrespective of the difference in
value between adjacent data points in the time-series input data.
5.3 Experiments
In this section, the effectiveness of the proposed testing technique on the test target
will be evaluated. First, the setup of experiment will be outlined. Experiments will be
conducted to test five pre-release software builds of Nextwave Software WPF Point and
Figure chart software component which had been developed and built on Microsoft .NET
Framework’s Windows Presentation Foundation (WPF) graphical subsystem. Then, the
selection of source test cases will be presented. Finally, the experimental results of using the
metamorphic relations and assertion conditions as proposed in Section 5.20 to detect failures
in the charting component under test will be presented.
5.3.1 Setup
Figure 5-5 outlines the set up for automatic testing of the Point and Figure charting
component. First, the financial time-series data are used as the source test case, Ts, for the
Point and Figure charting component under test. The resulting output data, f(Ts), is extracted
from the chart’s data label and verified by the assertion checker against the assertion
conditions defined in Section 5.2.2. For MR1, the output data, f(Ts), will be reused as the
follow up test case. Hence, no follow up test case generator is required. For MR2 and MR3,
the source test case, Ts, will be reused and modified with respect to a data point dj to
generate a follow up test case. For MR4 to MR7, the source test case Ts will be reused as the
follow up test case with a change in either the reversal amount or box size. Therefore, no
follow up test case generator is required for MR4 to MR7. Lastly, the outputs of source test
case and follow up test case in the form of data label extracted from the corresponding Point
and Figure charts will be checked by the output checkers based on the metamorphic
relations defined in Section 5.2.1 and assertion checker based on assertion conditions
defined in Section 5.2.2. Any violation detected in this process is recorded as a failure.
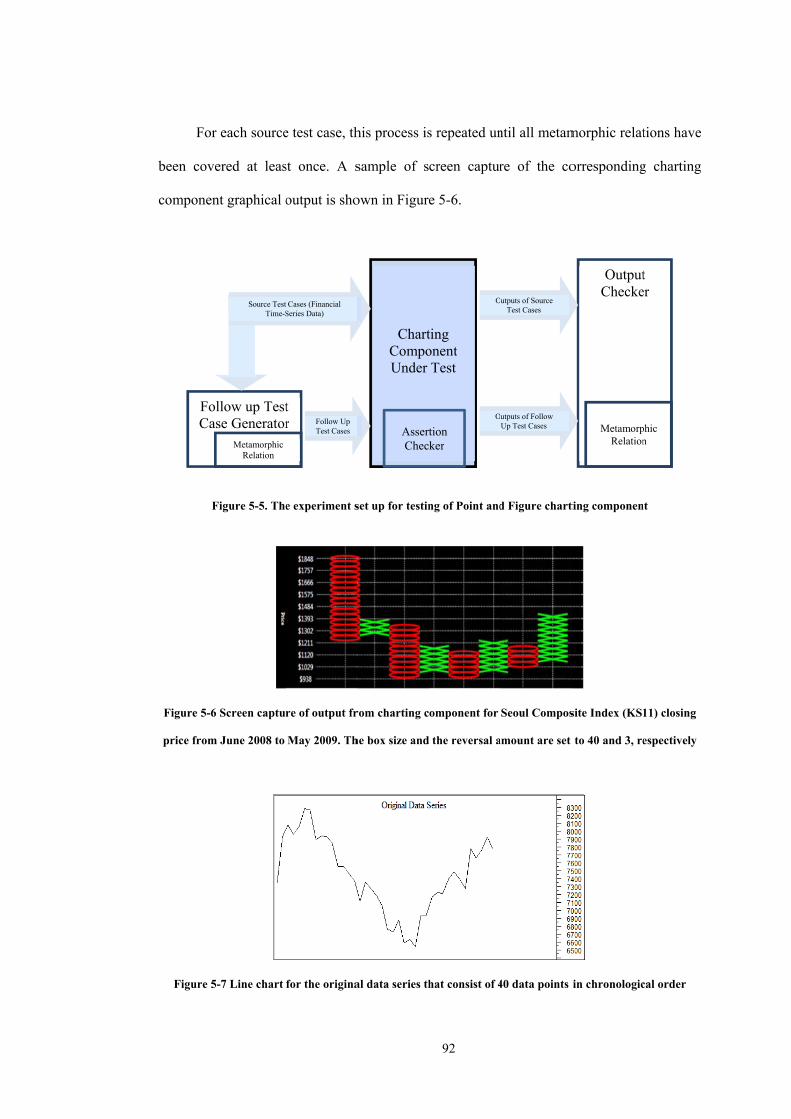
For
been cov
componen
F
Figure 5-6
price from
Figure 5
FoCa
r each source
ered at leas
nt graphical o
Figure 5-5. The
6 Screen captur
m June 2008 to
5-7 Line chart
ollow up Testase Generator
Metamorphic Relation
Source TestTime-S
e test case, th
st once. A s
output is sho
e experiment s
re of output fr
May 2009. Th
for the origina
t r Follow Up
Test Cases
Cases (Financial Series Data)
his process is
sample of s
own in Figur
set up for testin
rom charting c
he box size and
al data series th
ChartCompoUnder
AssertChec
92
s repeated un
creen captur
e 5-6.
ng of Point and
omponent for
the reversal a
hat consist of 4
ting onent Test
O
O
tion ker
ntil all metam
re of the co
d Figure chart
Seoul Compos
amount are set
40 data points
utputs of Follow Up Test Cases
utputs of Source Test Cases
morphic relat
orresponding
ting componen
site Index (KS1
to 40 and 3, re
in chronologic
OutputChecke
MetamorpRelation
tions have
g charting
nt
11) closing
espectively
cal order
t er
phic n
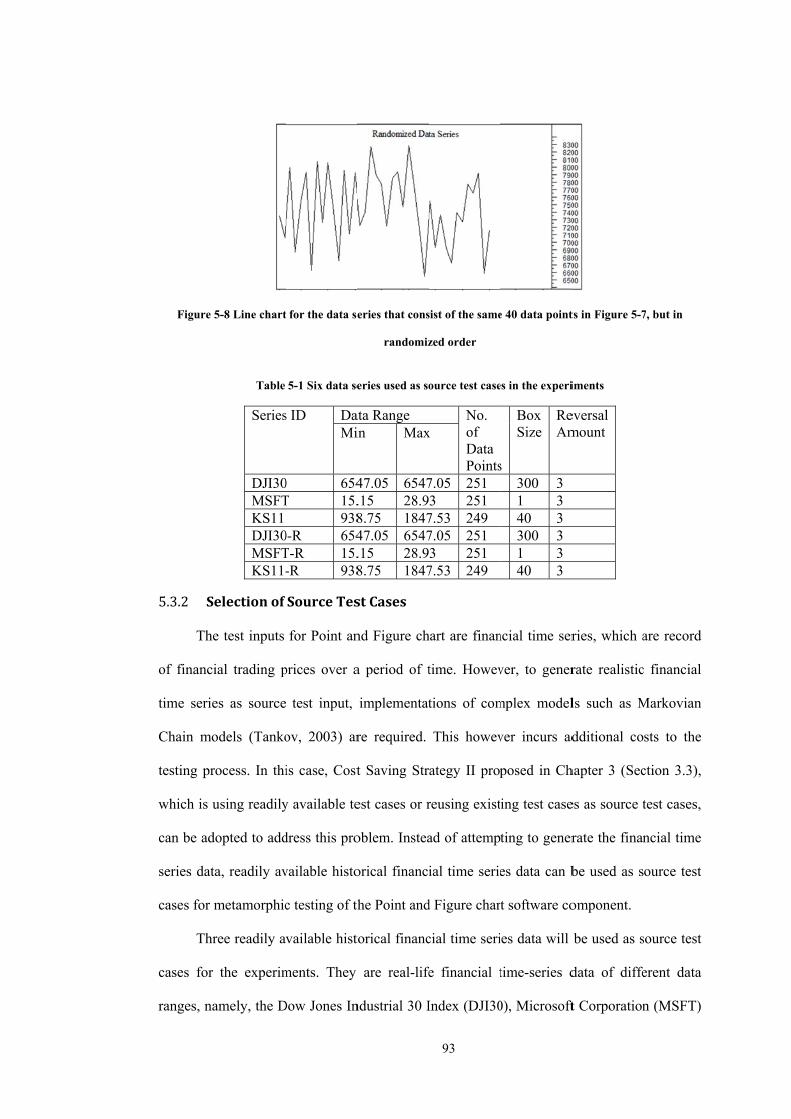
Figure 5
5.3.2 Se
The
of financi
time serie
Chain mo
testing pr
which is u
can be ad
series dat
cases for m
Thr
cases for
ranges, na
5-8 Line chart
Table
Series
DJI30MSFTKS11 DJI30MSFTKS11-
electionof
e test inputs
ial trading p
es as source
odels (Tanko
rocess. In thi
using readily
dopted to add
a, readily av
metamorphic
ree readily av
the experim
amely, the D
t for the data se
5-1 Six data se
s ID DaMi
0 654T 15.
9380-R 654T-R 15.-R 938
SourceTes
for Point an
prices over a
test input,
ov, 2003) ar
is case, Cost
y available te
dress this pro
vailable histo
c testing of th
vailable hist
ments. They
Dow Jones In
eries that cons
randomiz
eries used as so
ata Range in Max
47.05 6547.15 28.98.75 184747.05 6547.15 28.98.75 1847
stCases
nd Figure ch
a period of t
implementat
re required.
t Saving Str
est cases or r
oblem. Instea
orical financi
he Point and
torical financ
are real-life
ndustrial 30 I
93
sist of the same
zed order
ource test case
No. of Data Points
x
7.05 251 3 251 7.53 249 7.05 251 3 251 7.53 249
hart are finan
time. Howev
tions of com
This howev
ategy II prop
reusing exist
ad of attemp
ial time serie
d Figure char
cial time seri
fe financial t
Index (DJI30
e 40 data point
es in the experi
s
Box Size
ReAm
300 3 1 3 40 3 300 3 1 3 40 3
ncial time ser
ver, to gener
mplex model
ver incurs ad
posed in Ch
ing test case
ting to gener
es data can b
t software co
ies data will
time-series d
0), Microsoft
ts in Figure 5-7
iments
eversal mount
ries, which a
rate realistic
ls such as M
dditional co
hapter 3 (Sec
es as source t
rate the finan
be used as s
omponent.
be used as s
data of diffe
ft Corporation
7, but in
are record
c financial
Markovian
sts to the
ction 3.3),
test cases,
ncial time
ource test
source test
erent data
n (MSFT)
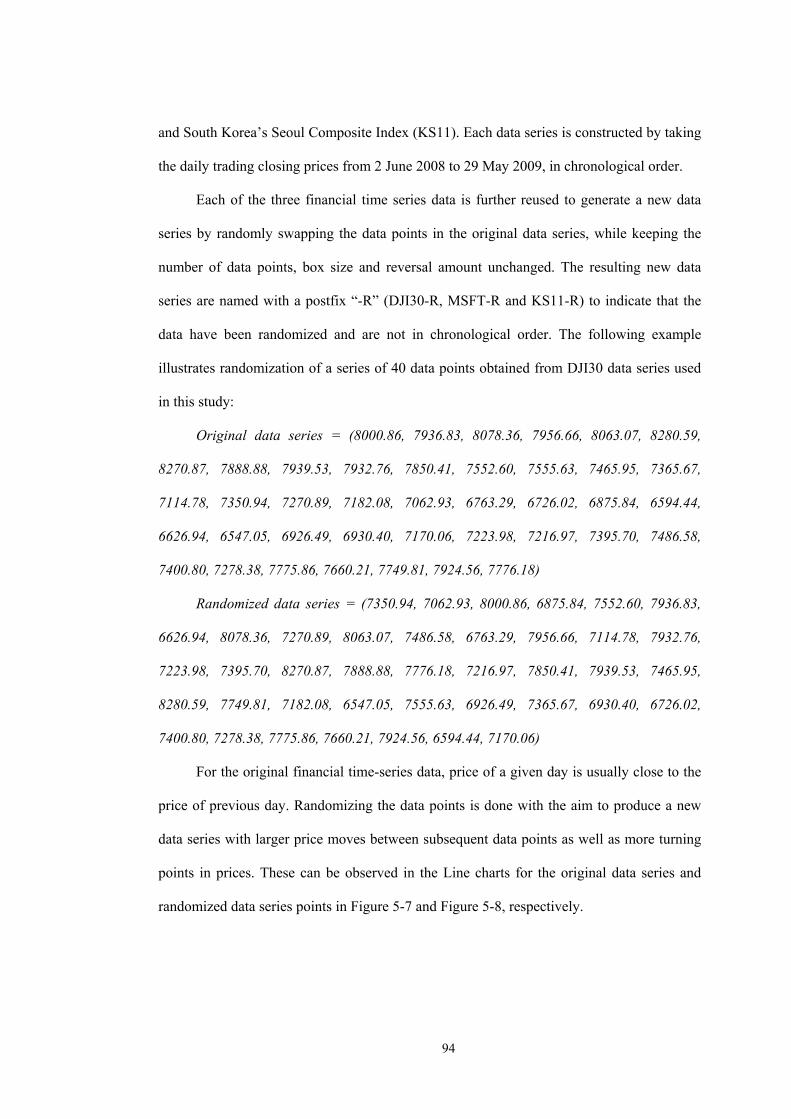
94
and South Korea’s Seoul Composite Index (KS11). Each data series is constructed by taking
the daily trading closing prices from 2 June 2008 to 29 May 2009, in chronological order.
Each of the three financial time series data is further reused to generate a new data
series by randomly swapping the data points in the original data series, while keeping the
number of data points, box size and reversal amount unchanged. The resulting new data
series are named with a postfix “-R” (DJI30-R, MSFT-R and KS11-R) to indicate that the
data have been randomized and are not in chronological order. The following example
illustrates randomization of a series of 40 data points obtained from DJI30 data series used
in this study:
Original data series = (8000.86, 7936.83, 8078.36, 7956.66, 8063.07, 8280.59,
8270.87, 7888.88, 7939.53, 7932.76, 7850.41, 7552.60, 7555.63, 7465.95, 7365.67,
7114.78, 7350.94, 7270.89, 7182.08, 7062.93, 6763.29, 6726.02, 6875.84, 6594.44,
6626.94, 6547.05, 6926.49, 6930.40, 7170.06, 7223.98, 7216.97, 7395.70, 7486.58,
7400.80, 7278.38, 7775.86, 7660.21, 7749.81, 7924.56, 7776.18)
Randomized data series = (7350.94, 7062.93, 8000.86, 6875.84, 7552.60, 7936.83,
6626.94, 8078.36, 7270.89, 8063.07, 7486.58, 6763.29, 7956.66, 7114.78, 7932.76,
7223.98, 7395.70, 8270.87, 7888.88, 7776.18, 7216.97, 7850.41, 7939.53, 7465.95,
8280.59, 7749.81, 7182.08, 6547.05, 7555.63, 6926.49, 7365.67, 6930.40, 6726.02,
7400.80, 7278.38, 7775.86, 7660.21, 7924.56, 6594.44, 7170.06)
For the original financial time-series data, price of a given day is usually close to the
price of previous day. Randomizing the data points is done with the aim to produce a new
data series with larger price moves between subsequent data points as well as more turning
points in prices. These can be observed in the Line charts for the original data series and
randomized data series points in Figure 5-7 and Figure 5-8, respectively.
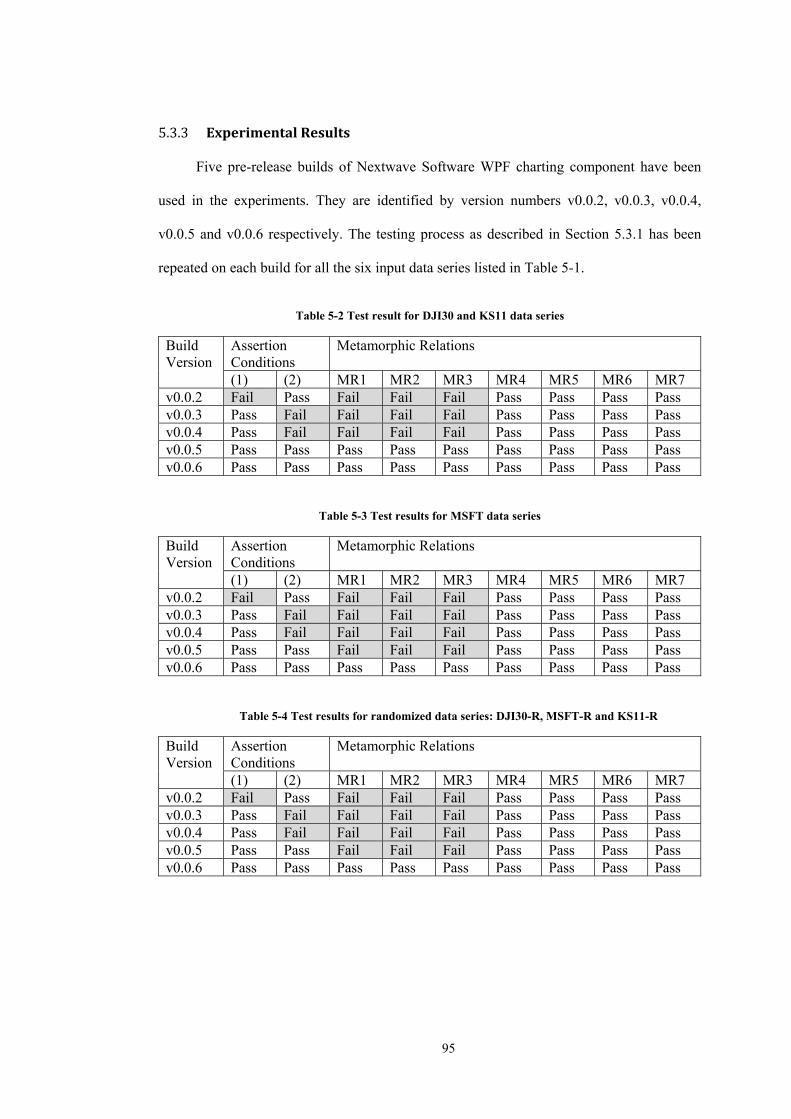
95
5.3.3 ExperimentalResults
Five pre-release builds of Nextwave Software WPF charting component have been
used in the experiments. They are identified by version numbers v0.0.2, v0.0.3, v0.0.4,
v0.0.5 and v0.0.6 respectively. The testing process as described in Section 5.3.1 has been
repeated on each build for all the six input data series listed in Table 5-1.
Table 5-2 Test result for DJI30 and KS11 data series
Build Version
Assertion Conditions
Metamorphic Relations
(1) (2) MR1 MR2 MR3 MR4 MR5 MR6 MR7 v0.0.2 Fail Pass Fail Fail Fail Pass Pass Pass Pass v0.0.3 Pass Fail Fail Fail Fail Pass Pass Pass Pass v0.0.4 Pass Fail Fail Fail Fail Pass Pass Pass Pass v0.0.5 Pass Pass Pass Pass Pass Pass Pass Pass Pass v0.0.6 Pass Pass Pass Pass Pass Pass Pass Pass Pass
Table 5-3 Test results for MSFT data series
Build Version
Assertion Conditions
Metamorphic Relations
(1) (2) MR1 MR2 MR3 MR4 MR5 MR6 MR7 v0.0.2 Fail Pass Fail Fail Fail Pass Pass Pass Pass v0.0.3 Pass Fail Fail Fail Fail Pass Pass Pass Pass v0.0.4 Pass Fail Fail Fail Fail Pass Pass Pass Pass v0.0.5 Pass Pass Fail Fail Fail Pass Pass Pass Pass v0.0.6 Pass Pass Pass Pass Pass Pass Pass Pass Pass
Table 5-4 Test results for randomized data series: DJI30-R, MSFT-R and KS11-R
Build Version
Assertion Conditions
Metamorphic Relations
(1) (2) MR1 MR2 MR3 MR4 MR5 MR6 MR7 v0.0.2 Fail Pass Fail Fail Fail Pass Pass Pass Pass v0.0.3 Pass Fail Fail Fail Fail Pass Pass Pass Pass v0.0.4 Pass Fail Fail Fail Fail Pass Pass Pass Pass v0.0.5 Pass Pass Fail Fail Fail Pass Pass Pass Pass v0.0.6 Pass Pass Pass Pass Pass Pass Pass Pass Pass
As the test results for the DJI30 and the KS11 input data series are identical, they are
combined and presented in Table 5-2. The test results for MSFT are presented separately in
Table 5-3 because three additional violations have been detected by MSFT in build v0.0.5
compared to DJI30 and KS11. Table 5-4 presents the test results for the three randomized
data series (DJI30-R, MSFT-R and KS11-R).
From the results tabulated in Table 5-2, Table 5-3 and Table 5-4, it can be observed
that Build v0.0.2 violates assertion (1), MR1, MR2 and MR3 in the testing process for all
the six time series data sets. Build v0.0.3 contains bug fix for violation of Assertion
Condition (1). However, the testing results show that even though violation of Assertion
Condition (1) is no longer a problem, violation of Assertion Condition (2) has been detected
in addition to MR1, MR2 and MR3. The same observation can be made to Build v0.0.4
which contains bug fix for violation of Assertion Condition (2).
Subsequent version, Build v0.0.5, which contains bug fix for violation of Assertion
Condition (2) passes all assertion checking and metamorphic relation verifications for DJI30
and KS11 data sets. However, violations of MR1, MR2 and MR3 are detected for MSFT
data series. This is an interesting observation because both DJI30 and KS11 data series do
not trigger the violations of MR1, MR2 and MR3 in Build v0.0.5. However, their
randomized counterparts (DJI30-R and KS11-R) have successfully triggered the violations
of MR1, MR2 and MR3 in Build v0.0.5.
This observation suggests that the randomized data series (DJI30-R and KS11-R)
have better failure detection capability than their corresponding original time-series data
(DJI30 and KS11). Further inspection on output data points reveals that, for the same
number of input data points, randomized data series produces more output data points on
Point and Figure chart compared to real-life financial time-series data. More precisely,
randomization results in larger price moves (that is, more figures (‘X’ and ‘O’)) and more
turning point in prices (that is, more reversals to be plotted) on the Point and Figure chart,
which increases the likeliness to trigger violation in assertion conditions and metamorphic
97
relations if faults exist in the chart. Therefore, randomization of real-life financial time-
series data is recommended for more effective failure detection.
Finally, testing on Build v0.0.6 which contains bug fix for violation of MR1, MR2
and MR3 passes all assertion checking and output checking based on the seven
metamorphic relations. Debugging details will be discussed in Section 5.4.
In summary, it can be observed in this experiment that MR4 to MR7 have detected no
failure in any Build v0.0.2 to v0.0.6. MR4 to MR7 are based on the necessary software
properties related to the number of columns on a Point and Figure chart. A new column is
plotted on the Point and Figure chart when price reverses by more than multiplication of two
user-defined variables (that is, reversal amount multiplying the box size). Therefore, more
reversals will create more columns on the chart, and vice versa. The current stage of testing
shows no violation of MR4 to MR7, which suggests that either more different source test
cases are required to detect this kind of failure, or the software contains no failure related to
the reversal properties. On the other hand, Assertion Condition (2) and MR1 to MR3 are
based on the necessary properties related to the box size and the data points in the input data
series, in which violations of these assertion condition and metamorphic relations indicates
that there exist failure(s) relating to the processing of the user-defined variable (box size)
and data points in the input data series. In complement to the above mentioned properties,
Assertion Condition (1) has been shown to be effective in detecting an incorrect plotting of
the first data point on the chart (one of the output variables).
It is important that the list of assertion conditions and metamorphic relations can
cover all the possible input variables and output variables to achieve a more comprehensive
testing. Assertion Conditions (1) and (2) as well as MR1 to MR 7 are only used to
demonstrate the effectiveness of the proposed testing technique in absence of an oracle for
charting software. Ideally, developers should start developing assertion conditions and
metamorphic relations once a software specification is ready, so that they can keep these
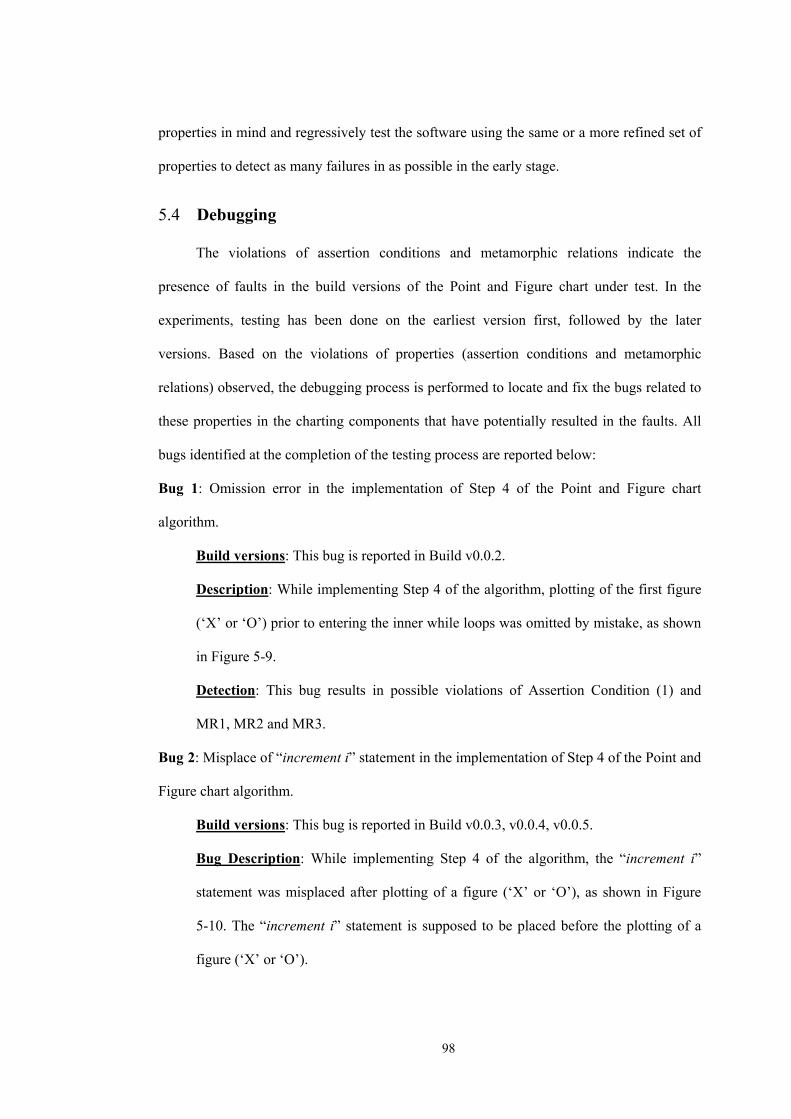
98
properties in mind and regressively test the software using the same or a more refined set of
properties to detect as many failures in as possible in the early stage.
5.4 Debugging
The violations of assertion conditions and metamorphic relations indicate the
presence of faults in the build versions of the Point and Figure chart under test. In the
experiments, testing has been done on the earliest version first, followed by the later
versions. Based on the violations of properties (assertion conditions and metamorphic
relations) observed, the debugging process is performed to locate and fix the bugs related to
these properties in the charting components that have potentially resulted in the faults. All
bugs identified at the completion of the testing process are reported below:
Bug 1: Omission error in the implementation of Step 4 of the Point and Figure chart
algorithm.
Build versions: This bug is reported in Build v0.0.2.
Description: While implementing Step 4 of the algorithm, plotting of the first figure
(‘X’ or ‘O’) prior to entering the inner while loops was omitted by mistake, as shown
in Figure 5-9.
Detection: This bug results in possible violations of Assertion Condition (1) and
MR1, MR2 and MR3.
Bug 2: Misplace of “increment i” statement in the implementation of Step 4 of the Point and
Figure chart algorithm.
Build versions: This bug is reported in Build v0.0.3, v0.0.4, v0.0.5.
Bug Description: While implementing Step 4 of the algorithm, the “increment i”
statement was misplaced after plotting of a figure (‘X’ or ‘O’), as shown in Figure
5-10. The “increment i” statement is supposed to be placed before the plotting of a
figure (‘X’ or ‘O’).
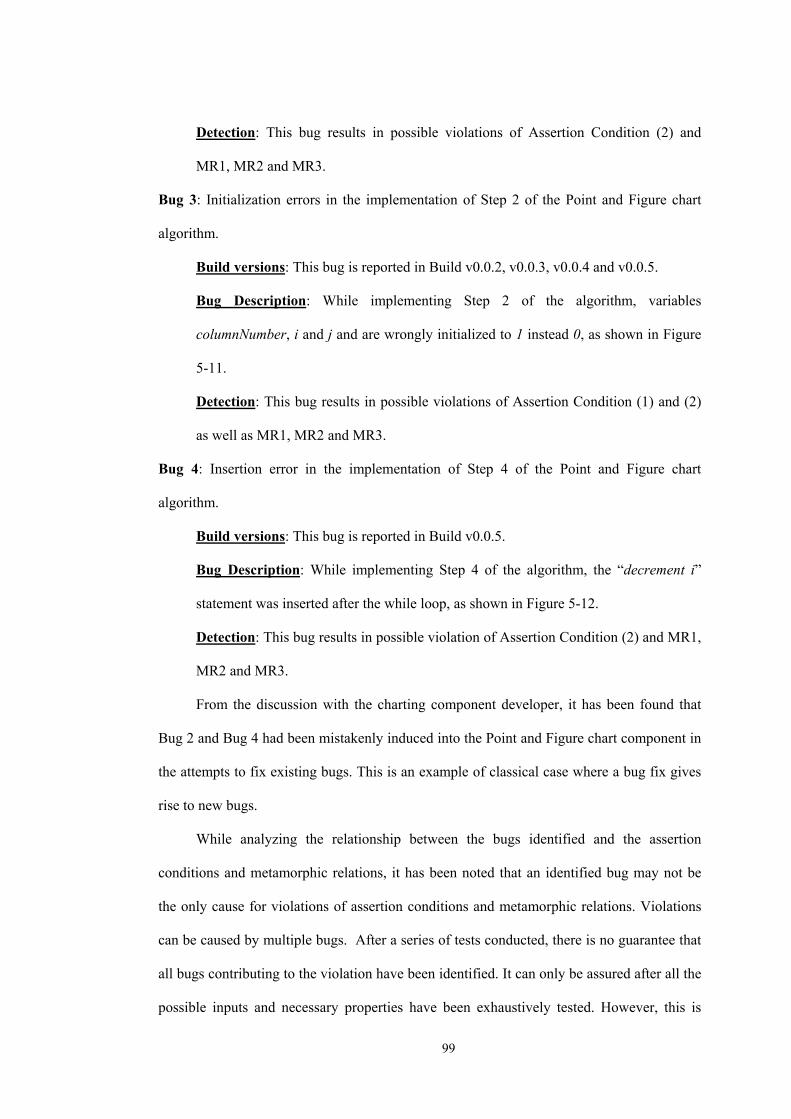
99
Detection: This bug results in possible violations of Assertion Condition (2) and
MR1, MR2 and MR3.
Bug 3: Initialization errors in the implementation of Step 2 of the Point and Figure chart
algorithm.
Build versions: This bug is reported in Build v0.0.2, v0.0.3, v0.0.4 and v0.0.5.
Bug Description: While implementing Step 2 of the algorithm, variables
columnNumber, i and j and are wrongly initialized to 1 instead 0, as shown in Figure
5-11.
Detection: This bug results in possible violations of Assertion Condition (1) and (2)
as well as MR1, MR2 and MR3.
Bug 4: Insertion error in the implementation of Step 4 of the Point and Figure chart
algorithm.
Build versions: This bug is reported in Build v0.0.5.
Bug Description: While implementing Step 4 of the algorithm, the “decrement i”
statement was inserted after the while loop, as shown in Figure 5-12.
Detection: This bug results in possible violation of Assertion Condition (2) and MR1,
MR2 and MR3.
From the discussion with the charting component developer, it has been found that
Bug 2 and Bug 4 had been mistakenly induced into the Point and Figure chart component in
the attempts to fix existing bugs. This is an example of classical case where a bug fix gives
rise to new bugs.
While analyzing the relationship between the bugs identified and the assertion
conditions and metamorphic relations, it has been noted that an identified bug may not be
the only cause for violations of assertion conditions and metamorphic relations. Violations
can be caused by multiple bugs. After a series of tests conducted, there is no guarantee that
all bugs contributing to the violation have been identified. It can only be assured after all the
possible inputs and necessary properties have been exhaustively tested. However, this is
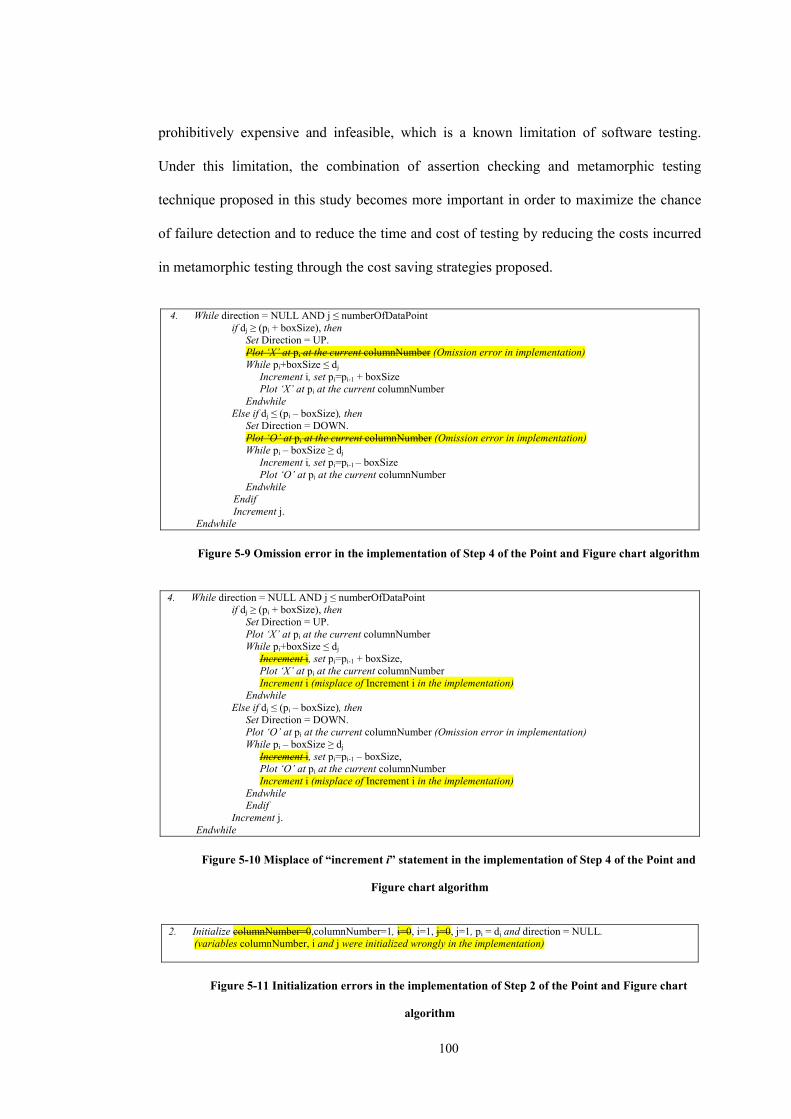
100
prohibitively expensive and infeasible, which is a known limitation of software testing.
Under this limitation, the combination of assertion checking and metamorphic testing
technique proposed in this study becomes more important in order to maximize the chance
of failure detection and to reduce the time and cost of testing by reducing the costs incurred
in metamorphic testing through the cost saving strategies proposed.
4. While direction = NULL AND j ≤ numberOfDataPoint
if dj ≥ (pi + boxSize), then Set Direction = UP. Plot ‘X’ at pi at the current columnNumber (Omission error in implementation) While pi+boxSize ≤ dj
Increment i, set pi=pi-1 + boxSize Plot ‘X’ at pi at the current columnNumber
Endwhile Else if dj ≤ (pi – boxSize), then
Set Direction = DOWN. Plot ‘O’ at pi at the current columnNumber (Omission error in implementation) While pi – boxSize ≥ dj
Increment i, set pi=pi-1 – boxSize Plot ‘O’ at pi at the current columnNumber
Endwhile Endif Increment j.
Endwhile
Figure 5-9 Omission error in the implementation of Step 4 of the Point and Figure chart algorithm
4. While direction = NULL AND j ≤ numberOfDataPoint
if dj ≥ (pi + boxSize), then Set Direction = UP. Plot ‘X’ at pi at the current columnNumber While pi+boxSize ≤ dj
Increment i, set pi=pi-1 + boxSize, Plot ‘X’ at pi at the current columnNumber Increment i (misplace of Increment i in the implementation)
Endwhile Else if dj ≤ (pi – boxSize), then
Set Direction = DOWN. Plot ‘O’ at pi at the current columnNumber (Omission error in implementation) While pi – boxSize ≥ dj
Increment i, set pi=pi-1 – boxSize, Plot ‘O’ at pi at the current columnNumber Increment i (misplace of Increment i in the implementation)
Endwhile Endif
Increment j. Endwhile
Figure 5-10 Misplace of “increment i” statement in the implementation of Step 4 of the Point and
Figure chart algorithm
2. Initialize columnNumber=0,columnNumber=1, i=0, i=1, j=0, j=1, pi = dj and direction = NULL.
(variables columnNumber, i and j were initialized wrongly in the implementation)
Figure 5-11 Initialization errors in the implementation of Step 2 of the Point and Figure chart
algorithm
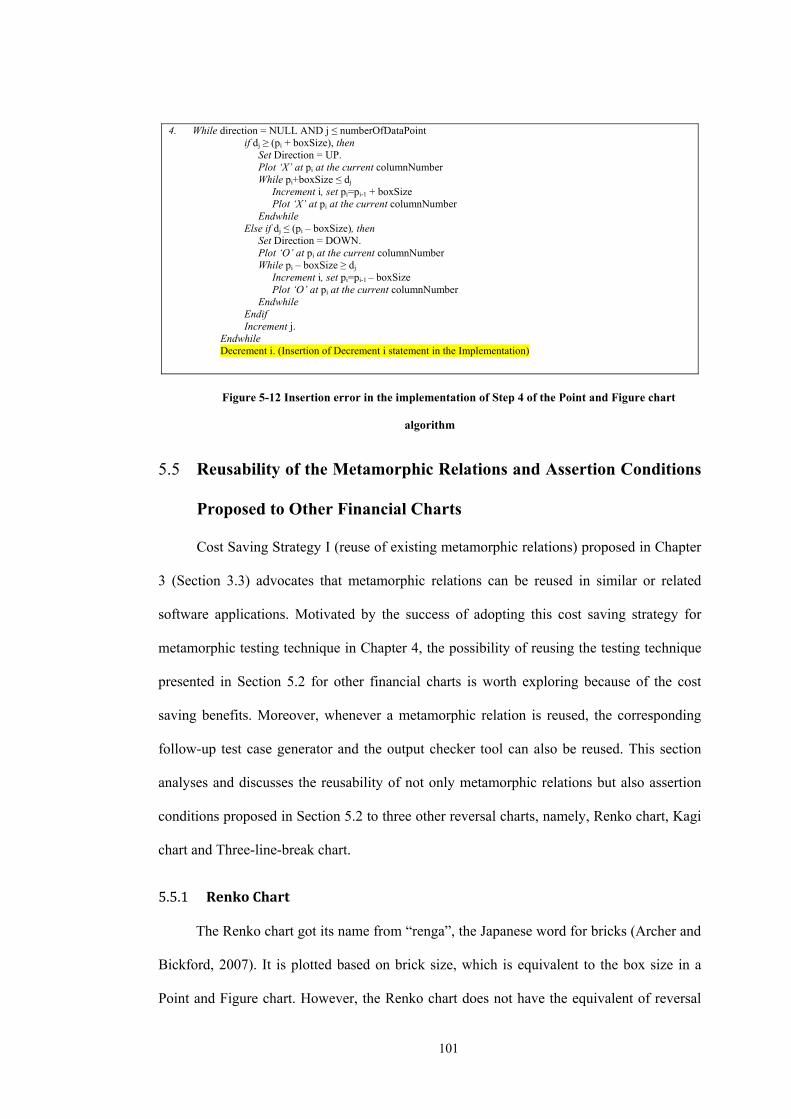
101
4. While direction = NULL AND j ≤ numberOfDataPoint if dj ≥ (pi + boxSize), then
Set Direction = UP. Plot ‘X’ at pi at the current columnNumber While pi+boxSize ≤ dj
Increment i, set pi=pi-1 + boxSize Plot ‘X’ at pi at the current columnNumber
Endwhile Else if dj ≤ (pi – boxSize), then
Set Direction = DOWN. Plot ‘O’ at pi at the current columnNumber While pi – boxSize ≥ dj
Increment i, set pi=pi-1 – boxSize Plot ‘O’ at pi at the current columnNumber
Endwhile Endif Increment j.
Endwhile Decrement i. (Insertion of Decrement i statement in the Implementation)
Figure 5-12 Insertion error in the implementation of Step 4 of the Point and Figure chart
algorithm
5.5 Reusability of the Metamorphic Relations and Assertion Conditions
Proposed to Other Financial Charts
Cost Saving Strategy I (reuse of existing metamorphic relations) proposed in Chapter
3 (Section 3.3) advocates that metamorphic relations can be reused in similar or related
software applications. Motivated by the success of adopting this cost saving strategy for
metamorphic testing technique in Chapter 4, the possibility of reusing the testing technique
presented in Section 5.2 for other financial charts is worth exploring because of the cost
saving benefits. Moreover, whenever a metamorphic relation is reused, the corresponding
follow-up test case generator and the output checker tool can also be reused. This section
analyses and discusses the reusability of not only metamorphic relations but also assertion
conditions proposed in Section 5.2 to three other reversal charts, namely, Renko chart, Kagi
chart and Three-line-break chart.
5.5.1 RenkoChart
The Renko chart got its name from “renga”, the Japanese word for bricks (Archer and
Bickford, 2007). It is plotted based on brick size, which is equivalent to the box size in a
Point and Figure chart. However, the Renko chart does not have the equivalent of reversal
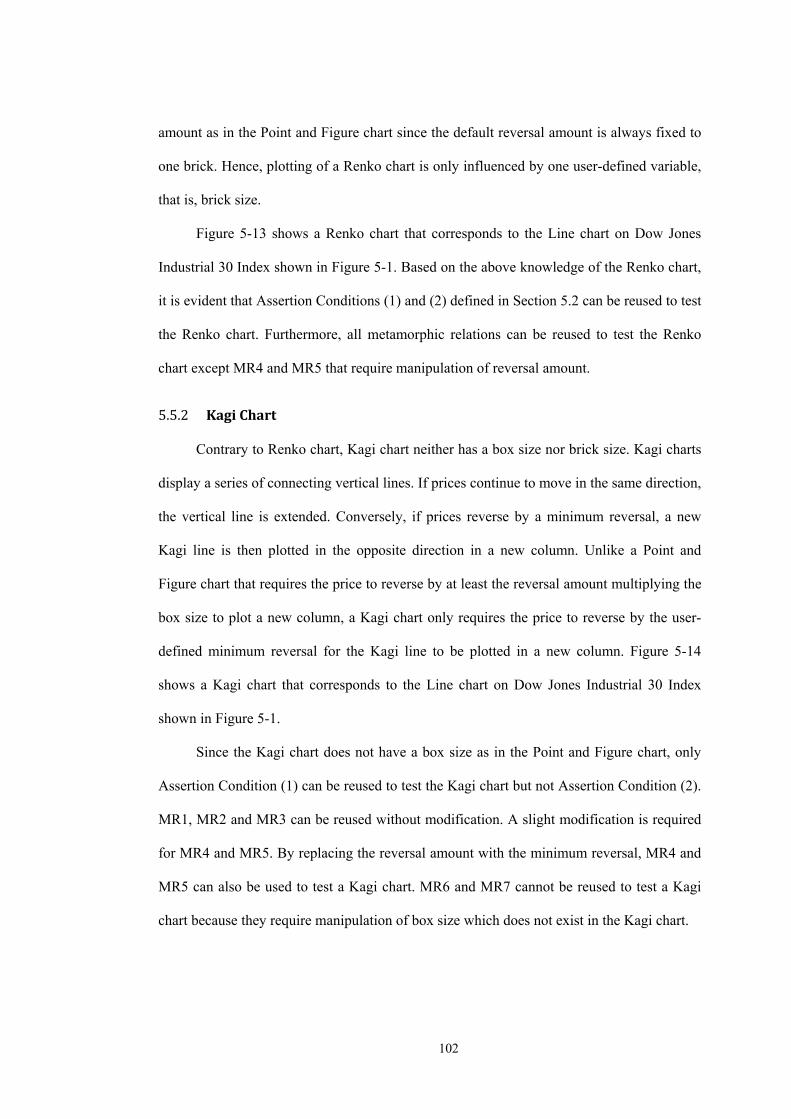
102
amount as in the Point and Figure chart since the default reversal amount is always fixed to
one brick. Hence, plotting of a Renko chart is only influenced by one user-defined variable,
that is, brick size.
Figure 5-13 shows a Renko chart that corresponds to the Line chart on Dow Jones
Industrial 30 Index shown in Figure 5-1. Based on the above knowledge of the Renko chart,
it is evident that Assertion Conditions (1) and (2) defined in Section 5.2 can be reused to test
the Renko chart. Furthermore, all metamorphic relations can be reused to test the Renko
chart except MR4 and MR5 that require manipulation of reversal amount.
5.5.2 KagiChart
Contrary to Renko chart, Kagi chart neither has a box size nor brick size. Kagi charts
display a series of connecting vertical lines. If prices continue to move in the same direction,
the vertical line is extended. Conversely, if prices reverse by a minimum reversal, a new
Kagi line is then plotted in the opposite direction in a new column. Unlike a Point and
Figure chart that requires the price to reverse by at least the reversal amount multiplying the
box size to plot a new column, a Kagi chart only requires the price to reverse by the user-
defined minimum reversal for the Kagi line to be plotted in a new column. Figure 5-14
shows a Kagi chart that corresponds to the Line chart on Dow Jones Industrial 30 Index
shown in Figure 5-1.
Since the Kagi chart does not have a box size as in the Point and Figure chart, only
Assertion Condition (1) can be reused to test the Kagi chart but not Assertion Condition (2).
MR1, MR2 and MR3 can be reused without modification. A slight modification is required
for MR4 and MR5. By replacing the reversal amount with the minimum reversal, MR4 and
MR5 can also be used to test a Kagi chart. MR6 and MR7 cannot be reused to test a Kagi
chart because they require manipulation of box size which does not exist in the Kagi chart.
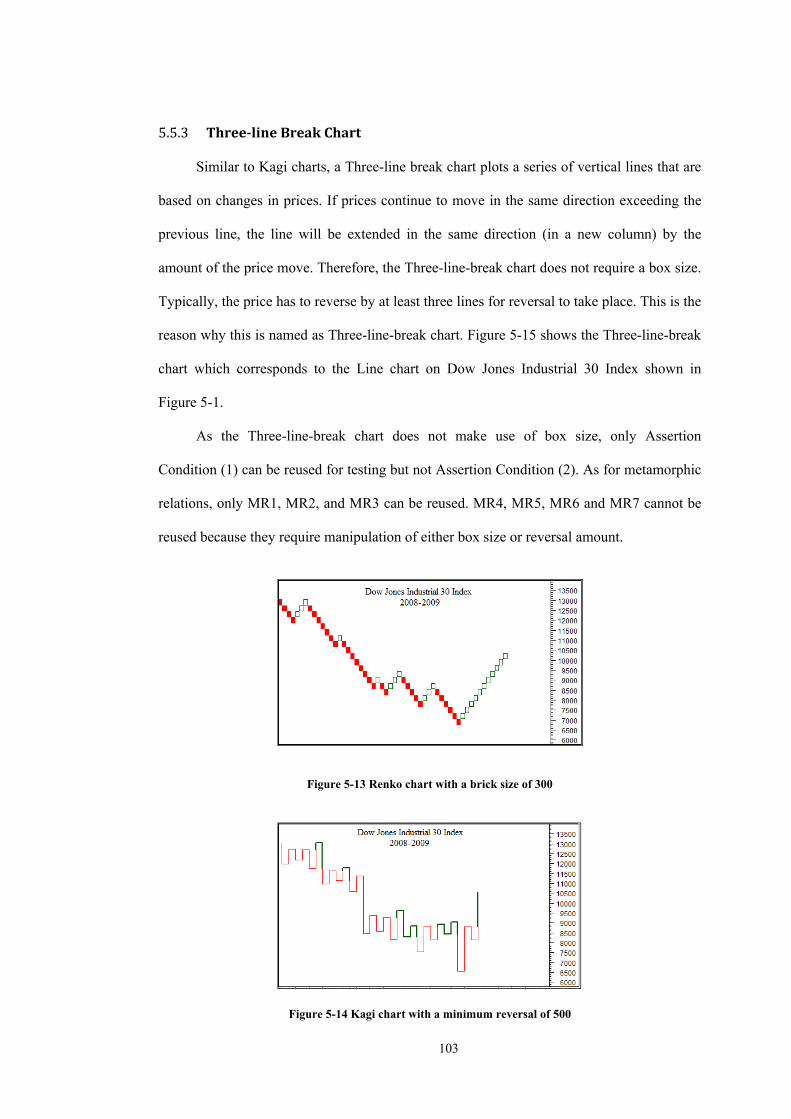
103
5.5.3 Three‐lineBreakChart
Similar to Kagi charts, a Three-line break chart plots a series of vertical lines that are
based on changes in prices. If prices continue to move in the same direction exceeding the
previous line, the line will be extended in the same direction (in a new column) by the
amount of the price move. Therefore, the Three-line-break chart does not require a box size.
Typically, the price has to reverse by at least three lines for reversal to take place. This is the
reason why this is named as Three-line-break chart. Figure 5-15 shows the Three-line-break
chart which corresponds to the Line chart on Dow Jones Industrial 30 Index shown in
Figure 5-1.
As the Three-line-break chart does not make use of box size, only Assertion
Condition (1) can be reused for testing but not Assertion Condition (2). As for metamorphic
relations, only MR1, MR2, and MR3 can be reused. MR4, MR5, MR6 and MR7 cannot be
reused because they require manipulation of either box size or reversal amount.
Figure 5-13 Renko chart with a brick size of 300
Figure 5-14 Kagi chart with a minimum reversal of 500
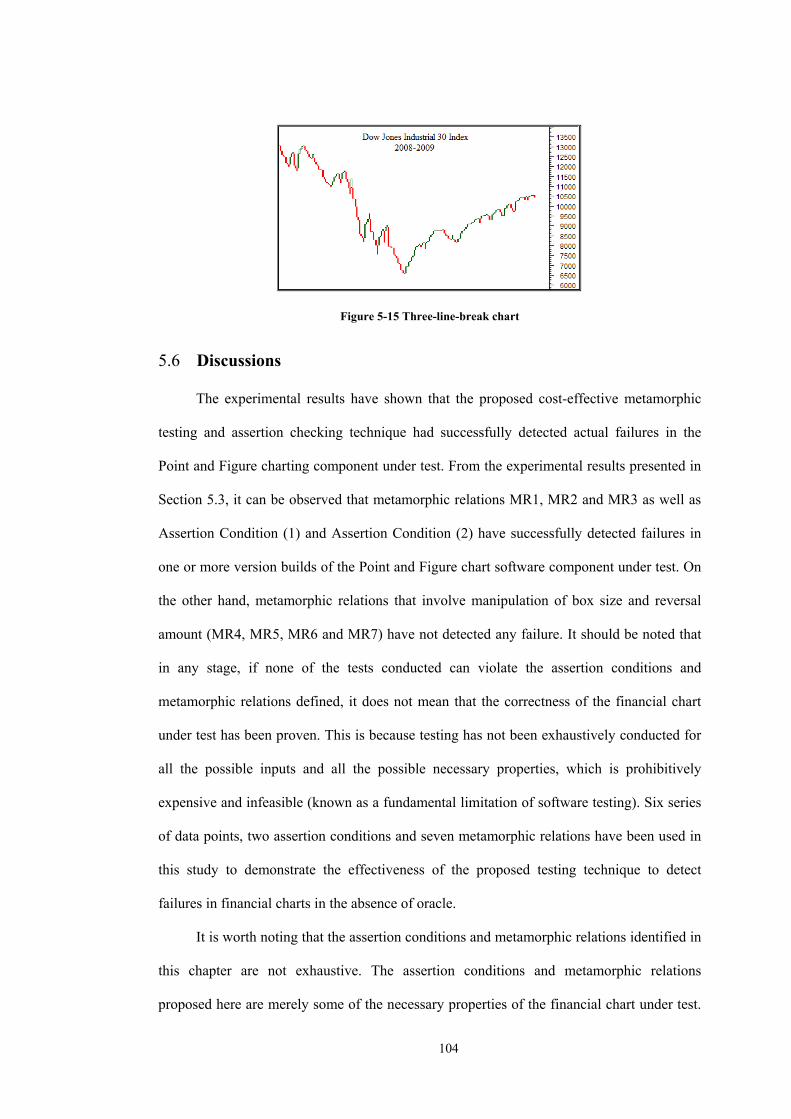
104
Figure 5-15 Three-line-break chart
5.6 Discussions
The experimental results have shown that the proposed cost-effective metamorphic
testing and assertion checking technique had successfully detected actual failures in the
Point and Figure charting component under test. From the experimental results presented in
Section 5.3, it can be observed that metamorphic relations MR1, MR2 and MR3 as well as
Assertion Condition (1) and Assertion Condition (2) have successfully detected failures in
one or more version builds of the Point and Figure chart software component under test. On
the other hand, metamorphic relations that involve manipulation of box size and reversal
amount (MR4, MR5, MR6 and MR7) have not detected any failure. It should be noted that
in any stage, if none of the tests conducted can violate the assertion conditions and
metamorphic relations defined, it does not mean that the correctness of the financial chart
under test has been proven. This is because testing has not been exhaustively conducted for
all the possible inputs and all the possible necessary properties, which is prohibitively
expensive and infeasible (known as a fundamental limitation of software testing). Six series
of data points, two assertion conditions and seven metamorphic relations have been used in
this study to demonstrate the effectiveness of the proposed testing technique to detect
failures in financial charts in the absence of oracle.
It is worth noting that the assertion conditions and metamorphic relations identified in
this chapter are not exhaustive. The assertion conditions and metamorphic relations
proposed here are merely some of the necessary properties of the financial chart under test.
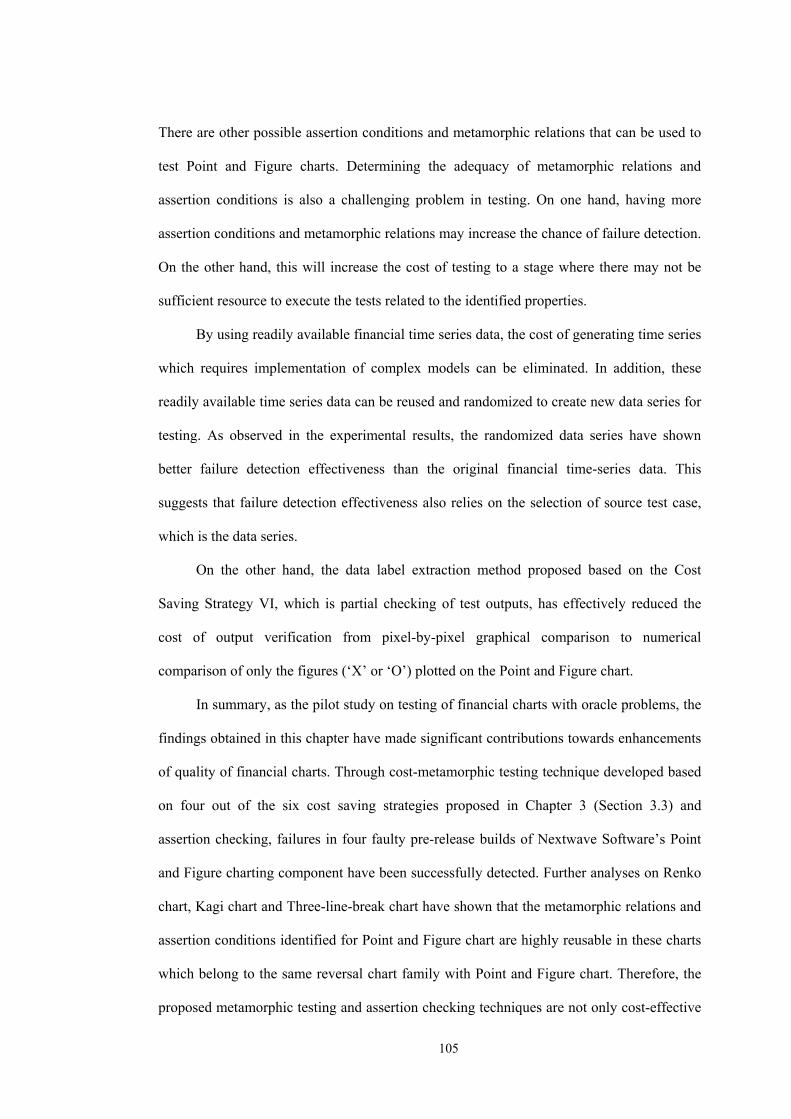
105
There are other possible assertion conditions and metamorphic relations that can be used to
test Point and Figure charts. Determining the adequacy of metamorphic relations and
assertion conditions is also a challenging problem in testing. On one hand, having more
assertion conditions and metamorphic relations may increase the chance of failure detection.
On the other hand, this will increase the cost of testing to a stage where there may not be
sufficient resource to execute the tests related to the identified properties.
By using readily available financial time series data, the cost of generating time series
which requires implementation of complex models can be eliminated. In addition, these
readily available time series data can be reused and randomized to create new data series for
testing. As observed in the experimental results, the randomized data series have shown
better failure detection effectiveness than the original financial time-series data. This
suggests that failure detection effectiveness also relies on the selection of source test case,
which is the data series.
On the other hand, the data label extraction method proposed based on the Cost
Saving Strategy VI, which is partial checking of test outputs, has effectively reduced the
cost of output verification from pixel-by-pixel graphical comparison to numerical
comparison of only the figures (‘X’ or ‘O’) plotted on the Point and Figure chart.
In summary, as the pilot study on testing of financial charts with oracle problems, the
findings obtained in this chapter have made significant contributions towards enhancements
of quality of financial charts. Through cost-metamorphic testing technique developed based
on four out of the six cost saving strategies proposed in Chapter 3 (Section 3.3) and
assertion checking, failures in four faulty pre-release builds of Nextwave Software’s Point
and Figure charting component have been successfully detected. Further analyses on Renko
chart, Kagi chart and Three-line-break chart have shown that the metamorphic relations and
assertion conditions identified for Point and Figure chart are highly reusable in these charts
which belong to the same reversal chart family with Point and Figure chart. Therefore, the
proposed metamorphic testing and assertion checking techniques are not only cost-effective

106
for Point and Figure charts, but also can be reused and deployed to test these financial
charting software components for further cost saving benefits.
107
6 Cost-effective Metamorphic Testing Technique
for Real-time Technical Indicators
Technical indicators are widely used in financial trading and charting software
packages to analyze and predict price movements in financial markets. Any failure in
technical indicator may lead to wrong trading decisions and cause substantial financial
losses. However, there are three problems in detecting failures of real-time technical
indicators in these software packages. Firstly, the indicator values are updated with real-time
market data, which cannot be generated arbitrarily for testing purpose. Secondly, technical
indicators are computed based on a large amount of market data. Thus, it is extremely
expensive, if not impossible, to manually derive the expected indicator values to check the
correctness of the computed indicator values. Thirdly, common metamorphic testing
technique cannot be used for real-time technical indicators because of the real-time nature of
the inputs which prevents follow up test cases to be generated for metamorphic testing. In
this chapter, a new cost-effective metamorphic testing technique is proposed to address
these problems in detecting failures in computation of real-time technical indicators.
Experiments conducted have shown that the proposed technique is effective in detecting
failures in faulty technical indicators on a real-life commercial trading software package,
MetaTrader 4 Client Terminal.
6.1 Introduction
Technical analysis in financial markets is a method to evaluate the behaviors of
financial markets based on market data, such as price, trading volume, and open interest. In
technical analysis, technical indicators are computed from market data using mathematical
functions that are specifically designed to detect emerging trends and predict future prices
(LeBeau and Lucas, 1992). Apart from fundamental analysis, technical indicators have been
widely adopted to perform technical analysis in stock, foreign currency exchange and
108
commodity trading markets (Taylor and Allen, 1992). Technical indicator is also a core
component in algorithmic trading system where trading activities are conducted
automatically in accordance to predefined strategies without human intervention (Nuti et al.,
2011).
The wide adoption of technical indicators in financial markets is largely attributed to
their potential to improve profitability in trading. For example, Brock et al. (1992) showed
that excess profits could be achieved from the use of technical indicators in the U.S. stock
market. Similar findings have been successfully replicated in the foreign currency exchange
markets (Neely et al., 1997; Detry and Gregoire, 2001; Okunev and White, 2003) and bond
markets (Preen, 2009) in more recent studies.
In view of the wide adoption, technical indicators have been commonly provided in
financial trading and charting software packages. As users may base their trading decisions
on technical indicators, it is crucial that the computed technical indicator values on such
software packages are correct. Any failure in technical indicator computation may lead to
wrong trading decisions and cause substantial financial losses.
There are three major problems in detecting failures in technical indicators. Firstly,
the indicator values are updated with real-time market data, which cannot be generated
arbitrarily for testing purpose. Secondly, they are usually computed based on a large amount
of market data over a long period of time. Therefore, it is extremely difficult, if not
impossible, to derive the expected indicator values to check the correctness of the computed
indicator values. Thirdly, common metamorphic testing technique cannot be used for real-
time technical indicators because of the real-time nature of the inputs which prevents follow
up test cases to be generated for metamorphic testing. Due to these problems, detecting
failures in technical indicator computation remains as a challenging yet essential quality
assurance task.
In order to address the above problems, a new cost-effective metamorphic testing
technique is developed to detect failures in two commonly used technical indicators
109
(Boetticher, 2009), namely the moving averages (MA) and the relative strength index (RSI).
To evaluate the failure detection effectiveness of the proposed metamorphic testing
technique, experiments are conducted on commercially available MetaTrader 4 Client
Terminal trading and charting software.
6.2 Test Targets - Technical Indicators
Technical analysis assumes that financial market prices move in certain directions or
trends (up, down or sideway) instead of randomly (Boetticher, 2009). Based on this
assumption, various technical indicators have been developed to predict and detect emerging
trends in the financial markets.
6.2.1 Moving Averages
Simple moving average (SMA) is a typical technical indicator used to detect
emerging trends in financial markets. Figure 6-1 shows a 100-day SMA (the smooth line) as
the technical indicator on a daily open-high-low-close bar chart of the EUR-to-USD
exchange rate as the price data in the foreign currency exchange markets. In this example, a
downtrend can be predicted when the EUR-to-USD exchange rate falls below the 100-day
SMA as indicated by the down arrow on the top left of Figure 6-1. Conversely, an uptrend
can be predicted when the EUR-to-USD exchange rate rises above the 100-day SMA as
indicated by the up arrow on the bottom right of Figure 6-1.
To compute SMA, a minimum of n time periods of price data are required. Let t (t =
k, k-1, k-2, …0) denote the time period of the prices plotted on Figure 6-1, where k n-1.
Let t = k be the oldest time period and t = 0 be the newest time period 2 (the right most time
period on the bar chart in Figure 6-1). Let P(pk, pk-1, pk-2, …, p0) be the price values from
time period t = k to t = 0. The SMA for n (n > 0) consecutive time periods preceding (and
2 t=0 is defined as the newest time period instead of as the oldest time period to concur with
the definition used in the technical indicators on MetaTrader 4 Client Terminal.
110
inclusive) t can be computed with Equation (6-1). For a given n and k values, SMA(n,t) can
be computed for each time period starting from time period t = k-n+1 to time period t = 0.
As an example, consider the prices for eight time periods (t=7, 6, 5, …, 0) in Table
6-1. The SMA for n = 5 consecutive time periods from (and inclusive) t = 3, that is
SMA(5,3), can be computed by summing the prices from t = 3 to t = 7 (columns shaded in
grey) and dividing the sum by 5. The SMA for the next time period, SMA(5,2), can be
computed by reapplying Equation (6-1).
Alternatively, the summation computation in SMA(n,t) can also be viewed as a sliding
window spanning from time period t to t+n-1. Table 6-1 illustrates the sliding windows as
rows of shaded cells. By using the sliding window approach, SMA(5,2) can be computed by
subtracting p7 /n from and adding p2 /n to the SMA of preceding time period, SMA(5,3).
Equation (6-2) defines the sliding windows approach to compute SMA.
In financial markets, more recent price movements may have more influence to the
market trend than the older ones. Smoothed Moving Average (SMMA) is a variant of SMA
that addresses this issue by assigning higher weightage to the price of the current time
period. The SMMA for n (n > 0) consecutive time period from (and inclusive) time period t
is defined by Equation (6-3), where the preceding time period SMMA is multiplied with (n-
1) and added to pt to obtain the sum of average computation. Similar to SMA(n,t),
SMMA(n,t) can only be computed from time period t=k-n+1 onwards.
Calculating the values of SMA or SSMA manually to check the correctness of the
computed indicator values is prohibitively time consuming and error-prone. This becomes
worse when n is large or when the SMA or SSMA is repeatedly computed over a series of
long time periods. The correctness of moving average computation is important because
moving average is a component used to compute many other technical indicators such as
Moving Average Convergence-Divergence (MACD), Bollinger Bands, Stochastic
Oscillator, Commodity Channel Index and Relative Strength Index, just to name a few
(Achelis, 2001).
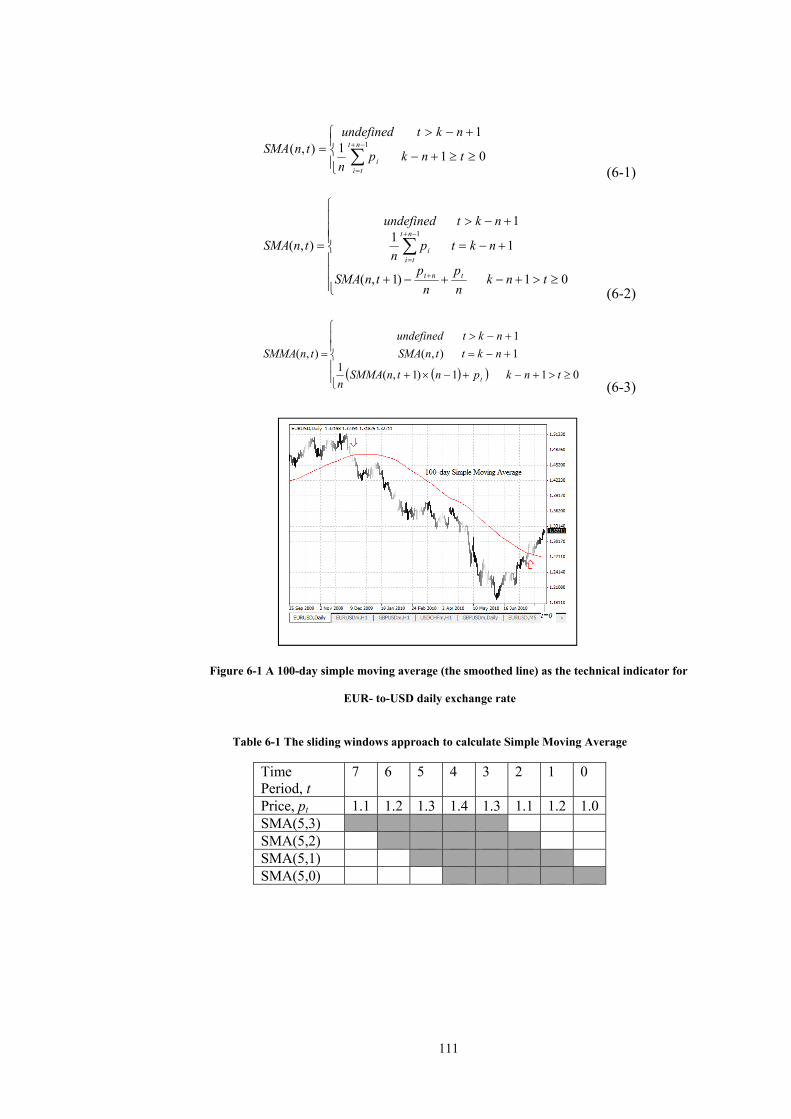
111
011
1),( 1
tnkpn
nktundefinedtnSMA nt
tii
(6-1)
01)1,(
11
1
),(1
tnkn
p
n
ptnSMA
nktpn
nktundefined
tnSMA
tnt
nt
tii
(6-2)
011)1,(1
1),(
1
),(
tnkpntnSMMAn
nkttnSMA
nktundefined
tnSMMA
t
(6-3)
Figure 6-1 A 100-day simple moving average (the smoothed line) as the technical indicator for
EUR- to-USD daily exchange rate
Table 6-1 The sliding windows approach to calculate Simple Moving Average
Time Period, t
7 6 5 4 3 2 1 0
Price, pt 1.1 1.2 1.3 1.4 1.3 1.1 1.2 1.0 SMA(5,3) SMA(5,2) SMA(5,1) SMA(5,0)
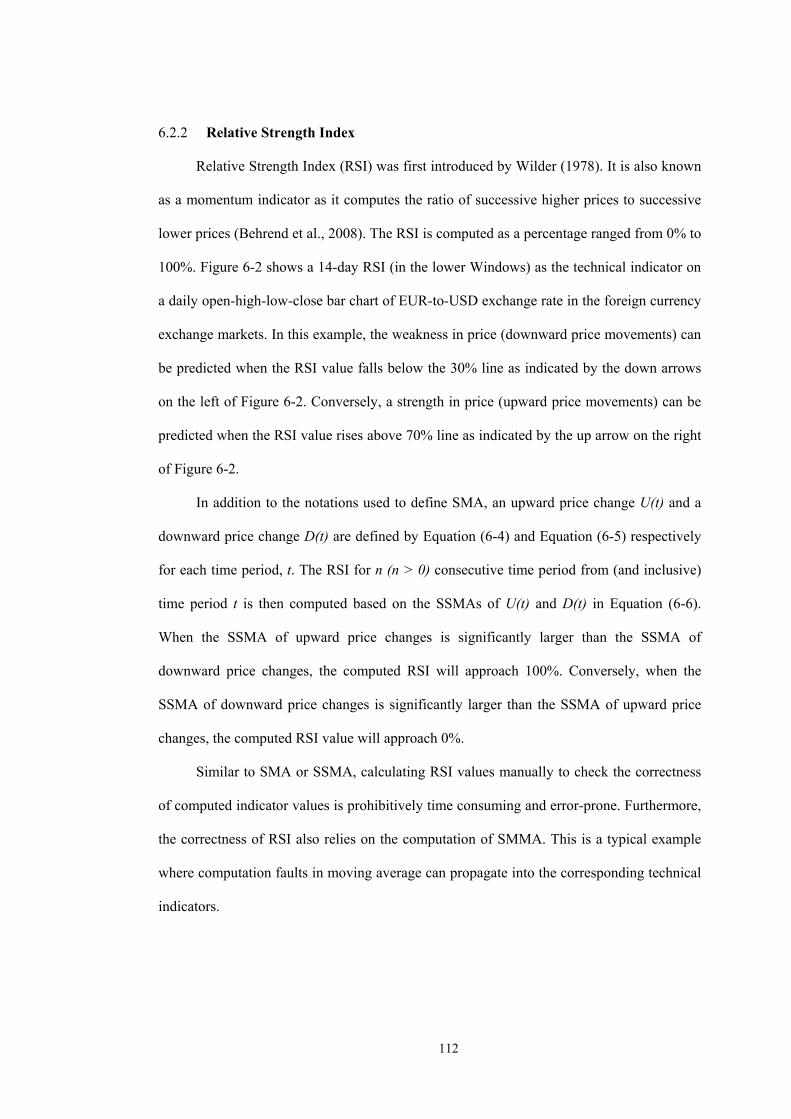
112
6.2.2 Relative Strength Index
Relative Strength Index (RSI) was first introduced by Wilder (1978). It is also known
as a momentum indicator as it computes the ratio of successive higher prices to successive
lower prices (Behrend et al., 2008). The RSI is computed as a percentage ranged from 0% to
100%. Figure 6-2 shows a 14-day RSI (in the lower Windows) as the technical indicator on
a daily open-high-low-close bar chart of EUR-to-USD exchange rate in the foreign currency
exchange markets. In this example, the weakness in price (downward price movements) can
be predicted when the RSI value falls below the 30% line as indicated by the down arrows
on the left of Figure 6-2. Conversely, a strength in price (upward price movements) can be
predicted when the RSI value rises above 70% line as indicated by the up arrow on the right
of Figure 6-2.
In addition to the notations used to define SMA, an upward price change U(t) and a
downward price change D(t) are defined by Equation (6-4) and Equation (6-5) respectively
for each time period, t. The RSI for n (n > 0) consecutive time period from (and inclusive)
time period t is then computed based on the SSMAs of U(t) and D(t) in Equation (6-6).
When the SSMA of upward price changes is significantly larger than the SSMA of
downward price changes, the computed RSI will approach 100%. Conversely, when the
SSMA of downward price changes is significantly larger than the SSMA of upward price
changes, the computed RSI value will approach 0%.
Similar to SMA or SSMA, calculating RSI values manually to check the correctness
of computed indicator values is prohibitively time consuming and error-prone. Furthermore,
the correctness of RSI also relies on the computation of SMMA. This is a typical example
where computation faults in moving average can propagate into the corresponding technical
indicators.
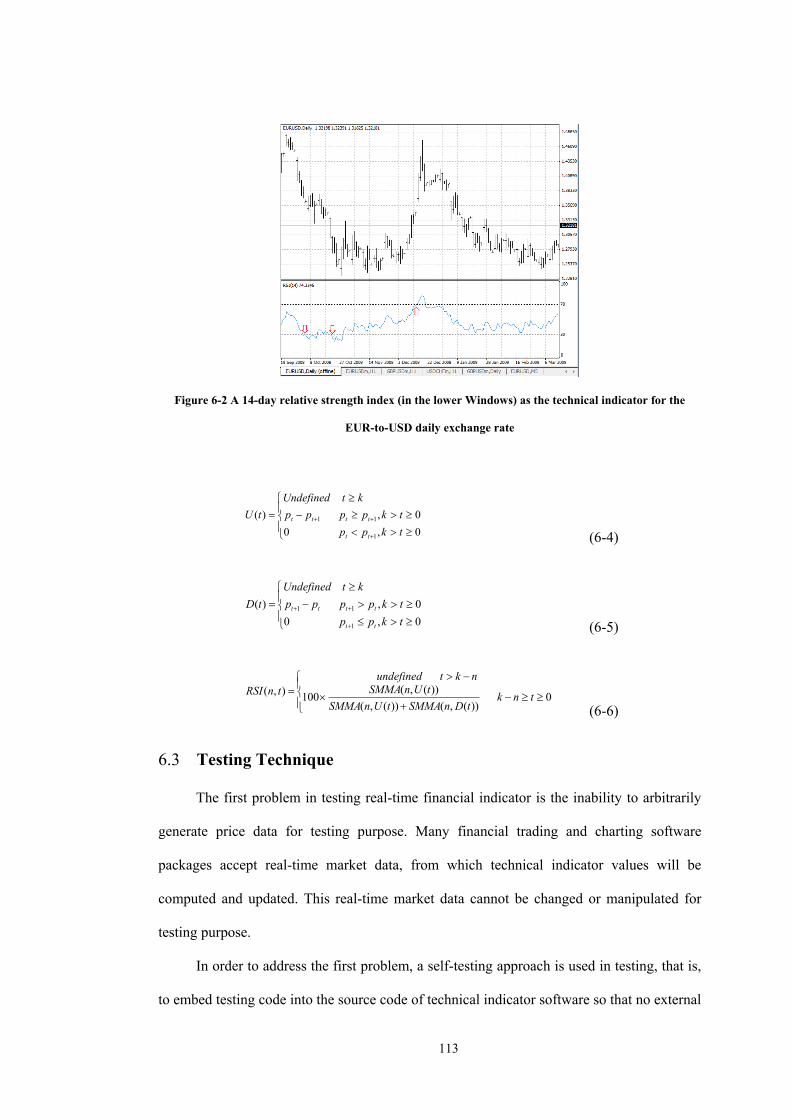
113
Figure 6-2 A 14-day relative strength index (in the lower Windows) as the technical indicator for the
EUR-to-USD daily exchange rate
0,0
0,)(
1
11
tkpp
tkpppp
ktUndefined
tU
tt
tttt
(6-4)
0,0
0,)(
1
11
tkpp
tkpppp
ktUndefined
tD
tt
tttt
(6-5)
0
))(,())(,(
))(,(100),( tnk
tDnSMMAtUnSMMA
tUnSMMAnktundefined
tnRSI
(6-6)
6.3 Testing Technique
The first problem in testing real-time financial indicator is the inability to arbitrarily
generate price data for testing purpose. Many financial trading and charting software
packages accept real-time market data, from which technical indicator values will be
computed and updated. This real-time market data cannot be changed or manipulated for
testing purpose.
In order to address the first problem, a self-testing approach is used in testing, that is,
to embed testing code into the source code of technical indicator software so that no external
114
test driver is required to generate and feed price data into the software under test. With such
setting, software is tested with real-time market data. When embedded testing code detects a
computation fault in technical indicators, an error message will be prompted to alert the
testers or end user.
The second problem in testing real-time financial indicator is the absence of oracle.
This can be addressed by using metamorphic testing which can detect failures in the absence
of oracle. However, this leads to the third problem, which is, common metamorphic testing
technique cannot be used for real-time technical indicators because of the real-time nature of
the inputs which prevents follow up test cases to be generated for metamorphic testing.
In order to address the second and third problems, Cost Saving Strategy V, which is
“pairing existing test cases” proposed in Chapter 3 (Section 3.3) will be adopted to develop
the new metamorphic testing technique for real-time financial indicators. By pairing existing
test cases to form the source test case and follow up test case pairs, generation of source test
case and follow up test case is not required. This cost saving strategy not only eliminates the
cost of generating and executing follow up test cases, but also solves the problem in
generating follow up test cases caused by the real-time nature of the inputs.
The new metamorphic testing technique is developed by merging the self-testing
approach and the metamorphic testing based on pairing of existing test cases. Firstly, the
metamorphic relations for each technical indicator are identified. Then, these metamorphic
relations are embedded into the source code of the technical indicator software for self-
testing purpose. When real-time price data of each time period t and their respective
preceding time periods satisfy a metamorphic relation, these price data will be “paired” to
form a source test case and follow up test case pair for the metamorphic relation and the
technical indicators computed for these periods will be checked against the corresponding
metamorphic relation. It is worth noting that unlike common metamorphic testing technique,
this new metamorphic testing technique does not require generation of source test input and

115
follow up test inputs because they are paired and formed from existing real-time price data
feed.
For the metamorphic testing technique developed, at least two metamorphic relations
are identified for each test target (technical indicator) presented in Section 6.2 based on their
properties.
A. Simple Moving Average (SMA):
1. Metamorphic Relation 1 (MR1): If pt > pt+n, then SMA(n,t) > SMA(n,t+1).
This metamorphic relation is identified based on Equation (6-2). Based on the
sliding window approach, the SMA(n,t) can be computed by subtracting pt+n/n from
and adding pt /n to SMA(n,t+1). This metamorphic relation is particularly useful to
provide independent checking when the SMA is computed with Equation (6-1).
2. Metamorphic Relation 2 (MR2): If pt < pt+n, then SMA(n,t) < SMA(n,t+1).
This metamorphic relation is identified based on the same property used in MR1.
B. Smoothed Moving Average (SMMA):
1. Metamorphic Relation 1 (MR1): If pt>pt+1 AND SMMA(n,t+1) > SMMA(n,t+2),
then SMMA(n,t) > SMMA(n,t+1).
This metamorphic relation is identified based on Equation (6-3). If the price value
of time period t is larger than the price value in the preceding time period AND the
SMMA of time period t+1 is larger than the SMMA of the preceding time period,
then the SMMA of the time period t must be larger than the SMMA of the
preceding time period.
2. Metamorphic Relation 2 (MR2): If pt<pt+1 AND SMMA(n,t+1) < SMMA(n,t+2),
then SMMA(n,t) < SMMA(n,t+1).
This metamorphic relation is identified based on the same property used in MR1,
for the case of pt<pt+1 AND SMMA(n,t+1) < SMMA(n,t+2).
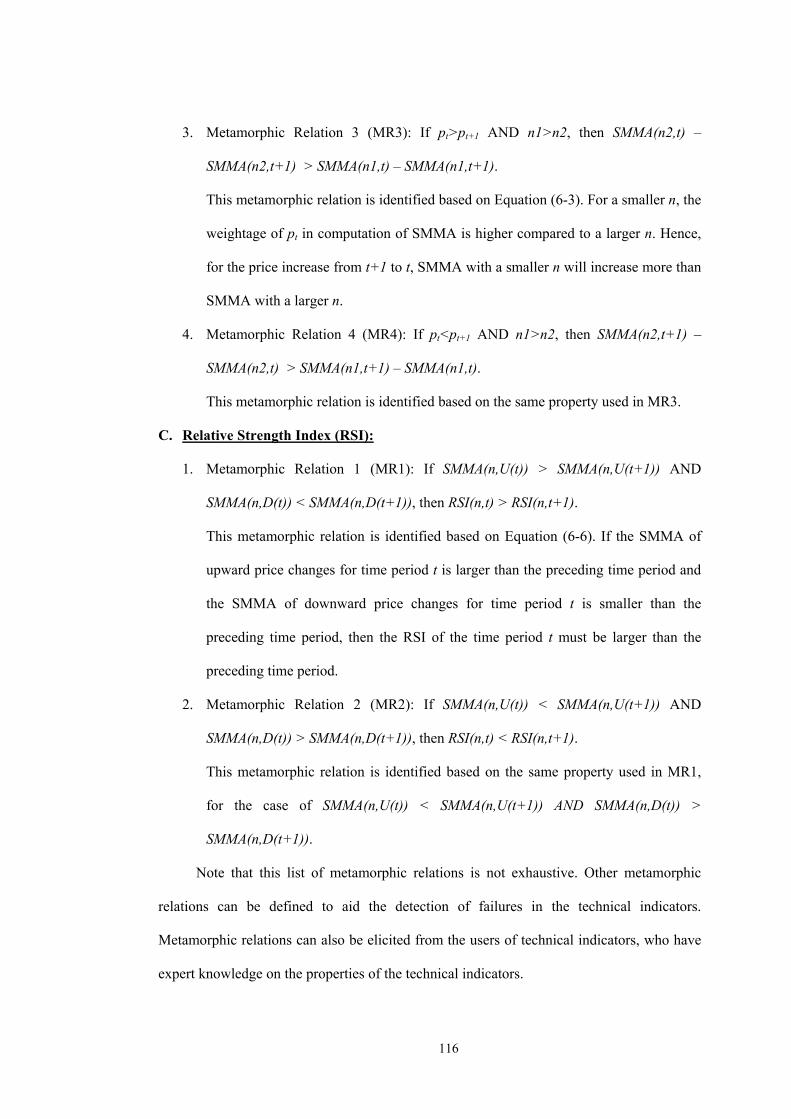
116
3. Metamorphic Relation 3 (MR3): If pt>pt+1 AND n1>n2, then SMMA(n2,t) –
SMMA(n2,t+1) > SMMA(n1,t) – SMMA(n1,t+1).
This metamorphic relation is identified based on Equation (6-3). For a smaller n, the
weightage of pt in computation of SMMA is higher compared to a larger n. Hence,
for the price increase from t+1 to t, SMMA with a smaller n will increase more than
SMMA with a larger n.
4. Metamorphic Relation 4 (MR4): If pt<pt+1 AND n1>n2, then SMMA(n2,t+1) –
SMMA(n2,t) > SMMA(n1,t+1) – SMMA(n1,t).
This metamorphic relation is identified based on the same property used in MR3.
C. Relative Strength Index (RSI):
1. Metamorphic Relation 1 (MR1): If SMMA(n,U(t)) > SMMA(n,U(t+1)) AND
SMMA(n,D(t)) < SMMA(n,D(t+1)), then RSI(n,t) > RSI(n,t+1).
This metamorphic relation is identified based on Equation (6-6). If the SMMA of
upward price changes for time period t is larger than the preceding time period and
the SMMA of downward price changes for time period t is smaller than the
preceding time period, then the RSI of the time period t must be larger than the
preceding time period.
2. Metamorphic Relation 2 (MR2): If SMMA(n,U(t)) < SMMA(n,U(t+1)) AND
SMMA(n,D(t)) > SMMA(n,D(t+1)), then RSI(n,t) < RSI(n,t+1).
This metamorphic relation is identified based on the same property used in MR1,
for the case of SMMA(n,U(t)) < SMMA(n,U(t+1)) AND SMMA(n,D(t)) >
SMMA(n,D(t+1)).
Note that this list of metamorphic relations is not exhaustive. Other metamorphic
relations can be defined to aid the detection of failures in the technical indicators.
Metamorphic relations can also be elicited from the users of technical indicators, who have
expert knowledge on the properties of the technical indicators.
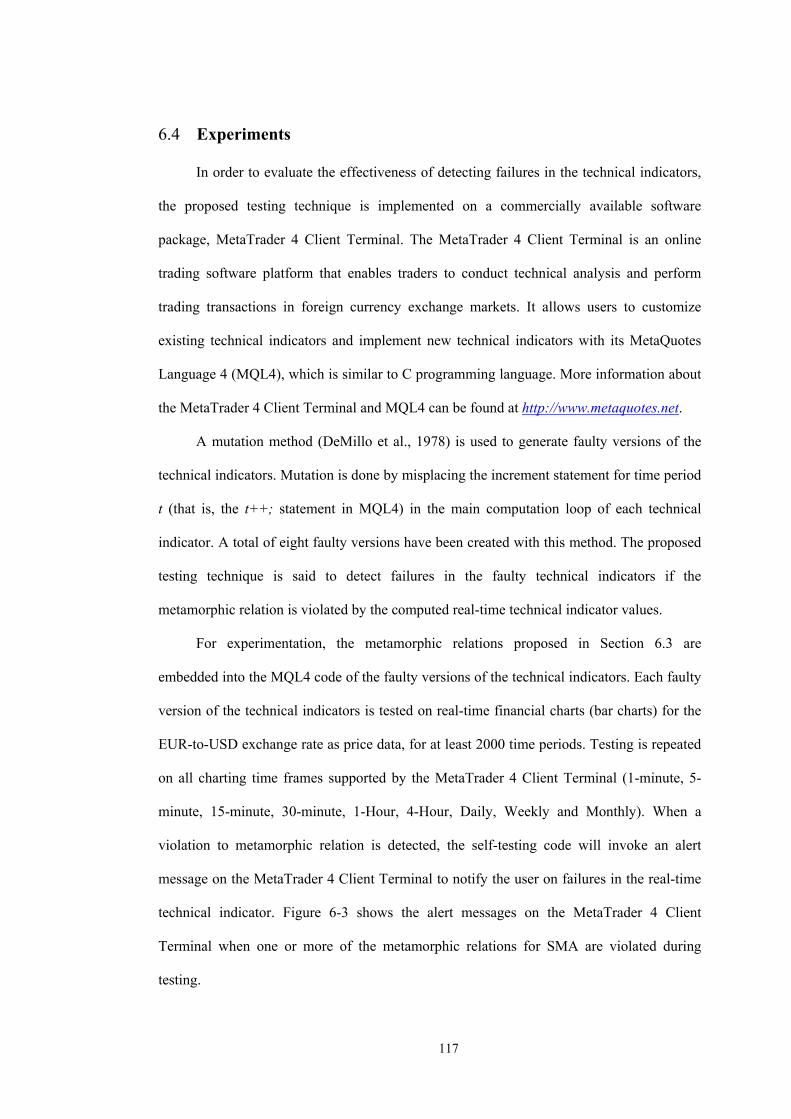
117
6.4 Experiments
In order to evaluate the effectiveness of detecting failures in the technical indicators,
the proposed testing technique is implemented on a commercially available software
package, MetaTrader 4 Client Terminal. The MetaTrader 4 Client Terminal is an online
trading software platform that enables traders to conduct technical analysis and perform
trading transactions in foreign currency exchange markets. It allows users to customize
existing technical indicators and implement new technical indicators with its MetaQuotes
Language 4 (MQL4), which is similar to C programming language. More information about
the MetaTrader 4 Client Terminal and MQL4 can be found at http://www.metaquotes.net.
A mutation method (DeMillo et al., 1978) is used to generate faulty versions of the
technical indicators. Mutation is done by misplacing the increment statement for time period
t (that is, the t++; statement in MQL4) in the main computation loop of each technical
indicator. A total of eight faulty versions have been created with this method. The proposed
testing technique is said to detect failures in the faulty technical indicators if the
metamorphic relation is violated by the computed real-time technical indicator values.
For experimentation, the metamorphic relations proposed in Section 6.3 are
embedded into the MQL4 code of the faulty versions of the technical indicators. Each faulty
version of the technical indicators is tested on real-time financial charts (bar charts) for the
EUR-to-USD exchange rate as price data, for at least 2000 time periods. Testing is repeated
on all charting time frames supported by the MetaTrader 4 Client Terminal (1-minute, 5-
minute, 15-minute, 30-minute, 1-Hour, 4-Hour, Daily, Weekly and Monthly). When a
violation to metamorphic relation is detected, the self-testing code will invoke an alert
message on the MetaTrader 4 Client Terminal to notify the user on failures in the real-time
technical indicator. Figure 6-3 shows the alert messages on the MetaTrader 4 Client
Terminal when one or more of the metamorphic relations for SMA are violated during
testing.
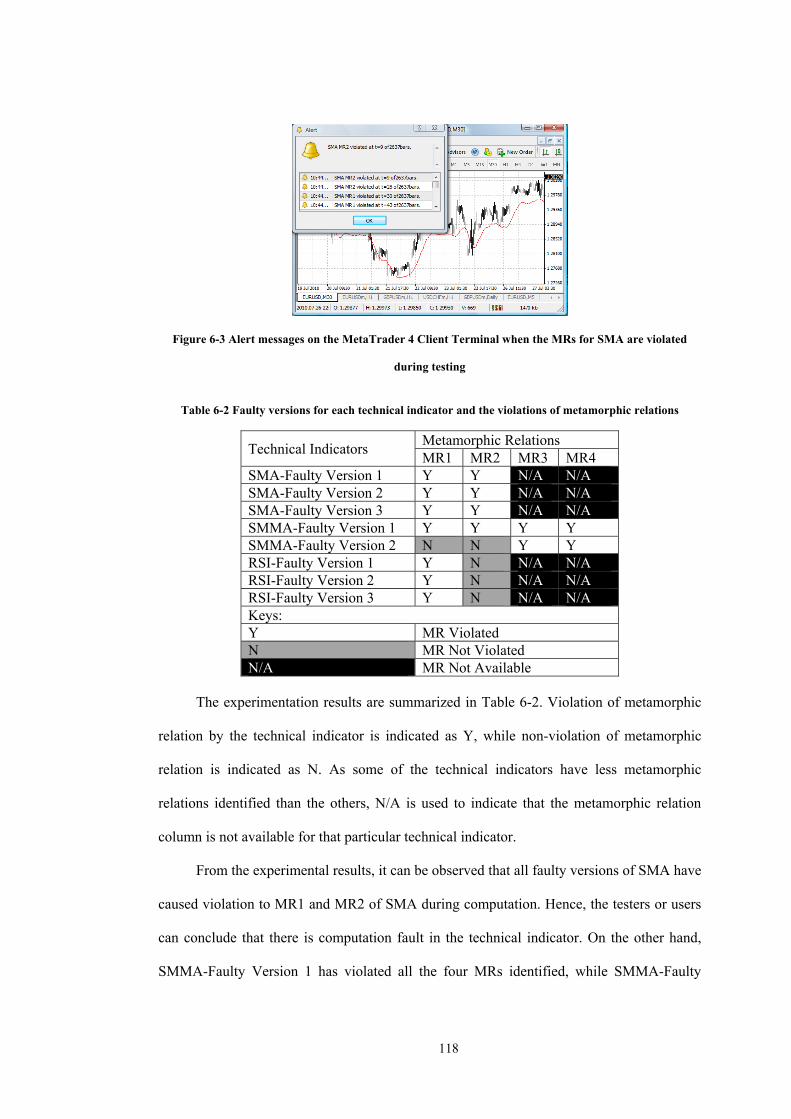
118
Figure 6-3 Alert messages on the MetaTrader 4 Client Terminal when the MRs for SMA are violated
during testing
Table 6-2 Faulty versions for each technical indicator and the violations of metamorphic relations
Technical Indicators Metamorphic Relations MR1 MR2 MR3 MR4
SMA-Faulty Version 1 Y Y N/A N/A SMA-Faulty Version 2 Y Y N/A N/A SMA-Faulty Version 3 Y Y N/A N/A SMMA-Faulty Version 1 Y Y Y Y SMMA-Faulty Version 2 N N Y Y RSI-Faulty Version 1 Y N N/A N/A RSI-Faulty Version 2 Y N N/A N/A RSI-Faulty Version 3 Y N N/A N/A Keys: Y MR Violated N MR Not Violated N/A MR Not Available
The experimentation results are summarized in Table 6-2. Violation of metamorphic
relation by the technical indicator is indicated as Y, while non-violation of metamorphic
relation is indicated as N. As some of the technical indicators have less metamorphic
relations identified than the others, N/A is used to indicate that the metamorphic relation
column is not available for that particular technical indicator.
From the experimental results, it can be observed that all faulty versions of SMA have
caused violation to MR1 and MR2 of SMA during computation. Hence, the testers or users
can conclude that there is computation fault in the technical indicator. On the other hand,
SMMA-Faulty Version 1 has violated all the four MRs identified, while SMMA-Faulty
119
Version 2 has only caused violation to MR3 and MR4. Lastly, all faulty versions of RSI
have violated MR1.
In summary, the experimental results have shown that the proposed new metamorphic
testing technique has successfully detected failures in the faulty versions of the technical
indicators. This is an encouraging result given that the testing has been conducted cost-
effectively by pairing existing real-time price data to form source test cases and follow up
test cases without having to generate these source test cases and follow up test cases. The
proposed technique has also effectively alleviated the oracle problem and enabled failures to
be detected without having to manually calculate the correct values for the technical
indicators.
6.5 Discussions
Detecting failures in technical indicators is a challenging yet essential quality
assurance task. Any failure in technical indicators may lead to wrong trading decision and
cause substantial financial losses. However, there are three major problems in detecting
failures in technical indicators. Firstly, the indicator values are updated with real-time
market data, which cannot be generated arbitrarily. Secondly, technical indicators are
usually computed over a large amount of market data over a long period of time. Therefore,
it is extremely difficult, if not impossible, to derive the expected indicator values to check
the correctness of the computed indicator values. Lastly, common metamorphic testing
technique cannot be used for real-time technical indicators because of the real-time nature of
the inputs which prevents follow up test cases to be generated for metamorphic testing.
In this chapter, a new cost effective metamorphic testing technique has been proposed
to address the above mentioned problems and effectively detect failures in technical
indicators. As a pilot study on testing for computation of technical indicators, the work
presented in this chapter has contributed to both areas of finance engineering and software
testing. From finance engineering perspective, the proposed testing technique allows the

120
technical indicators to be tested on real-time market data. It also enables failure detection
under the constraint of unknown correct expected indicator values.
From software testing perspective, it has been demonstrated for the first time that the
metamorphic testing can be conducted without generating source test cases and follow up
test cases. Instead, whenever real-time price data of each time period and their respective
preceding time periods satisfy a metamorphic relation, these price data will be “paired” to
form a source test case and follow up test case pair for the metamorphic relation and the
technical indicators computed for these periods will be checked against the corresponding
metamorphic relation. Based upon Cost Saving Strategy V, which is “pairing existing test
cases” proposed in Chapter 3 (Section 3.3), this technique has successfully eliminated the
cost of generating both source test cases and follow up test cases for metamorphic testing.
The experiments conducted on the MetaTrader 4 Client Terminal have shown that the
proposed testing technique has successfully detected failures in the faulty versions of three
widely used technical indicators, namely, Simple Moving Average, Smoothed Moving
Average and Relative Strength Index. The results are significant given that the proposed
cost-effective testing technique has been conducted under the constraints of real-time
market data that cannot be generated arbitrarily and with unknown expected indicator
values.
7 Cost-effective Metamorphic Testing Technique
for Finite State Machines
Finite state machine (FSM) has been widely used to model reactive systems ranging
from sequential circuits, communication protocols, embedded systems to complex reactive
software systems. In FSM, an arbitrary input can produce different outputs depending on the
state of the system. Therefore, oracle problem exists in FSM because the correctness of
output for an arbitrary input cannot be easily determined. Furthermore, long test sequences
consisting of input/expected output pairs are required to identify or verify the state of the
FSM and detect different types of faults. Such long test sequences are prohibitively
expensive to be executed, particularly on reactive systems that require manual activation of
inputs. Hence, FSM testing is a challenging problem that has been actively researched for
the past 50 years.
In this chapter, a cost-effective metamorphic testing technique is proposed based on
transition tour to detect transfer fault in FSMs. Unlike the conventional transition tour that
can only guarantee the detection of output faults but not transfer faults, the proposed
technique can guarantee the detection of transfer faults in FSM without state identification
or state verification. As a result, the test sequence generated with this technique is
significantly shorter than existing FSM testing methods which rely on state identification or
state verification to detect transfer fault. Further analysis shows that the proposed cost-
effective metamorphic testing technique can also be reused to detect reset faults in FSM.
7.1 Introduction
FSM has been widely used to model reactive systems in many application areas.
Research in testing of FSM has started since 1950’s, focusing primarily on sequential circuit
testing (Moore, 1956; Hennine, 1964). Since 1980’s, the focus shifted to conformance
122
testing of communication protocols which can be modelled by FSM (Sabnani and Dahbura,
1988; Yang and Ural, 1990). More recently, advances in embedded systems and complex
reactive software systems have continued to motivate fundamental research in testing of
FSM (Utting and Legeard, 2010).
In FSM testing, the goal is to determine whether an Implementation Under Test (IUT)
has the same input/output and transfer behaviors as its specifications modelled as FSM.
Prior to the testing process, test sequences, each consisting of input/expected output pairs,
are generated from the specifications modelled as FSM. During the testing process, the IUT
is treated as a black-box. Inputs from a test sequence are applied to the IUT. The resulting
outputs produced by the IUT are compared with the expected outputs from the
specifications modelled as FSM. If any of the outputs produced by the IUT differs from the
expected output, then a failure has been detected and it can be concluded that one or more
faults exist in the IUT.
Faults in the IUT are commonly caused by human errors committed when
implementing the specifications modelled as FSM into the sequential circuits or software
codes. Assuming that IUT is also implemented as an FSM, there are two types of faults that
can occur in the implementation, namely, output faults and transfer faults. Output faults are
caused by incorrect output or change of output for a transition. On the other hand, transfer
faults are caused by incorrect end state or change in end state for a transition.
Numerous test sequence generation methods3 that target the detection of both types of
faults in FSM have been developed over the past 50 years. Research in this field was started
by Moore (1956) in his Gedanken experiments on sequential machines. Among the classical
test methods developed since then were D-method (Hennine, 1964), W-method (Chow,
1978; Utting and Legeard, 2010), Wp-method (Fujiwara et al., 1991), U-method (Sabnani
and Dahbura, 1988) and Transition Tour method (Naito and Tsunoyama, 1981).
3 In FSM testing literatures, the term “testing method” is more commonly used to refer to
“testing technique”. In thesis, these two terms carry the same meaning and are used interchangeably.
123
In terms of fault detection capability, test sequences generated by all these methods
can guarantee the detection of output faults in the IUT. In addition, test sequences generated
by the D-method, W-method, Wp-method and U-method can also guarantee the detection of
all transfer faults. This is done by checking that the destination state is correct by applying
test sequences generated specifically to identify or verify the state by observing the outputs
of the IUT. Although these methods guarantee the detection of transfer fault, there are a few
limitations that constrain their applicability in practice.
In the worst case, test sequences generated by the D-method, W-method, Wp-method
and U-method may contain up to O(pn3) transitions, where n is the number of states and p is
the number of the input symbols. As an example, a small FSM with 10 states and 5 input
symbols can contain up to 5X103 = 5,000 transitions to execute in testing. Such test
sequences are prohibitively expensive to execute, particularly on reactive systems that
require manual activation of inputs, such as flipping of hardware switches and activation of
sensors in FSM based reactive system. In this case, oracle problem exists because although
the oracles or correct outputs are known, they are too expensive to be applied to verify the
correctness of the outputs produced by FSM.
In general, Yang and Ural (1990) reported that the lengths of test sequences were in
the following order: Transition Tour method < U-method < D-method < Wp-method < W-
method. Furthermore, the lengths of Wp-method and W-method test sequences were found
to be significantly longer than the corresponding D-method and U-method test sequences.
These observations were further supported by Dorofeeva et al. (2010) and Endo and Simao
(2013) through analysis and empirical studies on randomly generated FSMs.
On the other hand, even though the lengths of test sequences generated by the D-
method and U-method are significantly shorter than W-method and Wp-method, they may
not be applicable for certain FSMs. For D-method, some FSMs do not have distinguishing
sequence that gives different output behavior when applied to each state of the FSM. Hence,
D-method cannot be used to detect transfer faults on such FSMs. Similar limitation exists on
124
U-method. Certain states in some FSMs may not have a unique input output sequence which
is required by the U-method. Therefore, U-method cannot be used to detect transfer faults in
these FSMs.
In view of the limitations of D-method and U-method, and the potential excessive test
length of W-method and Wp-method, Transition Tour method thus remains a popular choice
for FSM testing in practice (Heineman and Councill, 2001). Unlike D-method, W-method,
Wp-method and U-method which have the worst case length of O(pn3), test sequences
generated by Transition Tour method only contain O(pn) transitions in the worst case, where
n is the number of states and p is the number of the input symbols. For example, for the
same FSM with 10 states and 5 input symbols, test sequences generated by the Transition
Tour method will only contain up to 50 transitions. This is 1000 times shorter than the worst
case length for test sequences generated by D-method, W-method, Wp-method and U-
method. In other words, Transition Tour method generates test sequence of the shortest
length among all the methods. This is because a Transition Tour does not require excessive
test sequences for state identification or state verification. Furthermore, the concept of
transition tour is simple. It is simply a test sequence that takes the FSM from the initial state,
traverses every transition at least once and returns to the initial state. Because of its
simplicity in concept, it is easier for novice testers to understand and implement it.
However, Transition Tour has one limitation, which is, it can only guarantee the
detection of all output faults but not all transfer faults. In this chapter, a novel cost-effective
metamorphic testing technique is proposed to address this limitation in Transition Tour. In
effect, the proposed cost-effective metamorphic testing technique can extend the fault
detection capability of Transition Tour to guarantee the detection of all transfer faults.
7.2 Background – Finite State Machine
7.2.1 Preliminaries
An FSM, M, can be defined as:
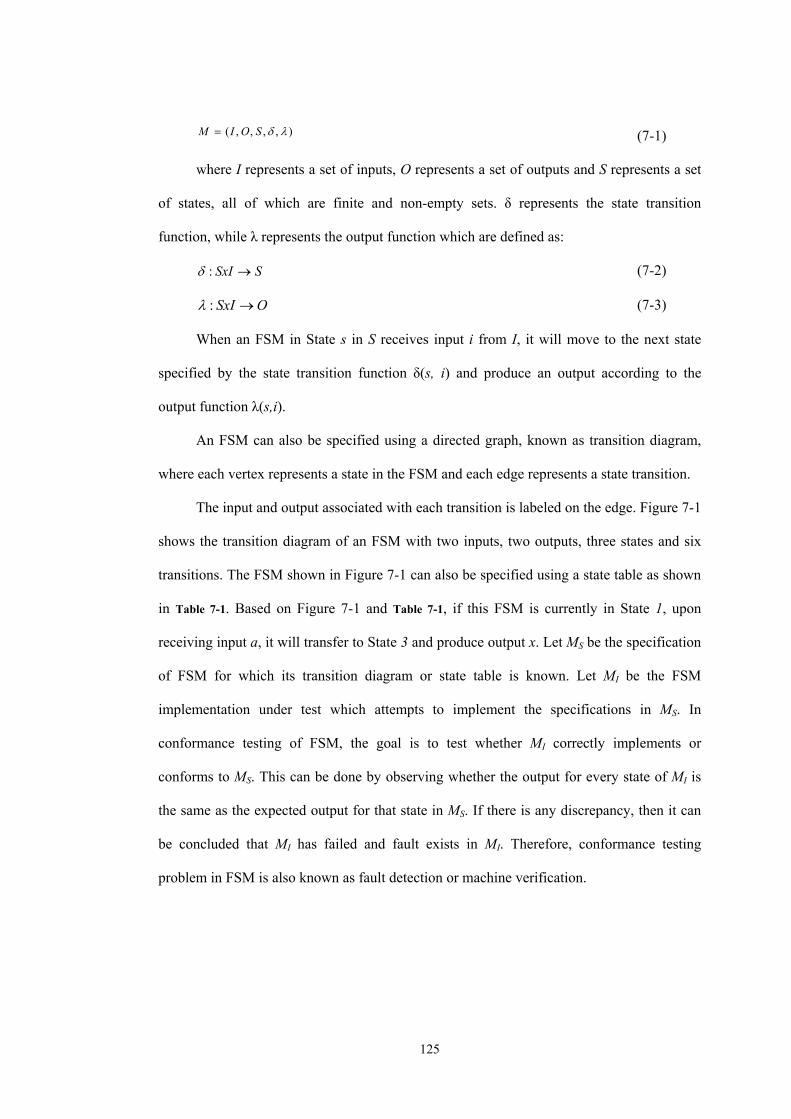
125
),,,,( SOIM (7-1)
where I represents a set of inputs, O represents a set of outputs and S represents a set
of states, all of which are finite and non-empty sets. δ represents the state transition
function, while λ represents the output function which are defined as:
SSxI : (7-2)
OSxI : (7-3)
When an FSM in State s in S receives input i from I, it will move to the next state
specified by the state transition function δ(s, i) and produce an output according to the
output function λ(s,i).
An FSM can also be specified using a directed graph, known as transition diagram,
where each vertex represents a state in the FSM and each edge represents a state transition.
The input and output associated with each transition is labeled on the edge. Figure 7-1
shows the transition diagram of an FSM with two inputs, two outputs, three states and six
transitions. The FSM shown in Figure 7-1 can also be specified using a state table as shown
in Table 7-1. Based on Figure 7-1 and Table 7-1, if this FSM is currently in State 1, upon
receiving input a, it will transfer to State 3 and produce output x. Let MS be the specification
of FSM for which its transition diagram or state table is known. Let MI be the FSM
implementation under test which attempts to implement the specifications in MS. In
conformance testing of FSM, the goal is to test whether MI correctly implements or
conforms to MS. This can be done by observing whether the output for every state of MI is
the same as the expected output for that state in MS. If there is any discrepancy, then it can
be concluded that MI has failed and fault exists in MI. Therefore, conformance testing
problem in FSM is also known as fault detection or machine verification.

7.3 As
All
(D-metho
other FSM
constraint
FSM, MI
assumptio
1. MS is
2. MS is
comp
3. MS is
the m
4. MI do
other
Ta
Sta1 2 3
ssumptions
l conformanc
od, U-method
M testing me
ts imposed b
I that can
ons are:
minimal or c
completely
letely define
strongly con
machine via o
oes not chang
words, MI ca
Figure 7-
able 7-1 Corres
ate
s
ce testing or
d, W-metho
ethods are de
by these assu
pass any te
completely r
specified: th
ed for every s
nnected: ever
ne or more s
ge during tes
an accept and
1
b
12
-1 Transition d
sponding state
Input a3,x 1,x 2,y
fault detectio
od, Wp-meth
eveloped bas
umptions, o
est sequence
reduced: A m
he state trans
state in S and
ery state in th
state transitio
sting and has
d respond to
2
1
b/y
b/x
a/x
a/x
26
diagram of an
table of the FS
In231
on methods
hod and Tra
sed on four c
ne can simp
e generated
minimal FSM
sition functio
d every input
he graph is re
ons.
s the same se
all inputs in
2
3x
x
a/y b/y
FSM, MS
SM in Figure 7
nput b ,y ,y ,x
for FSMs pr
nsition Tour
common assu
ply build a f
through th
M does not ha
on δ and the
t in I.
eachable from
ets of inputs
n I for MS.
3
7-1
resented in S
r method) a
umptions. W
faulty implem
hese method
ave equivalen
output func
m every oth
and outputs
ection 7.1
as well as
Without the
mentation
ds. These
nt states.
ction λ are
er state in
as MS. In
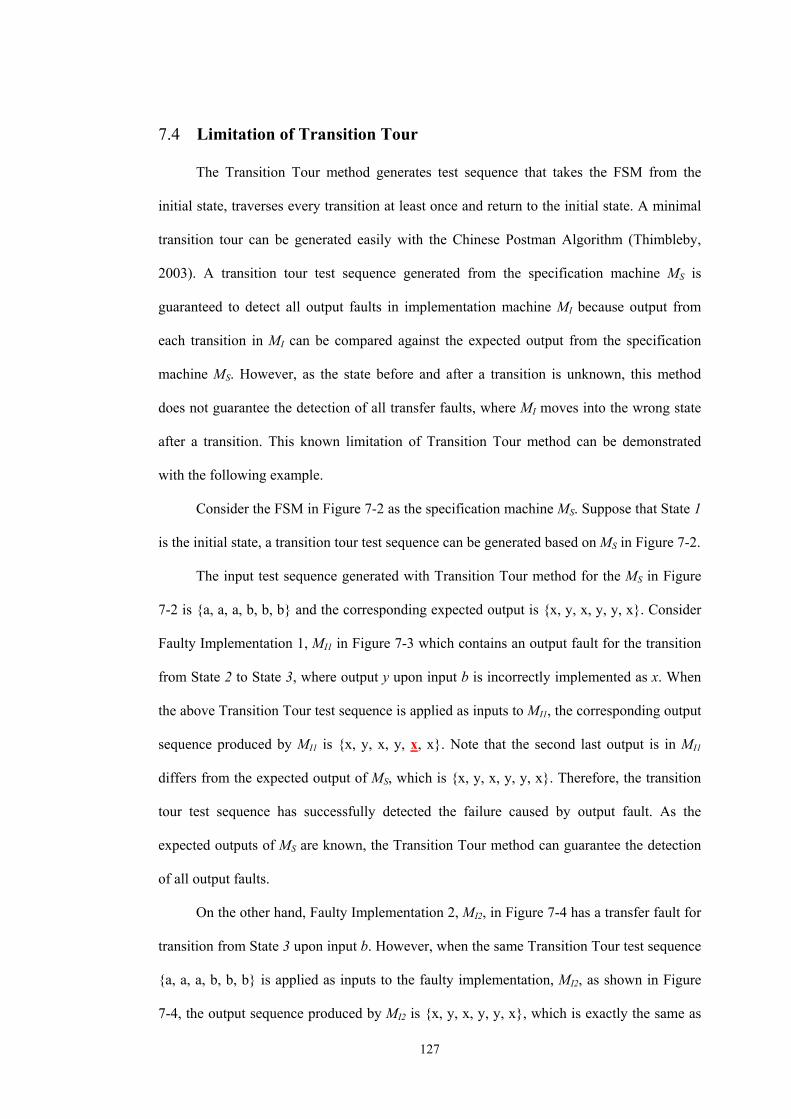
127
7.4 Limitation of Transition Tour
The Transition Tour method generates test sequence that takes the FSM from the
initial state, traverses every transition at least once and return to the initial state. A minimal
transition tour can be generated easily with the Chinese Postman Algorithm (Thimbleby,
2003). A transition tour test sequence generated from the specification machine MS is
guaranteed to detect all output faults in implementation machine MI because output from
each transition in MI can be compared against the expected output from the specification
machine MS. However, as the state before and after a transition is unknown, this method
does not guarantee the detection of all transfer faults, where MI moves into the wrong state
after a transition. This known limitation of Transition Tour method can be demonstrated
with the following example.
Consider the FSM in Figure 7-2 as the specification machine MS. Suppose that State 1
is the initial state, a transition tour test sequence can be generated based on MS in Figure 7-2.
The input test sequence generated with Transition Tour method for the MS in Figure
7-2 is {a, a, a, b, b, b} and the corresponding expected output is {x, y, x, y, y, x}. Consider
Faulty Implementation 1, MI1 in Figure 7-3 which contains an output fault for the transition
from State 2 to State 3, where output y upon input b is incorrectly implemented as x. When
the above Transition Tour test sequence is applied as inputs to MI1, the corresponding output
sequence produced by MI1 is {x, y, x, y, x, x}. Note that the second last output is in MI1
differs from the expected output of MS, which is {x, y, x, y, y, x}. Therefore, the transition
tour test sequence has successfully detected the failure caused by output fault. As the
expected outputs of MS are known, the Transition Tour method can guarantee the detection
of all output faults.
On the other hand, Faulty Implementation 2, MI2, in Figure 7-4 has a transfer fault for
transition from State 3 upon input b. However, when the same Transition Tour test sequence
{a, a, a, b, b, b} is applied as inputs to the faulty implementation, MI2, as shown in Figure
7-4, the output sequence produced by MI2 is {x, y, x, y, y, x}, which is exactly the same as
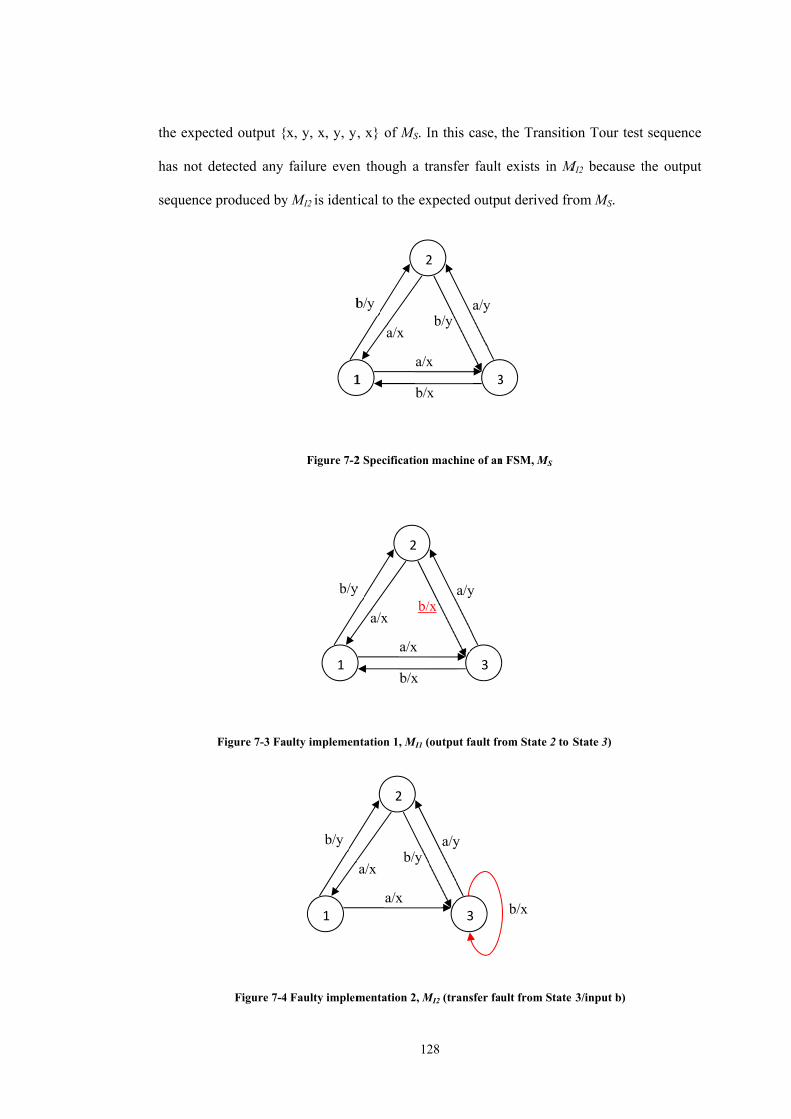
the expec
has not d
sequence
cted output {
detected any
produced by
Figure 7-3 Fa
Figure 7-4
x, y, x, y, y,
failure even
y MI2 is identi
Figure 7-2
ulty implemen
4 Faulty implem
1
b
1
b/y
1
b/y
12
, x} of MS. I
n though a tr
ical to the ex
2 Specification
ntation 1, MI1 (
mentation 2, M
2
1
b/y
b/x
a/x
a/x
2
a/x
b/y a/x
2
y
b/x
a/x
b/a/x
28
In this case,
ransfer fault
xpected outpu
machine of an
(output fault fr
MI2 (transfer fa
2
3x
x
a/y b/y
3
a/y
3
a/y /x
the Transitio
t exists in M
ut derived fr
n FSM, MS
rom State 2 to
ult from State
3
b/x
on Tour test
MI2 because t
rom MS.
State 3)
e 3/input b)
sequence
the output
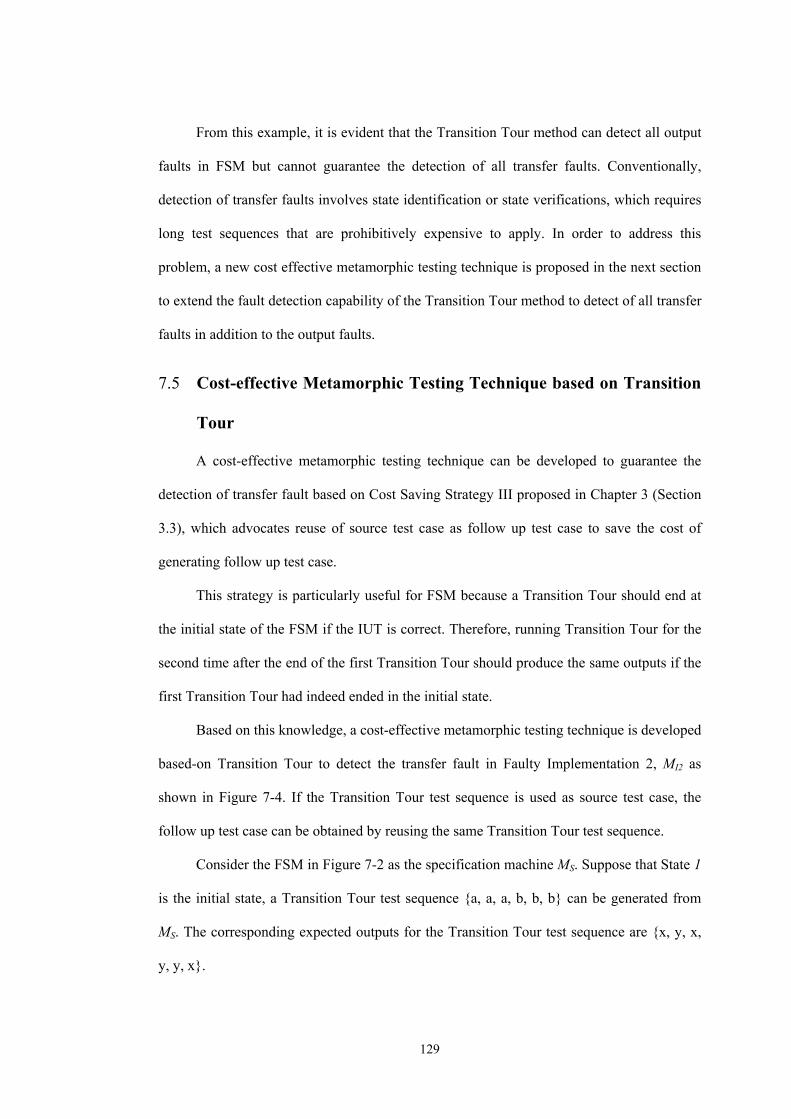
129
From this example, it is evident that the Transition Tour method can detect all output
faults in FSM but cannot guarantee the detection of all transfer faults. Conventionally,
detection of transfer faults involves state identification or state verifications, which requires
long test sequences that are prohibitively expensive to apply. In order to address this
problem, a new cost effective metamorphic testing technique is proposed in the next section
to extend the fault detection capability of the Transition Tour method to detect of all transfer
faults in addition to the output faults.
7.5 Cost-effective Metamorphic Testing Technique based on Transition
Tour
A cost-effective metamorphic testing technique can be developed to guarantee the
detection of transfer fault based on Cost Saving Strategy III proposed in Chapter 3 (Section
3.3), which advocates reuse of source test case as follow up test case to save the cost of
generating follow up test case.
This strategy is particularly useful for FSM because a Transition Tour should end at
the initial state of the FSM if the IUT is correct. Therefore, running Transition Tour for the
second time after the end of the first Transition Tour should produce the same outputs if the
first Transition Tour had indeed ended in the initial state.
Based on this knowledge, a cost-effective metamorphic testing technique is developed
based-on Transition Tour to detect the transfer fault in Faulty Implementation 2, MI2 as
shown in Figure 7-4. If the Transition Tour test sequence is used as source test case, the
follow up test case can be obtained by reusing the same Transition Tour test sequence.
Consider the FSM in Figure 7-2 as the specification machine MS. Suppose that State 1
is the initial state, a Transition Tour test sequence {a, a, a, b, b, b} can be generated from
MS. The corresponding expected outputs for the Transition Tour test sequence are {x, y, x,
y, y, x}.
130
A necessary property of a Transition Tour on FSM is that the Transition Tour test
sequence will bring the FSM back to its initial state upon completion.
Lemma 7-1: For an FSM, repeating the Transition Tour test sequence at the
completion of a Transition Tour will produce the same output sequence as the initial
Transition Tour.
Proof: The initial Transition Tour will bring the FSM back to the initial state.
Therefore, the repeated Transition Tour will start and end at the initial state and produce the
same output sequence as the initial Transition Tour.
Therefore, by using the Transition Tour test sequence as the source test case, if a
repeated Transition Tour is used as follow up test case on an implementation machine MI
which conforms to MS, the resulting output sequence should be equal to the concatenation of
two expected output sequence for the Transition Tour. This necessary property can be used
as the metamorphic relation to detect transfer fault in FSM.
Metamorphic Relation (MR)
This metamorphic relation is designed based on Cost Saving Strategy III which is
reusing source test case as follow up test case. By reusing the source test case as follow
up test case, the cost of generating follow up test cases can be eliminated.
Let ITT be the Transition Tour test sequence. Let OTT be the correct expected output
sequence of Transition Tour test sequence ITT. Let the source test case, Ts = ITT. Run the
Ts on the implementation machine, MI, to obtain its output, f(Ts). Let the follow up test
case be Tf = Ts = ITT. In other words, the same Transition Tour test sequence, ITT, in the
source test case is reused as the follow up test case. Without resetting the
implementation machine, MI, to its initial state after running the source test case, Ts,
continue to run the follow up test case, Tf, on the implementation machine, MI, to obtain
the output f(Tf). The output of source test case, f(Ts) and the output of follow up test
case, f(Tf) must be equal to the correct expected output sequence of Transition Tour test
131
sequence, ITT. This metamorphic relation is partly derived based on Lemma 7-1. In
summary, the metamorphic relation can be defined as:
MR: If Tf=ITT AND Ts=ITT, then f(Tf)=OTT AND f(Ts)= OTT, when Tf is run after the
completion of Ts without resetting the implementation machine, MI, to its initial state.
In this case, the source test case is fully reused as follow up test case, hence saving
the cost of generating follow up test case. As an example, the source test case for the
specification machine MS in Figure 7-2 is {a, a, a, b, b, b}. The corresponding follow up test
case {a, a, a, b, b, b} can be obtained by simply reusing the source test case.
7.6 Proof of Fault Detection Capability for all Transfer Faults
The metamorphic relation proposed can be used to detect the transfer fault in Faulty
Implementation 2, MI2, as shown in Figure 7-4. Let ITT={a, a, a, b, b, b} be the Transition
Tour test sequence used as the source test case and let OTT={x, y, x, y, y, x} be the correct
expect output sequence for ITT. By reusing the source test case as follow up test case, the
same Transition Tour test sequence ITT={a, a, a, b, b, b} is used as follow up test case.
In order to perform the proposed metamorphic testing technique on Faulty
Implementation 2, MI2, as shown in Figure 7-4, the Transition Tour test sequence ITT={a, a,
a, b, b, b} is first run or executed as source test case on MI2. The actual output test sequence
of {x, y, x, y, y, x} for the source test case is obtained and it is equal to the correct expected
output sequence which is OTT={x, y, x, y, y, x}. Therefore, no transfer fault is detected after
the completion of source test case execution.
The same Transition Tour test sequence ITT={a, a, a, b, b, b} used as source test case
is then reused as the follow up test case. Note that after the completion of source test case,
Faulty Implementation 2, MI2, as shown in Figure 7-4, now incorrectly ended at State 3
instead of State 1. Without resetting MI2 to its initial state after the completion of the source
test case, continue to run the follow up test case on MI2. Because of the transfer fault, the
follow up test case now start in State 3 instead of the correct initial state, which is State 1.
132
Therefore, the output sequence produced by MI2 for the follow up test case is {y, x, x, x, x,
x}. This output sequence violates the MR because it is different from the correct expected
output sequence which is OTT={x, y, x, y, y, x}. Hence, the transfer fault in MI2 has been
successfully detected using the metamorphic relation proposed.
Further to the above example on detection of transfer fault in Faulty Implementation
2, MI2, as shown in Figure 7-4, the following proofs show that the proposed metamorphic
testing technique can guarantee the detection of all transfer faults in FSM.
Lemma 7-2: If a transfer fault (change of end state for a transition) exists in the
implementation machine MI, then the Transition Tour test sequence will not produce the
correct expected outputs AND end at the initial state of MI.
Proof: If the end state of a transition has changed from State 1 to State 2, applying the
Transition Tour test sequence on MI can only produce the correct expected outputs AND
end at the initial state of MI iff State 1 and State 2 are equivalent. However, if State 1 and
State 2 are equivalent, then change of end state for a transition from State 1 to State 2 will
not cause a transfer fault in MI (proof by contradiction).
Definition 7-1: A “Source and Follow up Transition Tour” test sequence is a
concatenation of two Transition Tour test sequence, one after another.
Theorem 7-1: A Source and Follow up Transition Tour test sequence can detect all
transfer faults in MI.
Proof: Based on Lemma 7-2, applying a Source and Follow up Transition Tour to an
implementation machine MI with transfer fault, MI will not produce the concatenation of two
expected output sequences of the Transition Tour.
Therefore, by using the Source and Follow up Transition Tour test sequence as
proposed in the MR, all transfer faults in the FSM can be detected. Hence, the proposed
metamorphic testing technique has overcome this long standing limitation of Transition
Tour in guaranteeing the detection of transfer faults. The proposed technique has effectively
133
extended the fault detection capability of Transition Tour from detection of all output faults
to detection of all output and transfer faults.
7.7 Reusability to Detect RESET Fault
A RESET input in FSM is an input that will bring the FSM from any present state
back to its initial state. Therefore, a RESET fault in FSM refers to the fault whereby the
RESET input fails to bring the FSM back to the initial state as intended. Conventionally,
detection of RESET fault requires state identification to determine that the RESET input has
indeed brought the FSM back to its initial state.
However, based on the fact that a RESET input can bring the FSM back to its initial
state, the proposed metamorphic relation can be reused to detect RESET faults where the
RESET input fails to bring implementation machine MI back to its initial state. This can be
done by using a test sequence that ends with a RESET input as source test case reuse this
test sequence as follow up test case. If a RESET fault exists in the implementation machine
MI, the incorrectly implemented RESET input will not bring the FSM back to its initial
state. Therefore, repeating the test sequence will not produce concatenation of two expected
output sequence based on the specification machine MS.
7.8 Discussions
Despite its limited capability to detect transfer faults in FSM, Transition Tour method
remains a popular choice for FSM testing in practice because of its simplicity and shorter
test sequence compared to other FSM testing methods. In this chapter, a cost-effective
metamorphic testing technique has been proposed to detect transfer faults in FSM which
cannot be detected by the conventional Transition Tour method. Unlike conventional
Transition Tour that can only guarantee the detection of output faults, the proposed
metamorphic testing technique extends the fault detection capability of Transition Tour
method to guarantee the detection of transfer faults in FSM.
134
Existing FSM testing methods such as D-method, W-method, Wp-method and U-
method rely on long test sequences for state identification and/or state verification to detect
transfer faults. Such long test sequences are prohibitively expensive to be executed,
particularly on reactive systems that require manual activation of inputs. To address this
problem, the proposed cost-effective metamorphic testing technique has eliminated the
needs of state identification and/or state verification in detection of transfer fault in FSM.
Unlike D-method, W-method, Wp-method and U-method, the proposed method is based on
Transition Tour which does not require state identification and/or state verification.
Therefore, the resulting test sequence is significantly shorter. Furthermore, the metamorphic
testing technique proposed to detect transfer faults is applicable for all FSMs. Unlike D-
method and U-method which cannot be applied to test FSMs that do not have unique input
and output sequence for each state, the proposed technique only requires the use and reuse
of Transition Tour test sequence which exists for all FSMs. In addition to detecting transfer
faults in FSM, the proposed method can also be reused to detect RESET faults in FSM
without state identification.
Conformance testing of FSM is used to test many reactive systems ranging from
sequential circuits, communication protocols, embedded systems to complex reactive
software systems. In view of this, the proposed metamorphic testing technique can improve
the cost-effectiveness of the testing process for these applications because of its shorter test
sequences and capability to detect both output faults and transfer faults.
135
8 Conclusions and Recommendations
8.1 Conclusions
Due to increasing complexity of software applications, the oracle problem has
become a pervasive fundamental problem in software testing. Metamorphic testing has been
proposed as an effective testing approach to detect failures in software with oracle problem.
However, the ability to detect failures in software with oracle problem comes with
additional costs which are inherent parts of the metamorphic testing approach. In addition to
the need to identify metamorphic relations, the number of test cases that needs to be
generated and executed in metamorphic testing is at least double of those in conventional
testing where the oracle is available. Furthermore, an output checker is also required for
each metamorphic relation used in metamorphic testing. These incur additional costs to the
testing process.
This study has presented the first extensive attempt to address the cost problem in
metamorphic testing. In order to achieve the objectives outlined in Chapter 1 (Section 1.3),
the metamorphic testing procedures and functional components have been analyzed in
Chapter 3 to identify the additional costs incurred in metamorphic testing. Based on the
analyses, six cost saving strategies have been proposed to reduce or eliminate the additional
costs of metamorphic testing. Collectively, these cost saving strategies and their adoption to
develop new cost-effective metamorphic testing techniques form the main novelty of this
thesis. By adopting these cost-saving strategies, cost-effective metamorphic testing
techniques have been designed and developed in Chapter 4, 5, 6 and 7, respectively to detect
failures in four different software applications with oracle problems.
In Chapter 4, reuse of metamorphic relations (Cost Saving Strategy I) and use of
readily available test cases (Cost Saving Strategy II) have been adopted to develop a cost-
effective metamorphic testing technique for an edge detection program in image processing
domain. Experiments have been conducted to evaluate the failure detection capability of the
136
proposed cost-effective metamorphic testing techniques on edge detection programs with
both seeded faults and real fault. The experimental results have shown that the reused
metamorphic relations have successfully detected up to 90% of the faulty edge detection
programs. These results are better than their original failure detection effectiveness in
Euclidean Distance Transformation program (Mayer and Guderlei, 2006b) where the
metamorphic relations have been obtained for reuse.
In Chapter 5, a novel cost-effective metamorphic testing technique has been proposed
to detect failures in financial charting software. The metamorphic testing technique
proposed adopts the use of existing test cases as source test cases (Cost Saving Strategy II),
partial reuse of source test case as follow up test case (Cost Saving Strategy III), reuse of the
output of source test case as follow up test case (Cost Saving Strategy IV) and partial
checking of test outputs (Cost Saving Strategy VI) to reduce the cost of metamorphic
testing. In addition, the viability of reusing the metamorphic relations proposed (Cost
Saving Strategy I) in other charting software components has also been examined.
Experiments have been conducted to evaluate the failure detection capability of the
proposed cost-effective metamorphic testing technique to detect actual failures in pre-
release versions of commercially available charting software component which contain real-
life faults. The experimental results have shown that the proposed cost-effective
metamorphic testing technique has successfully detected failures in these pre-release
versions of charting software components.
Chapter 6 has presented a novel cost-effective metamorphic testing technique for
computation of real-time technical indicators for trading software based on pairing of real-
time streaming test cases (Cost Saving Strategy V) which effectively eliminates the need to
generate source test cases and follow up test cases. Experiments have been conducted to
evaluate the failure detection capability of the proposed cost-effective metamorphic testing
techniques by testing real-time indicators with seeded faults on a commercially available
software package, MetaTrader 4 Client Terminal. Once again, the experimental results have
137
shown that the proposed cost-effective metamorphic testing techniques have successfully
detected failures in all faulty real-time indicators.
Finally, in Chapter 7, reuse of source test case as follow up test case (Cost Saving
Strategy III) has been adopted to develop a new metamorphic testing technique based on
Transition Tour method to detect transfer fault in finite state machine (FSM). Theoretical
analysis has been used to prove that the proposed cost-effective metamorphic testing
technique is able to guarantee the detection of transfer faults, in addition to output faults in
FSM. The reusability of the proposed metamorphic relation to detect RESET faults in FSM
has also been studied. Apart from improving cost-effectiveness, the proposed technique has
also overcome a long standing fundamental limitation of the existing transition tour method
for FSM in guaranteeing the detection of transfer faults.
Despite the simplicity and generic nature of the proposed cost-saving strategies,
empirical and analytical studies conducted have shown that metamorphic testing techniques
developed by adopting these strategies are effective and have superior or optimal failure
detection performances. The experimental results in Chapter 4 have shown that the reused
metamorphic relations have successfully detected up to 90% of the faulty edge detection
programs, which out-perform existing approach in the literature. On the other hand, cost-
effective metamorphic testing techniques presented in Chapter 5 and Chapter 6 have also
demonstrated optimal performance by detecting all faulty programs with seeded faults and
real faults. Finally, theoretical analysis done in Chapter 7 has proven that the proposed cost-
effective metamorphic testing technique can guarantee the detection all FSM with transfer
faults and RESET faults.
Overall, this thesis contributes towards advancing the state-of-the-art of testing
software with oracle problem in general and improving the cost-effectiveness of
metamorphic testing techniques specifically.
138
8.2 Recommendations of Future Work
Based on the work presented in this thesis, some future working directions that can be
investigated are outlined below:
1. Developing a Library for Metamorphic Relations
The experiments and analyses presented in Chapter 4 and Chapter 5 of this thesis show
that reuse of existing metamorphic relations from similar or related software
applications is not only viable but also highly effective for failure detection. In software
engineering, the existence of library is a key enabler for cost-effective and wide-spread
adoption for many algorithms and application areas. For example, extensive code
libraries exist for popular algorithms and application areas such as neural-network
(Nissen, 2003), computer vision (Bradski and Kaehler, 2008) and astrophysics
(Mignone et al., 2007), just to name a few. As a maturing software testing technique
which has been successfully deployed in testing more than 50 software applications
spanning across 15 application areas, developing a library for metamorphic relations
will be pivotal in steering the adoption of metamorphic testing from research
community into the software testing industry. Unlike library of codes, developing a
library for metamorphic relations requires more than a code base. A common
framework or model needs to be established to provide a standardized and accurate way
to specify metamorphic relations. Such framework or model could adopt formal
approach as proposed by Hui and Huang (2013) or informal approach which could be
easily understood and widely adopted by non-technical users. Apart from having a
repository of existing metamorphic relations for software applications in which they
have been successfully deployed, the library could also be extended to include code
base for follow up test case generators and output checkers for these metamorphic
relations. Through these libraries, the cost saving benefits of reusing metamorphic
relations as proposed in this thesis will be accessible to software testing practitioners
because not only the metamorphic relations from similar or related applications can be
139
reused, the corresponding follow up test case generators and output checkers for these
metamorphic relations can also be reused.
2. A Framework for Metamorphic Relation Identification
For application areas where metamorphic testing has never been deployed before, reuse
of existing metamorphic relations is not possible. In these cases, identification of
metamorphic relations is a necessary task that cannot be avoided. Even though early
attempts have been made to automatically derive metamorphic relations (Liu et al.,
2012b; Kanewala and Bieman, 2013; Zhang et al., 2014), they were either confined to
certain software applications or designed to generate certain types of metamorphic
relations only. Furthermore, there is no framework or systematic guideline for
metamorphic relation identification. As a result, identification of metamorphic relations
is often done in an ad hoc manner based on the experience and knowledge of the testers.
This could be a barrier for that hinders the deployment of metamorphic by software
testing practitioners. To address this problem, a framework or comprehensive guideline
can be developed to provide a systematic way of identifying metamorphic relations. As
metamorphic relations can be derived from the specifications of the software or its
source codes, such frameworks or guidelines should be developed to aid methodological
identification of metamorphic relations from either one or both the specification
documentations or the source codes.
3. Mining Software Failures from Big Data
Even though “pairing of existing test cases” has been proposed as a cost saving strategy
for metamorphic testing in this thesis, it has the potential to be used as a novel technique
to mine software failures beyond testing phase in the software development life-cycle.
With the emergence of big data (McAfee et al., 2012; Mayer-Schönberger and Cukier,
2013), large volumes of usage data are being collected by software applications as they
are being used by the users. These data are usually mined for business intelligence.
However, by adopting “pairing of existing test cases” approach, metamorphic testing
140
could be used to mine failures (incorrect or inaccurate outputs) from the usage data
collected. This approach has several benefits. First and foremost, oracles do not need to
be constructed as metamorphic testing is used to detect failures. Secondly, it leverages
on the data collected from actual user interactions with the software applications.
Hence, the cost of generating and running test cases can be fully eliminated.
Furthermore, actual usage data contain failures that are actually encountered by the
users. However, the main challenge is to develop efficient algorithms to pair large
volume of usage data into source test case and follow up test case pairs for metamorphic
testing. Furthermore, efficient output checkers needs to be developed to detect failures
in the large number of source test case and follow up test case pairs mined from the
usage data. To this end, Cost Saving Strategy V proposed in this thesis, which is partial
checking of test outputs, can be adopted to address this challenge.
It is hoped that the work done in this thesis as well as these future working directions
will stimulate further interests and development to advance metamorphic testing into a
mature and widely adopted testing approach in the software testing industry not only to
alleviate the oracle problem but also towards holistic improvement of software quality.
141
References
ACHELIS, S. B. 2001. Technical Analysis from A to Z, McGraw Hill New York. ADLEMAN, L. M., HUANG, M.-D. & KOMPELLA, K. 1995. Efficient checkers for
number-theoretic computations. Information and Computation, 121, 93-102.
AICHERNIG, B. K. 2003. Contract-based testing. Formal Methods at the Crossroads.
From Panacea to Foundational Support. Springer.
ALAKEEL, A. M. 2010. An algorithm for efficient assertions-based test data generation.
Journal of Software, 5, 644-653.
APFELBAUM, L. & DOYLE, J. 1997. Model based testing. Software Quality Week
Conference, 296-300.
ARCHER, M. D. & BICKFORD, J. L. 2007. The Forex chartist companion: a visual
approach to technical analysis, John Wiley & Sons.
ARUNA, C. & PRASAD, R. 2014a. Metamorphic relations to improve the test accuracy of
Multi Precision Arithmetic software applications. International Conference on
Advances in Computing, Communications and Informatics (ICACCI), IEEE, 2244-
2248.
ARUNA, C. & PRASAD, R. S. R. 2014b. Testing Approach for Dynamic Web Applications
Based on Automated Test Strategies. Proceedings of the 48th Annual Convention
of Computer Society of India ICT and Critical Infrastructure, II, Springer, 399-410.
ASRAFI, M., LIU, H. & KUO, F.-C. 2011. On testing effectiveness of metamorphic
relations: A case study. Fifth International Conference on Secure Software
Integration and Reliability Improvement (SSIRI), IEEE, 147-156.
AVIZIENIS, A. 1985. The N-version approach to fault-tolerant software. IEEE
Transactions on software engineering, 11, 1491-1501.
BAI, X., WANG, Y., DAI, G., TSAI, W.-T. & CHEN, Y. 2007. A framework for contract-
based collaborative verification and validation of web services. Component-Based
Software Engineering, Lecture Notes in Computer Science, 4608, Springer, 258-
273.
BARR, E., HARMAN, M., MCMINN, P., SHAHBAZ, M. & YOO, S.-I. 2015. The oracle
problem in software testing: A survey. IEEE Transactions on Software Engineering,
41, 507-525.
142
BARUS, A., CHEN, T. Y., GRANT, D., KUO, F.-C. & LAU, M. F. 2011. Testing of
heuristic methods: A case study of greedy algorithm. Software Engineering
Techniques, Lecture Notes in Computer Science, 4980, Springer, 246-260.
BATRA, G. & SENGUPTA, J. 2011. An Efficient Metamorphic Testing Technique Using
Genetic Algorithm. Information Intelligence, Systems, Technology and
Management, Communications in Computer and Information Science, 141,
Springer, 180-188.
BEHREND, A., DORAU, C., MANTHEY, R. & SCHÜELLER, G. 2008. Incremental
view-based analysis of stock market data streams. Proceedings of the 2008
international symposium on Database engineering & applications, ACM, 269-275.
BEIZER, B. 1995. Black-box testing: techniques for functional testing of software and
systems, John Wiley & Sons, Inc.
BEKRAR, S., BEKRAR, C., GROZ, R. & MOUNIER, L. 2011. Finding software
vulnerabilities by smart fuzzing. Fourth IEEE International Conference on
Software Testing, Verification and Validation, IEEE, 427-430.
BELL, J., MURPHY, C. & KAISER, G. 2015. Metamorphic Run-time Checking of
Applications With-out Test Oracles. CrossTalk, 9, 9-13.
BERNOT, G., GAUDEL, M. C. & MARRE, B. 1991. Software testing based on formal
specifications: a theory and a tool. Software Engineering Journal, 6, 387-405.
BEYDEDA, S. 2006. Self-metamorphic-testing components. 30th Annual International
Computer Software and Applications Conference (COMPSAC'06), IEEE, 265-272.
BINDER, R. V. 2000. Testing object-oriented systems: models, patterns, and tools,
Addison-Wesley Longman Publishing, Boston, MA.
BLUM, M. & KANNAN, S. 1995. Designing programs that check their work. Journal of
the ACM (JACM), 42, 269-291.
BOEHM, B. W. 1981. Software engineering economics, Prentice-hall Englewood Cliffs
(NJ).
BOETTICHER, G. D. 2009. From software engineer to day trader in 3 easy steps: a
comparison of software engineering (SE) data mining with financial data mining.
Proceedings of the 5th International Conference on Predictor Models in Software
Engineering, ACM, 14.
BOUQUET, F., GRANDPIERRE, C., LEGEARD, B., PEUREUX, F., VACELET, N. &
UTTING, M. A 2007. Subset of precise UML for model-based testing. Proceedings
of the 3rd international workshop on Advances in model-based testing, ACM, 95-
104.
143
BOZKURT, M. & HARMAN, M. 2011. Automatically generating realistic test input from
web services. 6th IEEE International Symposium on Service Oriented System
Engineering (SOSE), IEEE, 13-24.
BRADSKI, G. & KAEHLER, A. 2008. Learning OpenCV: Computer vision with the
OpenCV library, O'Reilly Media, Inc..
BRIAND, L. C., DI PENTA, M. & LABICHE, Y. 2004. Assessing and improving state-
based class testing: A series of experiments. IEEE Transactions on Software
Engineering, 30, 770-783.
BRIAND, L. C., LABICHE, Y. & SÓWKA, M. M. 2006. Automated, contract-based user
testing of commercial-off-the-shelf components. Proceedings of the 28th
international conference on Software Engineering, ACM, 92-101.
BROCK, W., LAKONISHOK, J. & LEBARON, B. 1992. Simple technical trading rules
and the stochastic properties of stock returns. The Journal of Finance, 47, 1731-
1764.
BURNETT, M., COOK, C. & ROTHERMEL, G. 2004. End-user software engineering.
Communications of the ACM, 47, 53-58.
BUXTON, J. N. & RANDELL, B. 1970. Software Engineering Techniques: Report on a
Conference Sponsored by the NATO Science Committee, NATO Science
Committee; available from Scientific Affairs Division, NATO.
CACHIN, C. & SCHUNTER, M. T. 2011. A cloud you can trust. Spectrum, IEEE, 48, 28-
51.
CANNY, J. 1986. A computational approach to edge detection. IEEE Transactions on
Pattern Analysis and Machine Intelligence, 8, 679-698.
CAO, Y., ZHOU, Z. Q. & CHEN, T. Y. 2013. On the correlation between the effectiveness
of metamorphic relations and dissimilarities of test case executions. 13th IEEE
International Conference on Quality Software (QSIC), IEEE, 153-162.
CASTRO-CABRERA, C. & MEDINA-BULO, I. An approach to metamorphic testing for
WS-BPEL compositions. 2011 Proceedings of the IEEE International Conference
on e-Business (ICE-B), IEEE, 1-6.
CASTRO-CABRERA, C. & MEDINA-BULO, I. 2012. Application of Metamorphic
Testing to a Case Study in Web Services Compositions. E-Business and
Telecommunications, Communications in Computer and Information Science, 314,
Springer, 168-181.
CHAN, F., CHEN, T., CHEUNG, S., LAU, M. & YIU, S. 1998. Application of
metamorphic testing in numerical analysis. Proceedings of the IASTED
International Conference on Software Engineering (SE’98), 191-197.
144
CHAN, W., CHEN, T. Y., CHEUNG, S., TSE, T. & ZHANG, Z. 2007a. Towards the
testing of power-aware software applications for wireless sensor networks. Reliable
Software Technologies–Ada Europe 2007, Lecture Notes in Computer Science,
4498, Springer, 84-99.
CHAN, W., CHEN, T. Y., LU, H., TSE, T. & YAU, S. S. 2005a. A metamorphic approach
to integration testing of context-sensitive middleware-based applications. Fifth
International Conference on Quality Software (QSIC 2005), IEEE, 241-249.
CHAN, W., CHEN, T. Y., LU, H., TSE, T. & YAU, S. S. 2006. Integration testing of
context-sensitive middleware-based applications: a metamorphic approach.
International Journal of Software Engineering and Knowledge Engineering, 16,
677-703.
CHAN, W., CHEUNG, S. & LEUNG, K. 2005b. Towards a metamorphic testing
methodology for service-oriented software applications. Fifth International
Conference on Quality Software (QSIC 2005), IEEE, 470-476.
CHAN, W., CHEUNG, S. & LEUNG, K. R. 2007b. A metamorphic testing approach for
online testing of service-oriented software applications. International Journal of
Web Services Research (IJWSR), 4, 61-81.
CHARETTE, R. N. 2005. Why software fails. IEEE spectrum, 42, 36.
CHEN, L. & AVIZIENIS, A. 1978. N-version programming: A fault-tolerance approach to
reliability of software operation. Digest of Papers FTCS-8: Eighth Annual
International Conference on Fault Tolerant Computing, 3-9.
CHEN, L., CAI, L., LIU, J., LIU, Z., WEI, S. & LIU, P. 2012. An optimized method for
generating cases of metamorphic testing. 6th International Conference on New
Trends in Information Science and Service Science and Data Mining (ISSDM),
IEEE, 439-443.
CHEN, T., HUANG, D., TSE, T. & ZHOU, Z. Q. 2004a. Case studies on the selection of
useful relations in metamorphic testing. Proceedings of the 4th Ibero-American
Symposium on Software Engineering and Knowledge Engineering (JIISIC 2004),
569-583.
CHEN, T. Y., CHEUNG, S. C. & YIU, S. 1998. Metamorphic testing: a new approach for
generating next test cases. Department of Computer Science, Hong Kong University
of Science and Technology, Tech. Rep. HKUST-CS98-01.
CHEN, T. Y., FENG, J. & TSE, T. 2002a. Metamorphic testing of programs on partial
differential equations: a case study. 26th Annual International Computer Software
and Applications Conference (COMPSAC 2002), IEEE, 327-333.
145
CHEN, T. Y., HO, J. W., LIU, H. & XIE, X. 2009a. An innovative approach for testing
bioinformatics programs using metamorphic testing. BMC bioinformatics, 10, 24.
CHEN, T. Y., KUO, F.-C., LIU, H. & WANG, S. 2009b. Conformance testing of network
simulators based on metamorphic testing technique. Formal Techniques for
Distributed Systems, Lecture Notes in Computer Science, 5522, Springer, 243-248.
CHEN, T. Y., KUO, F.-C., LIU, Y. & TANG, A. 2004b. Metamorphic Testing and Testing
with Special Values. SNPD, 128-134.
CHEN, T. Y., KUO, F.-C., MERKEL, R. & TAM, W. K. 2009c.Testing an open source
suite for open queuing network modelling using metamorphic testing technique.
14th IEEE International Conference on Engineering of Complex Computer
Systems, IEEE, 23-29.
CHEN, T. Y., KUO, F.-C., TAM, W. K. & MERKEL, R. G. 2011a. Testing a Software-
based PID Controller using Metamorphic Testing. Proceedings of the 1st
International Conference on Pervasive and Embedded Computing and
Communication Systems (PECCS 2011), 387-396.
CHEN, T. Y., KUO, F.-C. & ZHOU, Z. Q. 2005. An effective testing method for end-user
programmers. ACM SIGSOFT Software Engineering Notes, 30, 1-5.
CHEN, T. Y. & LAU, M. F. 1998. A new heuristic for test suite reduction. Information and
Software Technology, 40, 347-354.
CHEN, T. Y., LAU, M. F., SIM, K. Y. & SUN, C. 2009d. On detecting faults for Boolean
expressions. Software Quality Journal, 17, 245-261.
CHEN, T. Y., TSE, T. & QUAN ZHOU, Z. 2003. Fault-based testing without the need of
oracles. Information and Software Technology, 45, 1-9.
CHEN, T. Y., TSE, T. & ZHOU, Z. 2002b. Semi-proving: an integrated method based on
global symbolic evaluation and metamorphic testing. ACM SIGSOFT Software
Engineering Notes, 27, ACM, 191-195.
CHEN, T. Y., TSE, T. & ZHOU, Z. Q. 2011b. Semi-proving: An integrated method for
program proving, testing, and debugging. IEEE Transactions on Software
Engineering, 37, 109-125.
CHEON, Y. & LEAVENS, G. T. 2002. A simple and practical approach to unit testing: The
JML and JUnit way. ECOOP 2002—Object-Oriented Programming, Lecture Notes
in Computer Science, 2374, Springer, 231-255.
CHONG, N. S., WONG, D. M. L., SIM, K. Y., GOI, B. M. & LING, H. C. 2010. Hardware
Accelerated Sobel Edge Detection Using Common GPU Parallel Computing
146
Platform. Conference on Electrical and Electronic Technology, 4th World
Engineering Congress (CEET-WEC2010), Kuching, Malaysia.
CHOW, T. S. 1978. Testing software design modeled by finite-state machines. IEEE Trans.
Software Eng., 4, 178-187.
COLLOFELLO, J. S. & WOODFIELD, S. N. 1989. Evaluating the effectiveness of
reliability-assurance techniques. Journal of Systems and Software, 9, 191-195.
COPPIT, D. & HADDOX-SCHATZ, J. M. 2005. On the Use of Specification-Based
Assertions as Test Oracles. 29th Annual IEEE/NASA Software Engineering
Workshop, 305-314.
CSALLNER, C., TILLMANN, N. & SMARAGDAKIS, Y. 2008. DySy: Dynamic symbolic
execution for invariant inference. Proceedings of the 30th international conference
on Software engineering, ACM, 281-290.
CUMMING, D. 2010. Haven’t found that software glitch, Toyota? Keep trying. Los Angeles
Times, 360.
DAI, G., BAI, X., WANG, Y. & DAI, F. 2007. Contract-based testing for web services.
31st Annual International Computer Software and Applications Conference
(COMPSAC 2007), IEEE, 517-526.
DALAL, S. R., JAIN, A., KARUNANITHI, N., LEATON, J., LOTT, C. M., PATTON, G.
C. & HOROWITZ, B. M. 1999. Model-based testing in practice. Proceedings of
the 21st international conference on Software engineering, ACM, 285-294.
DAMM, W., HUNGAR, H., JOSKO, B., PEIKENKAMP, T. & STIERAND, I. 2011. Using
contract-based component specifications for virtual integration testing and
architecture design. Design, Automation & Test in Europe Conference &
Exhibition (DATE), IEEE, 1-6.
DANIELSSON, P.-E. 1980. Euclidean distance mapping. Computer Graphics and image
processing, 14, 227-248.
DAVIS, M. D. & WEYUKER, E. J. 1981. Pseudo-oracles for non-testable programs.
Proceedings of the ACM'81 Conference, ACM, 254-257.
DE VILLIERS, V. 1933. The point and figure method of anticipating stock price
movements: complete theory and practice, Stock Market Publications.
DEMILLO, R. A., LIPTON, R. J. & SAYWARD, F. G. 1978. Hints on test data selection:
Help for the practicing programmer. Computer, 11, 34-41.
DETRY, P. & GREGOIRE, P. 2001. Other evidences of the predictive power of technical
analysis: the moving averages rules on European indexes. EFMA 2001 Lugano
Meetings, 1-25.
147
DING, J., WU, T., LU, J. Q. & HU, X.-H. 2010. Self-checked metamorphic testing of an
image processing program. Fourth International Conference on Secure Software
Integration and Reliability Improvement (SSIRI), IEEE, 190-197.
DING, J., WU, T., WU, D., LU, J. Q. & HU, X.-H. 2011. Metamorphic testing of a Monte
Carlo modeling program. Proceedings of the 6th International Workshop on
Automation of Software Test, ACM, 1-7.
DOONG, R.-K. & FRANKL, P. G. 1994. The ASTOOT approach to testing object-oriented
programs. ACM Transactions on Software Engineering and Methodology (TOSEM),
3, 101-130.
DOROFEEVA, R., EL-FAKIH, K., MAAG, S., CAVALLI, A. R. & YEVTUSHENKO, N.
2010. FSM-based conformance testing methods: a survey annotated with
experimental evaluation. Information and Software Technology, 52, 1286-1297.
DOWSON, M. 1997. The Ariane 5 software failure. ACM SIGSOFT Software Engineering
Notes, 22, 84.
ELBAUM, S., MALISHEVSKY, A. G. & ROTHERMEL, G. 2002. Test case prioritization:
A family of empirical studies. IEEE Transactions on Software Engineering, 28,
159-182.
ENDO, A. T. & SIMAO, A. 2013. Evaluating test suite characteristics, cost, and
effectiveness of FSM-based testing methods. Information and Software Technology,
55, 1045-1062.
ERNST, M. D., COCKRELL, J., GRISWOLD, W. G. & NOTKIN, D. 2001. Dynamically
discovering likely program invariants to support program evolution. IEEE
Transactions on Software Engineering, 27, 99-123.
ERNST, M. D., PERKINS, J. H., GUO, P. J., MCCAMANT, S., PACHECO, C.,
TSCHANTZ, M. S. & XIAO, C. 2007. The Daikon system for dynamic detection of
likely invariants. Science of Computer Programming, 69, 35-45.
EVERETT, G. D. & MCLEOD JR, R. 2007. Software testing: testing across the entire
software development life cycle, John Wiley & Sons.
FELDT, R. 1998. Generating diverse software versions with genetic programming: an
experimental study. IEE Proceedings-Software, 145, 228-236.
FITZGERALD, J. & LARSEN, P. G. 2009. Modelling systems: practical tools and
techniques in software development, Cambridge University Press.
FLANAGAN, C. & LEINO, K. R. M. 2001. Houdini, an annotation assistant for ESC/Java.
FME 2001: Formal Methods for Increasing Software Productivity, Lecture Notes in
Computer Science, 2021, Springer, 500-517.
148
FRAKES, W. B. & KANG, K. 2005. Software reuse research: Status and future. IEEE
transactions on Software Engineering, 31, 529-536.
FUJIWARA, S., KHENDEK, F., AMALOU, M. & GHEDAMSI, A. 1991. Test selection
based on finite state models. IEEE Transactions on Software Engineering, 17, 591-
603.
GEHRIG, T. & MENKHOFF, L. 2006. Extended evidence on the use of technical analysis
in foreign exchange. International Journal of Finance & Economics, 11, 327-338.
GEWEHR, J. E., SZUGAT, M. & ZIMMER, R. 2007. BioWeka—extending the weka
framework for bioinformatics. Bioinformatics, 23, 651-653.
GONZALEZ, R. C. & WOODS, R. E. 2002. Digital image processing. Prentice hall Upper
Saddle River, NJ:.
GRAVES, T. L., HARROLD, M. J., KIM, J.-M., PORTER, A. & ROTHERMEL, G. 2001.
An empirical study of regression test selection techniques. ACM Transactions on
Software Engineering and Methodology (TOSEM), 10, 184-208.
GROSS, P., BOULANGER, A., ARIAS, M., WALTZ, D. L., LONG, P. M., LAWSON, C.,
ANDERSON, R., KOENIG, M., MASTROCINQUE, M. & FAIRECHIO, W. 2006.
Predicting electricity distribution feeder failures using machine learning
susceptibility analysis. Proceedings of the National Conference on Artificial
Intelligence, Menlo Park, CA; Cambridge, MA; London; AAAI Press; MIT Press;
1705-1711.
GUDERLEI, R. & MAYER, J. 2007a. Statistical metamorphic testing testing programs with
random output by means of statistical hypothesis tests and metamorphic testing.
Seventh International Conference on Quality Software (QSIC'07), IEEE, 404-409.
GUDERLEI, R. & MAYER, J. 2007b. Towards automatic testing of imaging software by
means of random and metamorphic testing. International Journal of Software
Engineering and Knowledge Engineering, 17, 757-781.
GUDMUNDSSON, M., EL-KWAE, E. A. & KABUKA, M. R. 1998. Edge detection in
medical images using a genetic algorithm. IEEE Transactions on Medical Imaging,
17, 469-474.
HALL, A. 1990. Seven myths of formal methods. Software, IEEE, 7, 11-19.
HAMLET, R. 1994. Random testing. Encyclopedia of software Engineering.
HARROLD, M. J., ROTHERMEL, G., SAYRE, K., WU, R. & YI, L. 2000. An empirical
investigation of the relationship between spectra differences and regression faults.
Software Testing Verification and Reliability, 10, 171-194.
HECKEL, R. & LOHMANN, M. 2005. Towards contract-based testing of web services.
Electronic Notes in Theoretical Computer Science, 116, 145-156.
149
HEINEMAN, G. T. & COUNCILL, W. T. 2001. Component-based software engineering.
Putting the Pieces Together, Addison-Westley.
HELM, R., HOLLAND, I. M. & GANGOPADHYAY, D. 1990. Contracts: specifying
behavioral compositions in object-oriented systems, Proceedings of the European
conference on object-oriented programming on Object-oriented programming
systems, languages, and applications, ACM, 169-180.
HENNINE, F. 1964. Fault detecting experiments for sequential circuits. Proceedings of the
Fifth Annual Symposium on Switching Circuit Theory and Logical Design, IEEE,
95-110.
HIRSCH, J. & BENSINGER, K. 2013. Toyota settles acceleration lawsuit after $3-million
verdict. Los Angeles Times.
HO, J. W. & CHARLESTON, M. A. 2007. User Manual for GNLab. University of Sydney,
Sydney, Australia.
HOWDEN, W. E. 1978. Theoretical and empirical studies of program testing. IEEE
Transactions on Software Engineering, 4, 293-298.
HUANG, S., JI, M. Y., HUI, Z. W. & DUANMU, Y. T. 2012. Detecting Integer Bugs
without Oracle Based on Metamorphic Testing Technique. Applied Mechanics and
Materials, 121, 1961-1965.
HUI, Z.-W. & HUANG, S. 2013. A Formal Model for Metamorphic Relation
Decomposition. 2013 Fourth World Congress on Software Engineering (WCSE),
IEEE, 64-68.
JIANG, H. & WONG, W. H. 2008. SeqMap: mapping massive amount of oligonucleotides
to the genome. Bioinformatics, 24, 2395-2396.
JIANG, M., CHEN, T. Y., KUO, F.-C. & DING, Z. 2013. Testing central processing unit
scheduling algorithms using metamorphic testing. 4th IEEE International
Conference on Software Engineering and Service Science (ICSESS), IEEE, 530-
536.
JIANG, Y., HOU, S.-S., SHAN, J.-H., ZHANG, L. & XIE, B. 2005. Contract-based
mutation for testing components. Proceedings of the 21st IEEE International
Conference on Software Maintenance (ICSM'05), IEEE, 483-492.
JIFENG, H., LI, X. & LIU, Z. 2005. Component-based software engineering. Theoretical
Aspects of Computing–ICTAC 2005, Lecture Notes in Computer Science, 3722,
Springer, 70-95.
JOACHIMS, T. 1999. Making large scale SVM learning practical. Universität Dortmund.
JUST, R. & SCHWEIGGERT, F. 2011. Automating unit and integration testing with partial
oracles. Software Quality Journal, 19, 753-769.
150
KANEWALA, U. & BIEMAN, J. M. 2013. Using machine learning techniques to detect
metamorphic relations for programs without test oracles. 2013 IEEE 24th
International Symposium on Software Reliability Engineering (ISSRE), IEEE, 1-10.
KING, K. N. & OFFUTT, A. J. 1991. A fortran language system for mutation‐based
software testing. Software: Practice and Experience, 21, 685-718.
KNIGHT, J. C. & LEVESON, N. G. 1986. An experimental evaluation of the assumption of
independence in multiversion programming. IEEE Transactions on Software
Engineering, 12, 96-109.
KOREL, B., TAHAT, L. H. & VAYSBURG, B. 2002. Model based regression test
reduction using dependence analysis. International Conference on Software
Maintenance, IEEE, 214-223.
KUO, F.-C., CHEN, T. Y. & TAM, W. K. 2011. Testing embedded software by
metamorphic testing: A wireless metering system case study. 36th IEEE
Conference on Local Computer Networks (LCN), IEEE, 291-294.
KUO, F.-C., ZHOU, Z. Q., MA, J. & ZHANG, G. 2010. Metamorphic testing of decision
support systems: a case study. Software, IET, 4, 294-301.
LAPORTE, G. 1992. The traveling salesman problem: An overview of exact and
approximate algorithms. European Journal of Operational Research, 59, 231-247.
LE GALL, P. & ARNOULD, A. 1996. Formal specifications and test: Correctness and
oracle. Recent Trends in Data Type Specification, Lecture Notes in Computer
Science, 1130, Springer, 342-358.
LEBEAU, C. & LUCAS, D. W. 1992. Computer analysis of the futures market, McGraw-
Hill.
LEUNG, H. K. & WHITE, L. 1989. Insights into regression testing [software testing].
Conference on Software Maintenance, IEEE, 60-69.
LEVESON, N. G., HEIMDAHL, M. P. E., HILDRETH, H. & REESE, J. D. 1994.
Requirements specification for process-control systems. IEEE Transactions on
Software Engineering, 20, 684-707.
LI, N. & OFFUTT, J. 2014. An Empirical Analysis of Test Oracle Strategies for Model-
based Testing. Seventh IEEE International Conference on Software Testing,
Verification and Validation (ICST), IEEE, 363-372.
LIU, D., BIAS, R. G., LEASE, M. & KUIPERS, R. 2012a. Crowdsourcing for usability
testing. Proceedings of the American Society for Information Science and
Technology, 49, 1-10.
151
LIU, H., KUO, F.-C. & CHEN, T. Y. 2010. Teaching an end-user testing methodology.
23rd IEEE Conference on Software Engineering Education and Training
(CSEE&T), IEEE, 81-88.
LIU, H., KUO, F.-C., TOWEY, D. & CHEN, T. Y. 2014. How effectively does
metamorphic testing alleviate the oracle problem? IEEE Transactions on Software
Engineering, 40, 4-22.
LIU, H., LIU, X. & CHEN, T. Y. 2012b. A new method for constructing metamorphic
relations. 12th International Conference on Quality Software (QSIC), IEEE, 59-68.
LU, X.-L., DONG, Y.-W. & LUO, C. 2010. Testing of Component-Based Software: A
Metamorphic Testing Methodology. Ubiquitous Intelligence & Computing and 7th
International Conference on Autonomic & Trusted Computing (UIC/ATC), IEEE,
272-276.
MAKER, P. 1998. GNU Nana: improved support for assertion checking and logging in
GNU C/C++. Free Software Foundation.
MALIK, H., HEMMATI, H. & HASSAN, A. E. 2013. Automatic detection of performance
deviations in the load testing of large scale systems. 35th International Conference
on Software Engineering (ICSE), IEEE, 1012-1021.
MANO, M. M. 2002. Digital design, EBSCO Publishing, Inc.
MARICK, B. 1998. When should a test be automated. Proceedings of The 11th
International Software/Internet Quality Week, 1-20.
MAYER-SCHÖNBERGER, V. & CUKIER, K. 2013. Big data: A revolution that will
transform how we live, work, and think, Houghton Mifflin Harcourt.
MAYER, J. 2005. On Testing Image Processing Applications with Statistical Methods.
Software Engineering (SE 2005), 69-78.
MAYER, J. & GUDERLEI, R. 2006a. An empirical study on the selection of good
metamorphic relations. 30th Annual International Computer Software and
Applications Conference (COMPSAC'06), IEEE, 475-484.
MAYER, J. & GUDERLEI, R. 2006b. On random testing of image processing applications.
Sixth International Conference on Quality Software (QSIC 2006), IEEE, 85-92.
MCAFEE, A., BRYNJOLFSSON, E., DAVENPORT, T. H., PATIL, D. & BARTON, D.
2012. Big data. The management revolution. Harvard Bus Rev, 90, 61-67.
MCMINN, P. 2011. Search-based software testing: Past, present and future. Fourth IEEE
international conference on Software testing, verification and validation workshops
(icstw), IEEE, 153-163.
MCMINN, P., SHAHBAZ, M. & STEVENSON, M. 2012. Search-based test input
generation for string data types using the results of web queries. Fifth IEEE
152
International Conference on Software Testing, Verification and Validation (ICST),
IEEE, 141-150.
MCMINN, P., STEVENSON, M. & HARMAN, M. 2010. Reducing qualitative human
oracle costs associated with automatically generated test data. Proceedings of the
First International Workshop on Software Test Output Validation, ACM, 1-4.
MCNALLY, R., YIU, K., GROVE, D. & GERHARDY, D. 2012. Fuzzing: The State of the
Art. DTIC Document.
MENS, T., WERMELINGER, M., DUCASSE, S., DEMEYER, S., HIRSCHFELD, R. &
JAZAYERI, M. 2005. Challenges in software evolution. Eighth International
Workshop on Principles of Software Evolution, IEEE, 13-22.
MEYER, B. 1988. Eiffel: A language and environment for software engineering. Journal of
Systems and Software, 8, 199-246.
MICHAELS, D. & PASZTOR, A. 2006. bicideiits Prompt New Scrutiny Of Airplane
Software Glitches.
MIGNONE, A., BODO, G., MASSAGLIA, S., MATSAKOS, T., TESILEANU, O.,
ZANNI, C. & FERRARI, A. 2007. PLUTO: a numerical code for computational
astrophysics. The Astrophysical Journal Supplement Series, 170, 228.
MILLER, B. P., FREDRIKSEN, L. & SO, B. 1990. An empirical study of the reliability of
UNIX utilities. Communications of the ACM, 33, 32-44.
MOORE, E. F. 1956. Gedanken-experiments on sequential machines. Automata studies, 34,
129-153.
MURPHY, C. & KAISER, G. E. 2008. Improving the dependability of machine learning
applications. Technical Report CUCS-49-08, Dept. of Computer Science, Columbia
University.
MURPHY, C., KAISER, G. E. & HU, L. 2008. Properties of machine learning applications
for use in metamorphic testing. 20th international conference on software
engineering and knowledge engineering (SEKE), 867-872.
MURPHY, C., RAUNAK, M., KING, A., CHEN, S., IMBRIANO, C., KAISER, G., LEE,
I., SOKOLSKY, O., CLARKE, L. & OSTERWEIL, L. 2011. On effective testing of
health care simulation software. Proceedings of the 3rd Workshop on Software
Engineering in Health Care, ACM, 40-47.
MURPHY, C., SHEN, K. & KAISER, G. 2009. Using JML runtime assertion checking to
automate metamorphic testing in applications without test oracles. International
Conference on Software Testing Verification and Validation(ICST'09), IEEE, 436-
445.
153
NAITO, S. & TSUNOYAMA, M. 1981. Fault detection for sequential machines by
transition tours. Proc. FTCS, 238-243.
NEBELING, M., SPEICHER, M., GROSSNIKLAUS, M. & NORRIE, M. C. 2012.
Crowdsourced web site evaluation with crowdstudy, Springer.
NEELY, C., WELLER, P. & DITTMAR, R. 1997. Is technical analysis in the foreign
exchange market profitable? A genetic programming approach. Journal of financial
and Quantitative Analysis, 32, 405-426.
NEWMAN, M. 2002. Software errors cost US economy $59.5 billion annually. NIST
Assesses Technical Needs of Industry to Improve Software-Testing.
NISSEN, S. 2003. Implementation of a fast artificial neural network library (fann). Report,
Department of Computer Science University of Copenhagen (DIKU), 31.
NÚÑEZ, A. & HIERONS, R. M. 2014. A methodology for validating cloud models using
metamorphic testing. annals of telecommunications-annales des
télécommunications, 70, 127-135.
NUTI, G., MIRGHAEMI, M., TRELEAVEN, P. & YINGSAEREE, C. 2011. Algorithmic
trading. Computer, 44, 61-69.
OGHENEOVO, E. E. 2014. Software Dysfunction: Why Do Software Fail? Journal of
Computer and Communications, 2, 25-35.
OKUNEV, J. & WHITE, D. 2003. Do momentum-based strategies still work in foreign
currency markets? Journal of Financial and Quantitative Analysis, 38, 425-448.
PASTORE, F., MARIANI, L. & FRASER, G. 2013. CrowdOracles: Can the Crowd Solve
the Oracle Problem? 2013 IEEE Sixth International Conference on Software
Testing, Verification and Validation (ICST), IEEE, 342-351.
PENG, W., XIAO-CHUN, S., JIANG-JUN, T. & HUI-MIN, L. 2005. Metamorphic testing
and special case testing: A case study. Journal of Software, 16, 1210-1220.
POLIKARPOVA, N., CIUPA, I. & MEYER, B. 2009. A comparative study of programmer-
written and automatically inferred contracts. Proceedings of the eighteenth
international symposium on Software testing and analysis, ACM, 93-104.
POON, P.-L., KUO, F.-C., LIU, H. & YUEH CHEN, T. 2014. How can non-technical end
users effectively test their spreadsheets? Information Technology & People, 27,
440-462.
PREEN, R. 2009. An XCS approach to forecasting financial time series. Proceedings of the
11th Annual Conference Companion on Genetic and Evolutionary Computation
Conference: Late Breaking Papers, ACM, 2625-2632.
154
PULLUM, L. L. & OZMEN, O. 2012. Early results from metamorphic testing of
epidemiological models. ASE/IEEE International Conference On BioMedical
Computing (BioMedCom), IEEE, 62-67.
RAMANATHAN, A., STEED, C. & PULLUM, L. L. 2012.Verification of compartmental
epidemiological models using metamorphic testing, model checking and visual
analytics. ASE/IEEE International Conference on BioMedical Computing
(BioMedCom), IEEE, 68-73.
RENTSCH, T. 1982. Object oriented programming. ACM Sigplan Notices, 17, 51-57.
ROTHERMEL, G. & HARROLD, M. J. 1996. Analyzing regression test selection
techniques. IEEE Transactions on Software Engineering, 22, 529-551.
ROTHERMEL, G. & HARROLD, M. J. 1997. A safe, efficient regression test selection
technique. ACM Transactions on Software Engineering and Methodology
(TOSEM), 6, 173-210.
ROTHERMEL, G., UNTCH, R. H., CHU, C. & HARROLD, M. J. 2001. Prioritizing test
cases for regression testing. IEEE Transactions on Software Engineering, 27, 929-
948.
SABNANI, K. & DAHBURA, A. 1988. A protocol test generation procedure. Computer
Networks and ISDN systems, 15, 285-297.
SADI, M. S., KUO, F.-C., HO, J. W., CHARLESTON, M. A. & CHEN, T. 2011.
Verification of phylogenetic inference programs using metamorphic testing. Journal
of bioinformatics and computational biology, 9, 729-747.
SEGURA, S., DURÁN, A., SÁNCHEZ, A. B., BERRE, D. L., LONCA, E. & RUIZ‐
CORTÉS, A. 2015. Automated metamorphic testing of variability analysis tools.
Software Testing, Verification and Reliability, 25, 138-163.
SEGURA, S., HIERONS, R. M., BENAVIDES, D. & RUIZ-CORTÉS, A. 2010. Automated
test data generation on the analyses of feature models: A metamorphic testing
approach. Third International Conference on Software Testing, Verification and
Validation (ICST), IEEE, 35-44.
SEGURA, S., HIERONS, R. M., BENAVIDES, D. & RUIZ-CORTÉS, A. 2011. Automated
metamorphic testing on the analyses of feature models. Information and Software
Technology, 53, 245-258.
SIM, K., LOW, C. & KUO, F.-C. 2010. Detecting faults in technical indicator computations
for financial market analysis. 2nd International Conference on Information Science
and Engineering (ICISE), IEEE, 2749-2754.
SIM, K., PAO, W. & LIN, C. 2005. Metamorphic testing using geometric interrogation
technique and its application. Proceedings of the 2nd International Conference of
155
Electrical Engineering/Electronics, Computer, Telecommunications, and
Information Technology (ECTI'05), 91-95.
SIM, K., WONG, D. & HII, T. 2013. Evaluating the Effectiveness of Metamorphic Testing
on Edge Detection Programs. International Journal of Innovation, Management and
Technology, 4, 6-10.
SIM, K. Y., KUO, F.-C. & MERKEL, R. 2011. Fuzzing the out-of-memory killer on
embedded Linux: an adaptive random approach. Proceedings of the 2011 ACM
Symposium on Applied Computing, ACM, 387-392.
SIM, K. Y., LOW, C. S. & KUO, F.-C. 2009. Automatic Testing of Financial Charting
Software Component: A Case Study on Point and Figure Chart. 2nd International
Conference on Computer Science and its Applications (CSA'09), IEEE, 1-7.
SIM, K. Y., LOW, C. S. & KUO, F.-C. 2014. Eliminating Human Visual Judgment from
Testing of Financial Charting Software. Journal of Software, 9, 298-312.
SINGH, G. 2012. An Automated Metamorphic Testing Technique for Designing Effective
Metamorphic Relations. Contemporary Computing, Communications in Computer
and Information Science, 306, Springer, 152-163.
SINGHAL, A. & BANSAL, A. 2014. A study of various automated test oracle methods.
2014 5th International Conference Confluence The Next Generation Information
Technology Summit (Confluence), IEEE, 753-760.
SMITH, A. M. & KAPFHAMMER, G. M. 2009. An empirical study of incorporating cost
into test suite reduction and prioritization. Proceedings of the 2009 ACM
symposium on Applied Computing, ACM, 461-467.
SMITH, B. 2015. Object-Oriented Programming. Advanced ActionScript 3. Springer.
STAATS, M., HONG, S., KIM, M. & ROTHERMEL, G. 2012. Understanding user
understanding: determining correctness of generated program invariants.
Proceedings of the 2012 International Symposium on Software Testing and
Analysis, ACM, 188-198.
STOYAN, D., KENDALL, W. & MECKE, J. 1995. Stochastic geometry and its
applications. Akademie-Verlag, Berlin.
SUN, C.-A., WANG, G., MU, B., LIU, H., WANG, Z. & CHEN, T. 2012. A metamorphic
relation-based approach to testing web services without oracles. International
Journal of Web Services Research, 9, 51-73.
SUN, C.-A., WANG, Z. & WANG, G. 2014. A property-based testing framework for
encryption programs. Frontiers of Computer Science, 8, 478-489.
TAI, K.-C. 1996. Theory of fault-based predicate testing for computer programs. IEEE
Transactions on Software Engineering, 22, 552-562.
156
TAKAHASHI, J. 2001. An automated oracle for verifying GUI objects. ACM SIGSOFT
Software Engineering Notes, 26, 83-88.
TANKOV, P. 2003. Financial modelling with jump processes, CRC press.
TAO, Q., WU, W., ZHAO, C. & SHEN, W. 2010. An automatic testing approach for
compiler based on metamorphic testing technique. 17th Asia Pacific Software
Engineering Conference (APSEC), IEEE, 270-279.
TAYLOR, M. P. & ALLEN, H. 1992. The use of technical analysis in the foreign exchange
market. Journal of international Money and Finance, 11, 304-314.
TAYLOR, R. N. 1980. Assertions in programming languages. ACM SIGPLAN Notices, 15,
105-114.
TEN DYKE, R. P. & KUNZ, J. C. 1989. Object-oriented programming. IBM Systems
Journal, 28, 465.
THIMBLEBY, H. 2003. The directed chinese postman problem. Software: Practice and
Experience, 33, 1081-1096.
TSE, T. & YAU, S. S. 2004. Testing context-sensitive middleware-based software
applications. Proceedings of the 28th Annual International Computer Software and
Applications Conference (COMPSAC 2004), IEEE, 458-466.
TURING, A. 1989. Checking a large routine. The early British computer conferences, MIT
Press, 70-72.
UMBAUGH, S. E. 1997. Computer Vision and Image Processing: A Practical Approach
Using Cviptools with Cdrom, Prentice Hall PTR.
UTTING, M. & LEGEARD, B. 2010. Practical model-based testing: a tools approach,
Morgan Kaufmann.
VALENTINI, E., FLIESS, G. & HASELWANTER, E. 2005. A framework for efficient
contract-based testing of software components. 29th Annual International
Computer Software and Applications Conference(COMPSAC 2005), IEEE, 219-
222.
WANG, K. & STOLFO, S. J. 2004. Anomalous payload-based network intrusion detection.
Recent Advances in Intrusion Detection, Lecture Notes in Computer Science, 3224,
Springer, 203-222.
WEI, Y., FURIA, C. A., KAZMIN, N. & MEYER, B. 2011a Inferring better contracts.
Proceedings of the 33rd International Conference on Software Engineering, ACM,
191-200.
WEI, Y., ROTH, H., FURIA, C., PEI, Y., HORTON, A., STEINDORFER, M., NORDIO,
M. & MEYER, B. 2011b. Stateful testing: Finding more errors in code and
157
contracts. 26th IEEE/ACM International Conference on Automated Software
Engineering (ASE), IEEE, 440-443.
WEYUKER, E. J. 1982. On testing non-testable programs. The Computer Journal, 25, 465-
470.
WILDER, J. W. 1978. New concepts in technical trading systems. Trend Research.
WITTEN, I. H. & FRANK, E. 2005. Data Mining: Practical machine learning tools and
techniques, Morgan Kaufmann.
WONG, W. E., HORGAN, J. R., LONDON, S. & AGRAWAL, H. 1997. A study of
effective regression testing in practice. The Eighth International Symposium on
Software Reliability Engineering, IEEE, 264-274.
WU, P. 2005. Iterative metamorphic testing. 29th Annual International Computer Software
and Applications Conference (COMPSAC 2005), IEEE, 19-24.
XIE, Q. & MEMON, A. M. 2007. Designing and comparing automated test oracles for GUI-
based software applications. ACM Transactions on Software Engineering and
Methodology (TOSEM), 16, 4.
XIE, T. 2006. Augmenting automatically generated unit-test suites with regression oracle
checking. ECOOP 2006–Object-Oriented Programming, Lecture Notes in
Computer Science, 4067, Springer, 380-403.
XIE, X., HO, J., MURPHY, C., KAISER, G., XU, B. & CHEN, T. Y. 2009. Application of
metamorphic testing to supervised classifiers. 9th International Conference on
Quality Software (QSIC'09), IEEE, 135-144.
XIE, X., HO, J. W., MURPHY, C., KAISER, G., XU, B. & CHEN, T. Y. 2011. Testing and
validating machine learning classifiers by metamorphic testing. Journal of Systems
and Software, 84, 544-558.
XIE, X., TU, J., CHEN, T. Y. & XU, B. Bottom-up Integration Testing with the Technique
of Metamorphic Testing. 14th International Conference on Quality Software
(QSIC), IEEE, 73-78.
YANG, B. & URAL, H. 1990. Protocol conformance test generation using multiple UIO
sequences with overlapping. ACM SIGCOMM Computer Communication Review,
20, 118-125.
YAO, Y., HUANG, S. & JI, M. 2012. Research on Metamorphic Testing for Oracle
Problem of Integer Bugs. Advances in Computer Science and Information
Engineering, Advances in Intelligent and Soft Computing, 168, Springer, 95-100
YI, Y., CHANGYOU, Z., SONG, H. & ZHENGPING, R. 2013. Research on Metamorphic
Testing: A Case Study in Integer Bugs Detection. Intelligent Systems Design and
158
Engineering Applications, 2013 Fourth International Conference on, IEEE, 488-
493.
YOO, S. 2010. Metamorphic testing of stochastic optimisation. Third International
Conference on Software Testing, Verification, and Validation Workshops (ICSTW),
IEEE, 192-201.
YOO, S. & HARMAN, M. 2012. Regression testing minimization, selection and
prioritization: a survey. Software Testing, Verification and Reliability, 22, 67-120.
YOUNG, M. 2008. Software testing and analysis: process, principles, and techniques, John
Wiley & Sons.
ZACHARIAS, B. 2012. Test Case Generation and Reusing Test Cases for GUI Designed
with HTML. Journal of Software, 7, 2269-2277.
ZHANG, J., CHEN, J., HAO, D., XIONG, Y., XIE, B., ZHANG, L. & MEI, H. 2014.
Search-based inference of polynomial metamorphic relations. Proceedings of the
29th ACM/IEEE International Conference on Automated Software Engineering,
ACM, 701-712.
ZHANG, J., HU, X. & ZHANG, B. 2011. An evaluation approach for the program of
association rules algorithm based on metamorphic relations. Journal of Electronics
(China), 28, 623-631.
ZHANG, Z., CHAN, W., TSE, T. & HU, P. 2009. Experimental study to compare the use of
metamorphic testing and assertion checking. Journal of Software, 20, 2637-2654.
ZHOU, Z. Q., TSE, T., KUO, F. & CHEN, T. 2007.Automated functional testing of web
search engines in the absence of an oracle. TECHNICAL REPORT TR-2007-06,
DEPARTMENT OF COMPUTER SCIENCE, THE UNIVERSITY OF HONG
KONG.
ZHOU, Z. Q., ZHANG, S., HAGENBUCHNER, M., TSE, T., KUO, F. C. & CHEN, T. Y.
2012. Automated functional testing of online search services. Software Testing,
Verification and Reliability, 22, 221-243.
ZIOU, D. & TABBONE, S. 1998. Edge detection techniques-an overview. Pattern
Recognition And Image Analysis C/C Of Raspoznavaniye Obrazov I Analiz
Izobrazhenii, 8, 537-559.
159
List of Publications
The following are peer-reviewed publications that have arisen from this thesis:
1. SIM, K. Y., LOW, C. S. & KUO, F.-C. 2009. Automatic Testing of Financial Charting
Software Component: A Case Study on Point and Figure Chart. Proceedings of the
2009 International Conference on Computer Science and its Applications (CSA'09),
IEEE, 1-7.
2. SIM, K. Y., LOW, C. S. & KUO, F.-C. 2010. Detecting faults in technical indicator
computations for financial market analysis. Proceedings of the 2010 International
Conference on Information Science and Engineering (ICISE), IEEE, 2749-2754.
3. SIM, K. Y., KUO, F.-C. & MERKEL, R. 2011. Fuzzing the out-of-memory killer on
embedded Linux: an adaptive random approach. Proceedings of the 2011 ACM
Symposium on Applied Computing, ACM, 387-392.
4. SIM, K. Y., WONG, D. & HII, T. 2013. Evaluating the Effectiveness of Metamorphic
Testing on Edge Detection Programs. International Journal of Innovation, Management
and Technology, 4, 6-10.
5. SIM, K. Y., LOW, C. S. & KUO, F.-C. 2014. Eliminating Human Visual Judgment
from Testing of Financial Charting Software. Journal of Software, 9, 298-312.
6. SIM, K. Y. 2014. Repeated Transition Tour for Transfer Fault Detection in Finite State
Machines, Proceedings of the 2014 International Conference on Computer Science &
Computational Mathematics, 172-176.
Recommended