COTTON MARKET
REPORT
José Sette
Executive Director
International Cotton Advisory Committee
5th Dedicated Discussion
of the Relevant Trade-
related Developments On
Cotton
Geneva
1 July 2016
SUMMARY
1. Introduction
2. Production
3. Trade (Exports & Imports)
4. Consumption
5. Stocks
6. Prices
7. Conclusions

0
20
40
60
80
100
120
0
20
40
60
80
100
120
PRICE (Cotlook A Index)
US cents/lb

WORLD PRODUCTION & MILL USE million tons
Production
Mill Use
0
5
10
15
20
25
30
94/95 99/00 04/05 09/10 14/15
Accumulated surplus 2010/11-
2014/15: 13.6 million tons

12
16
20
24
28
80/81 90/91 00/01 10/11
WORLD PRODUCTION (million tons)
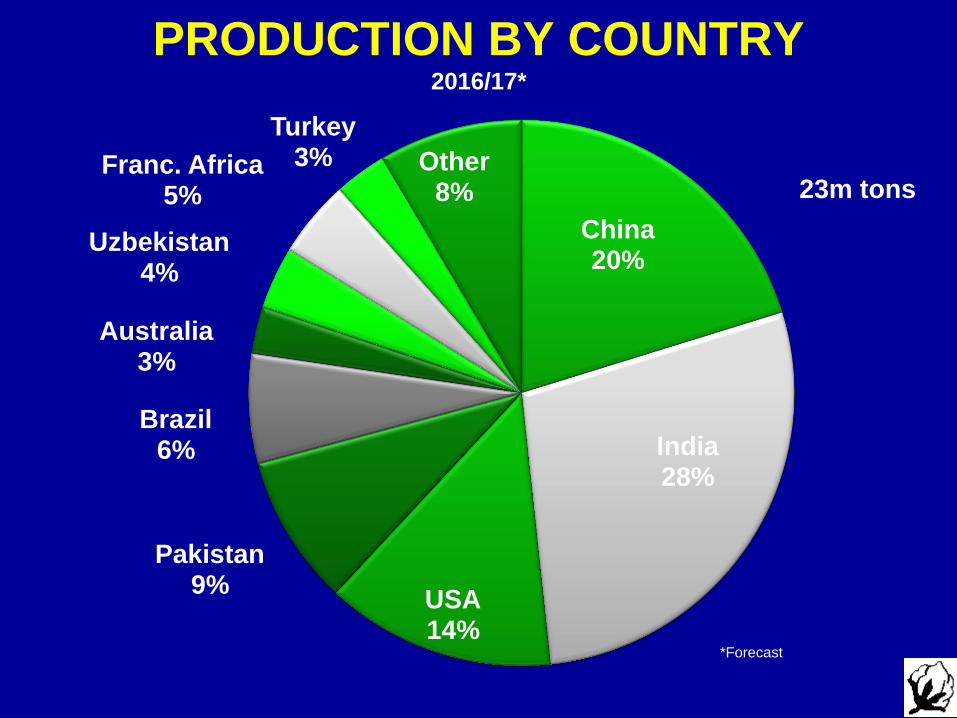
China 20%
India 28%
USA 14%
Pakistan 9%
Brazil 6%
Australia 3%
Uzbekistan 4%
Franc. Africa 5%
Turkey 3% Other
8%
*Forecast
PRODUCTION BY COUNTRY 2016/17*
23m tons

WORLD COTTON AREA AND YIELD million hectares kg/ha
500
550
600
650
700
750
800
850
0
5
10
15
20
25
30
35
40
06/07 08/09 10/11 12/13 14/15 16/17
Area Yield

PRODUCTION million tons
0 1 2 3 4 5 6 7
India
China
USA
Pakistan
Brazil
Uzbekistan
Turkey
Australia
Turkmenistan
Burkina Faso
2015/16 2016/17
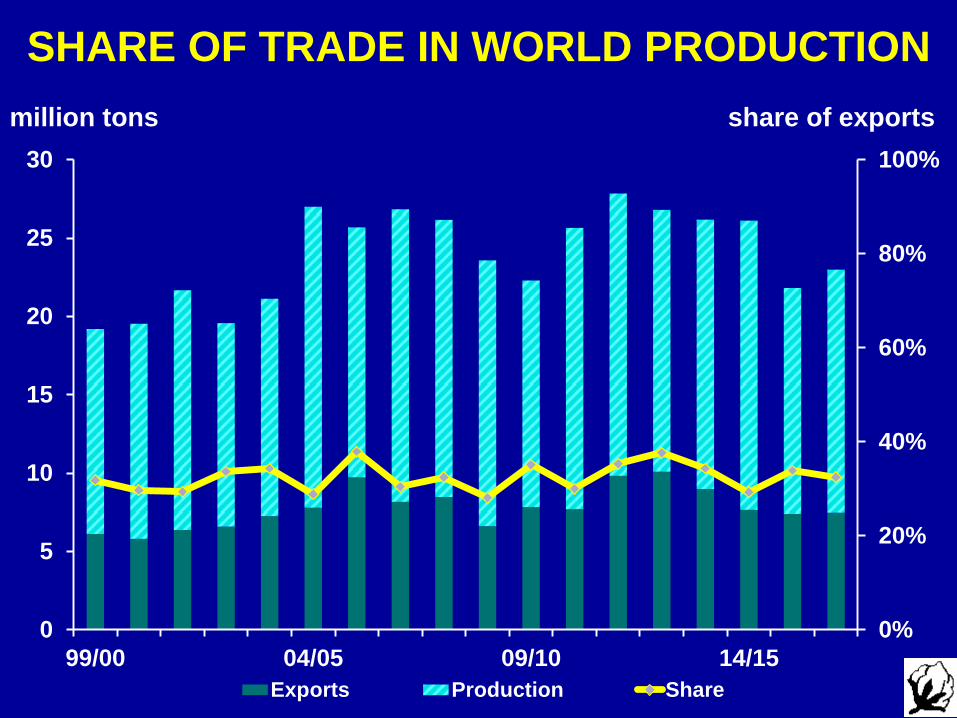
SHARE OF TRADE IN WORLD PRODUCTION
0%
20%
40%
60%
80%
100%
0
5
10
15
20
25
30
99/00 04/05 09/10 14/15
Exports Production Share
million tons share of exports

USA 30%
India 14%
Australia 7%
Brazil 11%
CFA Africa 14%
Uzbekistan 7%
ROW 17%
2016/17*
COTTON EXPORTS BY COUNTRY
7.5 million tons
*Forecast
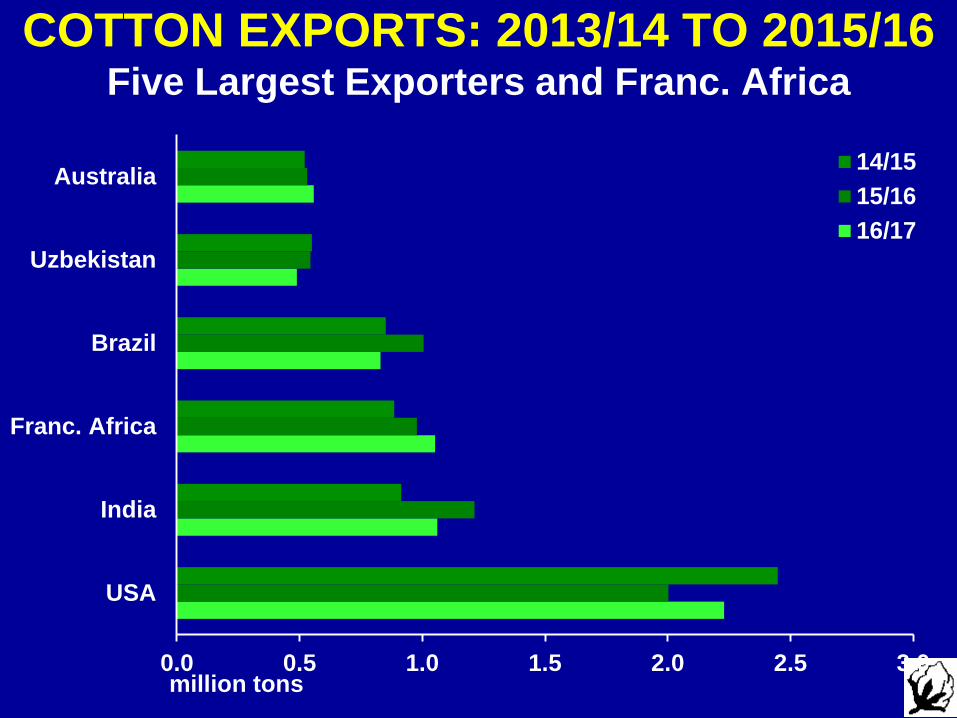
COTTON EXPORTS: 2013/14 TO 2015/16 Five Largest Exporters and Franc. Africa
million tons 0.0 0.5 1.0 1.5 2.0 2.5 3.0
USA
India
Franc. Africa
Brazil
Uzbekistan
Australia14/15
15/16
16/17

WORLD COTTON IMPORTS
6.5 5.4
1.0 4.4
0
2
4
6
8
10
12
00
/01
02
/03
04/0
5
06
/07
08
/09
10
/11
12
/13
14/1
5
16/1
7
World less China China
million tons
-24% 9.8
7.5

CHANGES IN COTTON IMPORTS
2015/16
7.3 million tons
1996/97
6.1 million tons
7 Countries: 34% 7 Countries: 68%
China 13%
Bangladesh 2%
Turkey 5%
Indonesia 7%
Vietnam 1%
Thailand 5%
Pakistan 1%
ROW 66%
China 12%
Bangladesh
12%
Turkey 9%
Indonesia 8%
Vietnam 12%
Thailand 3%
Pakistan 6%
ROW 38%
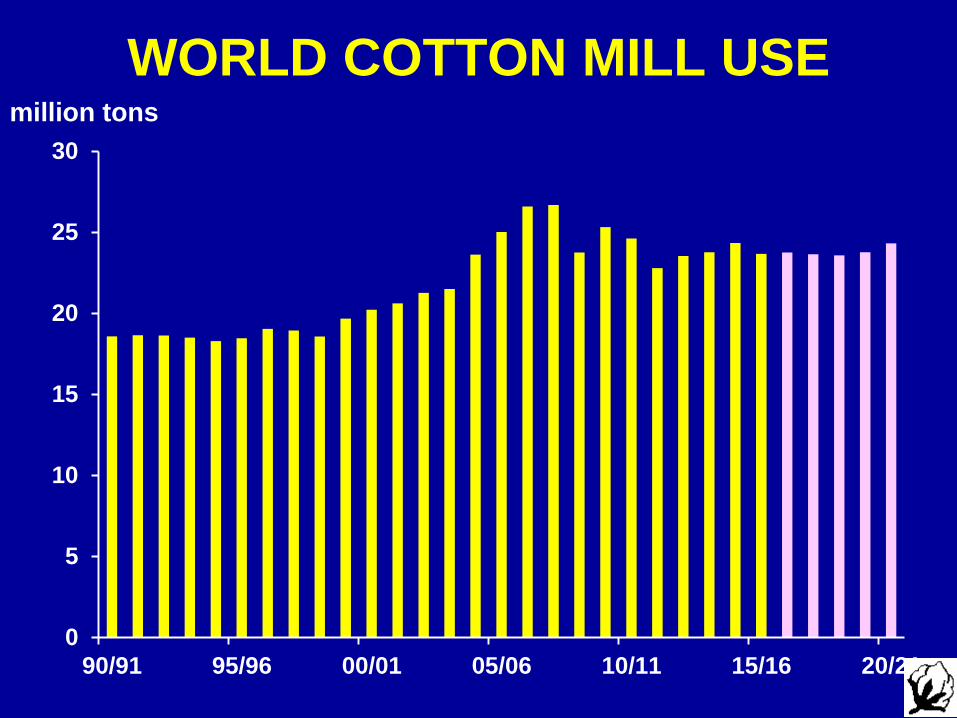
WORLD COTTON MILL USE
0
5
10
15
20
25
30
90/91 95/96 00/01 05/06 10/11 15/16 20/21
million tons

GROWTH IN WORLD COTTON MILL USE
3.1%
-0.5%
-2.0%
6.0%
2.8% 2.0%
3.1%
1.1%
9.8%
5.9% 6.3%
0.3%
-11.0%
6.6%
-2.8%
-7.4%
3.3%
1.0%
2.4%
-2.8%
-0.12
-0.07
-0.02
0.03
0.08
1.5%
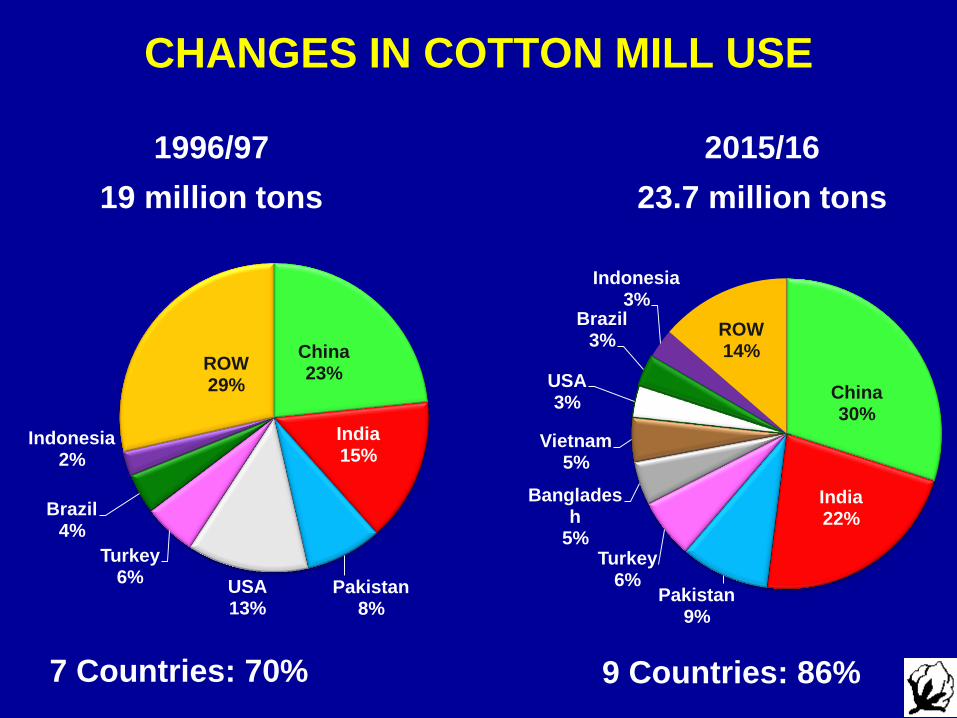
CHANGES IN COTTON MILL USE
2015/16
23.7 million tons
1996/97
19 million tons
7 Countries: 70% 9 Countries: 86%
China 23%
India 15%
Pakistan 8%
USA 13%
Turkey 6%
Brazil 4%
Indonesia 2%
ROW 29% China
30%
India 22%
Pakistan 9%
Turkey 6%
Bangladesh
5%
Vietnam 5%
USA 3%
Brazil 3%
Indonesia 3%
ROW 14%
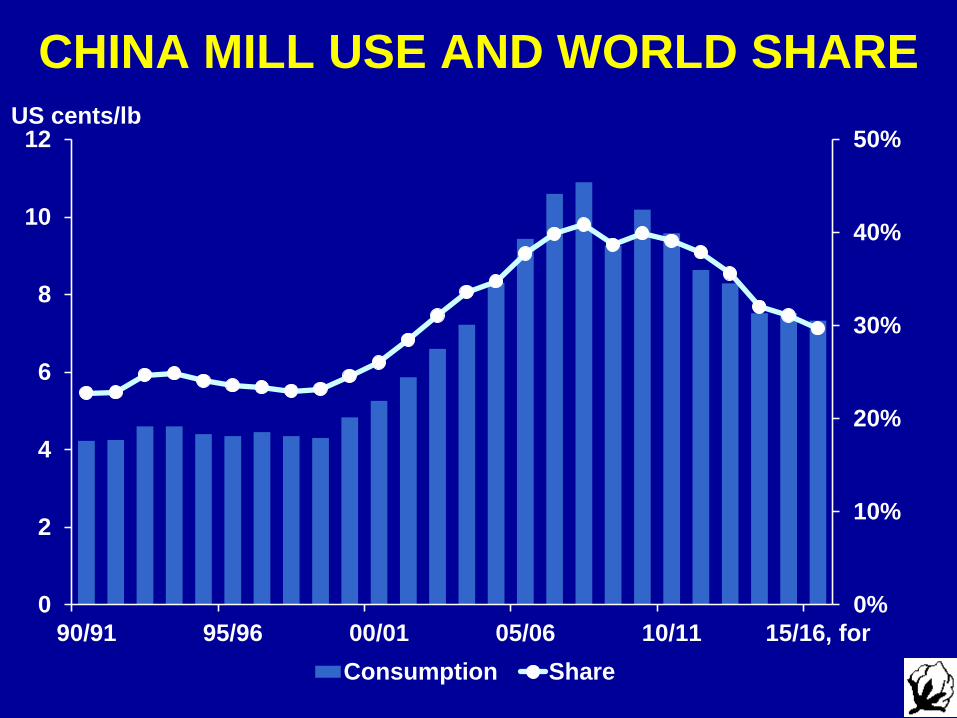
CHINA MILL USE AND WORLD SHARE US cents/lb
0%
10%
20%
30%
40%
50%
0
2
4
6
8
10
12
90/91 95/96 00/01 05/06 10/11 15/16, for
Consumption Share

0 1 2 3 4 5 6 7 8
China
India
Pakistan
Turkey
Vietnam
Bangladesh14/15
15/16
16/17
COTTON MILL USE
million tons

2016 CHINESE RESERVE SALES thousand tons
11500
11600
11700
11800
11900
12000
12100
12200
12300
12400
12500
0
5
10
15
20
25
30
35
5/3 5/10 5/17 5/24 5/31 6/7 6/15 6/22
Offered Sold Auction Floor Price
yuan/ton

CHINA NATIONAL RESERVE
Aug-11 Aug-12 Aug-13 Aug-14 Aug-15
0
2
4
6
8
10
12
14
million tons

WORLD ENDING STOCKS million tons
0.00
0.10
0.20
0.30
0.40
0.50
0.60
0.70
0.80
0.90
1.00
0
5
10
15
20
06/07 08/09 10/11 12/13 14/15 16/17
World less China China SU Ratio

-50%
-25%
0%
25%
50%
74/7
5
79/8
0
84/8
5
89/9
0
94/9
5
99/0
0
04/0
5
09
/10
14/1
5
Season highest value
Season lowest value
2015/16: August-May 2016
PRICE VOLATILITY Cotlook A Index: Difference with respect to season average

COTTON & POLYESTER PRICES
0
20
40
60
80
100
120
Aug-12 Feb-13 Aug-13 Feb-14 Aug-14 Feb-15 Aug-15 Feb-16
Cotlook A Index
China Polyester
Source: Cotton Outlook Ltd.
US cts/lb
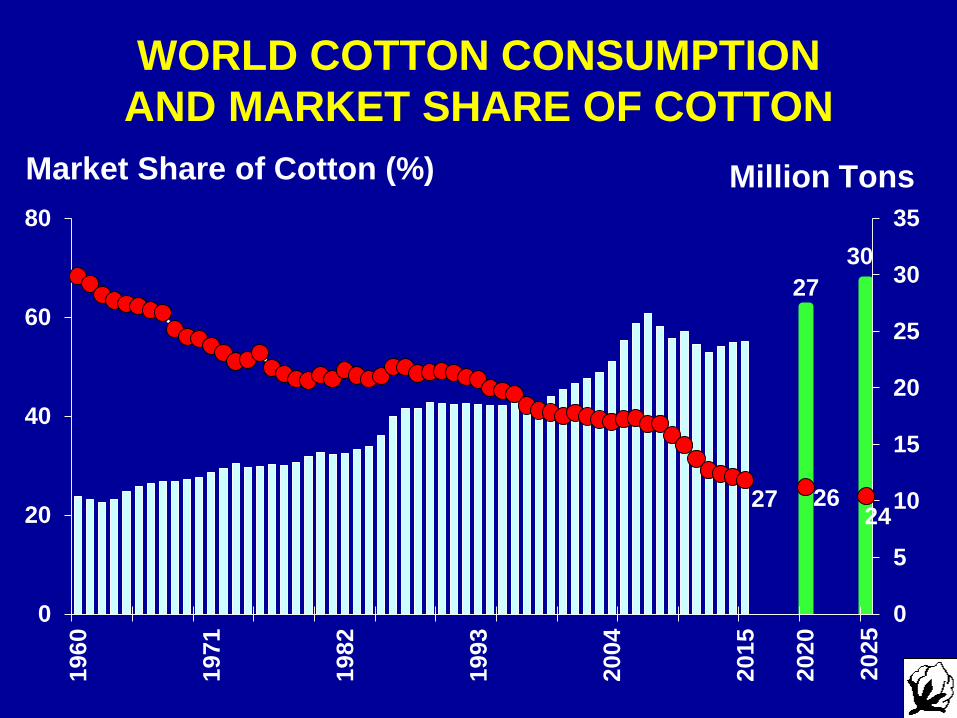
27
30
27 26 24
0
20
40
60
80
1960
1971
1982
1993
2004
2015
0
5
10
15
20
25
30
35
Million Tons
WORLD COTTON CONSUMPTION
AND MARKET SHARE OF COTTON
Market Share of Cotton (%)
2020
2025
Recommended