2010
AN
NU
AL
REP
ORT
44
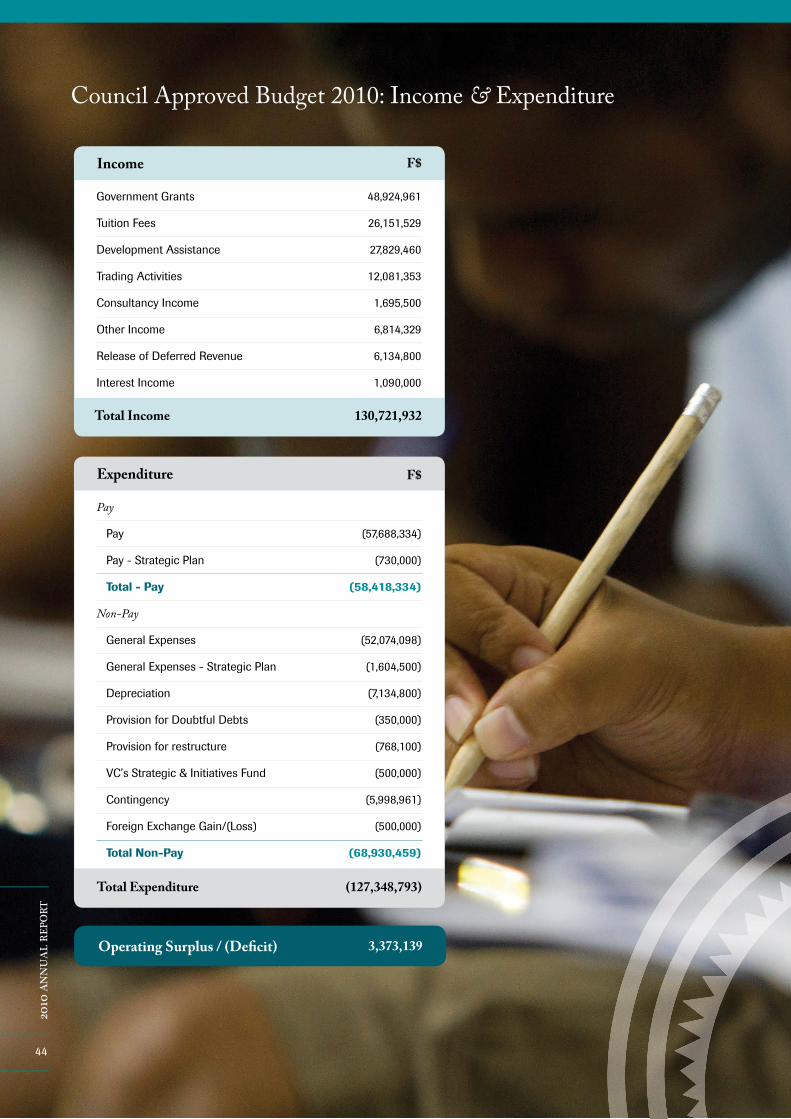
Council Approved Budget 2010: Income & Expenditure
Government Grants
Tuition Fees
Development Assistance
Trading Activities
Consultancy Income
Other Income
Release of Deferred Revenue
Interest Income
Income F$
48,924,961
26,151,529
27,829,460
12,081,353
1,695,500
6,814,329
6,134,800
1,090,000
Total Income 130,721,932
Pay
Pay
Pay - Strategic Plan
Total - Pay
Non-Pay
General Expenses
General Expenses - Strategic Plan
Depreciation
Provision for Doubtful Debts
Provision for restructure
VC’s Strategic & Initiatives Fund
Contingency
Foreign Exchange Gain/(Loss)
Total Non-Pay
Expenditure
(57,688,334)
(730,000)
(58,418,334)
(52,074,098)
(1,604,500)
(7,134,800)
(350,000)
(768,100)
(500,000)
(5,998,961)
(500,000)
(68,930,459)
Total Expenditure (127,348,793)
Operating Surplus / (Defi cit) 3,373,139
F$
44
2010
AN
NU
AL
REP
ORT

2010 A
NN
UA
L REPO
RT
45
Financial StatementsStatement by Appointed Offi cers
Independent Audit Report
Statement of Accounting Policies
Statement of Comprehensive Income
Statement of Financial Position
Statement of Cash Flows
Statement of Changes in Funds and Reserves
Notes to the Financial Statements
4647
485354
555657

46
2010
AN
NU
AL
REP
ORT
FIN
AN
CIA
L ST
ATEM
ENTS

47
2010 A
NN
UA
L REPO
RT FIN
AN
CIA
L STATEMEN
TS

48
2010
AN
NU
AL
REP
ORT
FIN
AN
CIA
L ST
ATEM
ENTS
Statement of Accounting Policies
REPORTING ENTITYThe University of the South Pacific was established by Royal Charter of the University in 1970. It is a non profit educational institution providing higher education to member regional countries, with its main operations domiciled in Fiji. The registered office is at Laucala Bay Campus, Suva, Fiji.
Principal ActivitiesThe University is the premier provider of tertiary education in the Pacific region and an international centre of excellence for teaching, research and consulting on all aspects of Pacific life.
Segmental ReportingThe University’s academic activities are regarded as a single segment of activity since they are undertaken by the same staff, using the same premises and financed substantially from the same income streams. None of the University’s other peripheral activities achieve the 10% threshold which would require separate reporting under IFRS 8 or IAS 14. As a regional institution, the University does not consider reporting of geographical segmentation below regional level to be appropriate and cash flows outside the region fall below the reporting threshold.
Property, Plant and EquipmentThe policy of the University is not to revalue its property, plant and equipment. In view of the specialised nature and wide geographical distribution of much of the University’s property and equipment, it is considered that the costs of any revaluation to reflect current values would outweigh the benefit to users of these financial statements. The value of its property, plant and equipment is therefore either their value when originally incorporated within the University’s Statement of Financial Position, or historical cost if acquired at a later date.
Acquisitions and additions of non-current assets are capitalised if the value is more than $1,000. These items are recorded at cost.
DepreciationProperty, plant & equipment are depreciated only when they are completed and ready for use.
Property, plant and equipment acquired since 31 December 1993 are recorded at cost and depreciated over their estimated useful life:
Significant Accounting PoliciesThe summary of significant accounting policies adopted in the preparation of the annual financial statements are set out below. These policies have been consistently applied to the years presented unless otherwise stated.
Reporting PeriodThe financial statements are reported for the year from 1 January to 31 December 2010.
Basis of PreparationThe financial statements are prepared on the basis of historical costs and, except where stated; do not take into account current valuation of non-current assets.
The concepts of the accrual method and going concern basis of accounting are applied. The Finance and Investments Committee and officers of the University believe that the basis for preparation of the accounts is appropriate and that the University will be able to continue its normal operations in the next 12 months. The Committee and the officers resolved that the classification and carrying amounts of assets and liabilities included in these accounts are appropriate.
All amounts shown in the financial statements are expressed in Fijian dollars.
Statement of ComplianceThe financial statements have been prepared in accordance with International Financial Reporting Standards (“IFRS”) and their interpretations issued by the International Accounting Standards Board (“IASB”).
Basis of ConsolidationThe format of the University’s Annual Financial Statements is approved by the Finance and Investments Committee on behalf of Council. The Statement of Financial Position, Statement of Comprehensive Income and Statement of Cash Flows are prepared on a consolidated basis including all the funds of the University.
1
a
d
c
Motor vehicles are written down on a straight line basis over 5 years.
Buildings are written down on a straight line basis over 50 years i.e. 2% per annum.
Equipment, furniture, fittings and vessels are written down on a straight line basis over 5 years.
e
f
g
i
ii
iii
b

49
2010 A
NN
UA
L REPO
RT FIN
AN
CIA
L STATEMEN
TS
Computer equipment is written down on a straight line basis over 5 years, effective from 1 July 2009.
Freehold land is not depreciated.
The depreciation applicable to donated assets is offset by a transfer from the Deferred Revenue Reserve to the Statement of Comprehensive Income.
ImpairmentTangible property, plant and equipment are inspected annually by a Board of Survey. If the inspection identifies that the carrying amount of the fixed asset is overstated, a provision is made for the impairment. No such provisions have been found necessary at balance date.
Deferred Capital GrantsProperty, plant & equipment acquired with the aid of specific grants are capitalised and depreciated in accordance with the above policy, with the related grant being credited to a Deferred Revenue Reserve and released to the Statement of Comprehensive Income over the expected useful economic life of the related property, plant and equipment. The exception to this is when the acquisition of property, plant & equipment is financed either through University’s own funds or a loan or finance lease when no revenue is deferred to the Reserve.
Leased AssetsThe University leases some property under operating leases. The rentals are charged as an expense over the term of the lease.Assets held under leasing agreements which transfer to the University substantially all the benefits and risks of ownership of an asset are treated as if the asset had been purchased outright. These are capitalised at their fair value at the inception of the lease and depreciated over the shorter of the lease term and the useful economic life of the assets. The capital element outstanding is shown as obligations under finance leases. The interest element of the lease payments is charged to the Statement of Comprehensive Income over the term of the lease.
InventoriesInventories are valued at the lower of cost and net realisable value. Cost is determined predominantly on the first-in, first-out basis of valuation. Only inventories which are purchased and controlled
iv
v
centrally have been reported within the financial statements. Consumables purchased by the University for departmental use and held under the control of individual departments have been expensed in the accounts at the time of purchase.
Accounts ReceivableThe provision for doubtful debts is made as follows:
Government debtorsNo provision for doubtful debts is made for sovereign debts on the premise that, despite the age of the debt, all such debts will eventually be paid.
Trade debtorsTrade debtors greater than 91 days and less than 180 days are provided for at 50%, while all debts greater than 180 days are fully provided for.
Student debtorsAll student debtors other than government sponsored have been fully provided for.
VAT/GST ReceivableVAT/GST outstanding for more than four years has been fully provided for.
For all other debts, no provisions are made against debtors.
The amounts required to fund the provision for doubtful debts are charged to expenditure in the year. Bad debts are generally written off against the provision when identified.
Statement of Cash FlowsThe following are the definitions of the terms used in the statement of cash flows:
Cash and cash equivalentsCash and cash equivalents comprise cash on hand, deposits held with banks, deposits held at call with banks, other short-term deposits with terms of three months or less and are subject to an insignificant risk of change in value and bank overdrafts. Bank overdrafts are included as current liabilities on the Statement of Financial Position.
Operating ActivitiesOperating activities include all transactions and other events that are not investing or financing activities.
i
ii
iii
iv
v
h
i
j
k
Significant Accounting Policies (continued)

50
2010
AN
NU
AL
REP
ORT
FIN
AN
CIA
L ST
ATEM
ENTS
Investing ActivitiesInvesting activities are those relating to the acquisition, holding and disposal of property, plant and equipment and of investments. Investments can include securities not falling within the definition of cash.
Financing ActivitiesFinancing activities are those that result in changes in the size and composition of the capital structure. This includes both equity and debt not falling within the definition of cash.
Employee BenefitsProvision is made for employee entitlements in respect of salaries and wages, annual leave, severance allowance and superannuation where applicable and is calculated as the amount unpaid as at reporting date at current pay rates. All employee benefit related provisions, except for severance allowance and gratuity of selected senior managers, are classified as a current liability. Accrued leave is expected to be utilised in the following year.
Foreign Currency TransactionsAll foreign currency transactions during the year have been translated to Fijian currency using the exchange rate in effect at the dates of the transactions. Foreign currency monetary items at balance date are translated at the exchange rate existing at that date.Foreign exchange gains and losses resulting from the settlement of such transactions and from the translation at year end exchange rates of monetary assets and liabilities denominated in foreign currencies are recognised in the Statement of Comprehensive Income in the financial year in which they arise.
Income TaxThe University is exempt from income tax in accordance with the provision of Section 17 of the Fiji Income Tax Act.
Revenue RecognitionRevenue is measured at the fair value of the consideration received or receivables. Amounts disclosed as revenue are net of returns and trade allowances. Revenue is recognised in the financial statements for the major activities as follows:
Government contributions The University treats operating contributions
l
m
n
o
i
received from Government regional members as revenue when the entitlement for the revenue is established.
Student tuition fees In prior years, private student tuition fees were recognised on receipt while sponsored student tuition fees were recognised when due. During the year, the University changed its policy to recognise all student tuition fees when due. The impact of this change in policy resulted in an increase in student fee revenue. However, the University has assessed as doubtful those private student fees for which there has been no receipt resulting in no change in surplus for the year.
Development AssistanceIn prior years, revenue from major donors were recognized on due date while other donors were recognized on receipt. The definition is now more simplified as development assistance received for recurrent funding is recognised on due date while development assistance received with specific end purposes is recognized as revenue when the conditions attached to the assistance have been met. Until those conditions are met, receipt of development assistance funds in advance is accounted for as deferred revenue and recognized as a liability. This change in policy resulted in an adjustment of prior year retained earnings of $6,458,331.
Trading ActivitiesRevenue from trading operations is recognised on receipt.
Consultancy RevenueConsultancy revenue is recognised as revenue when it is earned. Other Income Other income is recognised on receipt except where a department of the University has arranged for a University invoice to be raised to a third party; the revenue associated with these invoices is recognised on due date.
Release of Deferred RevenueRelease of deferred revenue is recognised when the donated asset is depreciated over its useful life.
Interest RevenueInterest revenue is recognised as it accrues.
ii
iii
iv
v
vi
vii
viii
Significant Accounting Policies (continued)
51
2010 A
NN
UA
L REPO
RT FIN
AN
CIA
L STATEMEN
TS
Capital Grants Aid and donations which are applied to capital items are credited to the Deferred Revenue Reserve, at the lower of cost and valuation when the related capital expenditure is incurred, and released to the Statement of Comprehensive Income as income over the life of the asset.
Endowment FundsThe University has established Endowment Funds for specific purposes. The capital amount of such funds is maintained at its original nominal value. The revenue generated through the investment of the capital is used in accordance with any conditions imposed by Council, deed, gift or by the terms of the endowments or bequests. Endowment funds are transferred to the Statement of Comprehensive Income only when no longer required for the purpose for which the fund was originally established.
Commitment AccountingThe University operates a system of commitment accounting for its non-salary expenditure. Expenditure is recognised when purchase orders are placed and charged against the appropriate cost centre.
Trade Creditors and AccrualsLiabilities for trade payable and other amounts are carried at cost (inclusive of VAT/GST where applicable) which is the fair value of the consideration to be paid in the future for goods and services received whether or not billed to the University. These amounts are unsecured and are usually paid within 30 days of recognition.
Value Added Tax (VAT)/Goods and Services Tax (GST)Revenue, expenses and assets are recognised net of the amount of associated VAT/GST, unless VAT/GST incurred is not recoverable from the Tax Authority. In this case it is recognised as part of the cost of acquisition of the asset or part of the expense.
Receivables and payables are stated inclusive of the amount of VAT/GST, receivable or payable. The net amount of VAT/GST recoverable from, or payable to, the Tax Authority is included in other receivables or payables in the Statement of Financial Position.
Superannuation Funds The University contributes to a number of defined contribution superannuation schemes. Contributions are made by employees and by the University as a percentage of salary or specified amounts as required by relevant agreements. The cost to the University is charged as an expense at the time it is incurred.
Other Current Financial Assets Non-derivative financial assets with fixed or determinable payments and fixed maturities of more than three months are classified as other current financial assets when the University has the positive intention and ability to hold it to maturity. After initial measurement, these assets are measured at amortised cost. Interest earned from these assets is recognised when due.
Comparative AmountsWhere the presentation or reclassification of items in the financial report is amended, comparable amounts shall be reclassified unless reclassification is impracticable.
Financial Risk Management Objectives and Policies The University of the South Pacific has on-going exposures to foreign currency, liquidity risk and interest rate risk through its normal operations.The overarching policies and objectives of the University’s treasury management activities are defined as being the “management and control of its cash flows, banking, and investment transactions; the effective control of the risks associated with those activities; and the pursuit of optimum performance consistent with those risks”.
The Finance and Investments Committee reviews and approves policies for managing each of these risks, which are summarised below.
Liquidity RiskThe University’s objective is to maintain a balance between continuity of funding to meet its day-to-day obligations, whilst minimising the utilisation of bank overdrafts, which in practice, are to be used for contingency purposes only.Daily operating funds are maintained with the approved bankers in the University’s operating bank accounts while surpluses are invested within approved guidelines. This arrangement covers local, regional and international bank accounts which are operated by the University.
p
q
r
s
t
u
v
w
2
Significant Accounting Policies (continued)

52
2010
AN
NU
AL
REP
ORT
FIN
AN
CIA
L ST
ATEM
ENTS
Subventions within campuses or from the main Laucala campus to other campuses are carried out in order to maintain sufficient cash balances in all campuses for the funding of day-to-day operations.
Foreign Currency Risk The University has transactional currency exposures. Such exposures arise from receipts or payments in currencies other than the University’s main operating currency (FJD), as well as accounting for the regional campuses various currency denominations.
The University maintains off-shore bank accounts in its efforts to provide natural hedge against currency exposures.
The following table demonstrates the sensitivity to a reasonably possible change in the Australian dollar (AUD), Solomon Island dollar (SBD), British pound (GBP) and Vanuatu vatu (VUV) exchange rate on the University’s surplus, with all other variables held constant:
As at
31 December 2010
31 December 2009
Financial Risk Management Objectives and Policies (continued)
Increase/(decrease) in AUD, SBD, GBP
and VUV exchange rate against FJD
Effect on surplus ($)
Interest Rate RiskThe University’s exposure to the changes in market interest rates relates primarily to the investment of surplus cash into at call or short term deposits as well as through finance lease and utilisation of bank overdrafts.
Short-term investments are either rolled over at maturity at interest rates applicable on roll-over dates, or converted to operational use if the need arises at the time of maturity. Interest on bank overdrafts is subject to changes in market interest rates.
Long-term investments are not feasible due to the nature of operations within the University, therefore, avoiding the risk of a cashflow mismatch or a liquidity shortfall.
Lending Facilities - Debt, Refinancing and Granting SecurityThe University ensures that its borrowing, private financing and partnership arrangements are negotiated, structured, documented and the maturity profile of the raised monies managed, with a view to obtaining competitive and favourable terms in light of market conditions prevailing at the time.
Prior to entering into or negotiating for any agreement to increase lending facilities (including leases) or re-finance the University’s current borrowing arrangements, approval from the Finance and Investments Committee (FIC) must be obtained.
In raising capital finance, those with delegated authority will take account of:
the University’s powers and rules and, in particular the University’s Charter, Statutes, Financial Regulations and Scheme of Financial Delegations;
any legal or fiscal statutory restrictions; and
the terms and covenants of borrowing.
i
ii
iii
10%
(10%)
10%
(10%)
(883,826)
1,080,232
(811,960)
992,395

53
2010 A
NN
UA
L REPO
RT FIN
AN
CIA
L STATEMEN
TS
Government contributions
Student tuition fees
Development assistance
Trading activities
Consultancy income
Other income
Release of deferred revenue
Interest income
Foreign currency gain
Income
$
Notes 2010 2009
$
1
2
3
4
4a
5
6
48,924,962
33,472,981
27,540,216
14,863,350
924,726
7,629,718
3,922,051
1,848,629
-
49,923,430
27,339,344
22,077,711
13,373,779
1,870,590
7,273,430
3,633,384
1,352,417
1,375,625
Total operating income 139,126,633 128,219,710
Staff costs
Operating costs
Depreciation
Provision for doubtful debts
Write down in value of inventories
Foreign currency loss
Interest on finance lease
Expenditure
$
Notes 2010 2009
$
7
8
14
64,604,367
57,906,853
5,732,796
4,027,298
383,691
1,694,012
-
55,536,695
51,808,523
5,101,458
(317,634)
141,468
-
31,250
Total operating expenditure 134,349,017 112,301,760
Surplus for the year 4,777,616 15,917,950
The accompanying notes form an integral part of this statement.
Statement of Comprehensive Income For the year ended 31 December 2010
(Restated)

54
2010
AN
NU
AL
REP
ORT
FIN
AN
CIA
L ST
ATEM
ENTS
Cash and short - term deposits
Other current financial assets
Prepayments
Accounts receivable
Inventories
Current Assets
$
Notes 2010 2009
$
12
12
11
10
9
14,781,546
39,393,285
652,453
15,036,718
5,031,712
74,895,714
22,525,137
22,145,242
451,962
10,448,570
4,748,803
60,319,714
Total assets 246,132,791 187,123,425
The accompanying notes form an integral part of this statement.
Non-current assets
Property, plant and equipment 14 171,237,077
171,237,077
126,803,711
126,803,711
Creditors and accruals
Development assistance (projects) unexpended
Current liabilities
$
Notes 2010 2009
$
16a
16b
20,042,932
20,638,170
40,681,102
17,039,905
10,077,621
27,117,526
Total liabilities 41,563,870 27,117,526
Non Current liabilities
Creditors and accruals 882,768
882,768
-
-
Net assets 204,568,921 160,005,899
Deferred revenue reserve
Endowment capital
Retained earnings
Funds and reserves
$
Notes 2010 2009
$
154,354,299
7,688,892
42,525,730
204,568,921
115,094,458
7,163,327
37,748,114
160,005,899
Represented by:
Statement of Financial PositionAt 31 December 2010
(Restated)

55
2010 A
NN
UA
L REPO
RT FIN
AN
CIA
L STATEMEN
TSStatement of Cash FlowsFor the year ended 31 December 2010
Recurrent activities
Development assistance - recurrent
Government contributions
Interest received
Student tuition fees
Trading Activities
Other receipts
Staff costs
Other operating costs
Normal operating activities
$
Notes 2009
10,774,832
49,443,406
1,850,972
30,594,452
14,556,698
8,822,607
116,042,967
(61,897,512)
(48,152,326)
(110,049,838)
The accompanying notes form an integral part of this statement.
2010
$
7,470,355
47,481,452
1,352,418
27,205,310
12,755,214
8,849,989
105,114,738
(51,590,453)
(32,290,453)
(83,880,906)
Net cash flows provided by recurrent activities 5,993,129 21,233,832
Project activities
Development assistance - projects
Staff costs - projects
Other operating costs - projects
22,616,383
(2,706,854)
(9,836,218)
(12,543,072)
8,720,735
(2,792,798)
(8,714,100)
(11,506,898)
Net cash flows provided by/(used in) project activities 10,073,311 (2,786,163)
Total net cash flows provided by normal operating activities 16,066,440 18,447,669 13a
Investing activities
Payment for property plant and equipment
Proceeds from disposal of fixed assets
Net payment for other current financial assets
(6,994,009)13b
6,139
(16,722,480)
(4,182,963)
-
(2,352,951)
Net cash flows used in investing activities (23,710,350) (6,535,914)
Financing activities
Payment of finance lease liabilities (99,681) (192,823)
Net cash flow used in financing activities (99,681) (192,823)
Net (decrease)/increase in cash and cash equivalents
Cash and cash equivalents at 1 January
Net (decrease)/increase in cash and cash equivalents
Cash and cash equivalents at 31 December
(7,743,591)
22,525,137
(7,743,591)
14,781,546
11,718,932
10,806,205
11,718,932
22,525,13712
(Restated)
56
2010
AN
NU
AL
REP
ORT
FIN
AN
CIA
L ST
ATEM
ENTS
The accompanying notes form an integral part of this statement.
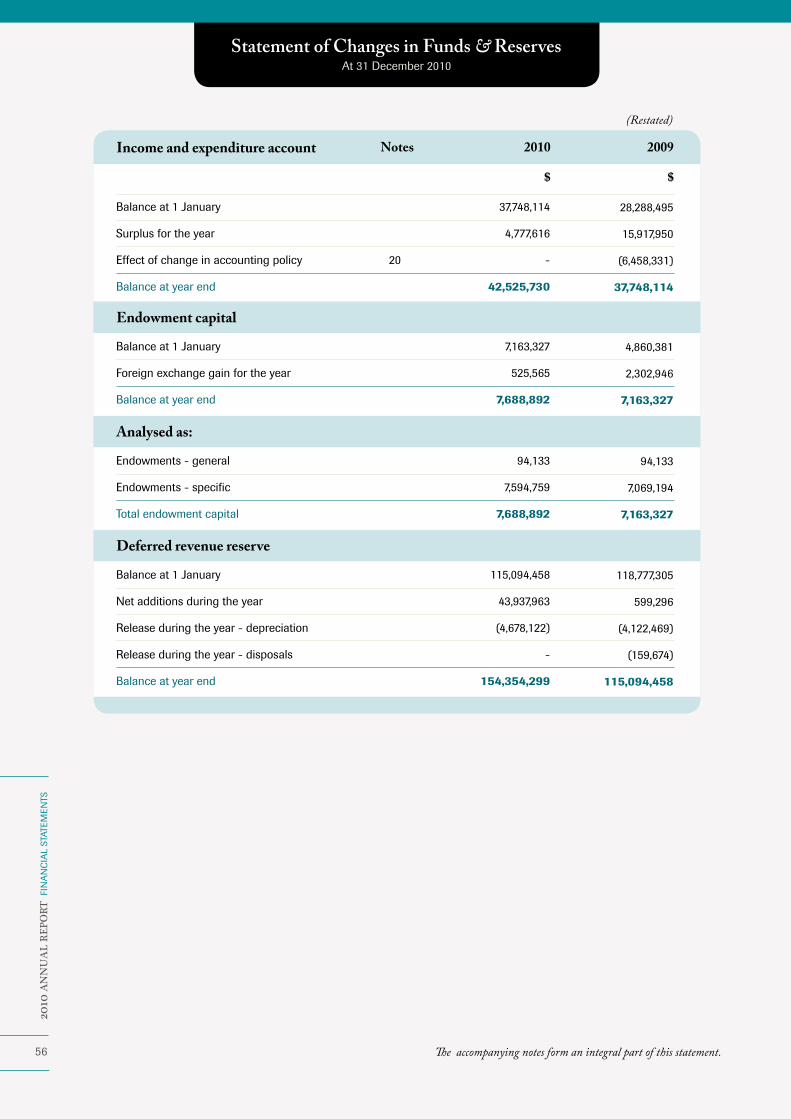
Statement of Changes in Funds & ReservesAt 31 December 2010
Balance at 1 January
Surplus for the year
Effect of change in accounting policy
Balance at year end
Income and expenditure account
$
Notes 2010 2009
$
20
37,748,114
4,777,616
-
42,525,730
28,288,495
15,917,950
(6,458,331)
37,748,114
Endowment capital
Balance at 1 January
Foreign exchange gain for the year
Balance at year end
7,163,327
525,565
7,688,892
4,860,381
2,302,946
7,163,327
Analysed as:
Endowments - general
Endowments - specific
Total endowment capital
94,133
7,594,759
7,688,892
94,133
7,069,194
7,163,327
Deferred revenue reserve
Balance at 1 January
Net additions during the year
Release during the year - depreciation
Release during the year - disposals
Balance at year end
115,094,458
43,937,963
(4,678,122)
-
154,354,299
118,777,305
599,296
(4,122,469)
(159,674)
115,094,458
(Restated)

57
2010 A
NN
UA
L REPO
RT FIN
AN
CIA
L STATEMEN
TSNotes to the Financial Statements
Cook Islands
Fiji
Kiribati
Marshall Islands
Nauru
Niue
Samoa
Solomon Islands
Tokelau
Tonga
Tuvalu
Vanuatu
$
2009 Total
277,241
23,519,860
1,252,479
104,373
71,757
32,617
955,668
3,728,083
22,832
1,027,424
453,371
1,170,937
Special Grant
$
1 Government Contributions General Grant 2010 Total
$$
76,649
14,077,342
154,929
58,710
29,355
58,710
704,519
79,911
-
99,481
58,710
910,004
353,890
37,597,202
1,407,408
163,083
101,112
91,327
1,660,187
3,807,994
22,832
1,126,905
512,081
2,080,941
361,112
38,364,492
1,436,131
166,411
103,175
93,190
1,694,068
3,885,708
23,298
1,149,903
522,532
2,123,410
48,924,962 49,923,430 32,616,642 16,308,320
Regional students
International students
Distance and flexible learning
College of Foundation Studies
Republic of Marshall Islands (RMI)
Master of Business Administration
Others
$
20092 Student Tuition Fees 2010
$
15,776,026
480,975
16,257,001
7,502,179
23,759,180
2,923,838
750,374
2,197,348
3,842,241
10,847,563
493,575
11,341,138
6,470,541
17,811,679
2,746,272
1,132,700
1,937,803
3,710,890
33,472,981 27,339,344
(Restated)
58
2010
AN
NU
AL
REP
ORT
FIN
AN
CIA
L ST
ATEM
ENTS
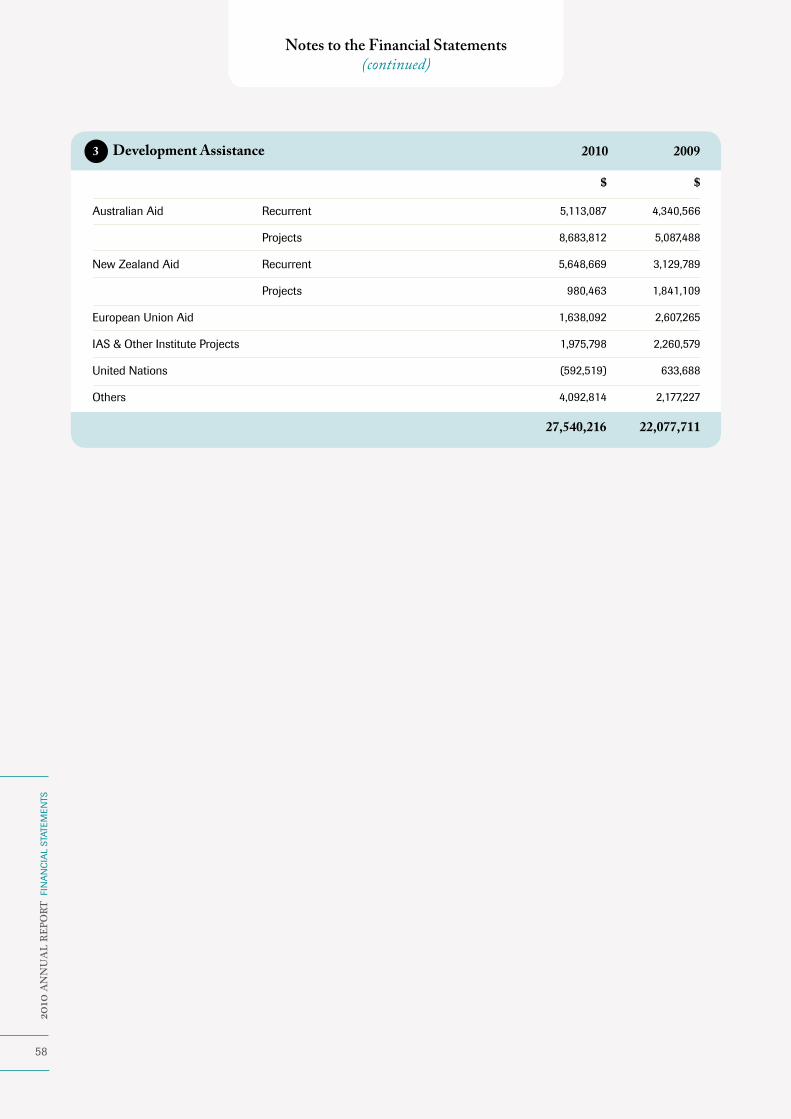
Notes to the Financial Statements(continued)
Australian Aid
New Zealand Aid
European Union Aid
IAS & Other Institute Projects
United Nations
Others
$
20093 Development Assistance 2010
$
5,113,087
8,683,812
5,648,669
980,463
1,638,092
1,975,798
(592,519)
4,092,814
4,340,566
5,087,488
3,129,789
1,841,109
2,607,265
2,260,579
633,688
2,177,227
27,540,216 22,077,711
Recurrent
Projects
Recurrent
Projects

59
2010 A
NN
UA
L REPO
RT FIN
AN
CIA
L STATEMEN
TSNotes to the Financial Statements
(continued)
Book Centre
Catering services
- Laucala
Residential services
- Laucala
- Emalus
- Alafua
Gym and Community Recreation Centre
ICT Park
Others
$
2009
2,602,827
1,180,449
253,815
2010
$
4 Trading Activities 2010 2009
$$
9,984,134
-
4,037,091
400,042
267,861
174,222
2,541,054
714,630
235,315
8,087,226
1,077,743
3,490,999
270,486
251,110
196,215
13,373,779 14,863,350
(Restated)(Restated)
Consultancy work with Tonga police
Dairy Farms Fiji - blue prawns project
Professional services provided and Project Consultancies
Review of Department of Co-operatives
Training and teaching
Others
$
20094a Consultancy Income 2010
$
17,059
50,403
492,900
-
144,877
219,487
83,728
96,082
1,224,845
46,000
385,059
34,876
924,726 1,870,590
60
2010
AN
NU
AL
REP
ORT
FIN
AN
CIA
L ST
ATEM
ENTS
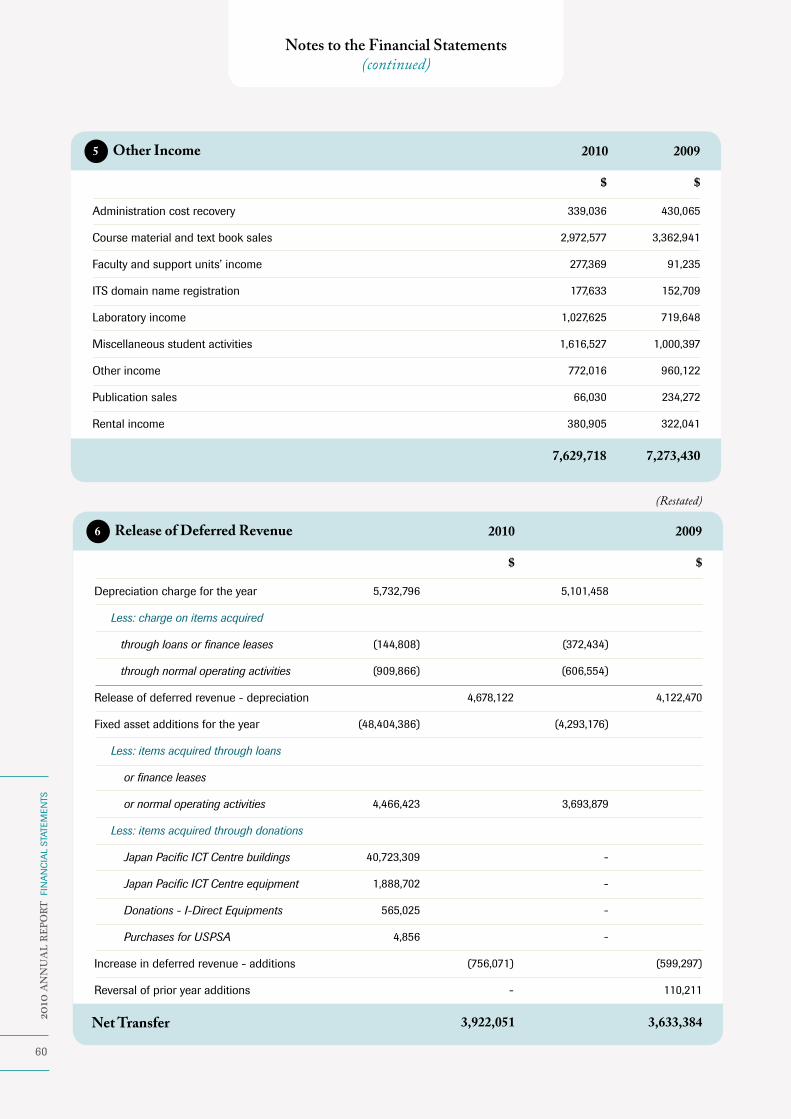
Notes to the Financial Statements(continued)
Administration cost recovery
Course material and text book sales
Faculty and support units’ income
ITS domain name registration
Laboratory income
Miscellaneous student activities
Other income
Publication sales
Rental income
$
20095 Other Income 2010
$
339,036
2,972,577
277,369
177,633
1,027,625
1,616,527
772,016
66,030
380,905
430,065
3,362,941
91,235
152,709
719,648
1,000,397
960,122
234,272
322,041
7,629,718 7,273,430
Depreciation charge for the year
Less: charge on items acquired
through loans or finance leases
through normal operating activities
Release of deferred revenue - depreciation
Fixed asset additions for the year
Less: items acquired through loans
or finance leases
or normal operating activities
Less: items acquired through donations
Japan Pacific ICT Centre buildings
Japan Pacific ICT Centre equipment
Donations - I-Direct Equipments
Purchases for USPSA
Increase in deferred revenue - additions
Reversal of prior year additions
$
2009
5,732,796
(144,808)
(909,866)
(48,404,386)
4,466,423
40,723,309
1,888,702
565,025
4,856
2010
$
6 Release of Deferred Revenue
4,678,122
(756,071)
-
5,101,458
(372,434)
(606,554)
(4,293,176)
3,693,879
-
-
-
-
4,122,470
(599,297)
110,211
3,633,384 3,922,051
(Restated)
Net Transfer

61
2010 A
NN
UA
L REPO
RT FIN
AN
CIA
L STATEMEN
TSNotes to the Financial Statements
(continued)
Academic and comparable staff
Intermediate and junior staff
Hourly paid staff
Provision for leave entitlement
Senior management
Total staff costs
Total staff costs for 2010 include strategic plan staff cost of $557,340.Academic and comparable staff and senior management pay includes 8.2% salary adjustment for 2009 and 2010.
$
20097 Staff Costs 2010
$
43,587,184
12,054,262
6,890,215
299,215
1,773,491
64,604,367
37,325,593
10,751,480
6,321,773
(407,250)
1,545,099
55,536,695
Staff numbers (headcounts) by category as at 31 December:
Academic and comparable staff
Intermediate and junior staff
Hourly paid staff
Senior management
Total staff numbers
540
544
351
8
1,443
500
508
368
8
1,384
Annualized taxable emoluments for higher paid staff
$100,000 - $119,999
$120,000 - $139,999
$140,000 - $159,999
$160,000 - $179,999
$180,000 - $199,999
$200,000 - $219,999
$220,000 - $239,999
$240,000 - $259,999
$260,000 - $279,999
34
18
15
6
2
1
-
1
1
78
27
7
9
2
2
1
-
1
1
50
Reflects current annualised taxable emoluments after the 8.2% salary adjustment.

62
2010
AN
NU
AL
REP
ORT
FIN
AN
CIA
L ST
ATEM
ENTS
Notes to the Financial Statements(continued)
Cost of sales
Travel and related expenses
Student-related expenses
Grounds and maintenance
Consultancy expenses:
GMES project
Other
Total consultancy expenses
Utilities
Telecommunications
PRIDE in-country expenses
Library books
Staff recruitment and passages
Printing and stationery
Insurance premiums
Computer software and hardware
Workshop expenses
Advertising
Hospitality/expenditure on meetings
Teaching materials
Operating costs - strategic plan
Sub-total
Other items of expenditure
Fees paid to auditors:
External audit
Internal audit
Other services
Projects
Honorarium:
Council
Finance and investments committee
Audit and risk committee
$
2009
225,957
2,467,974
2010
$
8 Operating Costs
10,265,704
5,269,709
6,871,050
3,371,946
2,693,931
3,850,640
3,238,045
106,671
2,092,981
1,249,441
2,356,754
1,593,345
938,726
1,963,055
1,559,225
875,740
1,319,135
953,609
50,569,707
7,031,726
39,374
168,000
6,693
45,957
24,444
6,984
13,968
636,570
1,712,066
8,972,509
3,856,307
5,108,490
2,527,981
2,348,636
2,736,312
2,489,794
1,707,183
2,100,239
1,296,836
2,167,617
1,278,677
1,273,224
1,344,314
1,142,304
503,442
1,406,955
-
42,260,820
9,192,126
39,229
223,806
16,542
37,000
21,000
6,000
12,000
51,808,52357,906,853
(Restated)
Total operating costs

63
2010 A
NN
UA
L REPO
RT FIN
AN
CIA
L STATEMEN
TSNotes to the Financial Statements
(continued)
Balance at 1 January 2009
Additions
Expensed
Write down in value
Cost or valuation at 31 December 2009
Balance at 1 January 2010
Additions
Expensed
Write down in value
Cost or valuation at 31 December 2010
$
490,436
(15,191)
(8,598)
47,116
513,763
513,763
100,251
(25,302)
-
588,712
$
9 Inventories
159,781
(213,840)
163,129
41,936
151,006
151,006
529,079
(518,490)
-
161,595
17,277
470,387
(461,478)
-
26,186
26,186
76,256
(100,825)
-
1,617
4,803,413
6,263,830
(6,176,972)
(141,468)
4,748,803
4,748,803
10,134,134
(9,462,764)
(388,461)
5,031,712
$
4,135,919
6,022,474
(5,870,025)
(230,520)
4,057,848
4,057,848
9,428,548
(8,818,147)
(388,461)
4,279,788
$$
Goods & Publications
AcademicGowns
Maintenance Catering & Domestic TOTAL
Total cost of inventories
Less: unrealised profit
Less: provision for obsolescence
Cost or valuation at year end
$
2009Analysis of value of inventories 2010
$
6,995,475
(1,291,135)
(672,628)
5,031,712
6,328,875
(871,517)
(708,555)
4,748,803
(Restated)
Book centre - inventory
Book centre - goods in transit
Regional campuses - books
Regional campuses - course materials
Institute of Pacific Studies
Institute of Education
Less: provision for obsolescence
Cost or valuation at year end
$
2009Analysis of goods and publications 2010
$
2,058,768
422,503
1,432,573
353,894
604,268
65,232
4,937,238
(657,450)
4,279,788
1,759,151
992,723
300,701
991,912
617,477
84,491
4,746,455
(688,607)
4,057,848

64
2010
AN
NU
AL
REP
ORT
FIN
AN
CIA
L ST
ATEM
ENTS
Notes to the Financial Statements(continued)
Government contributions
Trade
Students
Staff
VAT/GST receivable
Other
Less: provision for doubtful debts
$
200910 Accounts Receivable 2010
$
1,456,796
1,063,678
5,332,893
108,064
4,894,999
8,291,789
21,148,219
(6,111,501)
15,036,718
1,975,240
1,423,626
2,454,364
118,453
1,787,219
4,773,871
12,532,773
(2,084,203)
10,448,570
(Restated)
Notes
10a
10b
10c
10d
10e
10f
10g
Fiji
Marshall Islands
Nauru
Niue
Solomon Islands
Tokelau
Tonga
Ageing of government contributions due:
0 to 90 days
91 to 180 days
181 to 365 days
Between 1 and 2 years old
Between 2 and 3 years old
More than 3 years old
-
-
61,191
-
1,265,111
47,396
83,098
1,456,796
1,166,748
290,048
-
-
-
-
1,456,796
130,451
279,521
398,552
189,353
907,067
-
70,296
1,975,240
1,154,092
90,693
107,213
365,730
154,095
103,417
1,975,240
Any overpayments by member countries are classified as creditors.
10a Contributions due from governments:
$
20092010
$

65
2010 A
NN
UA
L REPO
RT FIN
AN
CIA
L STATEMEN
TS
Laucala campus and book centre
Emalus campus and book centre
Less: provision for doubtful debts
Ageing of trade debtors due:
0 to 90 days
91 to 180 days
181 to 365 days
Between 1 and 2 years old
Between 2 and 3 years old
More than 3 years old
1,041,032
22,646
1,063,678
(573,875)
489,803
224,840
529,927
150,347
69,161
31,639
57,764
1,063,678
1,165,833
257,793
1,423,626
(99,154)
1,324,472
-
1,041,860
169,798
124,462
79,483
6,755
1,268
1,423,626
10b Trade Debtors
$
20092010
$
Notes to the Financial Statements(continued)
Laucala
Alafua
Emalus
Other regional campuses
Less: provision for doubtful debts
Ageing of student debtors due:
0 to 90 days
91 to 180 days
181 to 365 day
Between 1 and 2 years old
Between 2 and 3 years old
More than 3 years old
2,695,961
171,555
1,236,636
1,228,741
5,332,893
(4,721,982)
610,911
376,786
1,778,094
930,124
515,061
568,820
1,164,008
5,332,893
1,127,540
32,748
49,476
1,244,600
2,454,364
(1,885,689)
568,675
272,139
509,863
349,140
237,800
386,012
699,410
2,454,364
10c Student Debtors
$
20092010
$

66
2010
AN
NU
AL
REP
ORT
FIN
AN
CIA
L ST
ATEM
ENTS
Notes to the Financial Statements(continued)
Laucala
Alafua
Less: provision for doubtful debts
Ageing of staff debtors due:
0 to 90 days
91 to 180 days
181 to 365 day
Between 1 and 2 years old
Between 2 and 3 years old
More than 3 years old
105,638
2,426
108,064
(98,344)
9,720
2,259
3,278
4,183
-
-
98,344
108,064
114,585
3,868
118,453
(99,360)
19,093
-
-
-
19,920
188
98,345
118,453
10d Staff Debtors
$
20092010
$
Laucala Book Centre
Alafua Book Centre
Laucala Japan Pacific ICT Centre
Less: provision for doubtful debts
Ageing of VAT/ GST due:
0 to 90 days
91 to 180 days
181 to 365 days
Between 1 and 2 years old
Between 2 and 3 years old
More than 3 years old
2,667,313
64,012
2,163,674
4,894,999
(717,300)
4,177,699
96,153
1,525,531
1,486,097
365,445
305,809
1,115,964
4,894,999
1,787,219
-
-
1,787,219
-
1,787,219
112,852
65,950
186,643
305,809
398,685
717,280
1,787,219
10e VAT/GST receivable
$
20092010
$

67
2010 A
NN
UA
L REPO
RT FIN
AN
CIA
L STATEMEN
TS
Development assistance partners - projects
Interest receivable
Other debtors
Ageing of other debtors due:
0 to 90 days
91 to 180 days
181 to 365 days
Between 1 and 2 years old
Between 2 and 3 years old
More than 3 years old
7,565,682
578,817
147,290
8,291,789
2,215,522
2,619,508
2,816,125
327,538
123,466
189,630
8,291,789
2,852,709
581,160
1,340,002
4,773,871
426,955
637,761
603,491
2,516,853
570,542
18,269
4,773,871
10f Other Debtors
$
20092010
$
Notes to the Financial Statements(continued)
Balance at 1 January
Additional provision made during the year
Balance at 31 December
2,084,203
4,027,298
6,111,501
1,989,418
94,785
2,084,203
10g Movement in provision for doubtful debts
$
20092010
$
The creation and release of provision for doubtful debts is shown under Provison for doubtful debts in the Statement of Comprehensive Income.
Amounts charged to the provision account are written off when there is no expectation of recovery.
Laucala
Alafua
Emalus
Laucala Book centre
554,366
12,873
-
85,214
652,453
357,359
6,089
49,248
39,266
451,962
11 Prepayments
$
20092010
$

68
2010
AN
NU
AL
REP
ORT
FIN
AN
CIA
L ST
ATEM
ENTS
Notes to the Financial Statements(continued)
Cash and short - term deposits
- Current accounts
- Term deposits (3 months or less)
- Cash on hand and petty cash
Other current financial assets
Other current financial assets comprise term deposits maturing between 3 and 12 months.
$
200912 Cash and Cash Equivalents 2010
$
8,742,352
6,013,968
25,226
14,781,546
39,393,285
54,174,831
8,684,293
13,817,456
23,388
22,525,137
22,145,242
44,670,379
a) Where held
In Fiji
With other regional banks
In other overseas accounts
49,589,884
2,983,447
1,601,500
54,174,831
41,413,546
2,396,050
860,783
44,670,379
b) The following term deposits are denominated in the following currencies but stated in Fijian Dollars:
Fijian dollars
Australian dollars
Solomon Island dollars
British pounds
Cash & cash equivalents denominated in other currencies are exposed to foreign currency risk.
35,685,164
8,240,586
1,467,535
13,968
45,407,253
27,031,137
7,430,446
1,485,710
15,403
35,962,696
c) Comprising:
University funds
Development assistance (projects)
Endowment funds
Development assistance (projects) and Endowment funds are restricted, not available for University’s recurrent expenditure.
22,068,633
21,536,673
10,569,525
54,174,831
23,670,126
11,463,362
9,536,891
44,670,379
69
2010 A
NN
UA
L REPO
RT FIN
AN
CIA
L STATEMEN
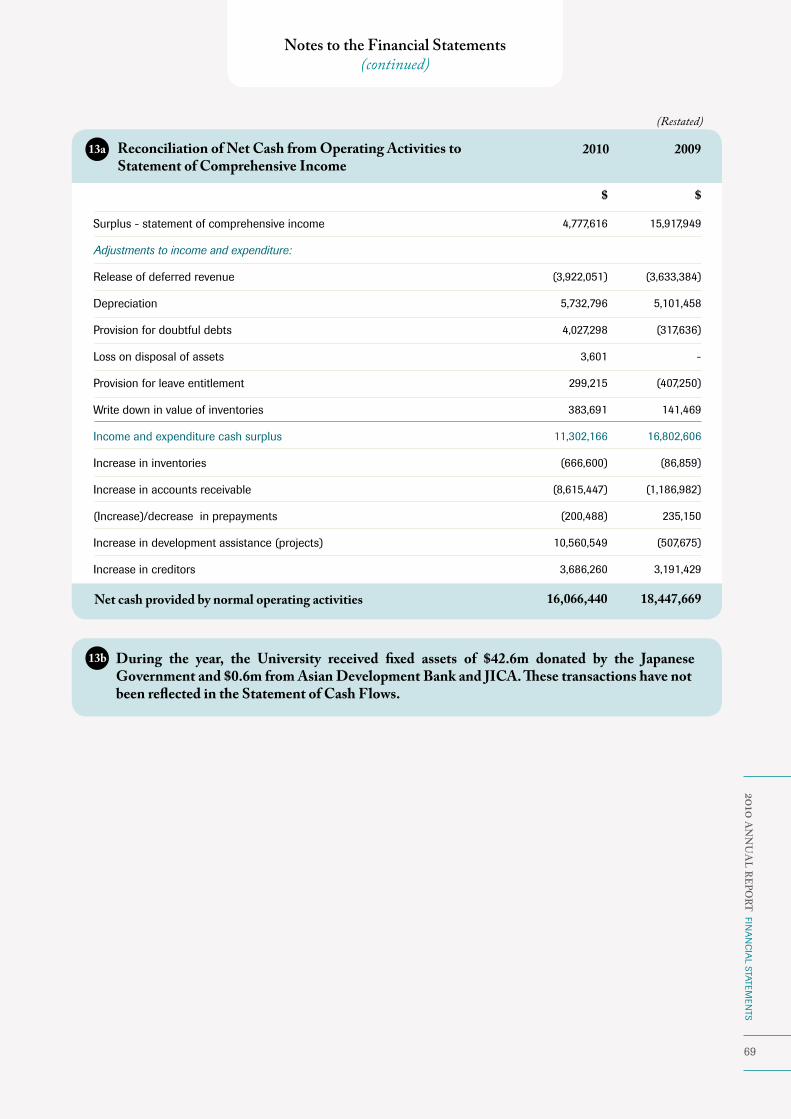
TSNotes to the Financial Statements
(continued)
Surplus - statement of comprehensive income
Adjustments to income and expenditure:
Release of deferred revenue
Depreciation
Provision for doubtful debts
Loss on disposal of assets
Provision for leave entitlement
Write down in value of inventories
Income and expenditure cash surplus
Increase in inventories
Increase in accounts receivable
(Increase)/decrease in prepayments
Increase in development assistance (projects)
Increase in creditors
$
200913a Reconciliation of Net Cash from Operating Activities to Statement of Comprehensive Income
2010
$
4,777,616
(3,922,051)
5,732,796
4,027,298
3,601
299,215
383,691
11,302,166
(666,600)
(8,615,447)
(200,488)
10,560,549
3,686,260
15,917,949
(3,633,384)
5,101,458
(317,636)
-
(407,250)
141,469
16,802,606
(86,859)
(1,186,982)
235,150
(507,675)
3,191,429
16,066,440 18,447,669
(Restated)
Net cash provided by normal operating activities
13b During the year, the University received fixed assets of $42.6m donated by the Japanese Government and $0.6m from Asian Development Bank and JICA. These transactions have not been reflected in the Statement of Cash Flows.

70
2010
AN
NU
AL
REP
ORT
FIN
AN
CIA
L ST
ATEM
ENTS
Notes to the Financial Statements(continued)
Cost or Valuation:
Deemed cost at 1 January 2010
Additions
Disposals
Transfers between asset classes
Deemed cost at 31 December 2010
Accumulated depreciation:
Accumulated depreciation at 1 Jan 2010
Charge for the year
Disposals
Accumulated depreciation at 31 Dec 2010
Net carrying amount at 31 Dec 2010
Net carrying amount at 31 Dec 2009
$
10,035,633
4,796,961
(56,145)
108,529
14,884,978
6,235,559
1,857,848
(56,144)
8,037,263
6,847,715
3,800,073
$
14 Property, Plant and Equipment
1,590,890
315,243
(123,153)
-
1,782,980
901,829
297,373
(113,414)
1,085,788
697,192
689,062
2,080,254
3,760,942
-
(1,741,389)
4,099,807
-
-
-
-
4,099,807
2,080,254
153,551,841
50,175,902
(179,298)
-
203,548,445
26,748,130
5,732,796
(169,558)
32,311,368
171,237,077
126,803,711
$
139,845,064
41,302,756
-
1,632,860
182,780,680
19,610,742
3,577,575
-
23,188,317
159,592,363
120,234,322
$$
Property Equipment & Furniture
Vehicles & Vessels
Work in Progress TOTAL
Assets under finance lease The carrying amount of tangible fixed assets was nil (2009: $106,350) in respect of assets held under finance lease reported under the equipment category relating to PABX equipment. The depreciation charge for the year was $88,700 (2009: $260,215).
Work in progress Work in progress relates to costs for property-related projects where the project has not been completed. The costs will be capitalised once all major items of expenditure, other than the payment of retention monies, have been incurred.

71
2010 A
NN
UA
L REPO
RT FIN
AN
CIA
L STATEMEN
TS
Continuing from 2009:
Austra learn accommodation
Japan Pacific ICT Centre building project
Medical centre renovations
Student car park
Tree Tops/Barista/USPSA renovations
FBE roof replacement
Regional campuses - MYOB implementation
New projects:
120 bed hostel
Lab equipment replacement installations
ITS-IBM blade server-SAN storage
Other ITS projects
Improve campus infrastructure and developments
Roof replacement of building 202
FBE tourism lounge and toilets
New modules in Banner
Renovation of staff housings
Concrete roading
Lift in FSTE building
Carrying amount of property, plant and equipment at 31 December 2010
This is represented by:
Deferred revenue
Carrying amount of properties acquired directly or through loans:
Statham street campus
Services complex
Residential block
Carrying amount of assets funded from normal operating activities
$
2009Carrying amount of work in progress projects at 31 Dec 2010
$
-
-
-
-
-
-
55,600
1,938,337
575,017
183,775
514,656
400,000
35,550
34,898
1,795
136,280
87,504
136,395
4,099,807
84,931
934,936
5,897
248,037
285,622
412,302
108,529
-
-
-
-
-
-
-
-
-
-
-
2,080,254
(Restated)
Notes to the Financial Statements(continued)
14 Property, Plant & Equipment (continued)
Reconciliation of fixed assets to related accounts: $
171,237,077
154,354,299
4,025,509
110,880
784,000
11,962,389
171,237,077

72
2010
AN
NU
AL
REP
ORT
FIN
AN
CIA
L ST
ATEM
ENTS
Notes to the Financial Statements(continued)
15 Financing Facilities
The University has access to overdraft facilities of $4,084,818 (2009: $4,075,007) with various banks across the region for which all conditions precedent have been met. As at 31 December 2010, Nil (2009: $103,000) was utilised.
Cash at bank and in hand earns interest at floating rates based on daily bank deposit rates. The fair value of cash and cash equivalents as at 31 December 2010 is $14,781,546 (2009: $22,628,139).
Accrual for leave entitlement
Member countries’ contributions received in advance
Obligations under finance leases
Other creditors and accruals
Payroll creditors
Student creditors
Student fees received in advance
Trade creditors
$
200916a Creditors and Accruals 2010
$
3,074,598
2,599,718
-
202,568
3,374,499
82,923
551,985
10,156,641
20,042,932
2,775,384
1,788,585
99,681
643,657
1,557,104
78,098
173,353
9,924,043
17,039,905
(Restated)
Development assistance (projects) unexpended
$
200916b Project Funds Unexpended 2010
$
20,638,170 10,077,621
(Restated)

73
2010 A
NN
UA
L REPO
RT FIN
AN
CIA
L STATEMEN
TS
The commitments in respect of leased assets are as follows:
Not later than one year
Deduct future finance charges
Lease liability
Analysed as:
Current liability
$
200917 Commitments 2010
$
-
-
-
-
-
101,906
(2,225)
99,681
99,681
99,681
(Restated)
Notes to the Financial Statements(continued)
a) Finance lease commitments
The commitments in respect of leased assets are as follows:
Expiring within one year
Expiring within more than one year but less than two years
Expiring within more than two years but less than five years
652,455
652,455
163,114
1,468,024
683,255
683,255
877,169
2,243,679
b) Operating lease commitments
The University has an operating lease with Fuji Xerox Fiji for the provision of managed multi function device services. Minimum monthly lease of $54,371 for five years subject to adjustments based upon actual utilization.
c) Capital commitments
The University has a capital commitment of $1,453,752 arising from 120 bed hostel under construction (total cost: $3,392,089). The balance has not been recognised as a liability at balance date.

74
2010
AN
NU
AL
REP
ORT
FIN
AN
CIA
L ST
ATEM
ENTS
Notes to the Financial Statements(continued)
Contingent Liabilities:
As at 31 December, the University’s contingent liabilities are estimated to be:
Fiji Electricity Authority - guarantees given
EDF programme management unit - guarantees given
FIRCA - customs bond
Ministry of Primary Industries, Land and Water
VAT on contributions received from Fijian government (1992 - 2007)
Contingent Assets:
VAT on Fijian government contributions (1992 - 2007)
$
Dec 200918 Contingent Assets and Liabilities Dec 2010
$
158,857
223,744
331,645
8,963
39,802,087
40,525,296
39,802,087
158,857
223,744
331,645
8,963
39,802,087
40,525,296
39,802,087
(Restated)
The Fiji Islands Revenue Customs Authority advised in a letter dated June 2007 that the University may be liable to pay VAT on contributions received from the Government of Fiji since 1992. The University has made an effort in 2009 to close the matter with FIRCA, but no reply nor any formal assessment has been issued by FIRCA since the University’s last communication dated 20 October 2009. Accordingly, no provision for liability has been made in the financial statements.
The University claims Government contributions on a VAT exclusive basis. In the event that the tax liability is considered probable, the University would make a claim for the short fall in payment of contributions and recognise a receivable amount to the same value as the potential tax liability.
There are various legal claims and trade disputes pending against the University at the balance date. The University considers these claims, arising in the normal course of business, to be immaterial and mostly spurious. No amounts have been provided in relation to any of these matters.
19 Insurance
The University has taken cover for combined material damage and business interruption at a replacement value of $317,717,612 (2009: $317,717,612).
Please refer to Statement of Accounting Policies, paragraph 1(o) (iii).
The effect of the change in accounting policy affected the following accounts which have been restated:
Increase in Development assistance (projects) unexpended
Decrease in Development assistance income
Decrease in other debtors - Development assistance partners income
Decrease in retained earnings
$
200920 Change in Accounting Policy
(10,077,621)
766,581
2,852,709
6,458,331

LapitaLapita potsherd image courtesy
of Dr Frank Thomas
The Lapita people are believed to be the common ancestors of the Polynesians, Micronesians and Austronesian-speaking Melanesians. Their distinctive art and culture are subtly exhibited in these pages as the theme for this year’s Annual Report which was inspired and based on the shapes, geometric patterns and some anthropomorphic figures found on the pottery of the Lapita people.
Conceptually, these graphic elements used throughout the report signify the connection of the South Pacific people through their Lapita ancestry - the same connection the University of the South Pacific continues to strengthen by bringing people from the region together.

2010
AN
NU
AL
REP
ORT
76
Recommended