Department of Agricultural and Biosystems Engineering
Cover Crops, Wetlands, and Conservation Drainage
Matthew HelmersDean’s Professor, College of Ag. & Life Sciences
Professor, Dept. of Ag. and Biosystems Eng.Iowa State University
Department of Agricultural and Biosystems Engineering
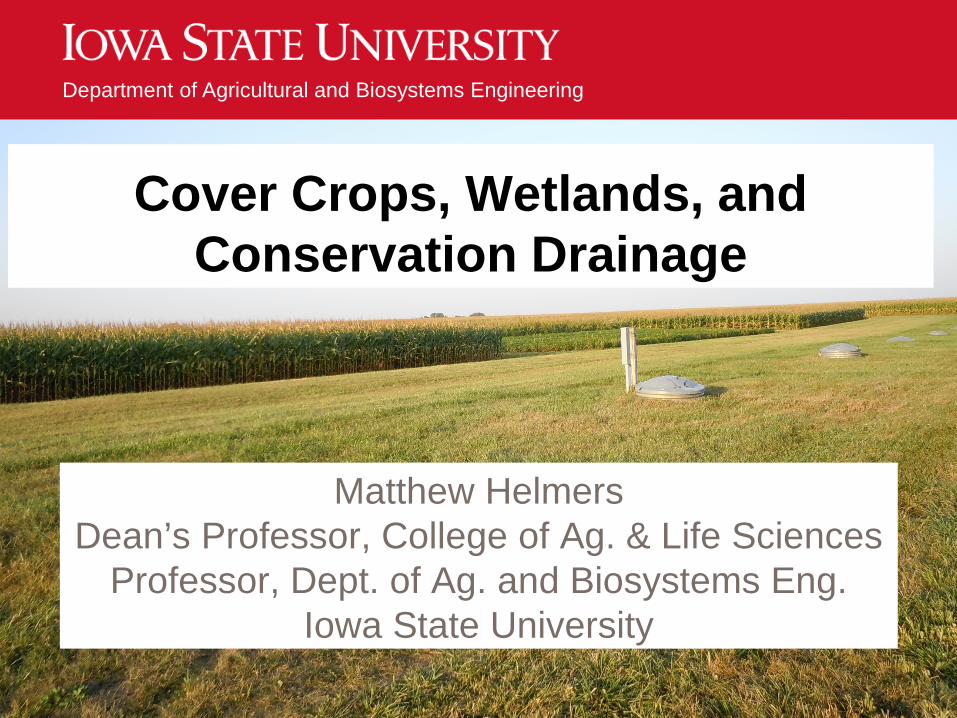
Estimated Nitrate-N Loss, January to June for 1997-2006
Source: David et al., 2010
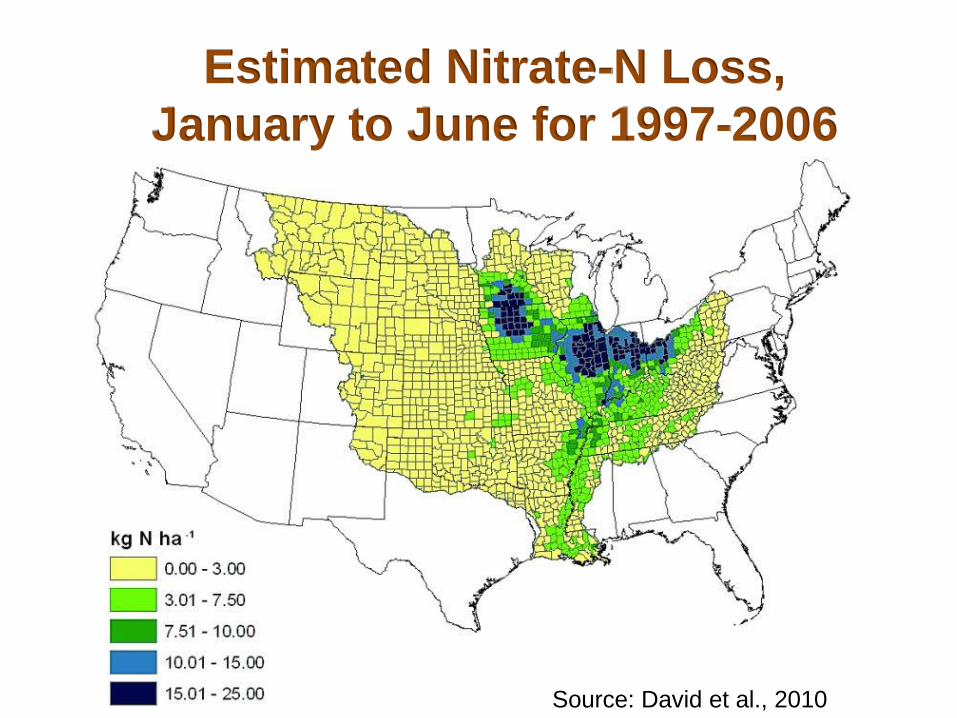
Gulf of Mexico Hypoxia Goals
EPA-SAB Recommendations: Reduce Total Riverine Nitrogen and Phosphorus Loads by 45%
Hypoxia Action Plan Goal: Reduce the size of the zone to 5,000 km2
Is this Primarily a Fertilizer Problem?
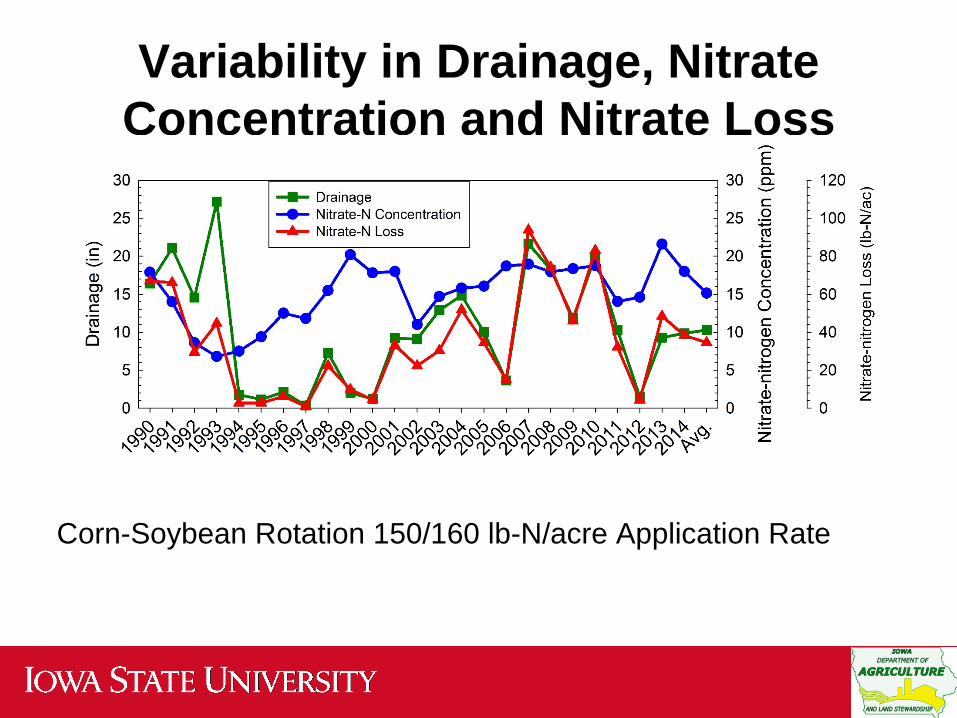
Corn-Soybean Rotation 150/160 lb-N/acre Application Rate
Variability in Drainage, Nitrate Concentration and Nitrate Loss
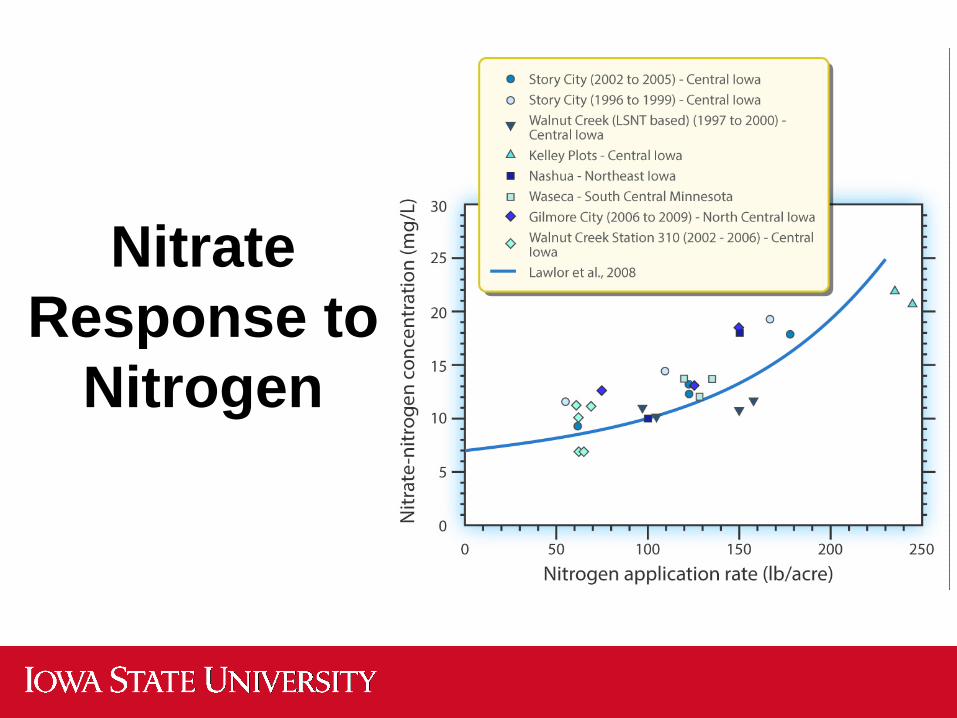
Nitrate Response to
Nitrogen
Is this Just a Natural Process?
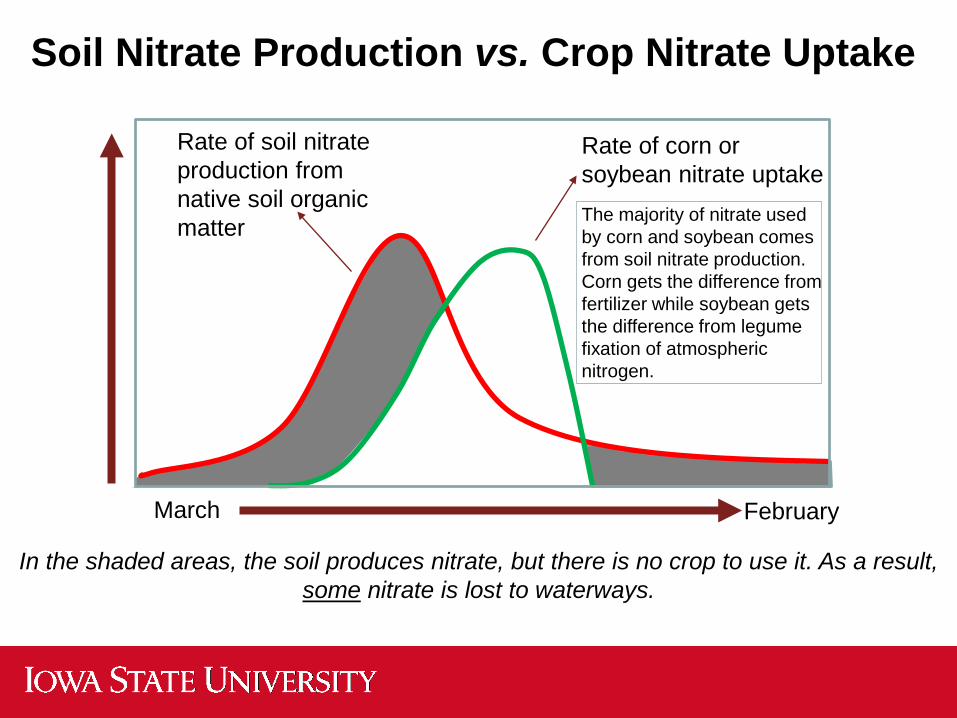
Soil Nitrate Production vs. Crop Nitrate Uptake
In the shaded areas, the soil produces nitrate, but there is no crop to use it. As a result, some nitrate is lost to waterways.
March February
Rate of soil nitrate production from native soil organic matter
Rate of corn or soybean nitrate uptakeThe majority of nitrate used by corn and soybean comes from soil nitrate production. Corn gets the difference from fertilizer while soybean gets the difference from legume fixation of atmospheric nitrogen.
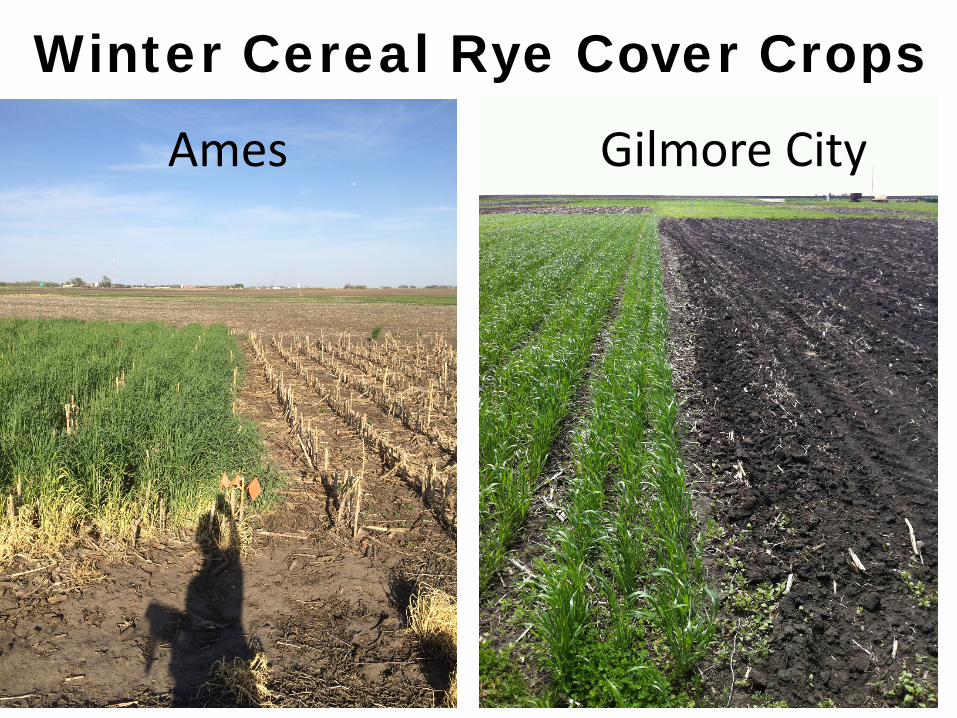
Winter Cereal Rye Cover Crops
Ames Gilmore City
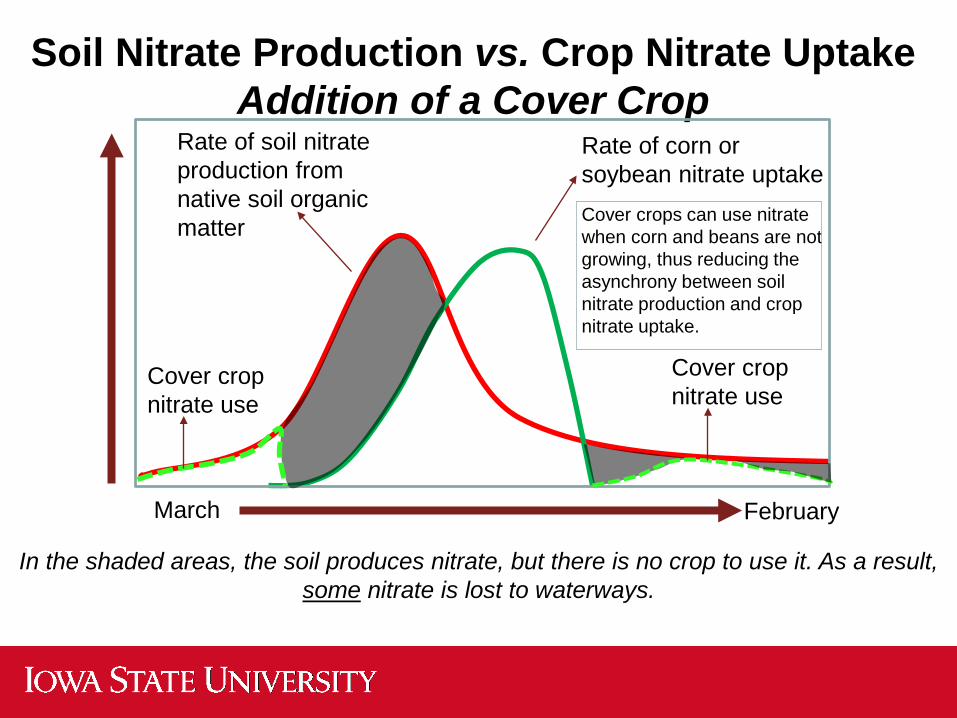
Soil Nitrate Production vs. Crop Nitrate UptakeAddition of a Cover Crop
March February
Rate of soil nitrate production from native soil organic matter
Rate of corn or soybean nitrate uptakeCover crops can use nitrate when corn and beans are not growing, thus reducing the asynchrony between soil nitrate production and crop nitrate uptake.
Cover crop nitrate use
Cover crop nitrate use
In the shaded areas, the soil produces nitrate, but there is no crop to use it. As a result, some nitrate is lost to waterways.
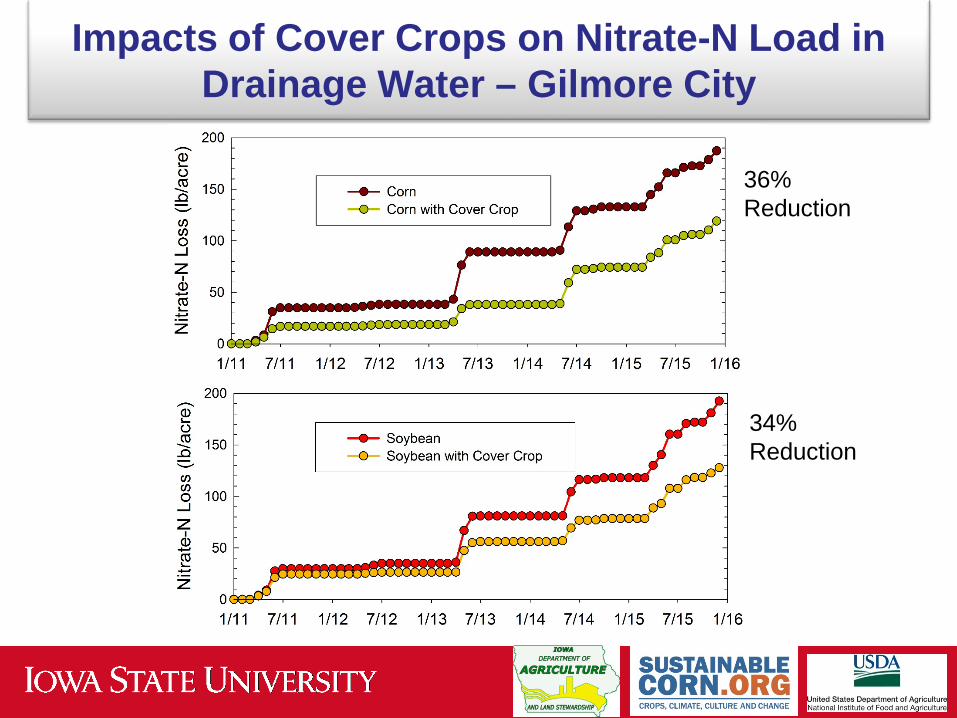
Impacts of Cover Crops on Nitrate-N Load in Drainage Water – Gilmore City
36% Reduction
34% Reduction
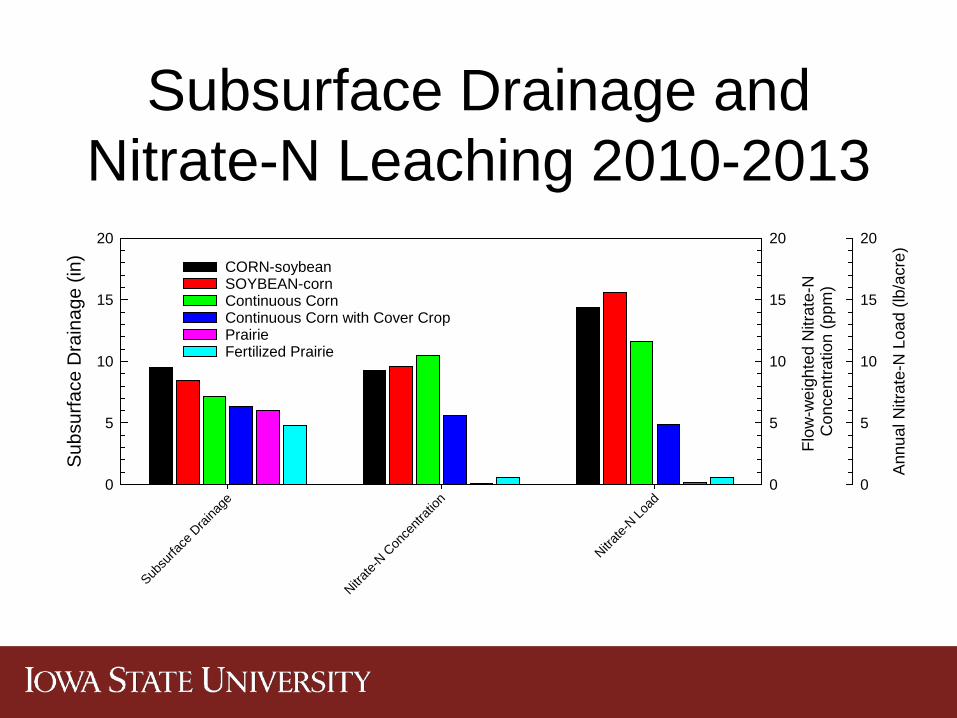
Subsurface Drainage and Nitrate-N Leaching 2010-2013
Subsu
rface
Drai
nage
Nitrate-
N Con
centr
ation
Nitrate-
N Load
Subs
urfa
ce D
rain
age
(in)
0
5
10
15
20
Flow
-wei
ghte
d N
itrat
e-N
C
once
ntra
tion
(ppm
)
0
5
10
15
20
Ann
ual N
itrat
e-N
Loa
d (lb
/acr
e)
0
5
10
15
20
CORN-soybeanSOYBEAN-cornContinuous CornContinuous Corn with Cover CropPrairieFertilized Prairie
This is Just a Tile Drainage Problem?

Water Flow Pathways
Land management and land use impacts ET and infiltration which in turn impact surface runoff, subsurface drainage, deep percolation
Naturally Well-Drained Soils Soils with Poor Natural Drainage

What Can We Do?
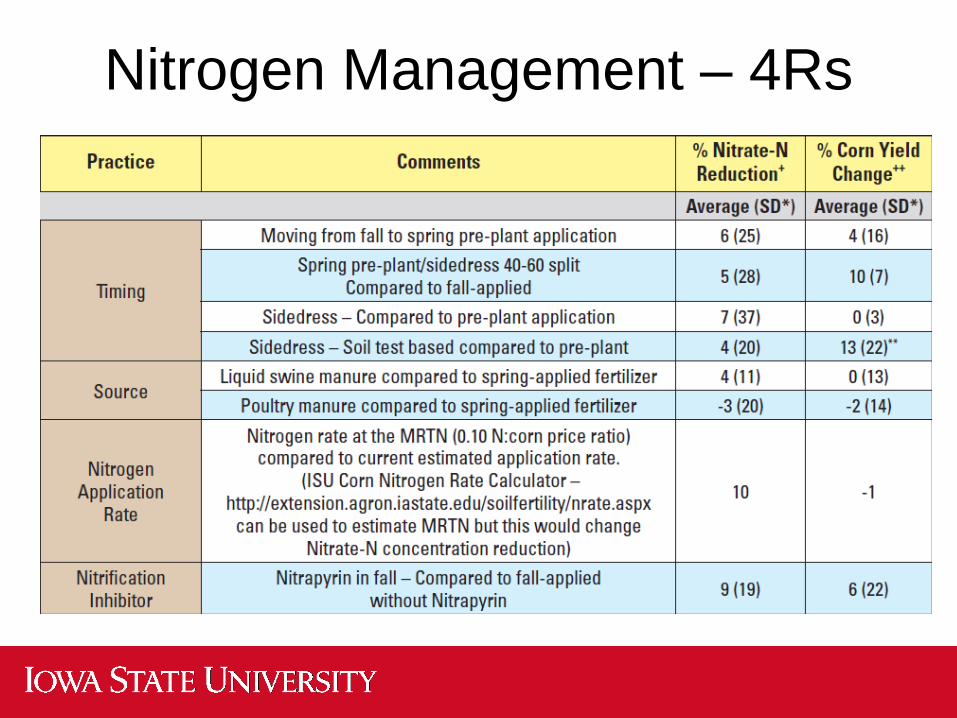
Nitrogen Management – 4Rs
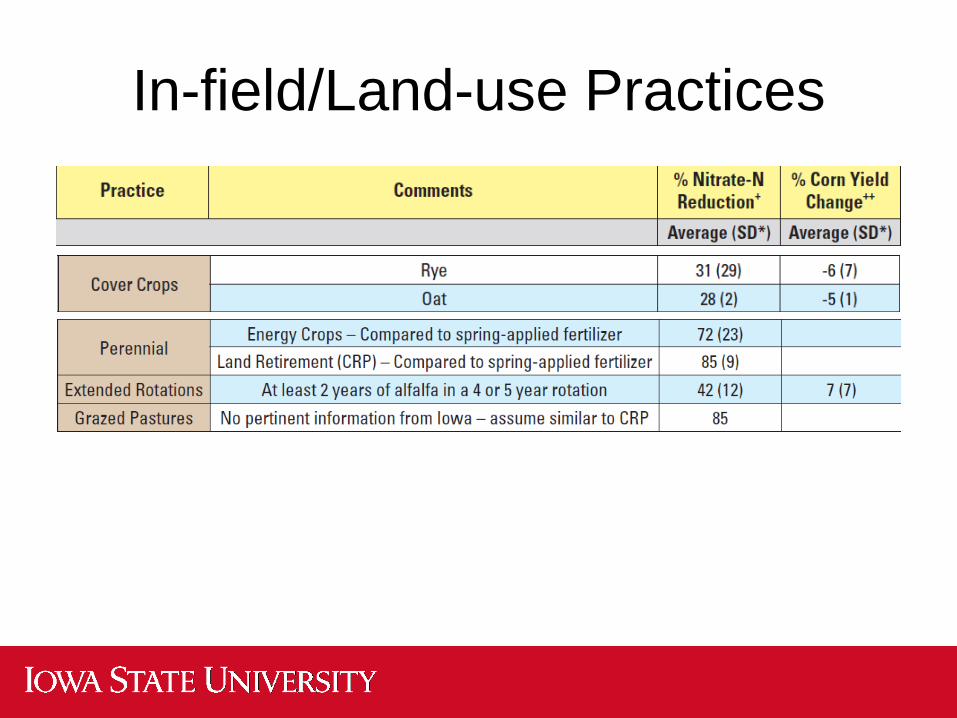
In-field/Land-use Practices
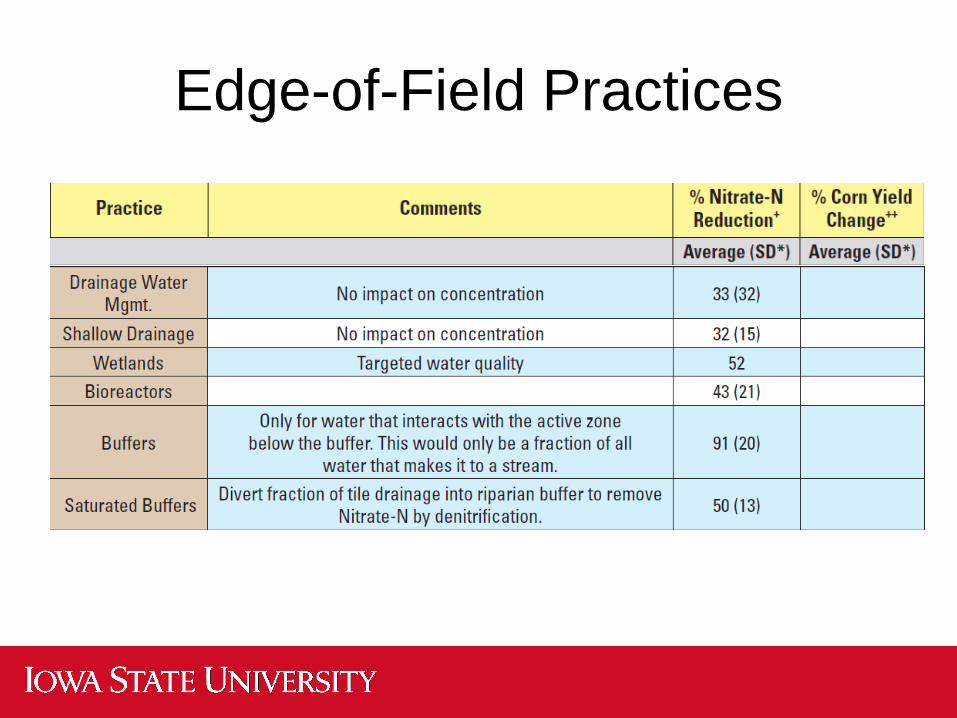
Edge-of-Field Practices
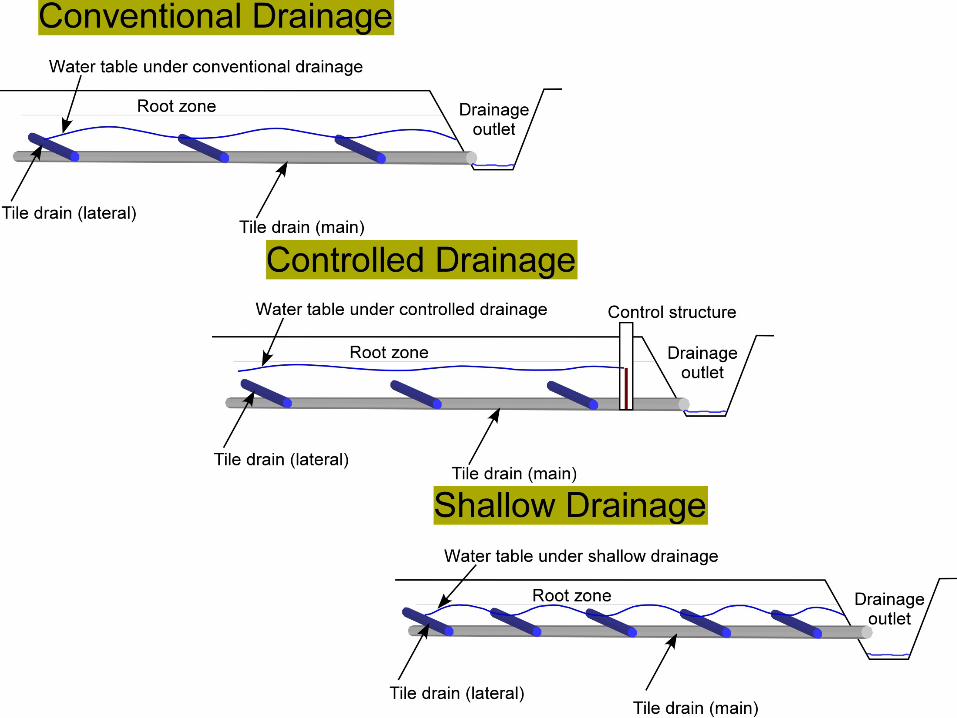
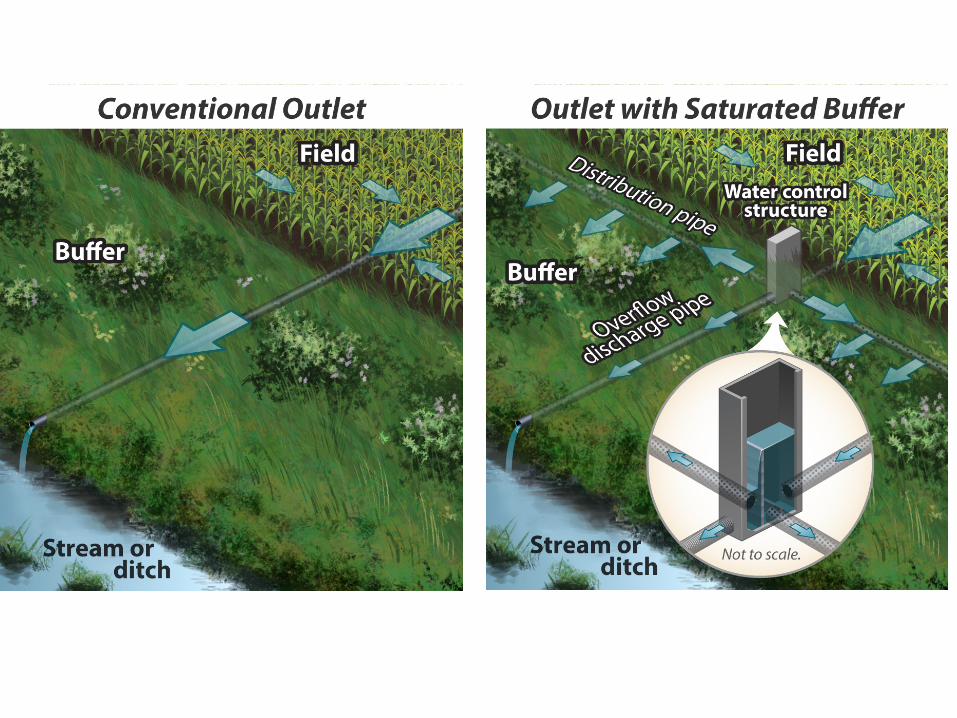
Conservation Drainage
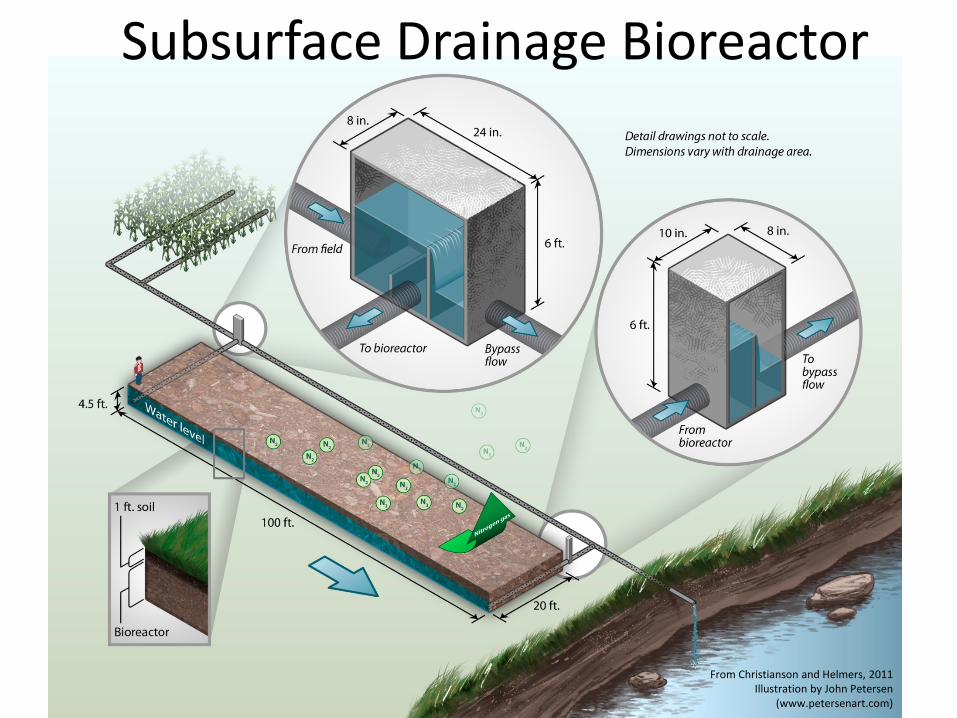
From Christianson and Helmers, 2011 Illustration by John Petersen
(www.petersenart.com)
Subsurface Drainage Bioreactor
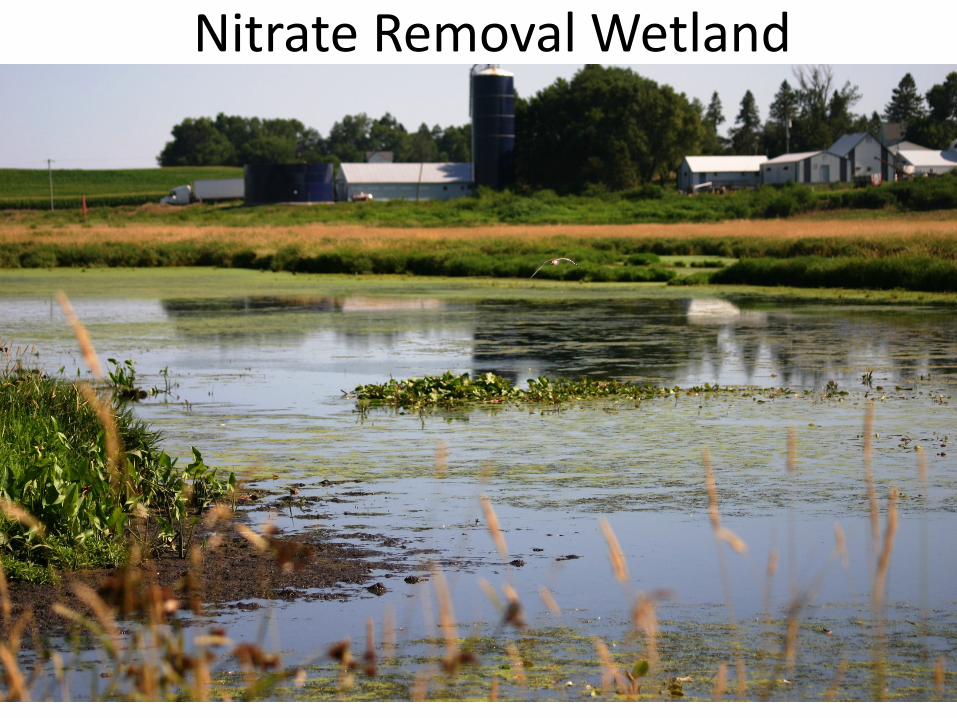
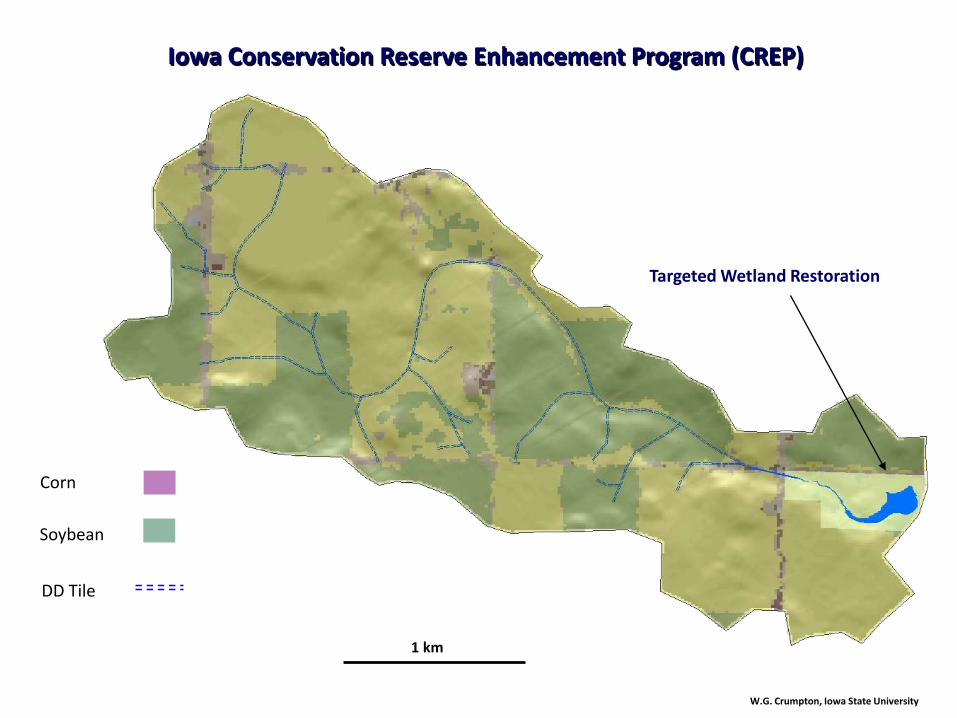
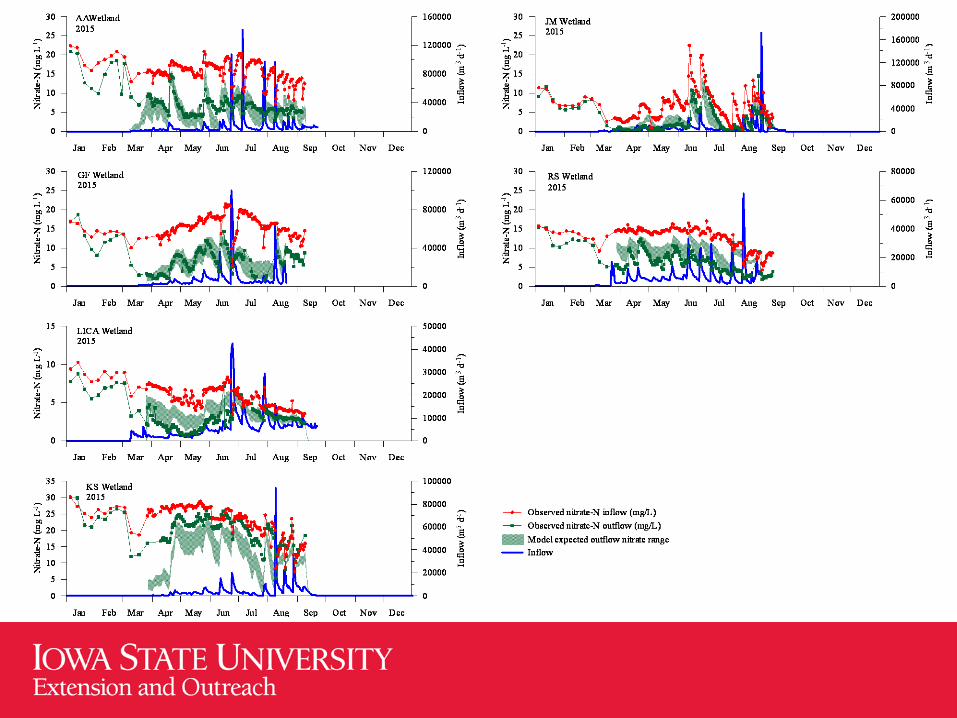
Nitrate Removal Wetland
Corn
Soybean
1 km
Targeted Wetland Restoration
DD Tile
W.G. Crumpton, Iowa State University
Iowa Conservation Reserve Enhancement Program (CREP)
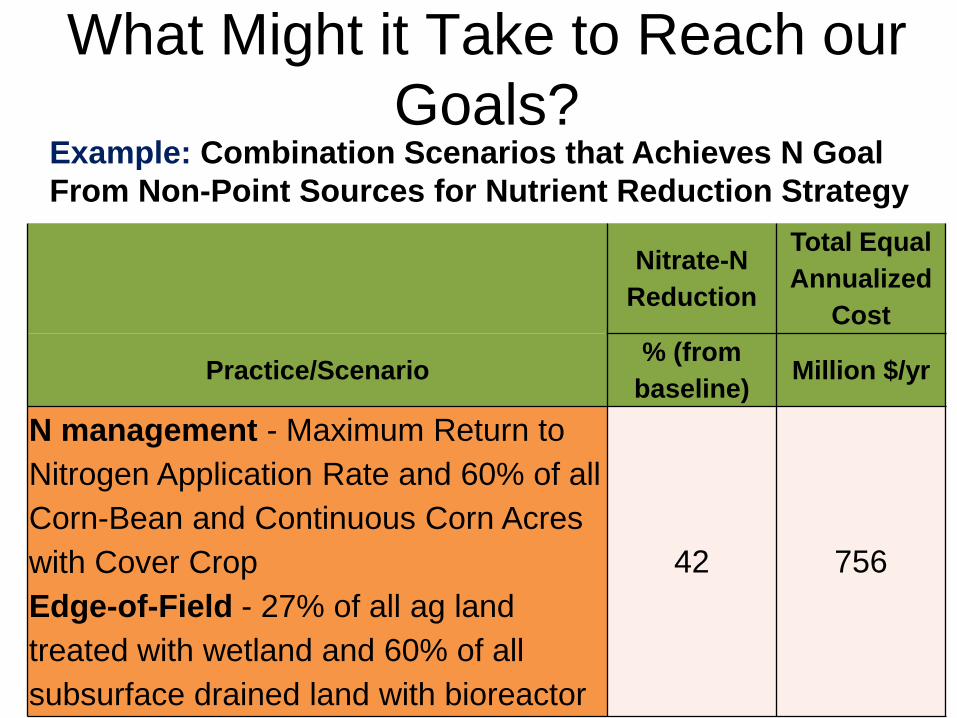
What Might it Take to Reach our Goals?
Nitrate-N Reduction
Total Equal Annualized
Cost
Practice/Scenario % (from baseline) Million $/yr
N management - Maximum Return to Nitrogen Application Rate and 60% of all Corn-Bean and Continuous Corn Acres with Cover CropEdge-of-Field - 27% of all ag land treated with wetland and 60% of all subsurface drained land with bioreactor
42 756
Example: Combination Scenarios that Achieves N Goal From Non-Point Sources for Nutrient Reduction Strategy

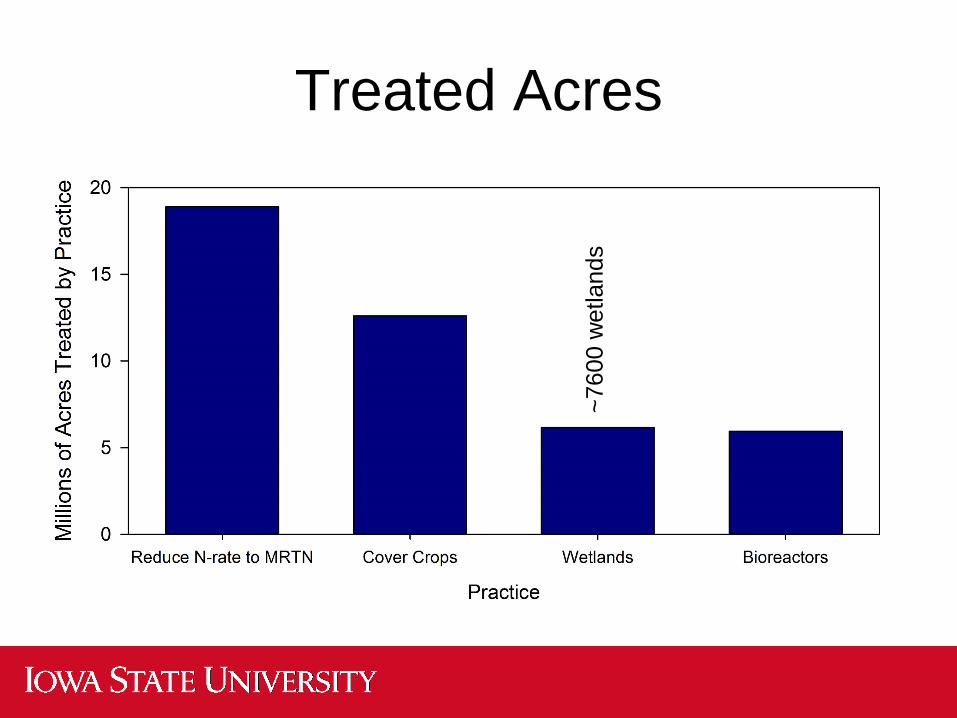
Treated Acres
Treated Acres
~760
0 w
etla
nds

Treated Acres
~760
0 w
etla
nds
~120
000
bior
eact
ors
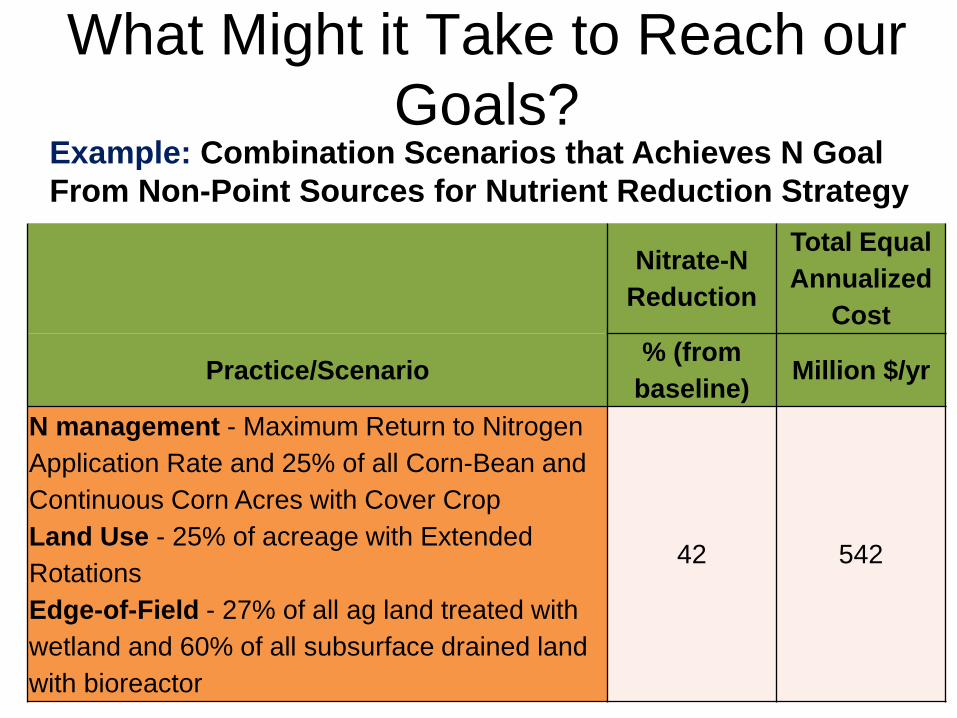
What Might it Take to Reach our Goals?
Nitrate-N Reduction
Total Equal Annualized
Cost
Practice/Scenario % (from baseline) Million $/yr
N management - Maximum Return to Nitrogen Application Rate and 25% of all Corn-Bean and Continuous Corn Acres with Cover CropLand Use - 25% of acreage with Extended RotationsEdge-of-Field - 27% of all ag land treated with wetland and 60% of all subsurface drained land with bioreactor
42 542
Example: Combination Scenarios that Achieves N Goal From Non-Point Sources for Nutrient Reduction Strategy
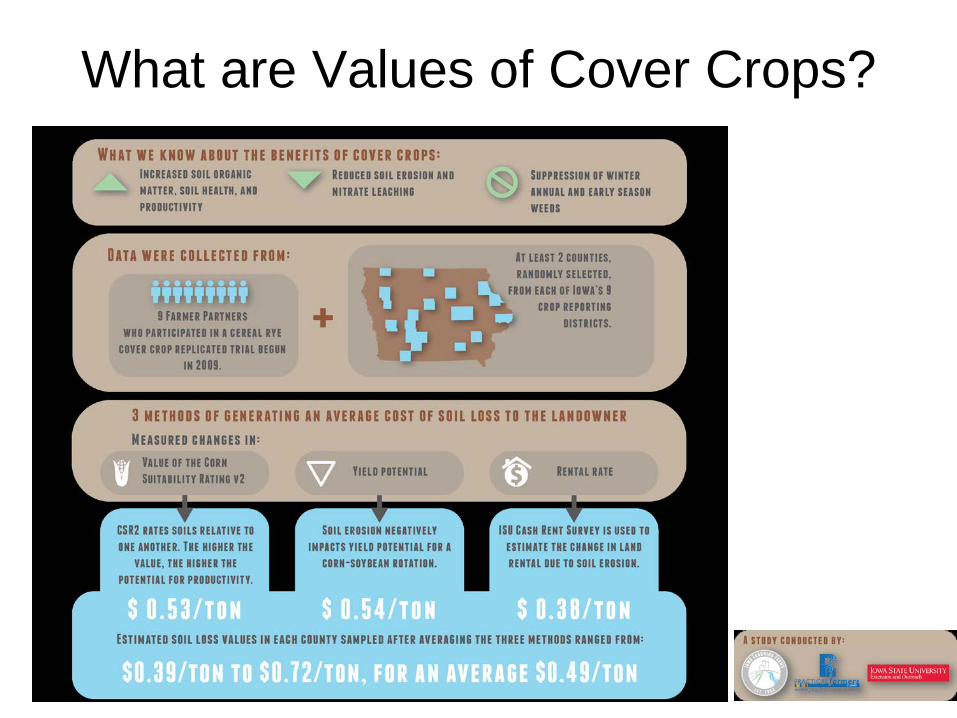
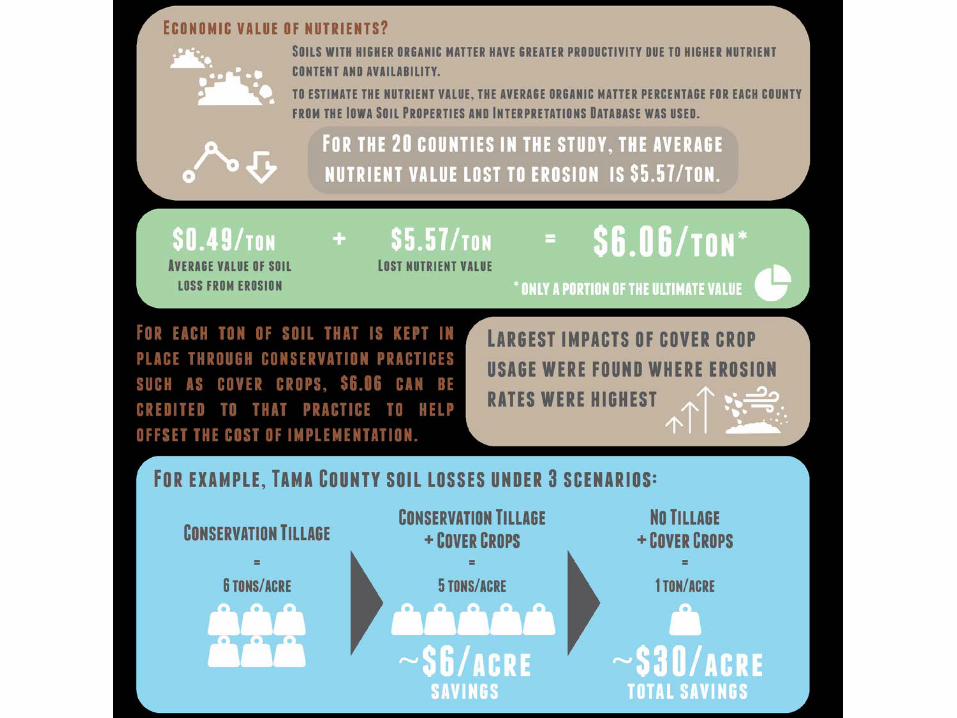
What are Values of Cover Crops?

DRAINAGE-WETLAND INTEGRATION
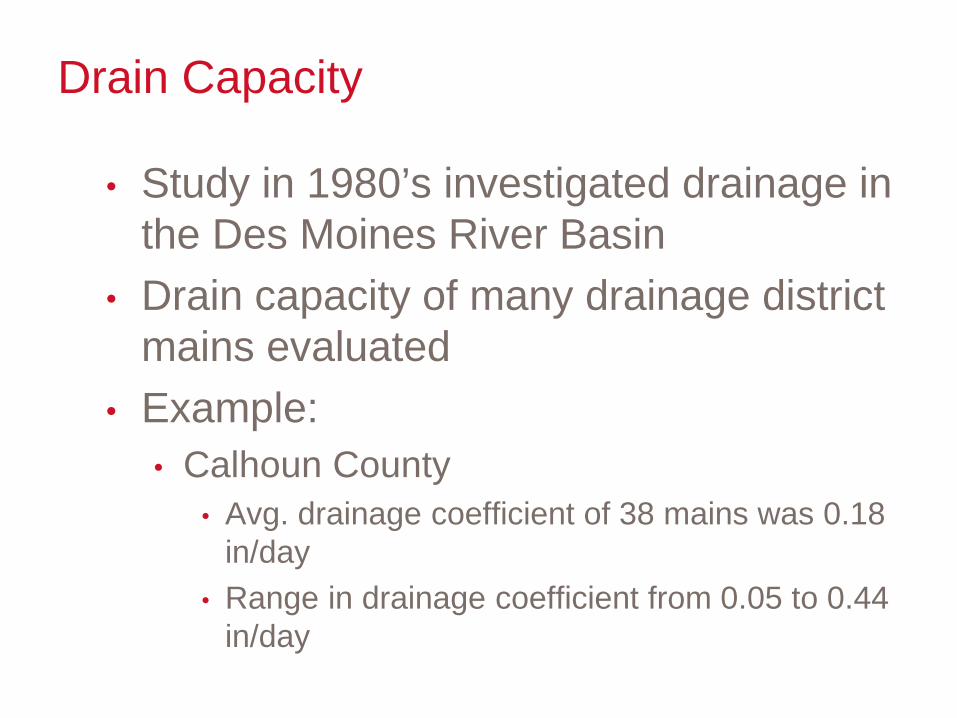
Drain Capacity
• Study in 1980’s investigated drainage in the Des Moines River Basin
• Drain capacity of many drainage district mains evaluated
• Example:• Calhoun County
• Avg. drainage coefficient of 38 mains was 0.18 in/day
• Range in drainage coefficient from 0.05 to 0.44 in/day
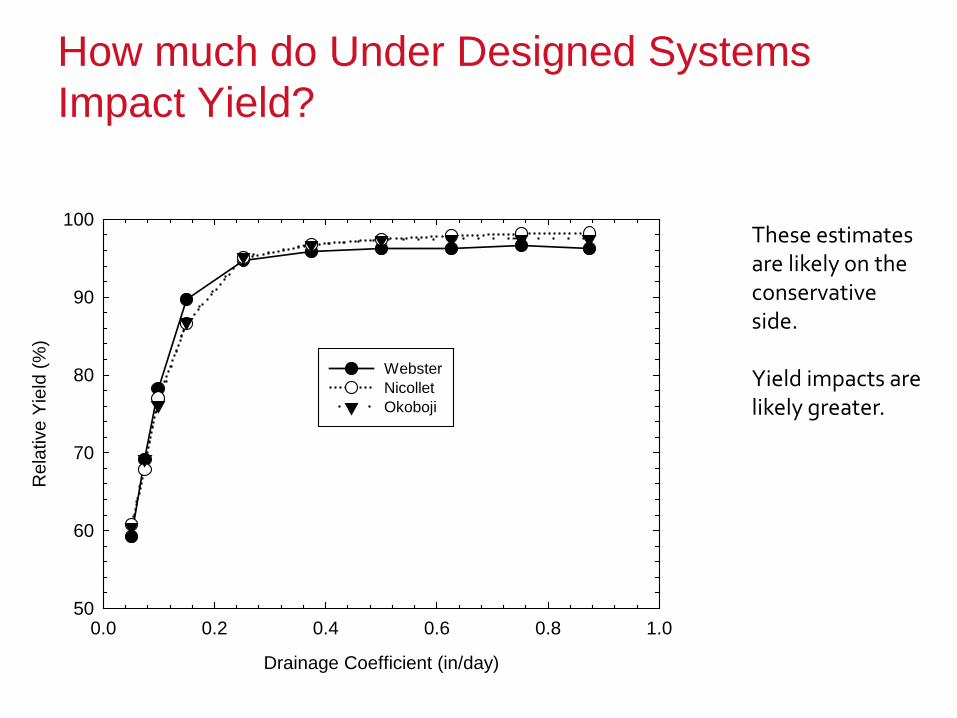
How much do Under Designed Systems Impact Yield?
Drainage Coefficient (in/day)
0.0 0.2 0.4 0.6 0.8 1.0
Rel
ativ
e Yi
eld
(%)
50
60
70
80
90
100
WebsterNicolletOkoboji
These estimates are likely on the conservative side.
Yield impacts are likely greater.
DD65 - 2005
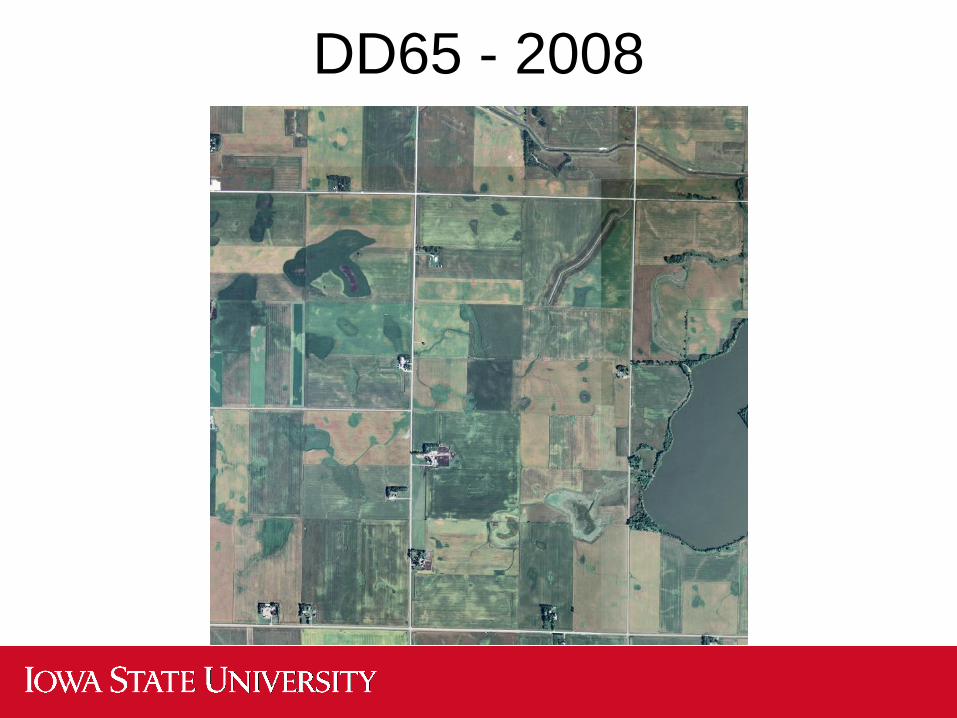
DD65 - 2008
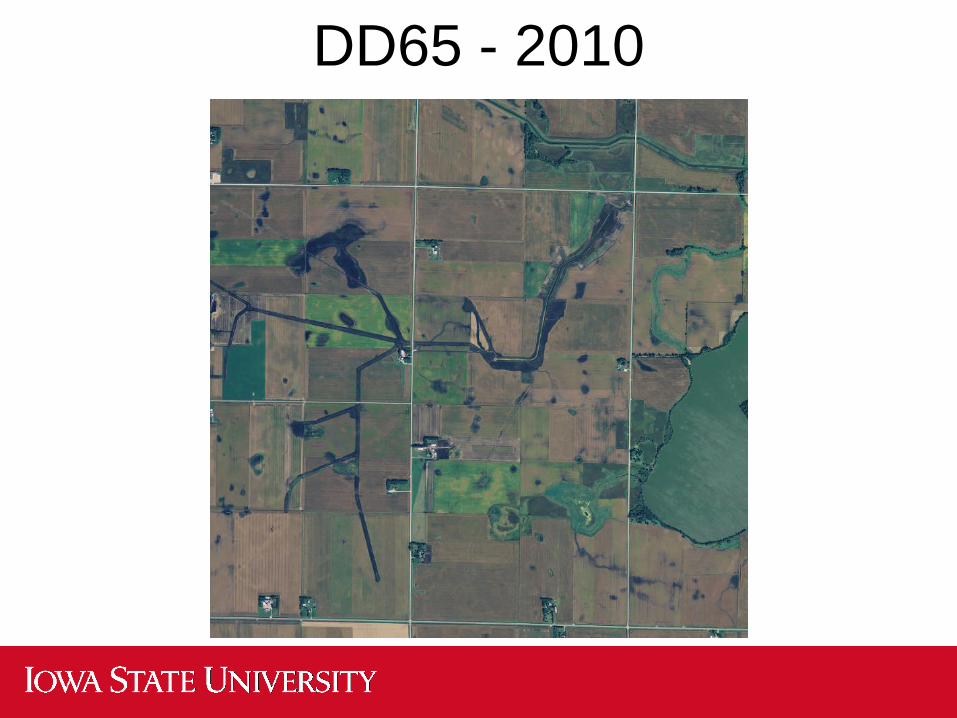
DD65 - 2010
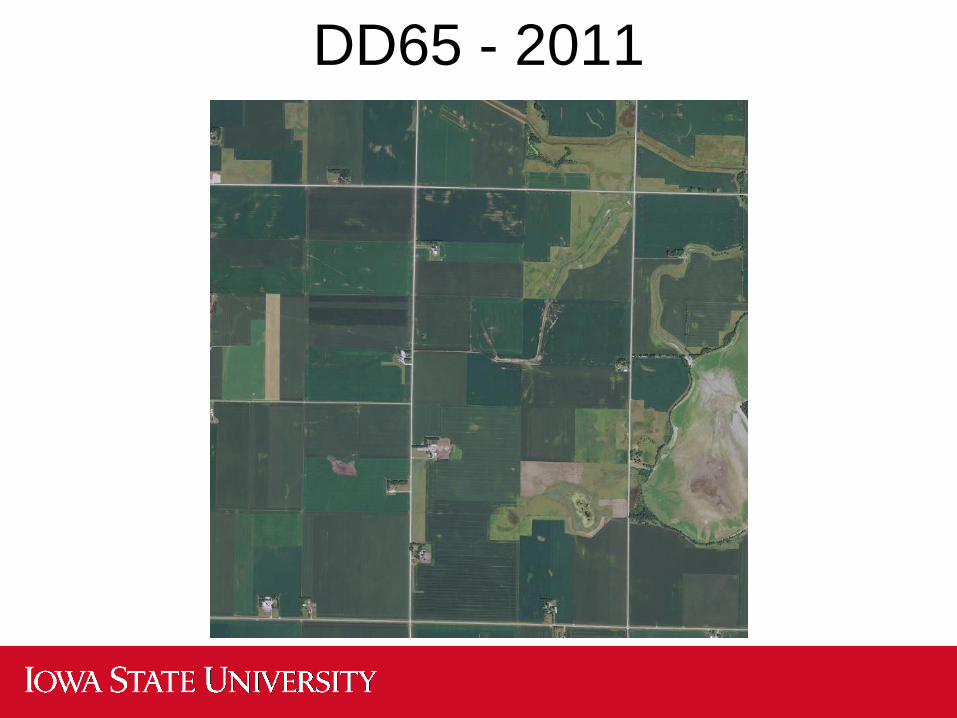
DD65 - 2011
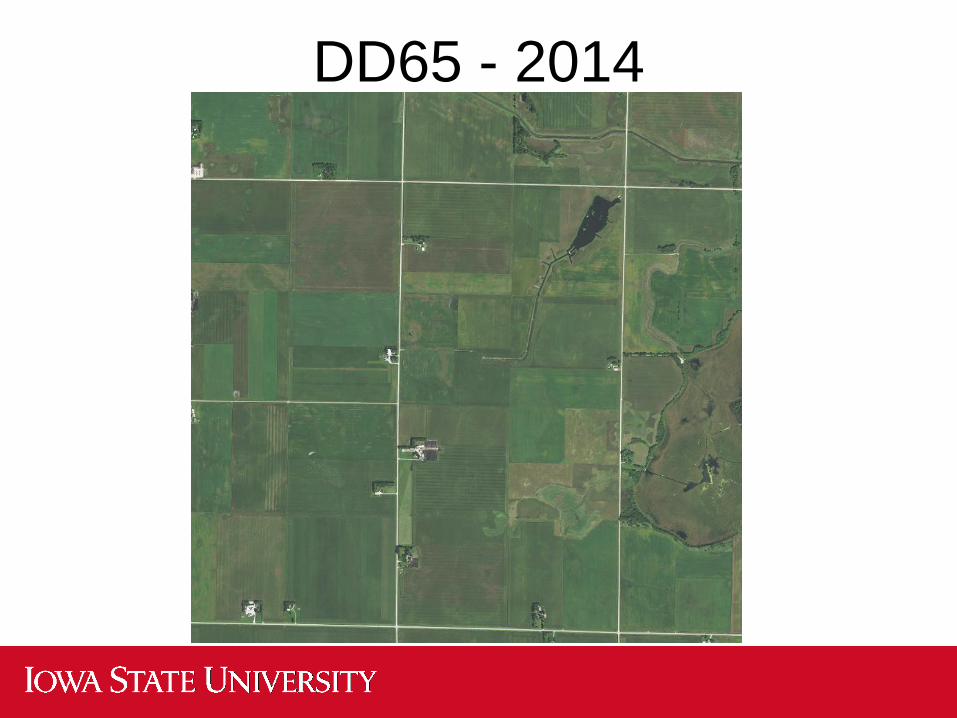
DD65 - 2014
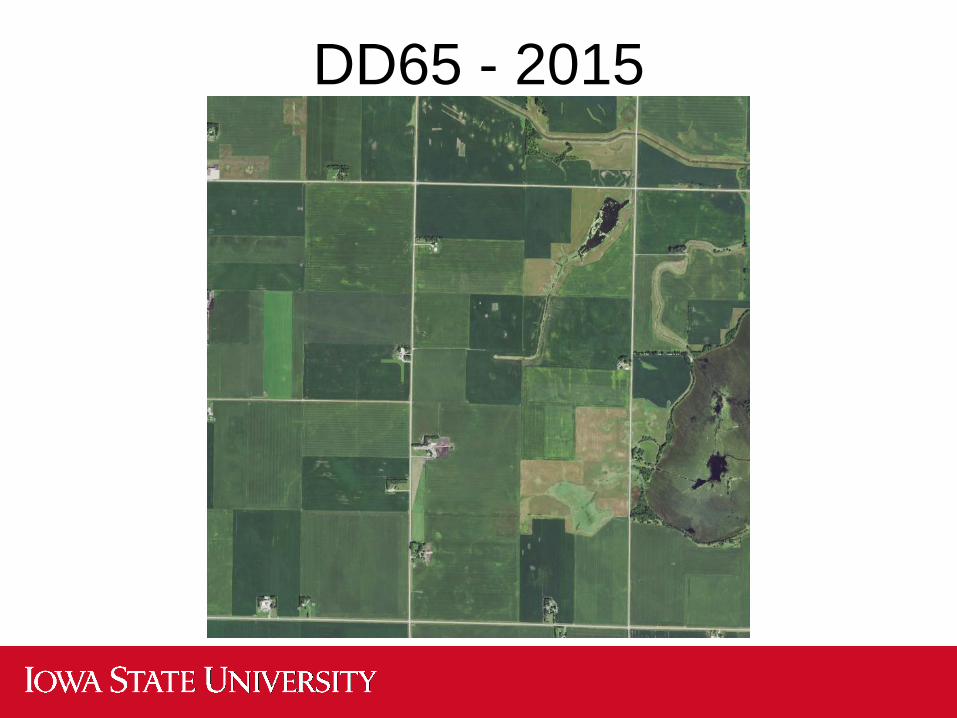
DD65 - 2015
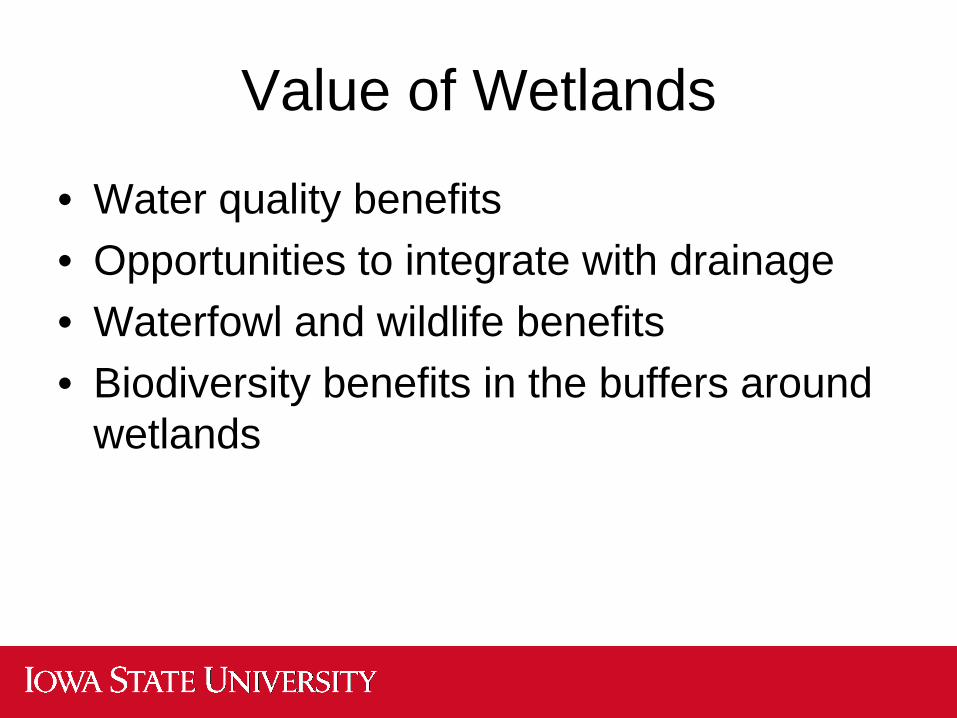
Value of Wetlands
• Water quality benefits• Opportunities to integrate with drainage• Waterfowl and wildlife benefits• Biodiversity benefits in the buffers around
wetlands
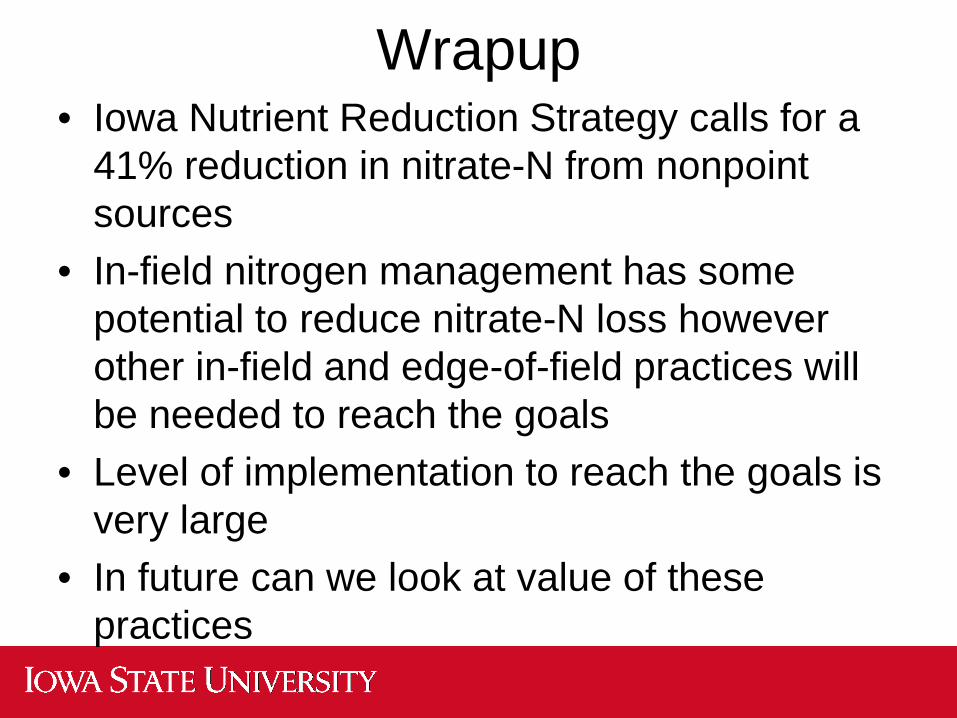
Wrapup• Iowa Nutrient Reduction Strategy calls for a
41% reduction in nitrate-N from nonpoint sources
• In-field nitrogen management has some potential to reduce nitrate-N loss however other in-field and edge-of-field practices will be needed to reach the goals
• Level of implementation to reach the goals is very large
• In future can we look at value of these practices
Recommended