1
Creating a premier, global precious metal
miner
Charl Keyter, CFO
BoAML Global Metal,
Mining and Steel Conference
May 2017
2
Disclaimer
Forward looking Statements
This presentation includes “forward-looking statements” within the meaning of the “safe harbor” provisions of the United States Private Securities Litigation Reform Act of 1995. Forward-looking statements may be identified by the use of words such as “target”, “will”, “forecast”, “expect”, “potential”, “intend”, “estimate”, “anticipate”, “can” and other similar expressions that predict or indicate future events or trends or that are not statements of historical matters. In this presentation, for example, statements related to potential transaction benefits (including financial re-ratings), pricing expectations, levels of output, supply and demand, information related to the Blitz Project, and estimations or expectations of enterprise value, EBTIDA and net asset values, are forward-looking statements. The forward-looking statements set out in this presentation involve a number of known and unknown risks, uncertainties and other factors, many of which are difficult to predict and generally beyond the control of Sibanye, that could cause Sibanye’s actual results and outcomes to be materially different from historical results or from any future results expressed or implied by such forward-looking statements. Such risks, uncertainties and other factors include, without limitation: Sibanye’s ability to successfully integrate the acquired assets with its existing operations; Sibanye’s ability to achieve anticipated efficiencies and other cost savings in connection with the transaction; Sibanye’s ability to implement its strategy and any changes thereto; Sibanye’s future financial position, plans, strategies, objectives, capital expenditures, projected costs and anticipated cost savings andfinancing plans; changes in the market price of gold, platinum group metals (“PGMs”) and/or uranium. These forward-looking statements speak only as of the date of this presentation.
Sibanye undertakes no obligation to update publicly or release any revisions to these forward-looking statements to reflect events or circumstances after the date of this presentation or to reflect the occurrence of unanticipated events.
Prospectus; No Offer or Solicitation
Sibanye has filed a registration statement (including a prospectus) and may file a prospectus supplement with the US Securities and Exchange Commission (“SEC”) for the offering to which this communication relates. Before you invest, you should read the prospectus in that registration statement, the prospectus supplement and other documents Sibanye will file and has filed with the SEC for more complete information about Sibanye and this offering. You may get these documents, when available, for free by visiting EDGAR on the SEC web site at www.sec.gov or by visiting Sibanye’s website at www.sibanyegold.co.za. Alternatively, Sibanye, any underwriter or any dealer participating in the offering will arrange to send you the registration statement, prospectus and prospectus supplement, when available, if you request it by calling toll-free (800) 322-2885 or by e-mailing [email protected]. This presentation is for informational purposes only and does not constitute an offer to sell, or a solicitation of offers to purchase or subscribe for, securities in the United States or any other jurisdiction. Any securities referred to herein that are being offered outside of the United States have not been, and will not be, registered under the U.S. Securities Act of 1933 and may not be offered, exercised or sold in the United States absent registration or an applicable exemption from registration requirements.

3
1 As at 8 May 20172 Platinum Group Metals of which 4E represent platinum, palladium, rhodium and gold3 Note: Financial figures, Reserves exclude Stillwater, which was acquired on 4 May 2017. Refer See the “Annual Financial Report – Overview – Five Year financial performance” in the Company’s 2016 Form 20-F
Corporate overview
20%
26%34%
10%
7% 3%
Shareholder geographic distribution*
China/ Gold One South Africa USA
United Kingdom Europe excl UK Others
Shares in issueShares in ADR form
930 056 784205 939 672 (ADR ratio 1:4 ordinary share)
Market cap¹ R23.8 billion (US$1.76 billion)
Listings JSE Limited share ticker: SGL NYSE ADR programme share ticker: SBGL
Net Debt3
at 31 December 2016
R6.29 billion (US$460 million)Net debt :EBITDA = 0.6x R4.5 billion available facilities
Reserves3
Declared at 31 December 2016
Gold Reserves of 28.7moz
4E PGM2 Reserves of 23.19moz
Uranium Reserves of 113.23mlb
Contact details Head office: Libanon Business Park
1 Hospital Road (off Cedar Avenue),Westonaria, 1779, South Africa
James WellstedSVP: Investor Relations Tel: +27 11 278 [email protected]
Major Sibanye shareholders *
Gold One Limited 19.96%
Public Investment Corporation 8.71%
Van Eck Associates Corporation 5.94%
Black Rock Inc 3.67%
Schroders 2.84%
A FTSE/JSE Top 40 and global, leading precious metals company
4
Our vision
Sibanye cares
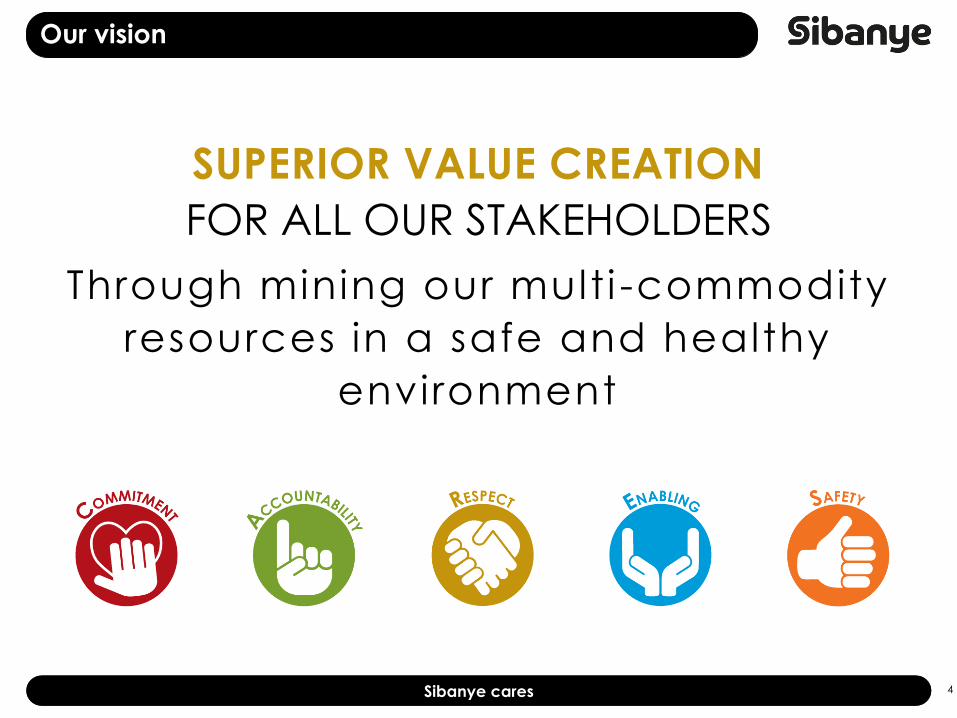
SUPERIOR VALUE CREATION
FOR ALL OUR STAKEHOLDERS
Through mining our mult i -commodity
resources in a safe and healthy
environment
5
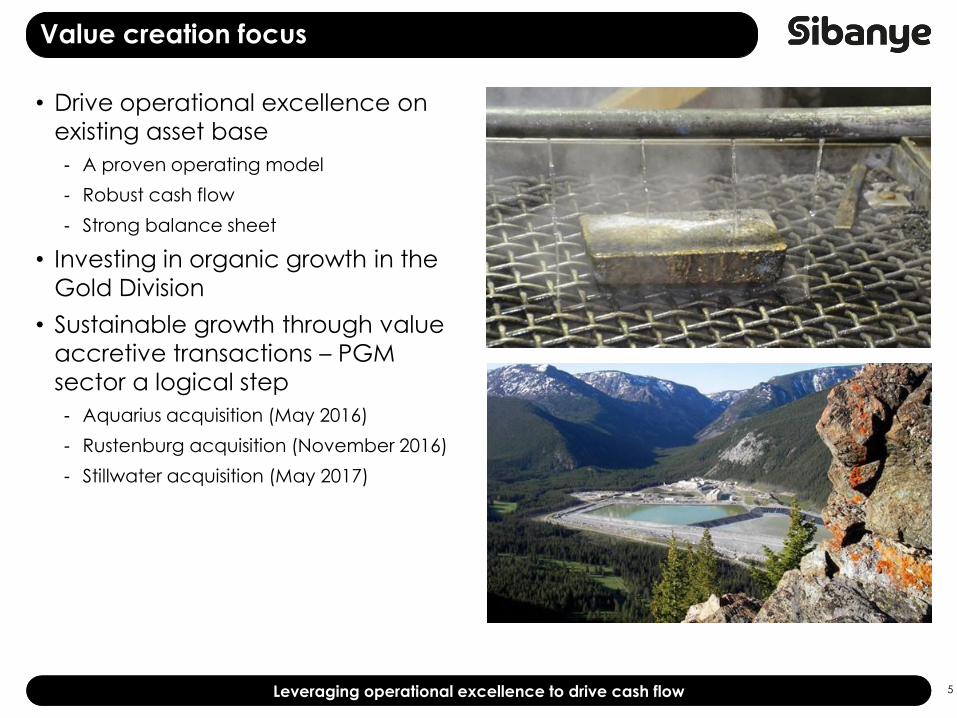
• Drive operational excellence on
existing asset base
- A proven operating model
- Robust cash flow
- Strong balance sheet
• Investing in organic growth in the
Gold Division
• Sustainable growth through value
accretive transactions – PGM
sector a logical step
- Aquarius acquisition (May 2016)
- Rustenburg acquisition (November 2016)
- Stillwater acquisition (May 2017)
Value creation focus
Leveraging operational excellence to drive cash flow
6
Driving operational improvement and
sustainability

7
Gold division operational track record
45.1
37.535.2
25.721.5
13.5
19.7
28.431.0
28.7
0
10
20
30
40
50
2007 2008 2009 2010 2011 2012 2013 2014 2015 2016
Re
serv
es
(Mo
z)
500
750
1 000
1 250
1 500
1 750
500
1 000
1 500
2 000
2 500
2007 2008 2009 2010 2011 2012 2013 2014 2015 2016
US$/o
z
An
nu
al g
old
pro
du
ctio
n (
ko
z)
Turnaround effected and maintained
Gold Fields Sibanye
Gold Fields Sibanye
Production Gold price AISC

8
Source: Factset and company filings. Share price data as of 08 May 2017Note: 1. Analysis based on dividends declared in the last twelve months
• Total dividend of 145 cps for 2016, a 5.5% yield
• Average annual dividend yield of over 5% since 2013
• Dividend levy from our American Depository receipts (ADRs) trading on
NYSE removed
Paying industry leading dividends
0.1%
0.5%
0.6%
0.8%
0.9%
0.9%
1.0%
1.1%
2.1%
2.6%
3.5%
5.5%
Gold Corp
Newmont
Barrick
Yamana
Agnico-Eagle
AngloGold
Newcrest
Randgold
Acacia
Gold Fields
Harmony
Sibanye
Current dividend yield (last twelve months dividends declared)1
Robust financial result
9
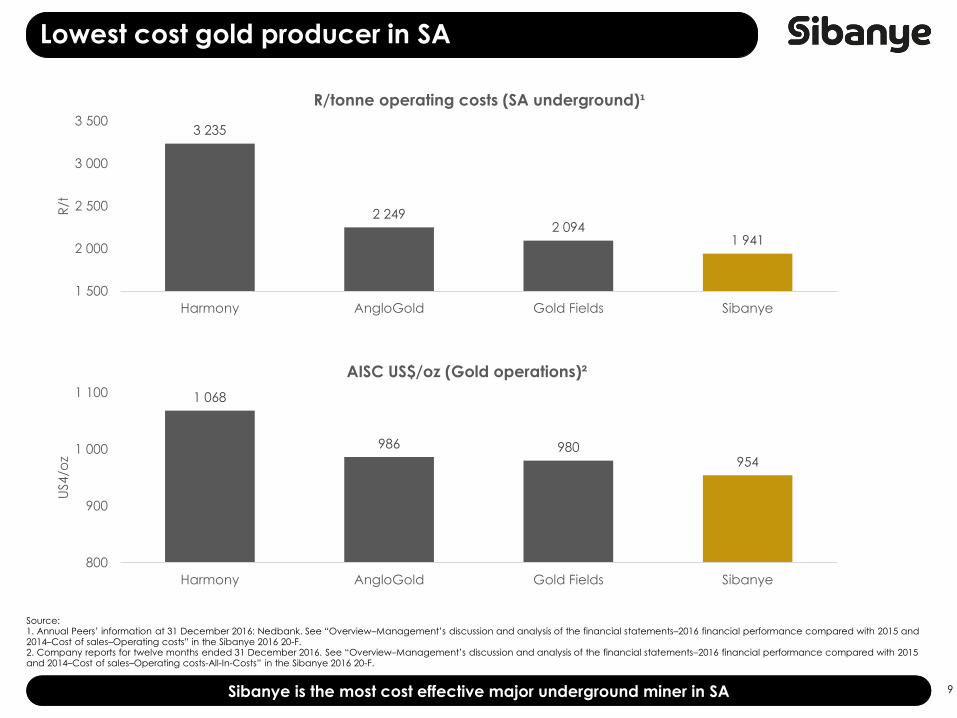
Source:1. Annual Peers’ information at 31 December 2016: Nedbank. See “Overview–Management’s discussion and analysis of the financial statements–2016 financial performance compared with 2015 and 2014–Cost of sales–Operating costs” in the Sibanye 2016 20-F.2. Company reports for twelve months ended 31 December 2016. See “Overview–Management’s discussion and analysis of the financial statements–2016 financial performance compared with 2015 and 2014–Cost of sales–Operating costs-All-In-Costs” in the Sibanye 2016 20-F.
Lowest cost gold producer in SA
1 068
986 980954
800
900
1 000
1 100
Harmony AngloGold Gold Fields Sibanye
US4/o
z
AISC US$/oz (Gold operations)²
3 235
2 2492 094
1 941
1 500
2 000
2 500
3 000
3 500
Harmony AngloGold Gold Fields Sibanye
R/t
R/tonne operating costs (SA underground)¹
Sibanye is the most cost effective major underground miner in SA
10
Value creation in the PGM sector

11
Dynamic strategic delivery
Value accretive growth sustaining industry leading dividend
12
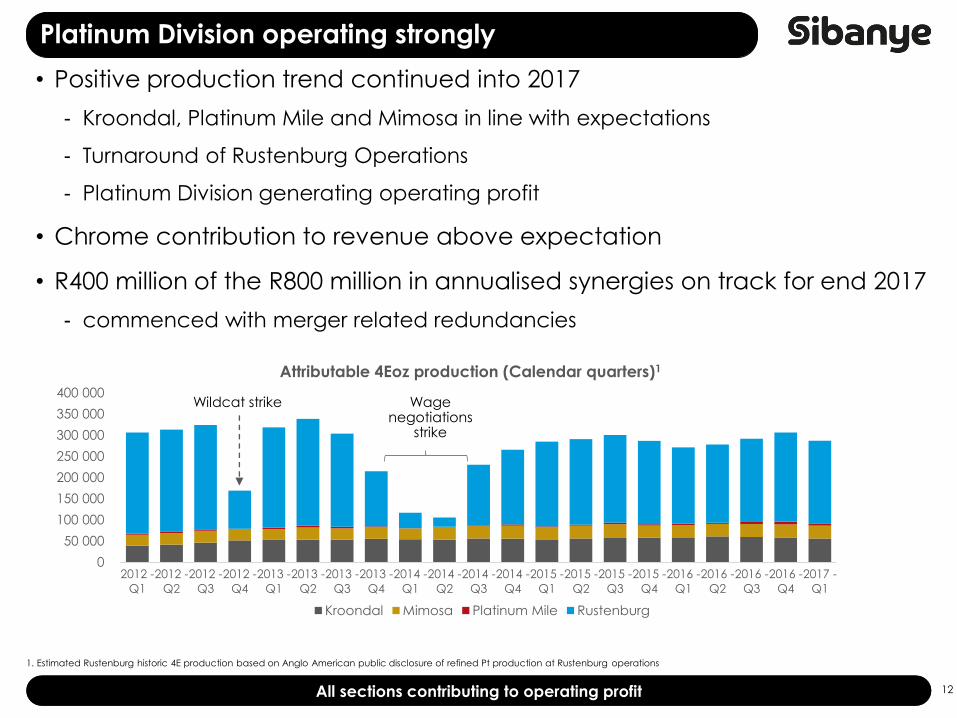
1. Estimated Rustenburg historic 4E production based on Anglo American public disclosure of refined Pt production at Rustenburg operations
Platinum Division operating strongly
0
50 000
100 000
150 000
200 000
250 000
300 000
350 000
400 000
2012 -
Q1
2012 -
Q2
2012 -
Q3
2012 -
Q4
2013 -
Q1
2013 -
Q2
2013 -
Q3
2013 -
Q4
2014 -
Q1
2014 -
Q2
2014 -
Q3
2014 -
Q4
2015 -
Q1
2015 -
Q2
2015 -
Q3
2015 -
Q4
2016 -
Q1
2016 -
Q2
2016 -
Q3
2016 -
Q4
2017 -
Q1
Attributable 4Eoz production (Calendar quarters)1
Kroondal Mimosa Platinum Mile Rustenburg
All sections contributing to operating profit
Wildcat strike Wagenegotiations
strike
• Positive production trend continued into 2017
- Kroondal, Platinum Mile and Mimosa in line with expectations
- Turnaround of Rustenburg Operations
- Platinum Division generating operating profit
• Chrome contribution to revenue above expectation
• R400 million of the R800 million in annualised synergies on track for end 2017
- commenced with merger related redundancies

13
The Stillwater Transaction
Creating a premier,
global precious metal
company

14
1. Non-GAAP financial measure. For a full description and reconciliation of this and other non-GAAP financial measures to GAAP financial measures, see Reconciliation of GAAP financial measures to Non-GAAP financial measures and the accompanying discussion in the Stillwater’s fourth quarter and full-year 2016 results press release
• Leading low-cost PGM producer
• Business segments: Montana Mines
and Recycling
• 545.3k oz (Pd & Pt) mined in 2016
• Total historical production of ~12M
PGM ounces
• Reserves of over 21 million oz - 78%
Pd, 22% Pt
• Average grade of 15.77 g/t
• 668.3koz of PGMs recycled in 2016
• Cost reductions to costs of metals
sold per PGM mined oz of $509 and
AISC¹ of $622 for 2016
Stillwater overview
World-class assets, stable jurisdiction, highest-grade PGMs deposit in the world
Headquarters(Littleton, CO)
Stillwater Mine(Montana)
East Boulder Mine(Montana)
Smelter & Base Metals Refinery (Montana)
Stillwater Recycling(Montana)
Altar(San Juan Province,
Argentina)
Blitz Development (Montana)
Marathon(Ontario, Canada)
15
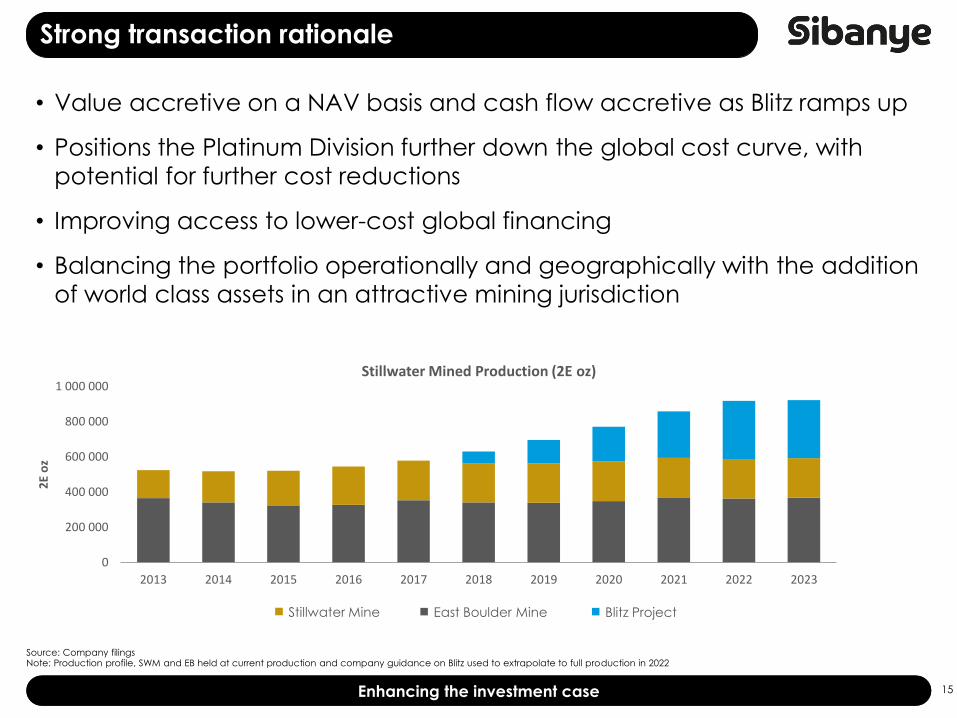
Source: Company filingsNote: Production profile, SWM and EB held at current production and company guidance on Blitz used to extrapolate to full production in 2022
• Value accretive on a NAV basis and cash flow accretive as Blitz ramps up
• Positions the Platinum Division further down the global cost curve, with
potential for further cost reductions
• Improving access to lower-cost global financing
• Balancing the portfolio operationally and geographically with the addition
of world class assets in an attractive mining jurisdiction
Strong transaction rationale
0
200 000
400 000
600 000
800 000
1 000 000
2013 2014 2015 2016 2017 2018 2019 2020 2021 2022 2023
2E
oz
Stillwater Mined Production (2E oz)
Enhancing the investment case
Stillwater Mine East Boulder Mine Blitz Project

16
Source: Company filings. LoM as stated in company annual reports
Stillwater assets high-grade and long-life
Stillwater’s portfolio is long-life and significantly higher grade than other major players
0
10
20
30
40
50
60
0 1 2 3 4 5 6 7 8 9 10 11 12 13 14 15 16 17 18 19 20 21
LoM
ye
ars
(a
s d
efin
ed
by
re
serv
es)
Grade g/t 4E
PGM Assets by Reserve Grade and LoM (based on published reserves)
Grade g/t 4E
LoM
ye
ars
(a
s d
efin
ed
by r
ese
rve
s)
Sibanye PGM mines
Stillwater PGM mines
Other PGM assets include
• Amandelbult Section
• Bafokeng-Rasimone
• Bokoni
• Impala
• Marikana
• Modikwa
• Mogalakwena
• Pilanesberg
• Two Rivers
• Union Section
• Zimplats
• Zondereinde
East BoulderStillwater Mine
Rustenburg
MimosaKroondal
Blitz
Blitz mine life expected to
extend to 35+ years as
further drilling expands
current reserves
17
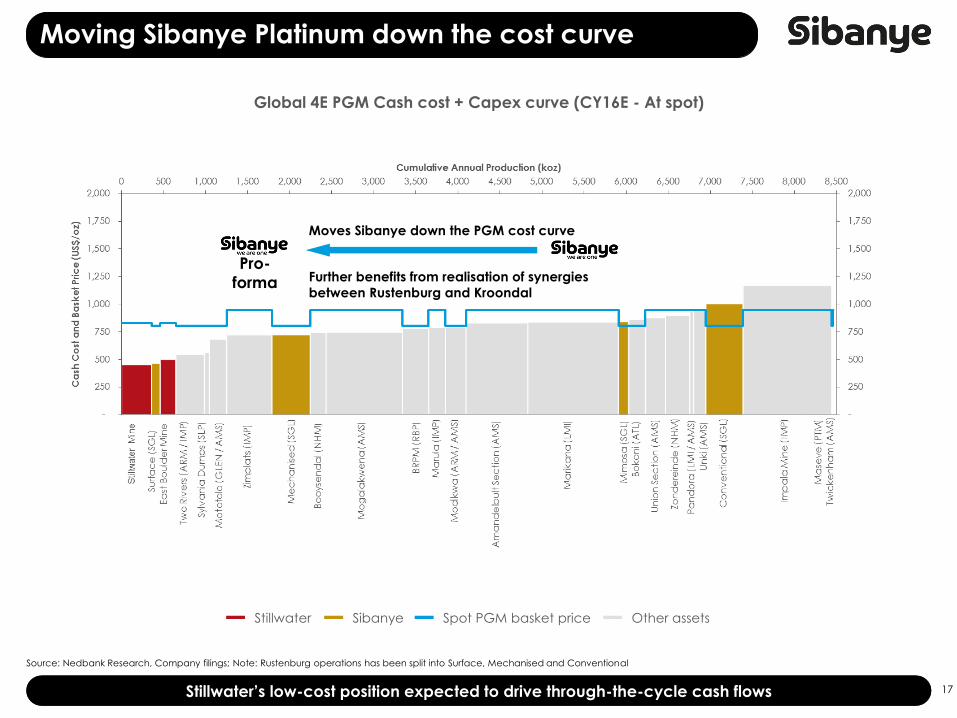
Source: Nedbank Research, Company filings; Note: Rustenburg operations has been split into Surface, Mechanised and Conventional
Moving Sibanye Platinum down the cost curve
Stillwater’s low-cost position expected to drive through-the-cycle cash flows
Global 4E PGM Cash cost + Capex curve (CY16E - At spot)
Pro-
forma
Moves Sibanye down the PGM cost curve
Further benefits from realisation of synergies
between Rustenburg and Kroondal
Sibanye Spot PGM basket priceStillwater Other assets

18
Source: Company filingsNotes:1. Exclusive of Rustenburg Mine2. Includes PGM by-products only3. Rustenburg + Aquarius + Stillwater. Rustenburg, Kroondal, Platinum Mile and Mimosa as of FY16, per public disclosure4. Pro forma for Rustenburg and Aquarius acquisitions5. Sibanye gold equivalents included6, Prill split assumed to be same as 9m’16 for Stillwater’s current mining operations
Building a premier global mining company
1.5
1.7
2.0
2.1
2.4
2.5
2.8
2.9
2.8
3.6
5.2
5.5
3.1
Sibanye
Agnico-Eagle
Polyus
Gold Fields
Newcrest
Sibanye
(pre-transaction)₄ ₅
Kinross
Gold Corp
Sibanye (post-
transaction)₃ ₅
AngloGold
Newmont
Barrick
2016A Gold
Production (moz)
0.2
0.3
0.6
0.6
0.7
0.8
1.4
2.0
0.8
RBPlats
Northam
Norilsk²
Sibanye
(pre-transaction)⁴
Lonmin
Sibanye (post-
transaction)³
Impala
Amplats¹
2016A Platinum
Production (moz)
0.1
0.1
0…
0.3
0.9
0.8
1.3
2.6
1.0
RBPlats
Northam
Lonmin
Sibanye
(pre-transaction)⁴
Impala
Sibanye (post-
transaction) ³
Amplats¹
Norilsk²
2016A Palladium
Production (moz)
Positioned globally as a top 5 PGM producer and top 10 gold producer
Sibanye PGM Division Ranking Sibanye Gold Division Ranking
By-product only
Includes Blitz at full ramp-up by 2021/22 (270-330koz 2E)6 Gold and gold equivalent

19
Source: Company guidance
Our quality profile secures growth and sustainability
0
500 000
1 000 000
1 500 000
2 000 000
2 500 000
3 000 000
3 500 000
4 000 000
2017 2018 2019 2020 2021 2022 2023 2024 2025 2026 2027 2028 2029 2030 2031 2032 2033 2034 2035 2036 2037
Ou
nc
es
Expected Gold and PGM LoM production plan (next 20 years)
Sibanye, Gold
Rustenburg + Aquarius, PGM
Stillwater ex. Blitz, PGM
Blitz first 5 years, PGM
Blitz ramped up, PGM
Gold Fields plan, Gold
Complementary gold and PGM production profiles
Gold Fields plan

20
• Proposed US$2.2 billion cash acquisition of Stillwater announced on
9 December 2016
• Transaction went unconditional on 4 May 2017
• Purchase price settled through US$2.65 billion syndicated bridge loan
• Bridge loan to be refinanced through:
- US$1 billion rights offer (announced on 11 May 2017)
- US$1 billion corporate bonds
- Remainder of bridge will be refinanced before end of 2017 – a variety of capital sources are
being considered
Stillwater acquisition journey
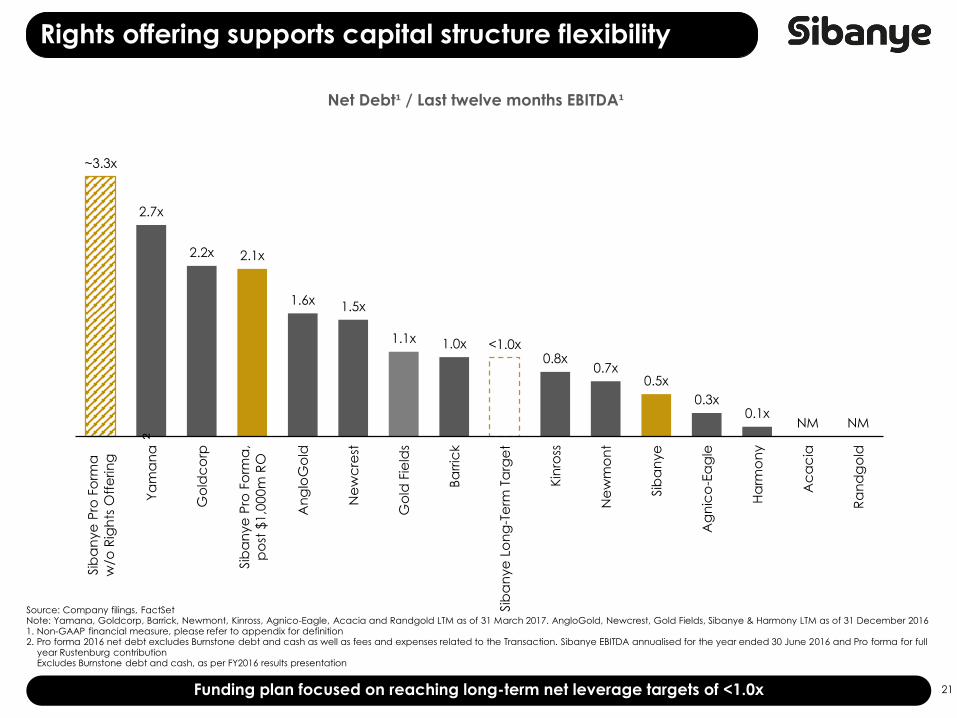
21Funding plan focused on reaching long-term net leverage targets of <1.0x
Rights offering supports capital structure flexibility
~3.3x
2.7x
2.2x 2.1x
1.6x 1.5x
1.1x 1.0x <1.0x 0.8x
0.7x 0.5x
0.3x 0.1x
NM NM
Sib
an
ye
Pro
Fo
rma
w/o
Rig
hts
Off
erin
g
Ya
ma
na
Go
ldc
orp
Sib
an
ye
Pro
Fo
rma
,
po
st $
1,0
00m
RO
An
glo
Go
ld
Ne
wc
rest
Go
ld F
ield
s
Ba
rric
k
Sib
an
ye
Lo
ng
-Te
rm T
arg
et
Kin
ross
Ne
wm
on
t
Sib
an
ye
Ag
nic
o-E
ag
le
Ha
rmo
ny
Ac
ac
ia
Ra
nd
go
ld
Net Debt¹ / Last twelve months EBITDA¹
Source: Company filings, FactSetNote: Yamana, Goldcorp, Barrick, Newmont, Kinross, Agnico-Eagle, Acacia and Randgold LTM as of 31 March 2017. AngloGold, Newcrest, Gold Fields, Sibanye & Harmony LTM as of 31 December 20161. Non-GAAP financial measure, please refer to appendix for definition2. Pro forma 2016 net debt excludes Burnstone debt and cash as well as fees and expenses related to the Transaction. Sibanye EBITDA annualised for the year ended 30 June 2016 and Pro forma for full
year Rustenburg contributionExcludes Burnstone debt and cash, as per FY2016 results presentation
²

22
Peer multiples

23
Peer group benchmarking
-
2
4
6
8
10
12
14
US$
/oz
EV/EBITDA (2016)
-
10
20
30
40
50
60
70
x
F2016 PE
-
100
200
300
400
500
600
US$/o
z
EV/Reserve oz
Significant rerating potential
-
1 000.00
2 000.00
3 000.00
4 000.00
5 000.00
6 000.00
7 000.00
US$/o
z
EV/Production1
Source: Company filings, FactSet as at 08 May 2017; 1 Production includes gold only

24
Conclusion

25
• Delivering significant value through operational excellence and value
accretive growth
• Stable, cash generative Gold Division resulting in industry leading dividend
yield
• Integration of Platinum assets to unlock significant value through the
realisation of synergies
• Stillwater transaction transformative, creating a premier, globally
competitive precious metal company
• Potential capital market rerating to bring Sibanye in line with peers
Conclusion
Consolidation is logical and necessary

26
Questions
Recommended