Credibility TheorySession 37TS
Valuation Actuary Symposium 2009Thomas E Rhodes, FSA, MAAAAVP & Actuarial Director, MIB
Stuart Klugman, FSA, CERAStaff Fellow, Education, SOA

Company Variability, Valuation, and Statistics
• Variability of Company Results around Industry-wide Mortality
• VM-20 - Determine Prudent Estimate Mortality. This is why you should care about this talk!• Selecting credibility method• Using credibility method to determine mortality from
experience studies
• Examples using Preferred Mortality and Term Lapse rates
2

Variability of Company Results around Industry-wide Mortality
• Individual company data aggregated to determine industry -wide mortality tables– 2001 VBT – UCS– 2008 VBT
• Following slides - individual company mortality experience varies widely from these industry-wide standards
3
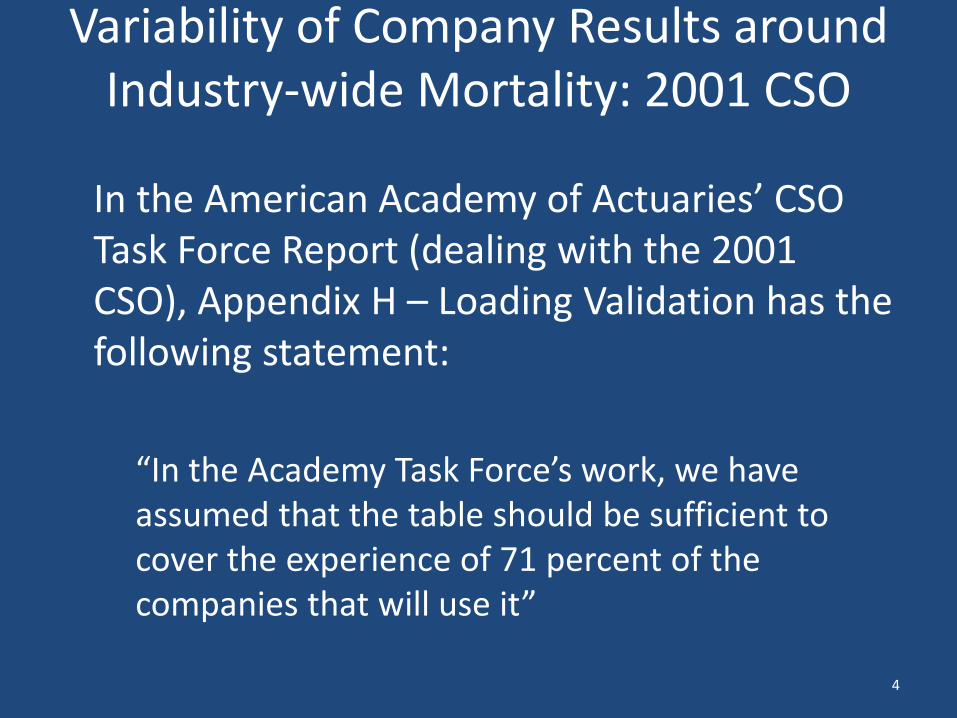
Variability of Company Results around Industry-wide Mortality: 2001 CSO
In the American Academy of Actuaries’ CSO Task Force Report (dealing with the 2001 CSO), Appendix H – Loading Validation has the following statement:
“In the Academy Task Force’s work, we have assumed that the table should be sufficient to cover the experience of 71 percent of the companies that will use it”
4

Variability of Company Results around Industry-wide Mortality
UCS applied to Companies’ NS Experience Varies from Mortality Increasing with UCS Score
UCS 2006 StudyUCS A/EScore Ratio Deaths
26 47.0% 6
41 63.1% 2142 71.8% 78
95 65.3% 6396 79.3% 174
119 65.9% 230120 72.5% 9
141 95.8% 2,231
5

Variability of Company Results around Industry-wide Mortality: 2008 VBT
Out of 39 companies in the SOA 2005-07 study
2008 VBTA/E Ratio Number ofBy Amount Companies
Above 100% 12
95% up to 100% 9
90% up to 95% 7
Below 90% 11
6

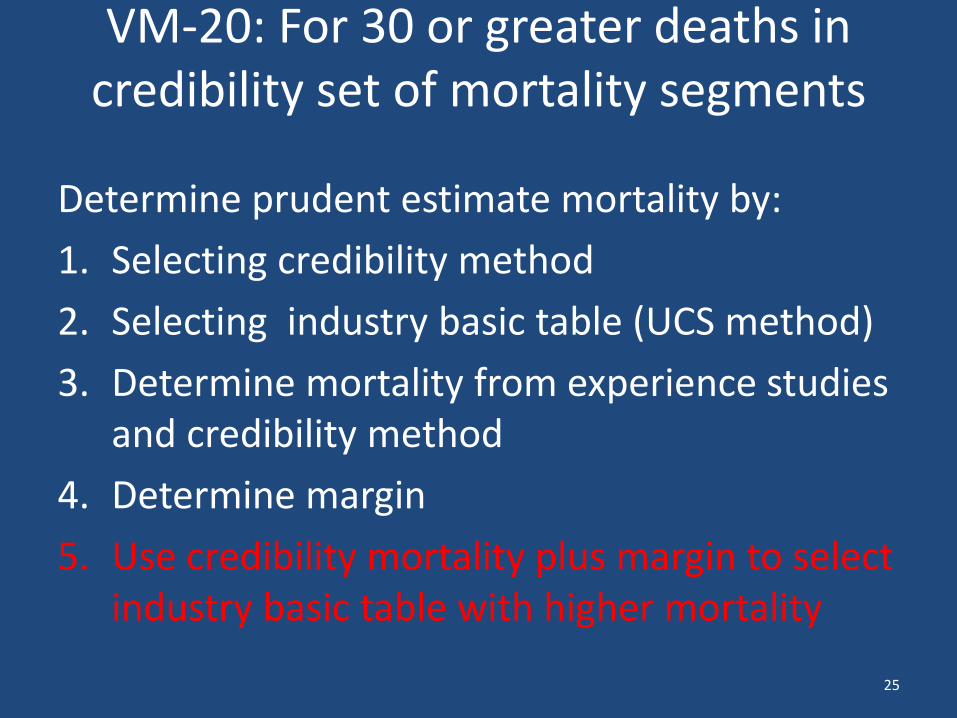
VM-20: For 30 or greater deaths in credibility set of mortality segments
Determine prudent estimate mortality by:1. Selecting credibility method2. Selecting industry basic table (UCS method)3. Determine mortality from experience studies
and credibility method4. Determine margin5. Use credibility mortality plus margin to select
industry basic table with higher mortality
7

Selecting the Credibility Method
Two well-established credibility methods:Limited Fluctuation Method – Uses policy level company data and aggregated industry-wide data Can be done by a company on their business.
Bühlmann empirical Bayesian Method- Uses policy level company data for every company. Due to confidentiality of co data, done by statistical agent
8

Selecting Credibility Method
The total variance of an observation from the mean over all companies is the sum of two different sources of variation, which are:
– Within a company, the variation of the observation about that company’s mean.
– The variation of each company’s mean about the overall mean.
9

Naming the variances
• These variances encountered in Analysis of Variance where they are called the within and between variances.
• In credibility applications they are called– Process variance– Variance of the hypothetical means
10

How the variances are used
• Limited Fluctuation Credibility– Uses only the process variance– The smaller the process variance, the more
accurate observations from that company are– Therefore, need only data from the company
being analyzed.– By ignoring the other variance, the accuracy of the
value that is multiplied by 1 – Z is not taken into account.
11
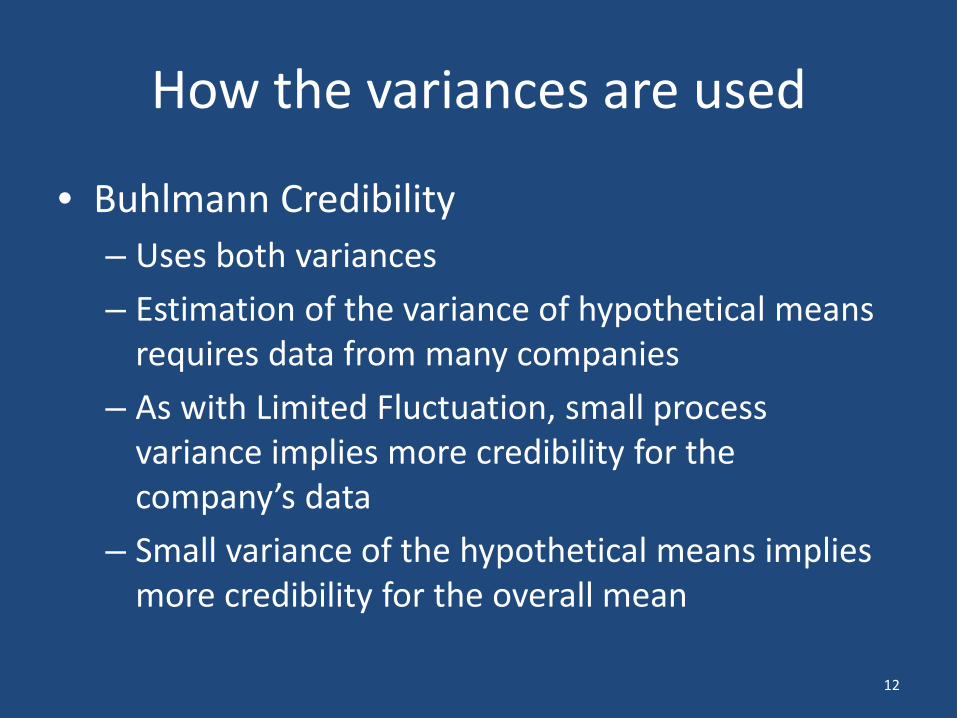
How the variances are used
• Buhlmann Credibility– Uses both variances– Estimation of the variance of hypothetical means
requires data from many companies– As with Limited Fluctuation, small process
variance implies more credibility for the company’s data
– Small variance of the hypothetical means implies more credibility for the overall mean
12

Estimating the variances
• For mortality or lapse data, the observations are Bernoulli trials and thus estimates of the variance are straightforward.
• Adjustments are needed when lives are not observed for a full year
• For Buhlmann Credibility, the average process variance over all companies is used for each company.
13

Estimating the variances
• Variance of the hypothetical means– It is tempting to use the sample variance of the
individual companies mortality ratios– This overstates the variance (because the process
variance also impacts these numbers)– No satisfactory solution (other than a true
Bayesian approach) has been found– Correcting by subtraction implies negative
estimates are possible (use zero in that case)
14
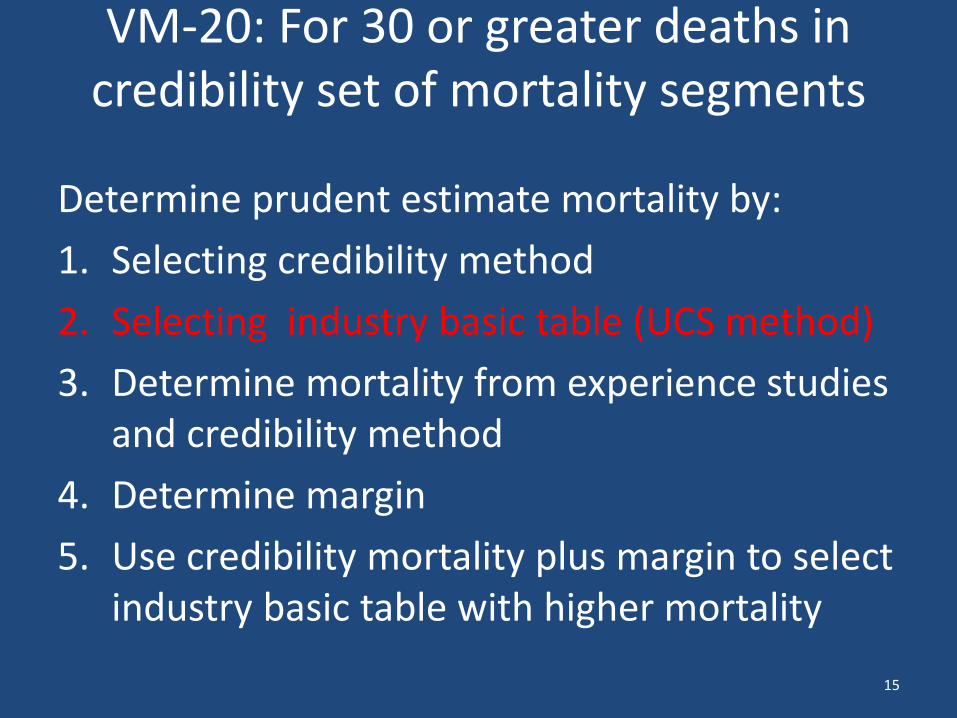
VM-20: For 30 or greater deaths in credibility set of mortality segments
Determine prudent estimate mortality by:1. Selecting credibility method2. Selecting industry basic table (UCS method)3. Determine mortality from experience studies
and credibility method4. Determine margin5. Use credibility mortality plus margin to select
industry basic table with higher mortality
15

Selecting industry basic table (UCS method)
• For VM-20, use industry basic table selected by UCS method as expected mortality basis for the Limited Fluctuation and Bühlmann empirical Bayesian methods
• Examples in this talk use the 2001 VBT as expected mortality basis because 2008 VBT results were not available
• Credibility methods work with any expected mortality basis
16

VM-20: For 30 or greater deaths in credibility set of mortality segments
Determine prudent estimate mortality by:1. Selecting credibility method2. Selecting industry basic table (UCS method)3. Determine mortality from experience studies
and credibility method4. Determine margin5. Use credibility mortality plus margin to select
industry basic table with higher mortality
17

Determine Mortality from Experience Studies and Credibility Method
The following report will be on the SOA website:‘Application of Credibility to Company Lapse and Mortality
Experience’ by Klugman, Rhodes and Purushotham
The report contains:Derivation of FormulasApplied to overall mortality and lapse experience for 10 cos in SOA 2004-05 experience studyResults in paper and Excel sheetsStep by step process shown in appendices
18

Determine Mortality from ExperienceStudies and Credibility Method
Limited Fluctuation, Bühlmann empirical Bayesian methods applied to Nonsmoker Preferred Class Structure of 2 (NS PCS 2)
Experience from:– 7 companies in SOA 2004-05 experience study – Large, medium and small companies– Only a portion of each company’s data used to
maintain individual company confidentiality
19

NS Preferred Class Structure of 2 (NS PCS 2)Limited Fluctuation Method
Overall 2001 VBT
Company 2001 VBT Credibility
Limited Fluctuation
A/E Ratio A/E Ratio Factor Number A/E Ratioby Amount Company by Amount Z of Deaths by Amount
65.6% B 66.4% 0.060 9 65.7%65.6% D 109.3% 0.075 17 68.9%65.6% E 46.2% 0.108 36 63.6%65.6% F 84.9% 0.134 65 68.2%65.6% H 65.3% 0.152 554 65.6%65.6% I 57.8% 0.205 153 64.0%65.6% J 112.4% 0.102 63 70.4%
20
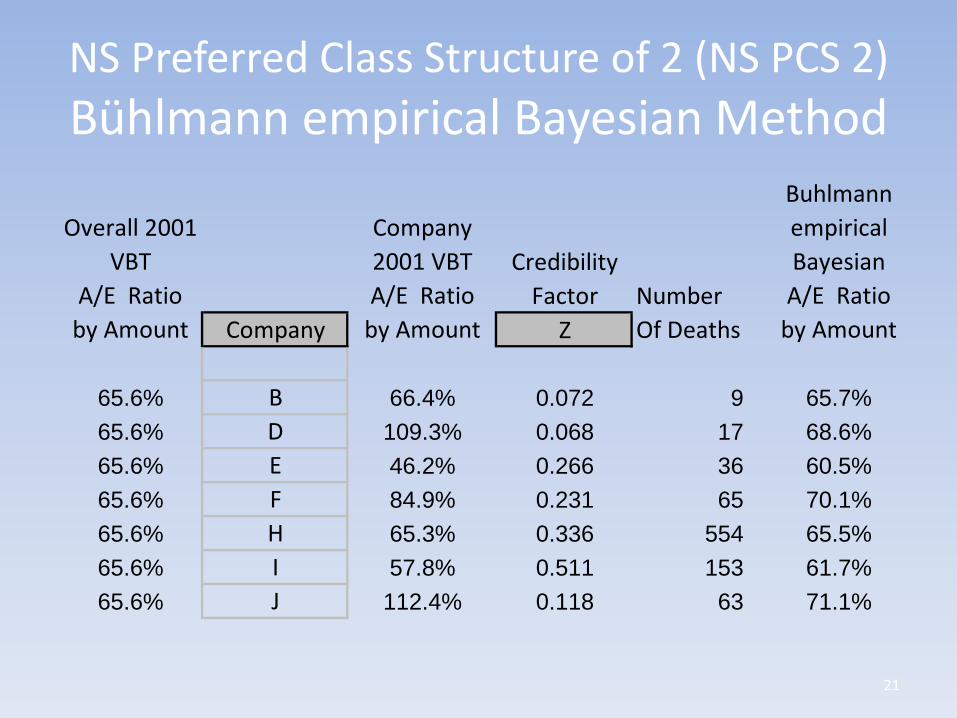
NS Preferred Class Structure of 2 (NS PCS 2) Bühlmann empirical Bayesian Method
Overall 2001 VBT
Company 2001 VBT Credibility
Buhlmann empirical Bayesian
A/E Ratio A/E Ratio Factor Number A/E Ratioby Amount Company by Amount Z Of Deaths by Amount
65.6% B 66.4% 0.072 9 65.7%65.6% D 109.3% 0.068 17 68.6%65.6% E 46.2% 0.266 36 60.5%65.6% F 84.9% 0.231 65 70.1%65.6% H 65.3% 0.336 554 65.5%65.6% I 57.8% 0.511 153 61.7%65.6% J 112.4% 0.118 63 71.1%
21

Credibility methods – Limited Fluctuation & Bühlmann empirical Bayesian
• For the NS PCS 2 mortality data by amount studied, the Bühlmann empirical Bayesian method assigns to a company’s results a level of credibility higher than assigned by the Limited Fluctuation method
• The same conclusion was reached when examining overall mortality data by amount.
22

VM-20: For 30 or greater deaths in credibility set of mortality segments
Determine prudent estimate mortality by:1. Selecting credibility method2. Selecting industry basic table (UCS method)3. Determine mortality from experience studies
and credibility method4. Determine margin5. Use credibility mortality plus margin to select
industry basic table with higher mortality
23

Determine Margin
Refer to:
– VM-20 provisions
– Study on SOA website ‘Analysis of Methods for Determining Margins for Uncertainty under a Principle-Based Framework for Life Insurance and Annuity Products’
24
VM-20: For 30 or greater deaths in credibility set of mortality segments
Determine prudent estimate mortality by:1. Selecting credibility method2. Selecting industry basic table (UCS method)3. Determine mortality from experience studies
and credibility method4. Determine margin5. Use credibility mortality plus margin to select
industry basic table with higher mortality
25

Application of Credibility Methods to Lapse
• Used term policies in the NS PCS 2 for the 7 companies studied for mortality
• Recent LIMRA study is basis for expected lapse
• Principles-Based Valuation Considerations for lapse and other policyholder behavior items
26

Term Lapse for NS PCS 2Limited Fluctuation Method
Overall LIMRA
Company LIMRA Credibility
Limited Fluctuation
A/E Ratio A/E Ratio Factor Number A/E Ratioby Amount Company by Amount Z of Lapses by Amount
150.1% B 130.9% 0.822 1,069 134.3%150.1% D 123.8% 0.091 30 147.7%150.1% E 97.3% 1.000 1,221 97.3%150.1% F 112.1% 0.263 95 140.1%150.1% H 174.8% 1.000 15,540 174.8%150.1% I 142.8% 1.000 7,966 142.8%150.1% J 73.7% 1.000 994 73.7%
27

Term Lapse for NS PCS 2Bühlmann empirical Bayesian Method
Overall LIMRA
Company LIMRA Credibility
Buhlmann empirical Bayesian
A/E Ratio A/E Ratio Factor Number A/E Ratioby Amount Company by Amount Z Of Lapses by Amount
150.1% B 130.9% 0.982 1,069 131.3%150.1% D 123.8% 0.390 30 139.8%150.1% E 97.3% 0.985 1,221 98.1%150.1% F 112.1% 0.826 95 118.7%150.1% H 174.8% 0.998 15,540 174.8%150.1% I 142.8% 0.997 7,966 142.8%150.1% J 73.7% 0.988 994 74.7%
28

Credibility methods – Limited Fluctuation & Bühlmann empirical Bayesian
• For the Term lapse data by amount for policies in the NS PCS 2, the Limited Fluctuation method assigns to a company’s results a level of credibility similar to that assigned by the Bühlmann empirical Bayesian method.
• The same conclusion was reached when examining overall lapse data by amount.
29

Application of Credibility Methods to Lapse
Principles-Based Valuation Considerations for lapse and other policyholder behavior items– No standard tables– Taking into account factors:
• Interest rate environment• Policy provisions• Other
– Need for more work on Policyholder Behavior data format in VM-51
30

Summary• Variability of Co Results around Industry-wide Mortality• VM-20 - Determine prudent estimate mortality :
1. Selecting credibility method2. Selecting industry basic table (UCS method)3. Determine mortality from experience studies
and credibility method4. Determine margin5. Use credibility mortality plus margin to select
industry basic table with higher mortality • Examples using Preferred Mortality and Term Lapse rates
31
Recommended