Credit Supply and Demand in Unconventional Times
The opinions in this presentation are those of the authors and do not necessarily reflect the views of the European Central Bank and the Eurosystem.
Brussels, 1 February 2018
Carlo Altavilla Miguel Boucinha Sarah Holton Steven Ongena
European Central Bank European Central Bank
European Central Bank U of Zurich, SFI, KU Leuven & CEPR
Research questions
2
Altavilla C. – Boucinha M. – Holton S. – Ongena S. Credit Supply and Demand in Unconventional Times
Do individual bank supply and demand pressures both determine credit origination?
Can loan demand also depend on bank characteristics?
Have non-standard monetary policies impacted loan supply?
Research questions
3
Altavilla C. – Boucinha M. – Holton S. – Ongena S. Credit Supply and Demand in Unconventional Times
Do individual bank supply and demand pressures both determine credit origination?
Can loan demand also depend on bank characteristics?
Have non-standard monetary policies impacted loan supply?

Research questions
4
Altavilla C. – Boucinha M. – Holton S. – Ongena S. Credit Supply and Demand in Unconventional Times
Do individual bank supply and demand pressures both determine credit origination?
Can loan demand also depend on bank characteristics?
Have non-standard monetary policies impacted loan supply?

Contributions to the literature: Using bank lending surveys
5
Altavilla C. – Boucinha M. – Holton S. – Ongena S. Credit Supply and Demand in Unconventional Times
Establishing determinants of credit using bank lending surveys
US: Lown, Morgan, and Rohatgi (EPR 2000), Lown and Morgan (JMCB 2006), Bassett, Chosak, Driscoll, and Zakrajek (JME 2014)
European countries: Blaes (2011), Del Giovane, Eramo, Nobili (JBF 2011), Pintarić (2015) Euro area: Ciccarelli, Maddaloni, Peydró (EP 2013), Ciccarelli, Maddaloni, Peydró (RED 2015), Altavilla, Darracq Paries and Nicoletti (2015)
Contributions to the literature: Identifying credit supply from demand
6
Altavilla C. – Boucinha M. – Holton S. – Ongena S. Credit Supply and Demand in Unconventional Times
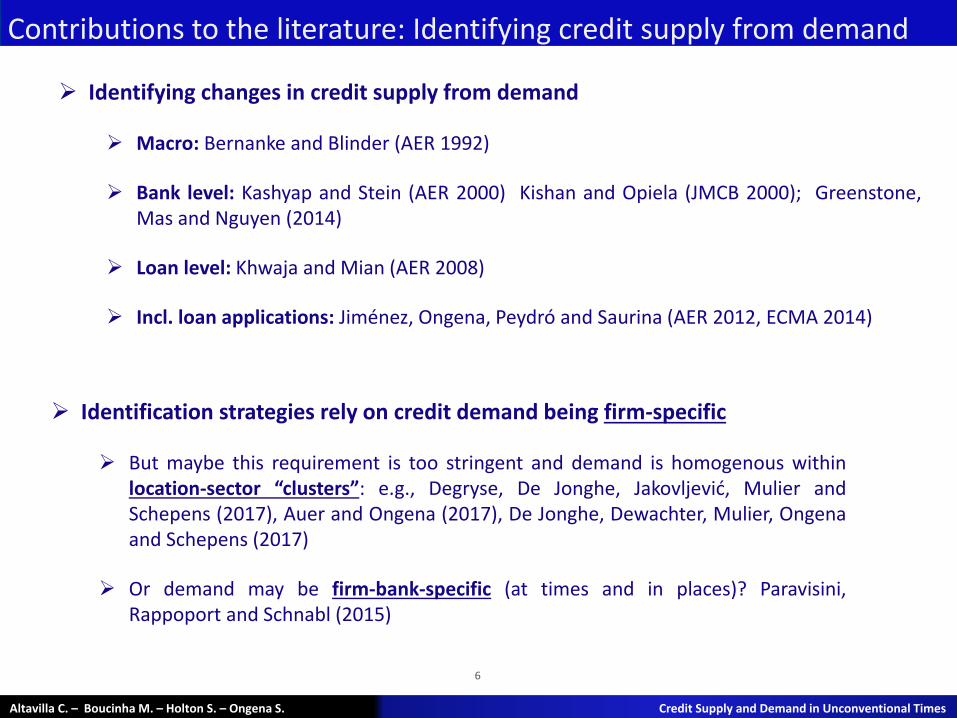
Identifying changes in credit supply from demand
Macro: Bernanke and Blinder (AER 1992)
Bank level: Kashyap and Stein (AER 2000) Kishan and Opiela (JMCB 2000); Greenstone, Mas and Nguyen (2014)
Loan level: Khwaja and Mian (AER 2008)
Incl. loan applications: Jiménez, Ongena, Peydró and Saurina (AER 2012, ECMA 2014)
Identification strategies rely on credit demand being firm-specific
But maybe this requirement is too stringent and demand is homogenous within location-sector “clusters”: e.g., Degryse, De Jonghe, Jakovljević, Mulier and Schepens (2017), Auer and Ongena (2017), De Jonghe, Dewachter, Mulier, Ongena and Schepens (2017)
Or demand may be firm-bank-specific (at times and in places)? Paravisini, Rappoport and Schnabl (2015)
Contributions to the literature: Non-standard monetary policy
7
Altavilla C. – Boucinha M. – Holton S. – Ongena S. Credit Supply and Demand in Unconventional Times
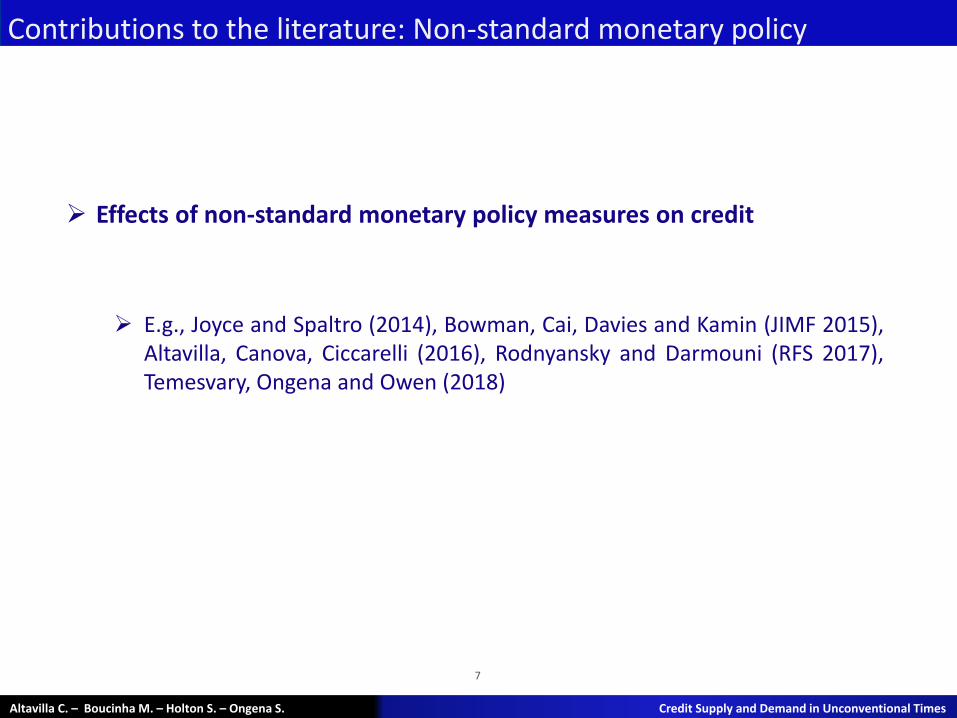
Effects of non-standard monetary policy measures on credit
E.g., Joyce and Spaltro (2014), Bowman, Cai, Davies and Kamin (JIMF 2015), Altavilla, Canova, Ciccarelli (2016), Rodnyansky and Darmouni (RFS 2017), Temesvary, Ongena and Owen (2018)
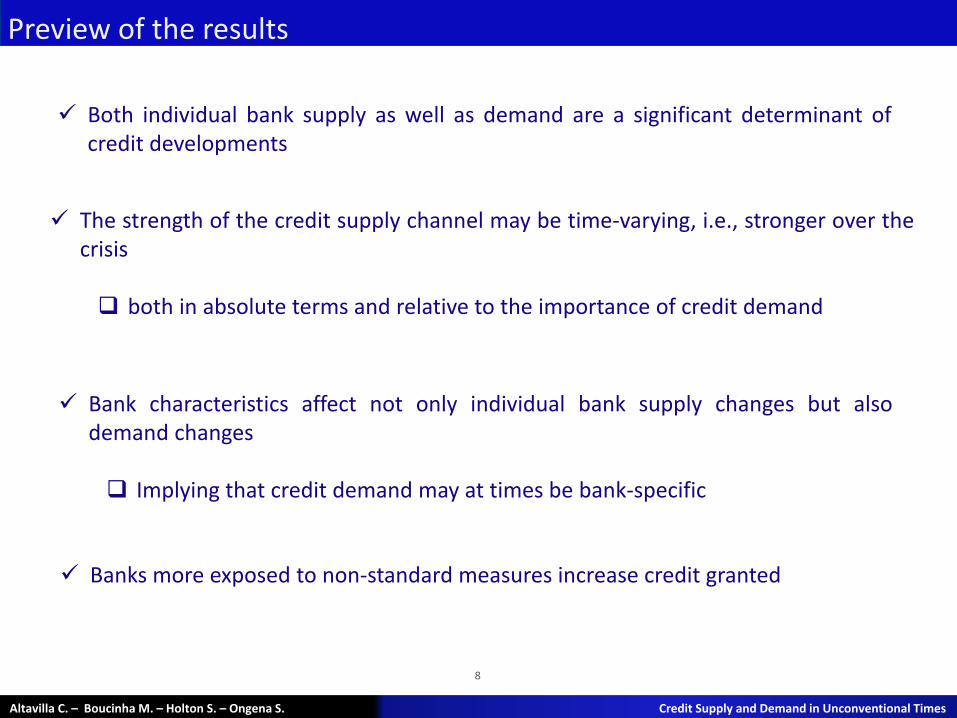
Preview of the results
8
Both individual bank supply as well as demand are a significant determinant of credit developments
The strength of the credit supply channel may be time-varying, i.e., stronger over the crisis both in absolute terms and relative to the importance of credit demand
Bank characteristics affect not only individual bank supply changes but also demand changes Implying that credit demand may at times be bank-specific
Altavilla C. – Boucinha M. – Holton S. – Ongena S. Credit Supply and Demand in Unconventional Times
Banks more exposed to non-standard measures increase credit granted

Outline
9
Data and stylised facts
Actual credit developments, and BLS supply and demand Balance sheet strength, credit supply and demand
Interaction with Non-standard monetary policies
Conclusions
Altavilla C. – Boucinha M. – Holton S. – Ongena S. Credit Supply and Demand in Unconventional Times

Data and Stylised facts
10
Altavilla C. – Boucinha M. – Holton S. – Ongena S. Credit Supply and Demand in Unconventional Times
Data
Individual Bank Lending Survey responses (iBLS)
granular - information on 116 BLS banks from 13 countries representative - includes over 50% of total loans to enterprise time-series - quarterly data from 2002Q4-2017Q4
Novelty: can be linked to individual banks’ loan developments and balance sheet characteristics across a number of countries for a decade
Individual Balance sheet information (iBSI)
Monetary financial institutions (MFIs) – 134 linked to the BLS banks Data from mid-2007
Financial market data

Data and Stylised facts
11
Altavilla C. – Boucinha M. – Holton S. – Ongena S. Credit Supply and Demand in Unconventional Times
Loans to euro area NFCs (annual growth rates)
Loans to NFCs, credit standards and demand (net percentages, annual growth rates)
-5
0
5
10
15
-5
0
5
10
15
200809 201003 201109 201303 201409 201603 201709
Total euro area iBLS sample
-5
0
5
10
15
-0.50
-0.25
0.00
0.25
0.50
0.75
200809 201003 201109 201303 201409 201603 201709
Net tightening Net demand Loan growth (RHS)

Data and Stylised facts
12
Altavilla C. – Boucinha M. – Holton S. – Ongena S. Credit Supply and Demand in Unconventional Times
Credit supply (percentage of bank responses)
Credit demand (percentage of bank responses)
Notes: iBLS bank responses, ESCB
0%
25%
50%
75%
100%
200212 200706 201112 201606
eased considerably eased somewhat basically unchanged
tightened somewhat tightened considerably
0%
25%
50%
75%
100%
200212 200706 201112 201606
increased considerably increased somewhat basically unchanged
decreased somewhat decreased considerably
Data and Stylised facts
13
Altavilla C. – Boucinha M. – Holton S. – Ongena S. Credit Supply and Demand in Unconventional Times
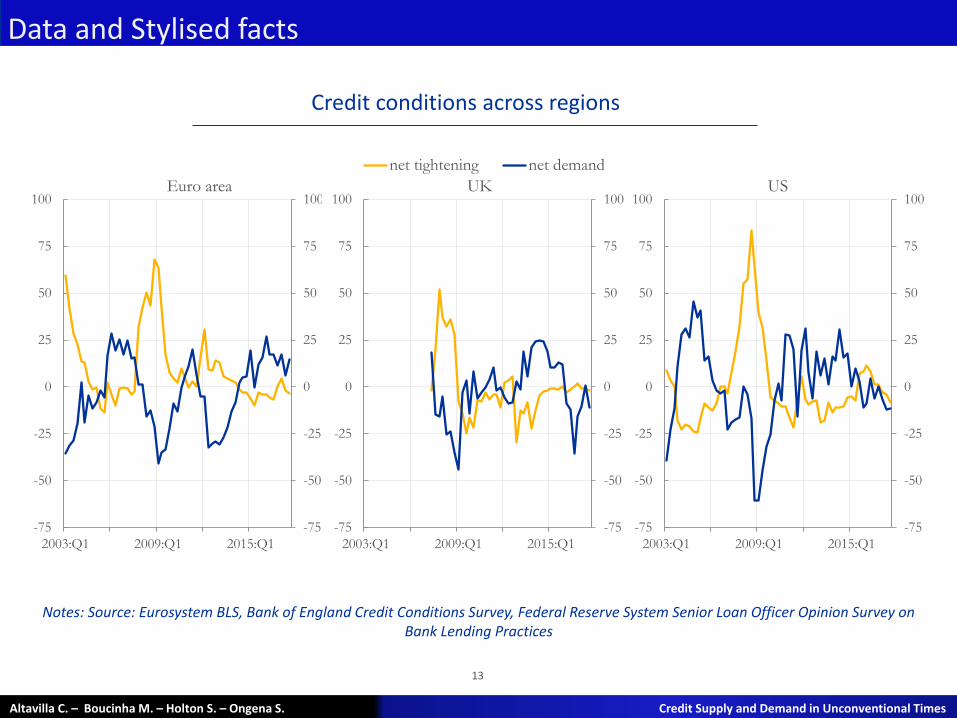
Credit conditions across regions
Notes: Source: Eurosystem BLS, Bank of England Credit Conditions Survey, Federal Reserve System Senior Loan Officer Opinion Survey on Bank Lending Practices
-75
-50
-25
0
25
50
75
100
-75
-50
-25
0
25
50
75
100
2003:Q1 2009:Q1 2015:Q1
UK
net tightening net demand
-75
-50
-25
0
25
50
75
100
-75
-50
-25
0
25
50
75
100
2003:Q1 2009:Q1 2015:Q1
Euro area
-75
-50
-25
0
25
50
75
100
-75
-50
-25
0
25
50
75
100
2003:Q1 2009:Q1 2015:Q1
US

Outline
14
Stylised facts
Credit developments, BLS supply and demand Balance sheet strength, credit supply and demand
Interaction with Non-standard monetary policies
Conclusions
Altavilla C. – Boucinha M. – Holton S. – Ongena S. Credit Supply and Demand in Unconventional Times
Credit developments, BLS supply and demand
15
Altavilla C. – Boucinha M. – Holton S. – Ongena S. Credit Supply and Demand in Unconventional Times
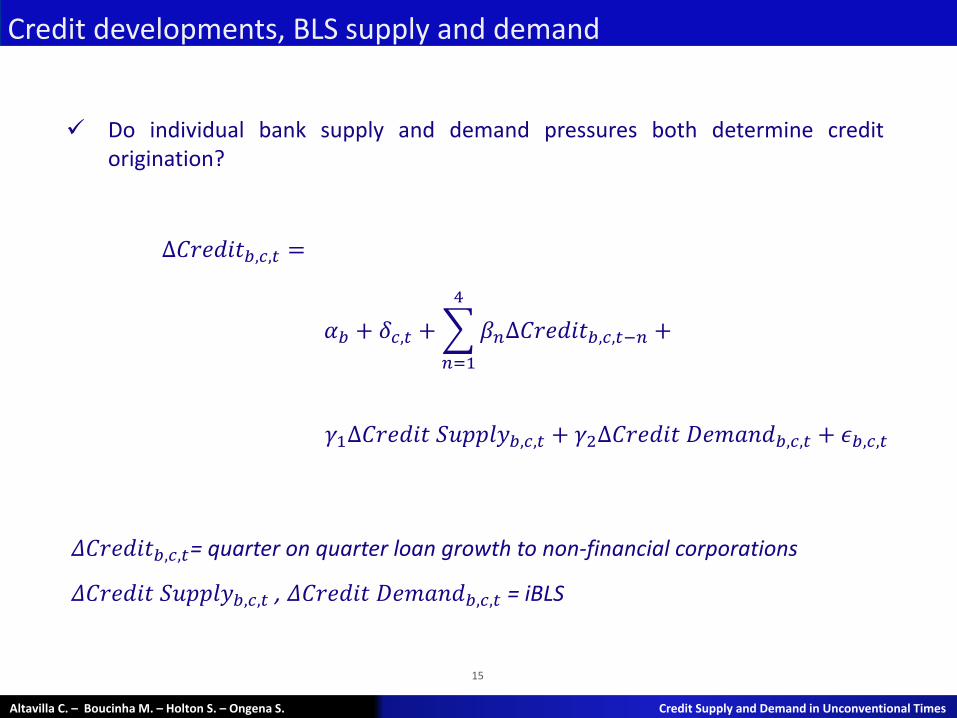
Do individual bank supply and demand pressures both determine credit origination?
Δ𝐶𝑟𝑒𝑑𝑖𝑡𝑏,𝑐,𝑡 =
𝛾1Δ𝐶𝑟𝑒𝑑𝑖𝑡 𝑆𝑢𝑝𝑝𝑙𝑦𝑏,𝑐,𝑡 + 𝛾2Δ𝐶𝑟𝑒𝑑𝑖𝑡 𝐷𝑒𝑚𝑎𝑛𝑑𝑏,𝑐,𝑡 + 𝜖𝑏,𝑐,𝑡
𝛼𝑏 + 𝛿𝑐,𝑡 + 𝛽𝑛Δ𝐶𝑟𝑒𝑑𝑖𝑡𝑏,𝑐,𝑡−𝑛 +
4
𝑛=1
𝛥𝐶𝑟𝑒𝑑𝑖𝑡𝑏,𝑐,𝑡= quarter on quarter loan growth to non-financial corporations
𝛥𝐶𝑟𝑒𝑑𝑖𝑡 𝑆𝑢𝑝𝑝𝑙𝑦𝑏,𝑐,𝑡 , 𝛥𝐶𝑟𝑒𝑑𝑖𝑡 𝐷𝑒𝑚𝑎𝑛𝑑𝑏,𝑐,𝑡 = iBLS
Credit developments, BLS supply and demand
16
Altavilla C. – Boucinha M. – Holton S. – Ongena S. Credit Supply and Demand in Unconventional Times
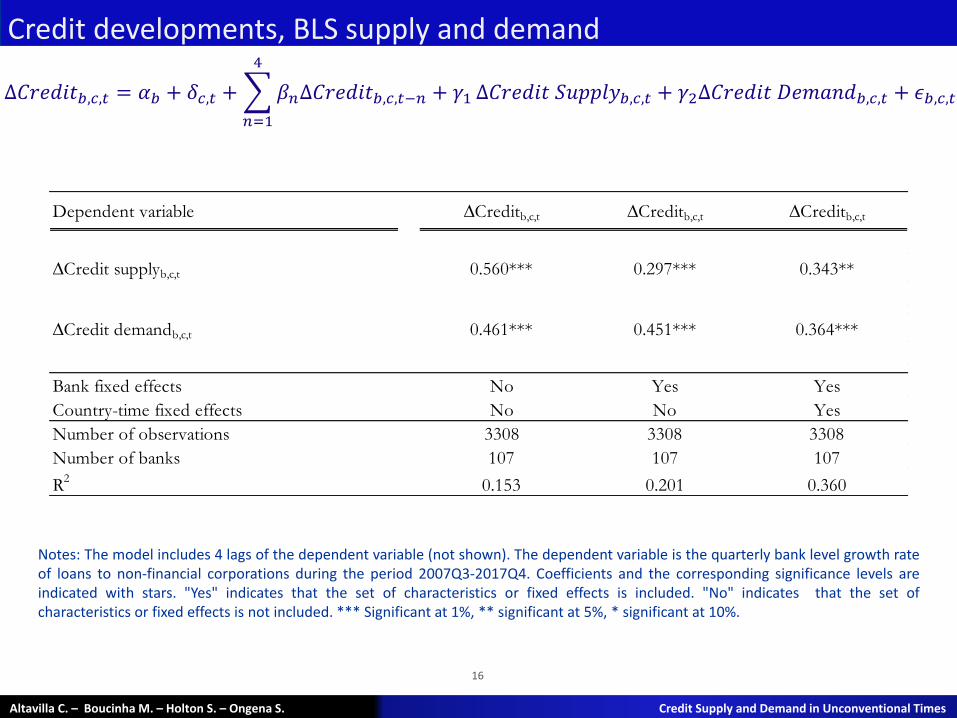
Δ𝐶𝑟𝑒𝑑𝑖𝑡𝑏,𝑐,𝑡 = 𝛼𝑏 + 𝛿𝑐,𝑡 + 𝛽𝑛Δ𝐶𝑟𝑒𝑑𝑖𝑡𝑏,𝑐,𝑡−𝑛 + 𝛾1
4
𝑛=1
Δ𝐶𝑟𝑒𝑑𝑖𝑡 𝑆𝑢𝑝𝑝𝑙𝑦𝑏,𝑐,𝑡 + 𝛾2Δ𝐶𝑟𝑒𝑑𝑖𝑡 𝐷𝑒𝑚𝑎𝑛𝑑𝑏,𝑐,𝑡 + 𝜖𝑏,𝑐,𝑡
Notes: The model includes 4 lags of the dependent variable (not shown). The dependent variable is the quarterly bank level growth rate of loans to non-financial corporations during the period 2007Q3-2017Q4. Coefficients and the corresponding significance levels are indicated with stars. "Yes" indicates that the set of characteristics or fixed effects is included. "No" indicates that the set of characteristics or fixed effects is not included. *** Significant at 1%, ** significant at 5%, * significant at 10%.
Dependent variable ∆Creditb,c,t ∆Creditb,c,t ∆Creditb,c,t
∆Credit supplyb,c,t 0.560*** 0.297*** 0.343**
∆Credit demandb,c,t 0.461*** 0.451*** 0.364***
Bank fixed effects No Yes Yes
Country-time fixed effects No No Yes
Number of observations 3308 3308 3308
Number of banks 107 107 107
R2
0.153 0.201 0.360

Data and Stylised facts
17
Altavilla C. – Boucinha M. – Holton S. – Ongena S. Credit Supply and Demand in Unconventional Times
Credit supply Credit demand
Notes: The figure displays the recursive estimates of the coefficients (and the corresponding 90% confidence intervals) of a regression of the bank-level quarterly growth rate of NFC loans on loan supply and demand as reported by banks in the BLS for windows starting in 2007Q3 and ending in the year and quarter indicated on the x-axis (column 3 in the previous slide).
-0.25
0.00
0.25
0.50
0.75
1.00
-0.25
0.00
0.25
0.50
0.75
1.00
201201 201301 201401 201501 201601 201701
Recursive coefficient 90% CI
-0.25
0.00
0.25
0.50
0.75
1.00
-0.25
0.00
0.25
0.50
0.75
1.00
201201 201301 201401 201501 201601 201701

Outline
18
Stylised facts
Actual credit developments, and BLS supply and demand Balance sheet strength, credit supply and demand
Interaction with Non-standard monetary policies
Conclusions
Altavilla C. – Boucinha M. – Holton S. – Ongena S. Credit Supply and Demand in Unconventional Times

19
Altavilla C. – Boucinha M. – Holton S. – Ongena S. Credit Supply and Demand in Unconventional Times
𝛥𝐵𝐿𝑆𝑏,𝑐,𝑡 = 𝛼𝑏 + 𝛿𝑐,𝑡 + 𝛽𝑛Δ𝐵𝐿𝑆𝑏,𝑐,𝑡−𝑛
4
𝑛=1
+ 𝜔 𝑆ℎ𝑜𝑐𝑘𝑡 + 𝜓 𝑋𝑏,𝑐,𝑡−1 + 𝜙(𝑆ℎ𝑜𝑐𝑘𝑡× 𝑋𝑏,𝑐,𝑡−1)
+ 𝜃𝐵𝑜𝑟𝑟𝑜𝑤𝑒𝑟 𝑟𝑖𝑠𝑘𝑏,𝑐,𝑡 + 𝜖𝑏,𝑐,𝑡
Balance sheet strength, credit demand and supply
Can loan demand also depend on bank characteristics?
𝐵𝐿𝑆 = credit Supply (CS), credit Demand (CD)
Shock = change in 3-month Euribor
𝑋𝑏,𝑐,𝑡−1= bank specific measure of risk (CDS)

Balance sheet strength, credit demand and supply
20
Altavilla C. – Boucinha M. – Holton S. – Ongena S. Credit Supply and Demand in Unconventional Times
𝛥𝐵𝐿𝑆𝑏,𝑐,𝑡 = 𝛼𝑏 + 𝛿𝑐,𝑡 + 𝛽𝑛Δ𝐵𝐿𝑆𝑏,𝑐,𝑡−𝑛
4
𝑛=1
+ 𝜔 𝑆ℎ𝑜𝑐𝑘𝑡 + 𝜓 𝑋𝑏,𝑐,𝑡−1 + 𝜙 (𝑆ℎ𝑜𝑐𝑘𝑡× 𝑋𝑏,𝑐,𝑡−1) + 𝜃𝐵𝑜𝑟𝑟𝑜𝑤𝑒𝑟 𝑟𝑖𝑠𝑘𝑏,𝑐,𝑡 + 𝜖𝑏,𝑐,𝑡
Notes: The dependent variables are the bank reported changes in Credit supply and Credit demand during the period 2007Q2-2017Q4. Coefficients and the corresponding significance levels are indicated with stars. *** Significant at 1%, ** significant at 5%, * significant at 10%.
Dependent variable:
∆ CDSb,c,t-1 -0.000525** -0.000473*** -0.000741*** -0.000717***
∆Euribort x ∆ CDSb,c,t-1 -0.000868* -0.000764** -0.00135*** -0.00130**
Borrower riskb,c,t-1 -0.331*** -0.199***
Bank fixed effects Yes Yes Yes Yes
Country-time fixed effects Yes Yes Yes Yes
Number of observations 2662 2659 2642 2639
Number of banks 90 90 90 90
R2
0.553 0.616 0.499 0.509
∆Credit supplyb,c,t ∆Credit demandb,c,t

Outline
21
Stylised facts
Actual credit developments, and BLS supply and demand Balance sheet strength, credit supply and demand
Interaction with Non-standard monetary policies
Conclusions
Altavilla C. – Boucinha M. – Holton S. – Ongena S. Credit Supply and Demand in Unconventional Times
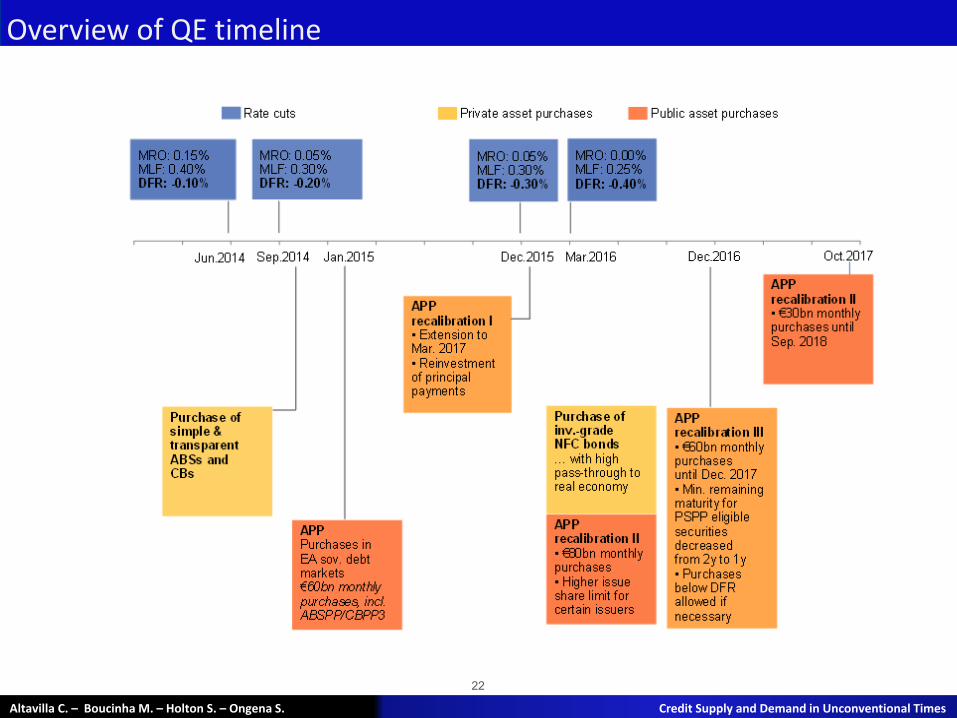
The 2014-16 measures
22
Overview of QE timeline
Altavilla C. – Boucinha M. – Holton S. – Ongena S. Credit Supply and Demand in Unconventional Times
Non-standard monetary policies
Altavilla C. – Boucinha M. – Holton S. – Ongena S. Credit Supply and Demand in Unconventional Times
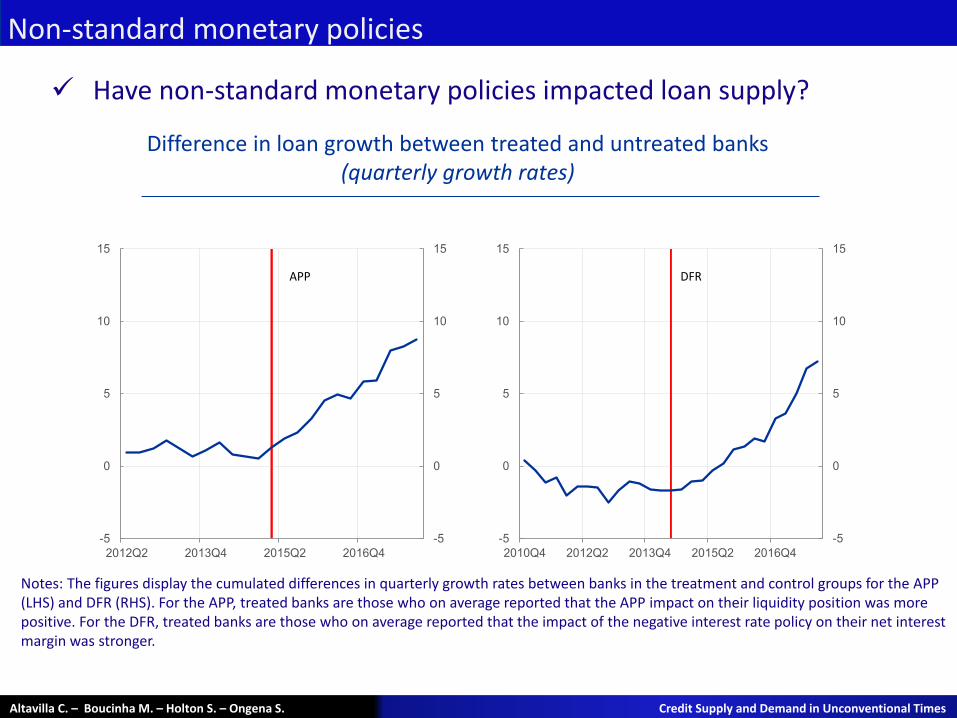
Have non-standard monetary policies impacted loan supply?
Difference in loan growth between treated and untreated banks (quarterly growth rates)
Notes: The figures display the cumulated differences in quarterly growth rates between banks in the treatment and control groups for the APP (LHS) and DFR (RHS). For the APP, treated banks are those who on average reported that the APP impact on their liquidity position was more positive. For the DFR, treated banks are those who on average reported that the impact of the negative interest rate policy on their net interest margin was stronger.
-5
0
5
10
15
-5
0
5
10
15
2010Q4 2012Q2 2013Q4 2015Q2 2016Q4
DFR
-5
0
5
10
15
-5
0
5
10
15
2012Q2 2013Q4 2015Q2 2016Q4
APP

Non-standard monetary policies
24
Altavilla C. – Boucinha M. – Holton S. – Ongena S. Credit Supply and Demand in Unconventional Times
𝛥𝐶𝑟𝑒𝑑𝑖𝑡𝑏,𝑐,𝑡
= γ𝑛𝛥𝐶𝑟𝑒𝑑𝑖𝑡𝑏,𝑐,𝑡−𝑛
4
𝑛=1
+ 𝛽1(𝑇𝑟𝑒𝑎𝑡𝑒𝑑𝑏,𝑐 ∗ 𝑃𝑜𝑠𝑡𝑡)
+ β2𝑃𝑜𝑠𝑡𝑡 +β3𝑇𝑟𝑒𝑎𝑡𝑒𝑑𝑏,𝑐 +β4Δ𝐷𝑒𝑚𝑎𝑛𝑑𝑏,𝑐,𝑡 + β5Borrower risk𝑏,𝑐,𝑡 + Γ 𝑋𝑏,𝑐,𝑡−1
+ 𝛼𝑏 + 𝛿𝑐,𝑡 + 𝜖𝑏,𝑐,𝑡
𝑇𝑟𝑒𝑎𝑡𝑒𝑑= 0, 1 for banks more affected by each policy: Asset purchase programme (APP) and negative deposit facility rate (DFR)
T = 0, 1 from Jan 2015 for APP and 1 from June 2014 for negative DFR
X = Bank characteristics (size, leverage, liquidity)
Have non-standard monetary policies impacted loan supply?
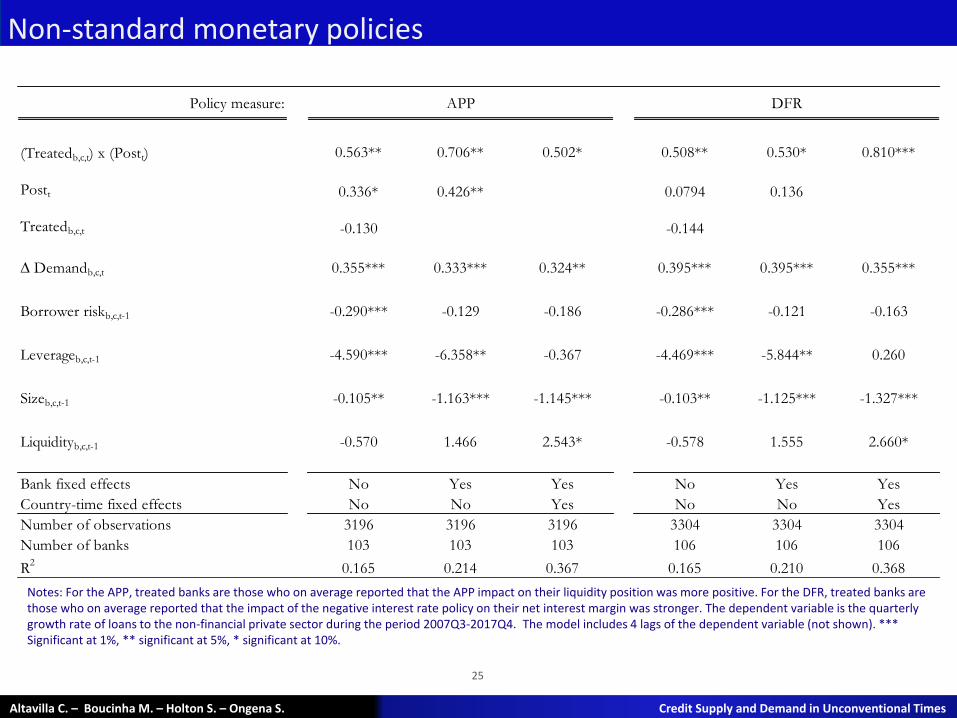
25
Altavilla C. – Boucinha M. – Holton S. – Ongena S. Credit Supply and Demand in Unconventional Times
Non-standard monetary policies
Notes: For the APP, treated banks are those who on average reported that the APP impact on their liquidity position was more positive. For the DFR, treated banks are those who on average reported that the impact of the negative interest rate policy on their net interest margin was stronger. The dependent variable is the quarterly growth rate of loans to the non-financial private sector during the period 2007Q3-2017Q4. The model includes 4 lags of the dependent variable (not shown). *** Significant at 1%, ** significant at 5%, * significant at 10%.
Policy measure:
(Treatedb,c,t) x (Postt) 0.563** 0.706** 0.502* 0.508** 0.530* 0.810***
Postt 0.336* 0.426** 0.0794 0.136
Treatedb,c,t -0.130 -0.144
∆ Demandb,c,t 0.355*** 0.333*** 0.324** 0.395*** 0.395*** 0.355***
Borrower riskb,c,t-1 -0.290*** -0.129 -0.186 -0.286*** -0.121 -0.163
Leverageb,c,t-1 -4.590*** -6.358** -0.367 -4.469*** -5.844** 0.260
Sizeb,c,t-1 -0.105** -1.163*** -1.145*** -0.103** -1.125*** -1.327***
Liquidityb,c,t-1 -0.570 1.466 2.543* -0.578 1.555 2.660*
Bank fixed effects No Yes Yes No Yes Yes
Country-time fixed effects No No Yes No No Yes
Number of observations 3196 3196 3196 3304 3304 3304
Number of banks 103 103 103 106 106 106
R2
0.165 0.214 0.367 0.165 0.210 0.368
APP DFR

26
Altavilla C. – Boucinha M. – Holton S. – Ongena S. Credit Supply and Demand in Unconventional Times
Non-standard monetary policies
Main messages
Results show that both the APP and the negative DFR led to an increase in the supply of bank loans even after controlling for
all macroeconomic effects
loan demand
borrower risk
bank characteristics
all other observable and unobservable differences across banks that are time invariant
Increased loan demand is associated with higher loan growth even when bank and country-time fixed effects are included, indicating that loan demand
is time-variant
varies across banks even within a certain country and time-period.

Outline
27
Stylised facts
Actual credit developments, and BLS supply and demand Balance sheet strength, credit supply and demand
Interaction with Non-standard monetary policies
Conclusions
Altavilla C. – Boucinha M. – Holton S. – Ongena S. Credit Supply and Demand in Unconventional Times

Conclusions
28
Altavilla C. – Boucinha M. – Holton S. – Ongena S. Credit Supply and Demand in Unconventional Times
Do individual bank supply and demand pressures both determine credit origination? YES: with evidence that supply is more relevant over crisis periods
Can loan demand also depend on bank characteristics? YES: implying bank riskiness could be relevant for the borrower selection
of external financing sources
Have non-standard monetary policies impacted loan supply? YES: APP and DFR supported bank lending

29
Recommended
![R R 34 0.25 0.25 0.25 0.25 0.25 0.25 0.25 0.25 0.25 u 0 25 1 2 3 4 12000C 63kbar 5 k bar ) RR34 0.25 Ö0.25 0.25 0.25 0.25 ú0.75 Q] 0.5 Ö0.5 Ó0.5 Ù0.25 0.25 Ö0](https://img.pdfslide.net/doc/110x75/5e7e08fd2ef2a45bbd70f7b6/r-r-34-025-025-025-025-025-025-025-025-025-u-0-25-1-2-3-4-12000c-63kbar.jpg)