THE SOUTH AFRICA I KNOW, THE HOME I UNDERSTAND
Crime Statistics Series Volume 4
Exploring the extent of and circumstances surrounding housebreaking/burglary and
home robbery
An in-depth analysis of the Victims of Crime Survey data
2015–2016
Statistics South Africa
PJ Lehohla
Report No. 03-40-04 (2015–2016) Statistician-General
STATISTICS SOUTH AFRICA ii
Crime Statistics Series Volume I: Exploring the extent of and circumstances surrounding housebreaking/burglary and home robbery, 2015–2016
Exploring the extent of and circumstances surrounding housebreaking and home robbery in South Africa based on the Victims of Crime Survey data (In-depth analysis of Victims of Crime data: 2015–2016)/Statistics South Africa
Published by Statistics South Africa, ISIbalo House, 1 Koch Street, Pretoria 0002
© Statistics South Africa, 2017
Users may apply or process this data, provided Statistics South Africa (Stats SA) is acknowledged as
the original source of the data; that it is specified that the application and/or analysis is the result of the
user's independent processing of the data; and that neither the basic data nor any reprocessed version
or application thereof may be sold or offered for sale in any form whatsoever without prior permission
from Stats SA.
Stats SA Library Cataloguing-in-Publication (CIP) Data
Exploring the extent of and circumstances surrounding housebreaking and home robbery in South Africa based on the Victims of Crime Survey data (In-depth analysis of Victims of Crime data (2015–2016)/Statistics South Africa. Pretoria: Statistics South Africa, 2017
Report No. 03-40-04 (2015–2016)
95 pp
ISBN 978-0-621-45442-0
A complete set of Stats SA publications is available at Stats SA Library and the following libraries:
National Library of South Africa, Pretoria Division
National Library of South Africa, Cape Town Division
Library of Parliament, Cape Town
Bloemfontein Public Library
Natal Society Library, Pietermaritzburg
Johannesburg Public Library
Eastern Cape Library Services, King William’s Town
Central Regional Library, Polokwane
Central Reference Library, Mbombela
Central Reference Collection, Kimberley
Central Reference Library, Mmabatho
This report is available on the Stats SA website: www.statssa.gov.za
Copies are obtainable from: Reprographics, Statistics South Africa
Tel: (012) 310 8619
(012) 310 8161
Email: [email protected]
STATISTICS SOUTH AFRICA iii
Crime Statistics Series Volume I: Exploring the extent of and circumstances surrounding housebreaking/burglary and home robbery, 2015–2016
Preface
The Constitution of the Republic of South Africa recognises the importance of freedom and security
of every individual within the country’s borders. As a result, safety and security remains a central
theme of the government’s strategies, such as the National Development Plan, which highlights
safety as a core human right.
It is evident that crime instils fear amongst households and it may hinder their ability to engage in
their day-to-day activities. In order to fully understand the multi-faceted dynamics of crime and the
extent to which it affects the society, empirical information that will facilitate evidence-based
decision-making is needed. As a statistical agency, Statistics South Africa (Stats SA) is not directly
responsible for crime prevention, but it has a mandate to provide information on the nature of crime
and victimisation in South Africa.
Crime statistics are mainly produced through administrative data sources within the South African
Police Service (SAPS), which are useful in quantifying crime and identifying crime hotspots.
However, such data do not always contain the information necessary to measure the full extent of
crime and relevant demographic and socioeconomic indicators related to crime and victimisation.
Survey data, from the perspective of the victims, have been used to complement existing
administrative data.
Despite the measures that exist to combat crime, it continues to be a challenge for the victims and
those responsible for crime prevention. An estimated 727 130 households in South Africa
experienced housebreaking/burglary in 2015/16, and a further 171 739 households were victims of
home robbery, making these crimes the most prevalent household crimes. Although these two
crimes are also most feared by households, they remain largely unreported to the police, thus
distorting the true magnitude of crime in the country.
This report, the forth in a series of thematic crime reports, examined the extent of
housebreaking/burglary and home robbery in the country, and the circumstances around which
these crimes occurred, including the time of day, mode of entry and property lost. Police data were
also analysed and compared with estimates from VOCS. It is envisaged that the findings presented
in this report will provide meaningful information that can assist in assessing the crime situation in
South Africa and further aid in expanding the statistical information base in order to strengthen
policy formulation.
Mr Pali Lehohla
Statistician-General: Statistics South Africa
STATISTICS SOUTH AFRICA iv
Crime Statistics Series Volume I: Exploring the extent of and circumstances surrounding housebreaking/burglary and home robbery, 2015–2016
Contents
List of Tables .................................................................................................................................... v
List of Figures .................................................................................................................................. vi
Glossary of abbreviations ............................................................................................................... vii
Concepts and definitions .................................................................................................................. x
1. Executive Summary ...................................................................................................................... 1
2. Background .................................................................................................................................. 3
2.1 Legislative framework ................................................................................................................. 3
2.2 National Development Plan ........................................................................................................ 5
2.3 Medium Term Strategic Framework and the Criminal Justice System ...................................... 5
2.4 The Statistics Act ........................................................................................................................ 5
3. Introduction ................................................................................................................................... 6
3.1 Objectives ................................................................................................................................... 6
3.2 Methodology ............................................................................................................................... 7
3.3 Data analysis .............................................................................................................................. 7
3.4 Limitations of the study ............................................................................................................... 8
3.5 Organisation of the report ........................................................................................................... 8
4. General findings ........................................................................................................................... 9
4.1 Trends in victimisation ................................................................................................................ 9
4.2 Trends in perceptions of crime ................................................................................................. 11
5. Findings on housebreaking and home robbery .......................................................................... 19
5.1 Month and time for housebreaking and home robbery ............................................................ 19
5.2 Belongings stolen during housebreaking and home robbery ................................................... 22
5.3 Arrest and conviction ................................................................................................................ 24
5.4 Satisfaction with the police ....................................................................................................... 27
5.5 Reporting of housebreaking and robbery ................................................................................. 28
5.6 Other authorities where households report housebreaking and home robbery ....................... 30
5.7 Modelling housebreaking and home robbery ........................................................................... 32
5.8 Factors associated with housebreaking ................................................................................... 33
5.9 Factors associated with home robbery ..................................................................................... 35
5.10 Factors associated with reporting housebreaking .................................................................. 37
5.11 Factors associated with reporting home robbery ................................................................... 39
6. Analysis of SAPS data................................................................................................................ 41
6.1 Measuring the achievement of NDP crime goals ..................................................................... 41
6.2 Comparison of provincial VOCS estimates with SAPS data .................................................... 44
6.3 Determinants of SAPS crime data reported at district level ..................................................... 45
7. Conclusions and recommendations ........................................................................................... 48
7.1 Conclusions .............................................................................................................................. 48
7.2 Recommendations .................................................................................................................... 49
8. References ................................................................................................................................. 51
Annexure 1: Household victimisation rates .................................................................................... 52
Annexure 2: R code used in the analysis ....................................................................................... 53
STATISTICS SOUTH AFRICA v
Crime Statistics Series Volume I: Exploring the extent of and circumstances surrounding housebreaking/burglary and home robbery, 2015–2016
List of Tables
Table 1: Proportion of households that experienced crime in the last 12 months by gender ....................... 9
Table 2: Distribution of types of crime experienced by South African households, 2015/16 ...................... 13
Table 3: Victimisation by population group of the household head, 2015/16 ............................................. 14
Table 4: Victimisation by province of the household, 2011 and 2015/16 .................................................... 15
Table 5: Multiple victimisation, 2015/16 ...................................................................................................... 18
Table 6: Repeated victimisation, 2015/16 .................................................................................................... 18
Table 7: Intensity of housebreaking during different times of the year ....................................................... 19
Table 8: Incidence of home robbery during different times of the year ...................................................... 20
Table 9: Incidents of housebreaking and home robbery during different periods of the day ...................... 21
Table 10: Household items stolen during housebreaking and home robbery .............................................. 23
Table 11: Incidents of housebreaking and home robbery experienced, reported; perpetrators arrested and
convicted; and cases ongoing .............................................................................................................. 25
Table 12: Model estimates of predictors of satisfaction with police ............................................................ 28
Table 13: Number of crime incidents during different periods of the day ................................................... 30
Table 14: Reasons households do not report crime to the police ................................................................ 31
Table 15: Chi-squared tests of independence between housebreaking and predictors .............................. 33
Table 16: Levels of the variables used in the regression model ................................................................... 33
Table 17: Parameter estimates for the logistic regression model of housebreaking ................................... 34
Table 18: Wald tests of significance of the estimated regression parameters ............................................. 35
Table 19: Chi-squared tests of independence between home robbery and predictors ............................... 35
Table 20: Parameter estimates for the logistic regression model of home robbery .................................... 36
Table 21: Wald tests of significance of regression parameters – home robbery .......................................... 37
Table 22: Chi-squared tests of independence between housebreaking reporting and predictors .............. 37
Table 23: Parameter estimates for the logistic regression model of housebreaking reporting ................... 38
Table 24: Wald tests of significance of regression parameters – household reporting ................................ 39
Table 25: Chi-squared tests of independence between home robbery reporting and predictors ............... 39
Table 26: Parameter estimates of the logistic regression model for home robbery reporting .................... 39
Table 27: Wald tests of significance of the regression parameters – home robbery reporting ................... 40
Table 28: Comparison of VOCS estimates of reported cases with SAPS reported cases, 2015/16 ............... 44
Table 29: SAPS reported burglaries vs VOCS estimates of incidents reported to police for 2015/16 .......... 44
Table 30: SAPS reported home robberies vs VOCS estimates of incidents reported to the police for
2015/16 ............................................................................................................................................... 45
STATISTICS SOUTH AFRICA vi
Crime Statistics Series Volume I: Exploring the extent of and circumstances surrounding housebreaking/burglary and home robbery, 2015–2016
List of Figures
Figure 1: The chain of events in the criminal justice system ......................................................... 3
Figure 2: Proportion of households that experienced crime in the last 12 months by gender .... 10
Figure 3: Trends in household crimes during the period 2011 to 2015/16 .................................. 11
Figure 4: Perceptions of trends in violent crime by year .............................................................. 12
Figure 5: Feeling of safety walking alone during the day and in the dark, 2011–2015/16 .......... 13
Figure 6: Distribution of types of crime experienced by South African households, 2015/16 ..... 14
Figure 7: Victimisation of the household by province, 2015/16 ................................................... 16
Figure 8: Household crime victimisation rates by district, 2015/16 ............................................. 17
Figure 9: Intensity of housebreaking during different times of the year ....................................... 20
Figure 10: Incidence of home robbery during different times of the year ...................................... 21
Figure 11: The distribution of housebreaking and home robbery during different periods of the day in percentages ....................................................................................................... 22
Figure 12: Percentage of households that lost particular items stolen during housebreaking and home robbery................................................................................................................ 24
Figure 13: Percentage of housebreakings and home robberies at various stages of the justice system .......................................................................................................................... 25
Figure 14: Proportion arrested, not arrested and don’t know among reported housebreaking and home robbery cases ..................................................................................................... 26
Figure 15: Proportion convicted, not convicted, case ongoing and don’t know among those arrested for housebreaking and home robbery ............................................................ 27
Figure 16: Where households report housebreaking and robbery ................................................ 29
Figure 17: Other authorities where households report crime ........................................................ 30
Figure 18: Reasons households do not report crime to the police ................................................ 31
Figure 19: Total crime reported to South African Police Service, 2005–2016............................... 41
Figure 20: Total crime reported as percentage of the population, 2005–2016 .............................. 42
Figure 21: Per capita crime trends for housebreaking/burglary and home robbery, 2005–2016 .. 42
Figure 22: Percentage of households that reported burglary and home robbery to the police, 2010–2016 .................................................................................................................... 43
Figure 23: Number of burglaries reported vs total crime reported ................................................. 46
Figure 24: Number of households per police station vs number of burglaries reported ................ 46
STATISTICS SOUTH AFRICA vii
Crime Statistics Series Volume I: Exploring the extent of and circumstances surrounding housebreaking/burglary and home robbery, 2015–2016
Glossary of abbreviations
CAS Case Administration System
CSVR Centre for the Study of Violence and Reconciliation
DCS Department of Correctional Services
DME Department of Minerals and Energy
DoJ&CD Department of Justice and Constitutional Development
DPME Department of Performance Monitoring and Evaluation
DTS Domestic Tourism Survey
DU Dwelling unit
EA Enumeration area
EC Eastern Cape
FS Free State
GHS General Household Survey
GP Gauteng
JCPS Justice, Crime Prevention and Security
KZN KwaZulu-Natal
LP Limpopo
LSM Living Standard Measure
MDGs Millennium Development Goals
MP Mpumalanga
MS Master Sample
NC Northern Cape
NDP National Development Plan
NPA National Prosecuting Authority
NSA National Statistical Agency
NW North West
PSU Primary sampling unit
QLFS Quarterly Labour Force Survey
RSA Republic of South Africa
SA South Africa
SAPS South African Police Service
SASQAF South African Statistical Quality Assessment Framework
SG Statistician-General
Stats SA Statistics South Africa
UNODC United Nations Office on Drugs and Crime
VOCS Victims of Crime Survey
WC Western Cape
Statistics South Africa
Crime Statistics Series Volume I: Exploring the extent of and circumstances surrounding housebreaking/burglary and home robbery, 2015–2016
x
Concepts and definitions
Absolute measure of the extent of crime (Incidence): The number of crime events occurring during
a given time period (i.e. a year) within a specified population. For example, number of home robberies.
Assault: Attack, physical beating or threat to attack without taking anything from the victim.
Note: Includes domestic violence.
Home robbery: Unlawful and intentional forceful removal and appropriation of property from residential
premises while there is someone at home.
Housebreaking/burglary: Unlawful and intentional breaking into a building or any structure, used for
human habitation, and entering or penetrating it with part of the body or with an instrument, with the
intention to control something on the premises, intending to commit a crime on the premises, while there
is nobody in the dwelling.
Household: A group of persons who live together and provide themselves jointly with food and/or other
essentials for living, or a single person who lives alone.
Note: The persons occupy a common dwelling unit (or part of it) for at least four nights in a week on
average during the past four weeks prior to the survey interview, sharing resources as a unit. Other
explanatory phrases can be 'eating from the same pot' and 'cook and eat together'.
Household head: The main decision-maker, or the person who owns or rents the dwelling, or the
person who is the main breadwinner.
Individual crime: Crime affecting a single person rather than an entire household.
Living Standard Measure: A Living Standard Measure (LSM) groups people and households into ten
distinct groups based on criteria such as their level of urbanisation, and ownership of vehicles and major
electrical appliances. The measurement is classified from LSM 1 to LSM 10. For the purposes of this
report, these categories are combined as follows:
Low LSM: comprising LSM 1 to LSM 4
Intermediate LSM: comprising LSM 5 to LSM 7
High LSM: comprising LSM 8 to LSM 10.
Malicious damage to property: Unlawful and intentional damaging of property belonging to another.
Note: Excludes forced removals.
Multiple victimisation: Refers to a household or individual that experiences more than one incident of
different crime types within a specified reference period.
Perpetrator: Person(s) who committed the crime.
Personal property: Something belonging to an individual rather than a group of persons.
Physical force: Bodily power, strength, energy or might.
Note: In the context of this survey, physical force includes actions where the human body is used to
compel/force someone to do something or to hurt or kill someone. It can include actions such as pushing,
pressing, shoving, hitting, kicking, throttling, etc.
Statistics South Africa
Crime Statistics Series Volume I: Exploring the extent of and circumstances surrounding housebreaking/burglary and home robbery, 2015–2016
xi
Prevalence: The percentage or proportion of the specified population (of persons or households)
experiencing crime during a given time period.
Property crime: Unlawful taking of property from a person or household.
Repeat victimisation: Refers to when a household or individual experiences more than one incident of
the same type of crime within a specified reference period.
Robbery involving force: Refers to all crimes where a person's property was threatened but not his
person, such as theft of property, burglary, etc.
Theft: Stealing of property belonging to someone else while they are not aware.
Vandalism: Deliberate damage to property belonging to someone else.
Violent crime: Crime where a person was physically threatened, injured, or killed.
Weapon: An instrument used to cause harm or death to human beings or other living creatures.
Note: Includes knives, guns, pangas and knobkerries, metal or wooden bars/rods, broken glass, rocks,
bricks, etc.
Statistics South Africa
Crime Statistics Series Volume I: Exploring the extent of and circumstances surrounding housebreaking/burglary and home robbery, 2015–2016
1
1. Executive Summary
The general crime rate in terms of the proportion of households that experienced crime has been
declining during the last five years. All provinces except the Eastern Cape experienced a decline in the
proportion of households that were victims of crime between 2011 and 2016. This reality has, however,
not translated into positive perceptions about crime in the country. There has been a growing perception
that crime is on the increase. People, as represented by household heads from sampled dwellings, were
more afraid in 2015/16 to walk alone in the dark in their neighbourhoods than they were five years ago.
Over 50 per cent of all crimes experienced by households in South Africa in 2015/16 were
housebreaking. Home robbery was the second (11,9 per cent) most common type of crime experienced
by South African households. Whites had the highest rates of victimisation compared to other groups
both in 2011 and 2015/16. However, whites experienced the sharpest decline of household related
crimes during the five years, when considering the proportion of households that experienced crime.
Housebreaking and home robbery peaked during the months of March and June in both 2014/15 and
2015/16. The months where crime was least likely to occur were January, May and November. As
found in previous VOCSs, night-time is still the most preferred time for crime incidents.
Electrical equipment were the most targeted items during both housebreakings and home robberies.
Jewellery, money and cell phones were the second most common items stolen after electrical equipment
during both housebreaking and home robbery.
The reporting rate of home robberies to the police was significantly higher than that of housebreakings,
possibly because home robbery is a more serious crime. The conviction rate among those arrested was
14,3 per cent for housebreaking, and 22 per cent for home robbery. An arrest is made in only one out
of every five reported cases of housebreaking or home robbery. Only one in five people arrested for
housebreaking was convicted, and one in three people arrested for home robbery was convicted.
Households that did not secure the arrest of perpetrators after reporting the housebreaking to the police,
were more likely to be dissatisfied with the police compared to those where perpetrators were arrested.
There is no evidence that dissatisfaction with the police service caused people to report crime to other
authorities. Robberies tend to be reported more to the police than to other authorities.
Results from modelling show that gender, educational level, presence of community crime prevention
forums, distance to police stations and the response time of the police are significant predictors of
housebreaking. The absence of community crime prevention forums, long distances to police stations
and long police response times to emergency calls are all factors that increase the odds of
housebreaking. The implication of this finding is that the promotion of community crime prevention
forums, building more police stations closer to the people and improving police response times are some
of the interventions that could help reduce housebreaking.
A lack of expectation of police arriving when called during an emergency is associated with the highest
odds of home robbery, while shorter distances to a police station can be associated with smaller odds
of home robbery.
Race, education level and distance to the police station are the only significant predictors of the odds of
reporting housebreaking. The results show that the odds of a white-headed household reporting
housebreaking are significantly higher than those of a black African-headed household (black African
was the reference race in this analysis). Education level 3 (post-matric qualification but less than a
Statistics South Africa
Crime Statistics Series Volume I: Exploring the extent of and circumstances surrounding housebreaking/burglary and home robbery, 2015–2016
2
bachelor’s degree) also has significantly greater odds of reporting housebreaking compared to
households headed by persons without schooling. When the police station is more than two hours away,
the odds of not reporting housebreaking are high, and vice versa.
The same variables – race, education level and distance to police station – are significant predictors of
the odds of reporting home robbery. Non-existence of a community crime prevention forum is another
significant predictor of the odds of reporting home robbery to the police.
SAPS crime statistics show that total crime as a percentage of the population (per capita crime) has
been steadily decreasing since 2005. However, the rate is too slow. At this rate, the goal of eliminating
crime will be achieved in 2059 instead of in 2030, as envisaged by the National Development Plan (NDP
2030). VOCS national crime estimates are different from the crime data produced by the SAPS. At
provincial level, however, there is agreement between the two sources of data for most of the provinces.
Statistics South Africa
Crime Statistics Series Volume I: Exploring the extent of and circumstances surrounding housebreaking/burglary and home robbery, 2015–2016
3
2. Background
2.1 Legislative framework
South Africa has a comprehensive legislative framework in place to address challenges regarding crime
in the country. The Bill of Rights (section 12), under the chapter: Freedom and security of the person
provides that: “Everyone has the right to freedom and security of the person, which includes the right—
a) not to be deprived of freedom arbitrarily or without just cause;
b) not to be detained without trial;
c) to be free from all forms of violence from either public or private sources;
d) not to be tortured in any way; and
e) not to be treated or punished in a cruel, inhuman or degrading way.”
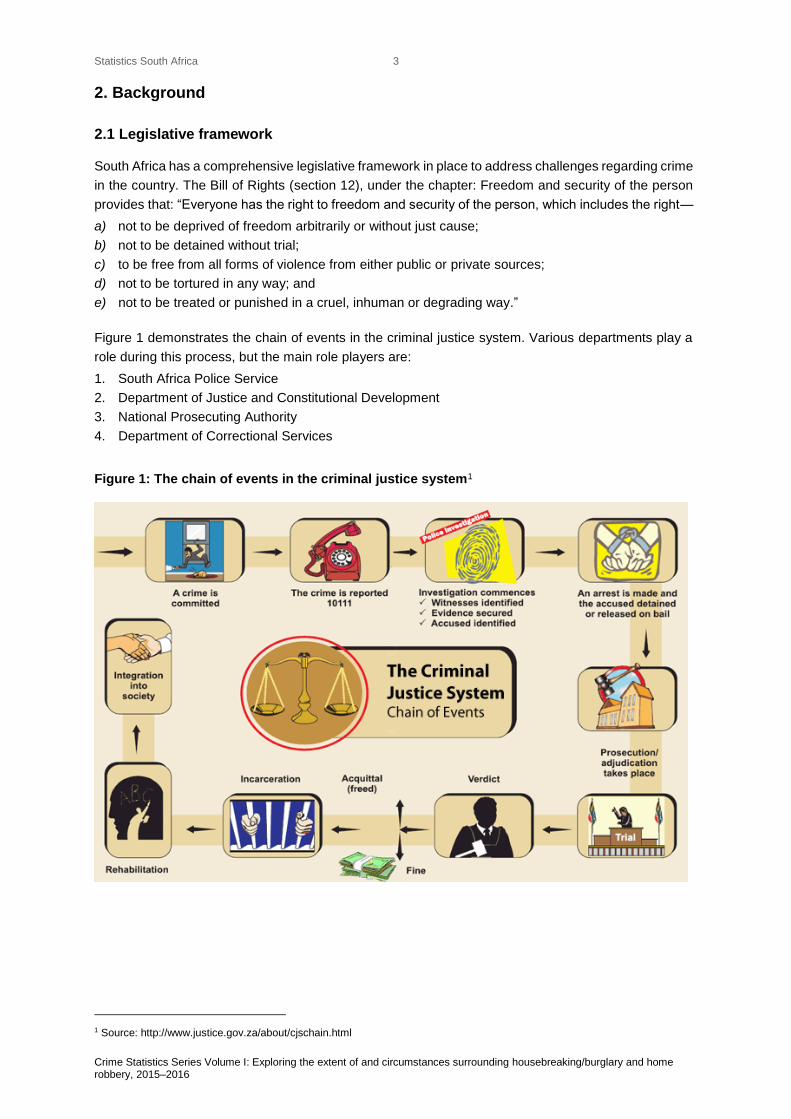
Figure 1 demonstrates the chain of events in the criminal justice system. Various departments play a
role during this process, but the main role players are:
1. South Africa Police Service
2. Department of Justice and Constitutional Development
3. National Prosecuting Authority
4. Department of Correctional Services
Figure 1: The chain of events in the criminal justice system1
1 Source: http://www.justice.gov.za/about/cjschain.html
Statistics South Africa
Crime Statistics Series Volume I: Exploring the extent of and circumstances surrounding housebreaking/burglary and home robbery, 2015–2016
4
Even though there are several government departments active in the safety and security cluster, the
primary agency responsible for law and order is the South African Police Service (SAPS). The
Constitution of the Republic of South Africa (1996) stipulates that “the South African Police Service has
a responsibility to prevent, combat and investigate crime, maintain public order, protect and secure the
inhabitants of the Republic and their property, uphold and enforce the law, create a safe and secure
environment for all people in South Africa, prevent anything that may threaten the safety or security of
any community, investigate any crimes that threaten the safety or security of any community, ensure
criminals are brought to justice and participate in efforts to address the causes of crime.”2
The SAPS derives its mandate from section 205 of the Constitution, 1996 (Act No. 108 of 1996). The
objectives of policing are to:
prevent, combat and investigate crime;
maintain public order;
protect and secure the inhabitants of the Republic and their property; and
uphold and enforce the law.
Other departments that play a direct role in safety and security include the National Prosecution
Authority (NPA) whose primary role it is to prepare cases for prosecution on behalf of the state; the
Department of Justice and Constitutional Development (DoJ&CD) which is responsible for the
administration of justice through the court system; and the Department of Correctional Services (DCS)
which contributes to maintaining and promoting a safe society by correcting offending behaviour in a
safe, secure and humane environment.
A single NPA was created in section 179 of the Constitution of the Republic of South Africa, 1996 (Act
No. 108 of 1996), and it has the power to:
a) institute and conduct criminal proceedings on behalf of the state;
b) carry out any necessary functions incidental to instituting and conducting such criminal
proceedings (this includes investigation); and
c) discontinue criminal proceedings.
The DoJ&CD administers the justice function through a tiered court system, which includes the
Constitutional Court; the Supreme Court of Appeal in Bloemfontein; the High Courts with fourteen
provincial divisions; Circuit Courts which are also part of the High Court; Special Income Tax Courts
which sit within provincial divisions of the High Court; Labour Courts and Labour Appeal Courts; the
Land Claims Court; the Water Tribunal; the Magistrates’ Courts which deal with the less serious criminal
and civil cases; the Small Claims Courts; the Community Courts; Equality Courts; Child Justice Courts
and Maintenance Courts; Sexual Offences Courts; Children’s Courts; and Courts for Chiefs and
Headmen. The latter have jurisdiction to hear certain matters at the level of magistrate’s courts, and
primarily deal with issues related to customary law.
Finally, the vision of the Department of Correctional Services (DCS) is to ‘contribute to a just, peaceful
and safer South Africa through effective and humane incarceration of inmates, rehabilitation and social
reintegration of offenders’.3 The DCS has three strategic goals:
Goal 1: Effective criminal justice through the effective management of remand processes;
Goal 2: Society is protected through incarcerated offenders being secure and rehabilitated; and
Goal 3: Society is protected by offenders being reintegrated into the community as law-abiding
citizens.
2Statutes of the Republic of South Africa – Constitutional Law Constitution of the Republic of South Africa Act, No. 108 of 1996, section 205, No. 3 3 Source: http://www.dcs.gov.za/AboutUs/OurMission.aspx
Statistics South Africa
Crime Statistics Series Volume I: Exploring the extent of and circumstances surrounding housebreaking/burglary and home robbery, 2015–2016
5
2.2 National Development Plan
The government has recognised the need for intervention; and safety and security has been identified
as one of the strategic priorities of the government in both the National Development Plan 2030 and
the Medium Term Strategic Framework. In its introduction, the National Development Plan (NDP) 2030
highlights that safety is a core human right and a necessary condition for human development and
improving productivity. The NDP therefore proposes, as one of its strategic priorities, that crime be
reduced through strengthening the criminal justice system and improving community environments. It
is further stated in the plan that by 2030, “people living in South Africa should have no fear of crime.
Women, children and those who are vulnerable should feel protected”.
2.3 Medium Term Strategic Framework and the Criminal Justice System
One of the goals of the Medium Term Strategic Framework (MTSF 2014–2019) is that “All People in
South Africa are Safe and Feel Safe”.
As part of this process, the Justice and Crime Prevention and Security (JCPS) cluster, in partnership
with the Department of Planning, Monitoring and Evaluation (DPME), have developed an outcomes-
based monitoring and evaluation framework for the priorities as contained in the Medium Term Strategic
Framework for the period 2014 to 2019. For the priority, “Intensify the fight against crime and
corruption”, a broad outcome for the JCPS was developed, namely “Ensure that all South Africans are
and feel safe”4. Among other things, the strategy focuses on:
Mobilising the population in the fight against crime;
Accelerating efforts to reduce all serious crimes (SAPS 2014–19 Strategic Plan to reduce crime by
2 per cent per annum);
Intensifying efforts to combat crimes against women and children and the promotion of the
empowerment of victims of crime; and
Combating corruption in the public and private sectors.
2.4 The Statistics Act
The purpose of the 1999 Statistics Act is to advance the planning, production, analysis, documentation,
storage, dissemination and use of official and other statistics. Section 14 of the Act gives the
Statistician-General the power of statistical coordination among organs of state:
(6) The Statistician-General may advise any organ of state regarding the application of appropriate
quality criteria and standards, classifications and procedures for statistics—
(a) to improve the quality of statistics;
(b) to enhance the comparability of statistics;
(c) to minimise unnecessary overlapping or duplication with the collection or publication of
statistics in that organ of state or by other organs of state.
(7) (a) The Statistician-General may designate as official statistics any statistics or class of statistics
produced from statistical collections by—
(i) Statistics South Africa; or
(ii) other organs of state, after consultation with the head of the organ of state concerned.
4 Source: http://www.saps.gov.za/saps_profile/strategic_framework/strategic_plan/2010_2014/strategic_plan_2010_2014_2.pdf
Statistics South Africa
Crime Statistics Series Volume I: Exploring the extent of and circumstances surrounding housebreaking/burglary and home robbery, 2015–2016
6
3. Introduction
The threat of crime creates a climate of fear and anxiety in society and often affects people in the way
they conduct their lives. South Africans from all walks of life are concerned about their personal safety
in spite of the guarantees of the Constitution (Act No. 108 of 1996) that everyone should be protected
from all forms of violence, whether from public or private origin.
Incidents of violence emerge from the interaction of different factors, such as family history, social
context, environmental factors and economic factors. Comprehensive statistics on patterns of crime
and victimisation are essential for effective strategies and interventions against crime. During the past
two decades, a number of studies have been done to provide insight into the nature and the level of
crime in the country, including several victimisation surveys related to crime, crime victims and users
of services. Furthermore, government departments in the safety and security cluster collect crime
related data in accordance with their respective mandates. Administrative data collected by the South
African Police Service (SAPS) remain one of the main sources of crime statistics. However, some
crimes go unreported, and for this reason the police crime statistics cannot produce an accurate count
of total crime. The Victims of Crime Survey (VOCS) is therefore an essential additional source of crime
data that complements the SAPS administrative data.
In addition to direct measures to improve safety and security, the government’s social development
programme may also indirectly impact on the levels of crime. For example, one of the primary
commitments made by the government is the provision of, and improved access to, permanent housing
that provides secure tenure and protection against elements as described in the Housing Act, 1997 (Act
No. 107 of 1997). The General Household Survey (GHS) (2015) found that there has been an
improvement in the nature of dwellings in which people live and their access to various basic services
and facilities, and a significant increase in the number of individuals and households who benefit from
social grants. All of these provide an important indication of the well-being of households. Even though
it is debatable whether poor living conditions lead to crime, shelter satisfies a basic human need for
physical security and comfort. Quality of life is affected by the levels of crime, and the fear of crime has
an impact on people’s well-being.
3.1 Objectives
This report is the fourth in a series of Victims of Crime Survey (VOCS) thematic reports aimed at
providing an in-depth understanding of victimisation phenomena. This report primarily focuses on
housebreaking/burglary and home robbery. The main objective of this study is to determine household
factors that may be used to predict incidents and reporting of housebreaking/burglary and home robbery
in South Africa. More specific questions that were addressed include:
1. What are the trends of crime in South Africa during the last five years?
2. What are the trends related to feelings of safety among households in South Africa during the last
five years?
3. What was the status of housebreaking/burglary and home robbery in South Africa in 2015/16?
4. Are there specific household characteristics that may be associated with high odds of being victims
of housebreaking and home robbery?
5. Are there specific household characteristics that may be associated with high odds of reporting
crime to the police?
Victimisation surveys aim to provide information about the dynamics of crime from the perspective of
households and the victims of crime. The results complement administrative data collected by the SAPS,
who releases figures of crime that were reported to them, as well as crime that they detected.
Statistics South Africa
Crime Statistics Series Volume I: Exploring the extent of and circumstances surrounding housebreaking/burglary and home robbery, 2015–2016
7
Victimisation surveys and police administrative crime data provide complementary information on the
crime situation in South Africa. The results of this report could be used for the development of policies
and strategies, as well as crime prevention and public education programmes.
3.2 Methodology
This study used the Victims of Crime Survey (VOCS) data series (2011–2015/16) as indicated in the
objectives. The sample design for the VOCS 2015/16 was based on a Master Sample (MS) originally
designed for the Quarterly Labour Force Survey (QLFS) as a sampling frame. The MS is based on
information collected during the 2011 Population Census conducted by Stats SA. The MS has been
developed as a general-purpose household survey frame that can be used by all household-based
surveys, irrespective of the sample size requirement of the survey. The VOCS 2015/16, like all other
household-based surveys, uses an MS of primary sampling units (PSUs), which comprises census
enumeration areas (EAs) that are drawn from across the country.
The sample for the VOCS 2015/16 used a stratified two-stage design with Probability Proportional to
Size (PPS) sampling of PSUs in the first stage, and sampling of dwelling units (DUs) with systematic
sampling in the second stage. The sample was designed to be representative at provincial level. A self-
weighting design at provincial level was used, and MS stratification was divided into two levels. Primary
stratification was defined by metropolitan and non-metropolitan geographic area type. During secondary
stratification, the Census 2011 data were summarised at PSU level. The following variables were used
for secondary stratification: household size, education, occupancy status, gender, industry, and income.
A Randomised Probability Proportional to Size (RPPS) systematic sample of PSUs was drawn in each
stratum, with the measure of size being the number of households in the PSU. A sample size of 3 080
PSUs was selected. In each selected PSU, a systematic sample of dwelling units was drawn. The
number of DUs selected per PSU varies from PSU to PSU and depends on the inverse sampling ratios
(ISR) of each PSU. The sample size for the VOCS 2015/16 is approximately 30 000 dwelling units.
A questionnaire with a standardised set of questions was used for data collection. The questionnaire
was administered using face-to-face interviews by trained survey officers. The VOCS 2015/16
interviews were conducted from April 2015 to March 2016. The VOCS 2015/16 sample was weighted
using population estimates for mid-November 2011. The final weights were benchmarked to the known
population estimates of 5-year age groups by population group and gender at national level, and broad
age groups at provincial level. The VOCS had an additional selection process where one person, aged
16 years or older, was randomly sampled in each household to complete sections on the individual’s
experience of crime. The individual weights were benchmarked to an estimated national population of
persons aged 16 and older as of mid-November 2011. The final survey weights were used to obtain
the estimates for various domains of interest at household level; for example, the victimisation level in
South Africa and perceptions about crime levels in the country. More details related to the sampling
and fieldwork methodology can be found in the VOCS 2015/16 metadata.
3.3 Data analysis
The open source statistical analysis program R was used for statistical analysis, and Microsoft Excel
was used for data management. Missing and unknown values were excluded from all calculations unless
otherwise specified. In addition to basic descriptive statistics, Chi-squared tests were used for the
selection of predictor variables following the Hosmer and Lemeshow procedure. Selected variables were
fitted to a logistic regression model to determine variables that were significant in predicting crime
incidents and crime reporting.
Statistics South Africa
Crime Statistics Series Volume I: Exploring the extent of and circumstances surrounding housebreaking/burglary and home robbery, 2015–2016
8
3.4 Limitations of the study
Victimisation surveys are likely to produce higher crime estimates than police-recorded administrative
data. This is due to the fact that many crimes are not reported to the police. Victim surveys deal with
incidents which may not necessarily match the legal definitions of crime. Although data from crime victim
surveys are likely to elicit better disclosure of criminal incidents than data from police records, they can
also be subject to undercounting, as some victims may be reluctant to disclose information, particularly
for incidents of a sensitive nature, such as sexual assault. The accuracy of statistics in victimisation
surveys is influenced by the ability of people to recall past victimisations. The longer the elapsed time
period, the less likely it is that an incident will be recalled accurately. Surveys are also subject to
sampling and non-sampling errors.
The sample size of 30 000 households is not large enough to produce estimates for rare events such
as murder or small domains such as Asian/Indian households that experienced home robbery. The
coefficients of variation for such estimates are typically too large for estimates to be of any use. Standard
errors, and in some cases, coefficients of variation, have been provided to assist the user to determine
the usefulness of the estimates.
3.5 Organisation of the report
This report has seven main sections. In Section 1, the general overview of the results is reported in this
study. Section 2 gives a general overview of the legal and institutional background that underpins the
study. The introduction to the study is given in Section 3. The objectives of the report, methodology,
data analysis method and limitations of the study are provided in Section 3. Section 4 outlines the
general findings based on descriptive statistics. The findings include aggregated crime statistics trends
during the last five years. Section 5 focuses on modelling housebreaking and home robbery to identify
predictors of crime incidents as well as predictors of reporting of crime. Analysis of SAPS data is reported
in Section 6, while Section 7 presents the conclusions and recommendations of the report.
Statistics South Africa
Crime Statistics Series Volume I: Exploring the extent of and circumstances surrounding housebreaking/burglary and home robbery, 2015–2016
9
4. General findings
Key objectives of this report are to provide a deeper understanding of housebreaking/burglary and home
robbery in South Africa by investigating household characteristics that are predictive of such crimes.
Although there may be similarities between home robberies and housebreakings/burglaries, the distinct
characteristic that differentiates the two types of crime is that there is contact between the victim and
the perpetrator during a home robbery, whereas there is no direct contact between the victim and
perpetrator during a housebreaking/burglary. Crimes that occur at residential premises, especially
housebreaking/burglary and home robbery, do violate basic human needs for physical security and
comfort. Unlawful entry into someone’s property, regardless of whether they are present or not, can be
traumatic to those affected and may also lead to individuals’ and households’ becoming victims of
multiple crimes.
This section focuses on the incidence of victimisation, including repeat and multiple victimisations. A
distinction should, however, be drawn between repeat victimisation and multiple victimisations. Repeat
victimisation refers to when a household experiences more than one incident of the same crime within
a specified reference period, while multiple victimisations refer to a household experiencing different
crime types once or more often within a specified reference period.
4.1 Trends in victimisation
We begin by reporting results on the national trends in victimisation according to the gender of the
household head. The results are estimates that combine all types of crime experienced by households
for the years 2011, 2013/14 and 2015/16 from VOCSs. The estimates of the proportions of
households that have experienced crime during the last 12 months, together with the standard errors,
are summarised in Table 1.
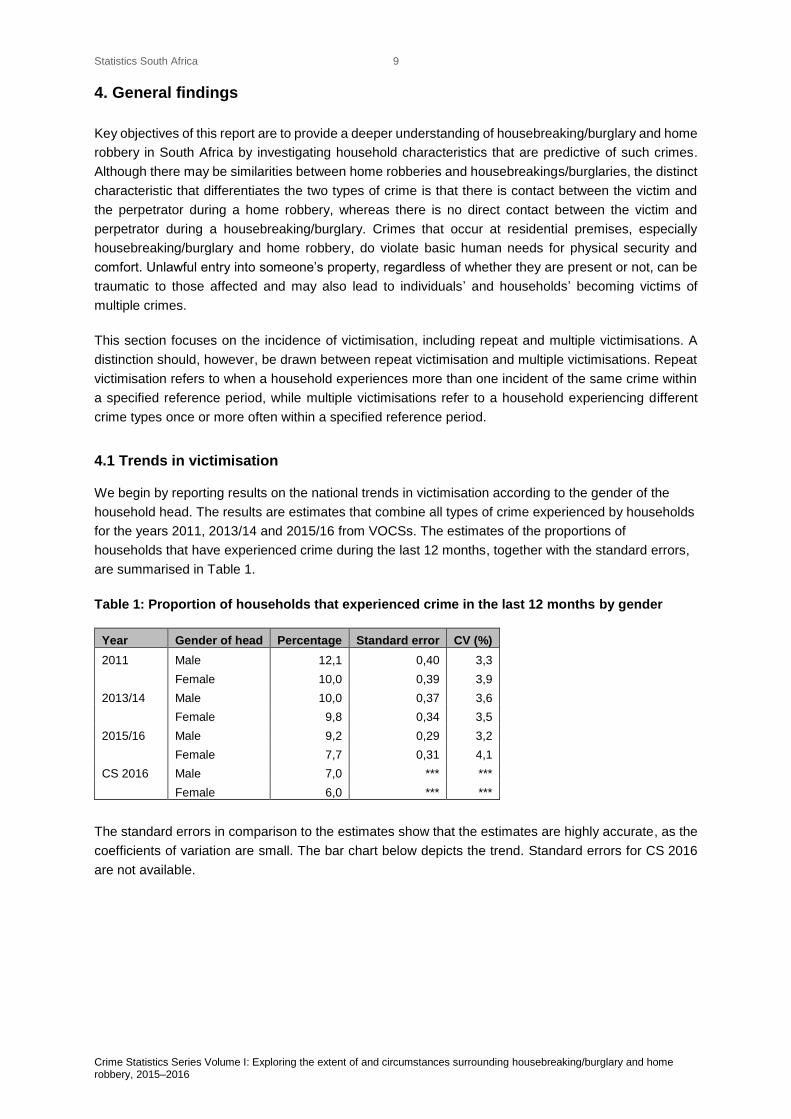
Table 1: Proportion of households that experienced crime in the last 12 months by gender
Year Gender of head Percentage Standard error CV (%)
2011 Male 12,1 0,40 3,3
Female 10,0 0,39 3,9
2013/14 Male 10,0 0,37 3,6
Female 9,8 0,34 3,5
2015/16 Male 9,2 0,29 3,2
Female 7,7 0,31 4,1
CS 2016 Male 7,0 *** ***
Female 6,0 *** ***
The standard errors in comparison to the estimates show that the estimates are highly accurate, as the
coefficients of variation are small. The bar chart below depicts the trend. Standard errors for CS 2016
are not available.
Statistics South Africa
Crime Statistics Series Volume I: Exploring the extent of and circumstances surrounding housebreaking/burglary and home robbery, 2015–2016
10
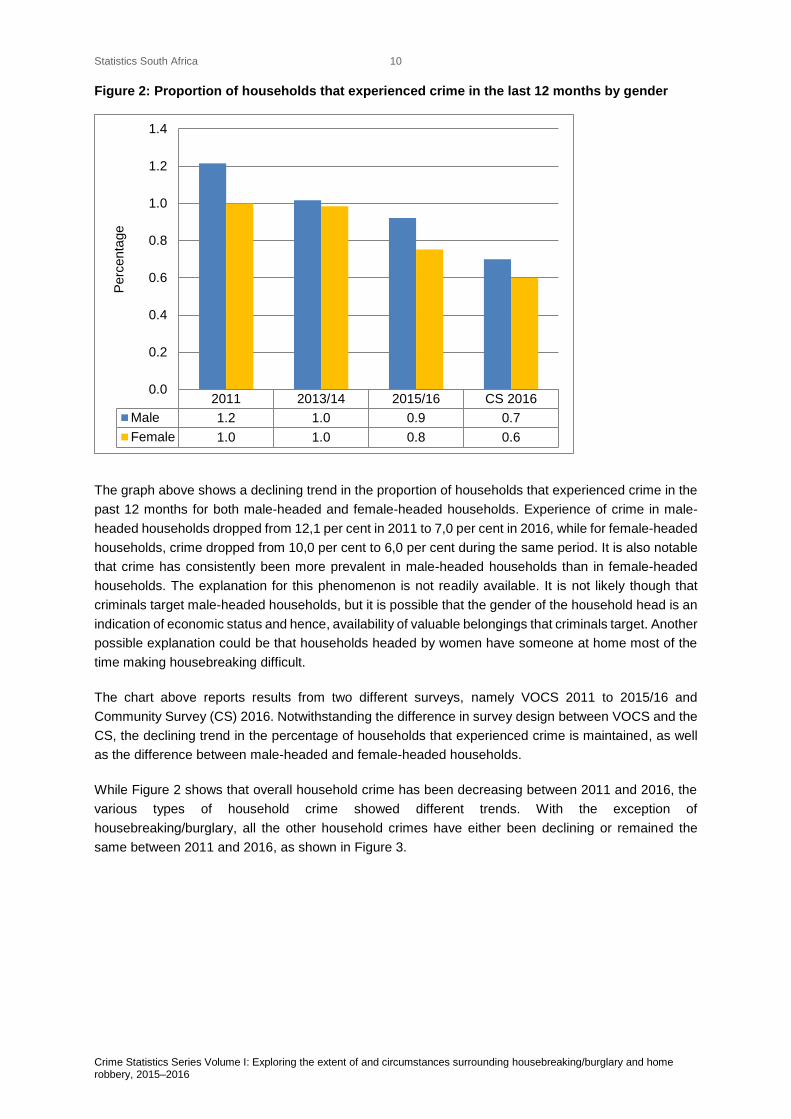
Figure 2: Proportion of households that experienced crime in the last 12 months by gender
The graph above shows a declining trend in the proportion of households that experienced crime in the
past 12 months for both male-headed and female-headed households. Experience of crime in male-
headed households dropped from 12,1 per cent in 2011 to 7,0 per cent in 2016, while for female-headed
households, crime dropped from 10,0 per cent to 6,0 per cent during the same period. It is also notable
that crime has consistently been more prevalent in male-headed households than in female-headed
households. The explanation for this phenomenon is not readily available. It is not likely though that
criminals target male-headed households, but it is possible that the gender of the household head is an
indication of economic status and hence, availability of valuable belongings that criminals target. Another
possible explanation could be that households headed by women have someone at home most of the
time making housebreaking difficult.
The chart above reports results from two different surveys, namely VOCS 2011 to 2015/16 and
Community Survey (CS) 2016. Notwithstanding the difference in survey design between VOCS and the
CS, the declining trend in the percentage of households that experienced crime is maintained, as well
as the difference between male-headed and female-headed households.
While Figure 2 shows that overall household crime has been decreasing between 2011 and 2016, the
various types of household crime showed different trends. With the exception of
housebreaking/burglary, all the other household crimes have either been declining or remained the
same between 2011 and 2016, as shown in Figure 3.
2011 2013/14 2015/16 CS 2016
Male 1.2 1.0 0.9 0.7
Female 1.0 1.0 0.8 0.6
0.0
0.2
0.4
0.6
0.8
1.0
1.2
1.4P
erc
enta
ge
Statistics South Africa
Crime Statistics Series Volume I: Exploring the extent of and circumstances surrounding housebreaking/burglary and home robbery, 2015–2016
11
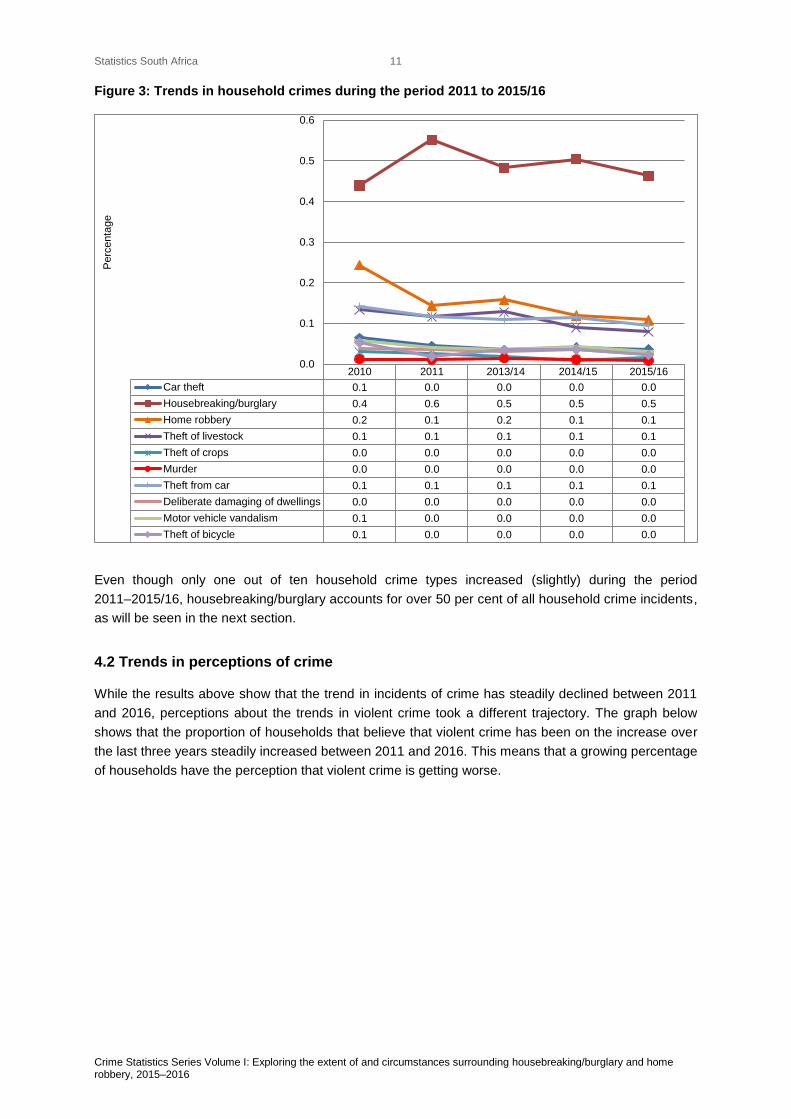
Figure 3: Trends in household crimes during the period 2011 to 2015/16
Even though only one out of ten household crime types increased (slightly) during the period
2011–2015/16, housebreaking/burglary accounts for over 50 per cent of all household crime incidents,
as will be seen in the next section.
4.2 Trends in perceptions of crime
While the results above show that the trend in incidents of crime has steadily declined between 2011
and 2016, perceptions about the trends in violent crime took a different trajectory. The graph below
shows that the proportion of households that believe that violent crime has been on the increase over
the last three years steadily increased between 2011 and 2016. This means that a growing percentage
of households have the perception that violent crime is getting worse.
2010 2011 2013/14 2014/15 2015/16
Car theft 0.1 0.0 0.0 0.0 0.0
Housebreaking/burglary 0.4 0.6 0.5 0.5 0.5
Home robbery 0.2 0.1 0.2 0.1 0.1
Theft of livestock 0.1 0.1 0.1 0.1 0.1
Theft of crops 0.0 0.0 0.0 0.0 0.0
Murder 0.0 0.0 0.0 0.0 0.0
Theft from car 0.1 0.1 0.1 0.1 0.1
Deliberate damaging of dwellings 0.0 0.0 0.0 0.0 0.0
Motor vehicle vandalism 0.1 0.0 0.0 0.0 0.0
Theft of bicycle 0.1 0.0 0.0 0.0 0.0
0.0
0.1
0.2
0.3
0.4
0.5
0.6
Perc
enta
ge
Statistics South Africa
Crime Statistics Series Volume I: Exploring the extent of and circumstances surrounding housebreaking/burglary and home robbery, 2015–2016
12
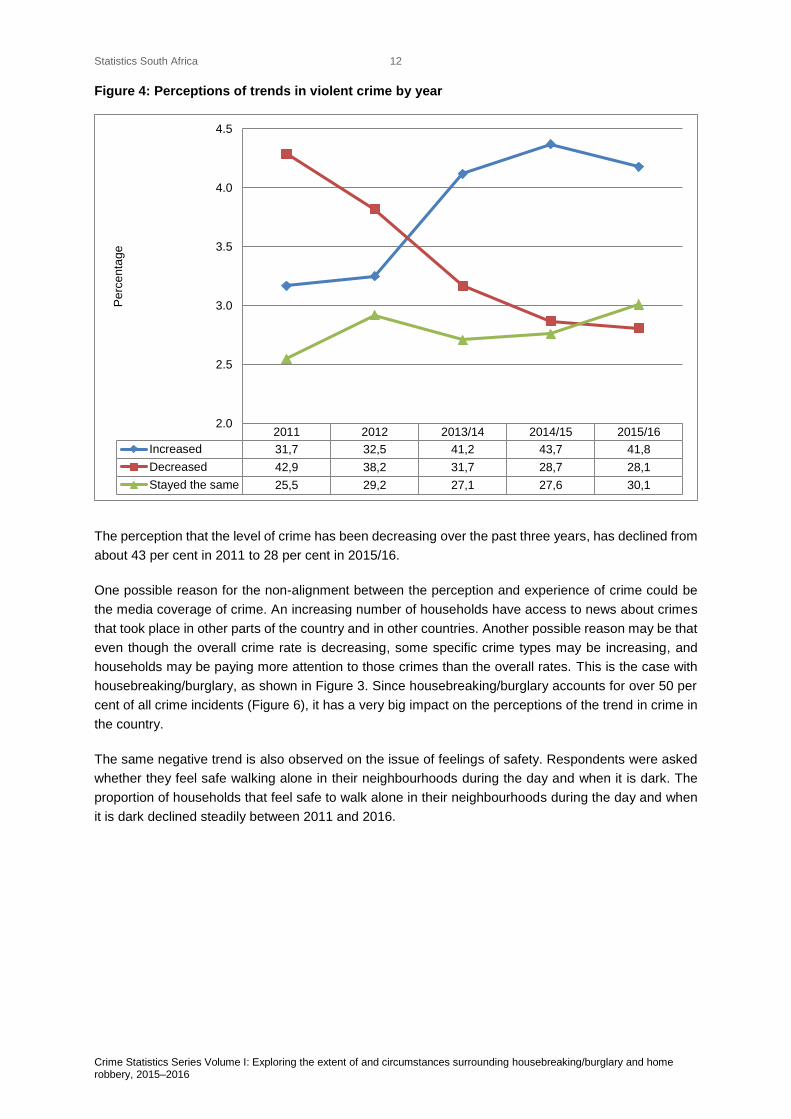
Figure 4: Perceptions of trends in violent crime by year
The perception that the level of crime has been decreasing over the past three years, has declined from
about 43 per cent in 2011 to 28 per cent in 2015/16.
One possible reason for the non-alignment between the perception and experience of crime could be
the media coverage of crime. An increasing number of households have access to news about crimes
that took place in other parts of the country and in other countries. Another possible reason may be that
even though the overall crime rate is decreasing, some specific crime types may be increasing, and
households may be paying more attention to those crimes than the overall rates. This is the case with
housebreaking/burglary, as shown in Figure 3. Since housebreaking/burglary accounts for over 50 per
cent of all crime incidents (Figure 6), it has a very big impact on the perceptions of the trend in crime in
the country.
The same negative trend is also observed on the issue of feelings of safety. Respondents were asked
whether they feel safe walking alone in their neighbourhoods during the day and when it is dark. The
proportion of households that feel safe to walk alone in their neighbourhoods during the day and when
it is dark declined steadily between 2011 and 2016.
2011 2012 2013/14 2014/15 2015/16
Increased 31,7 32,5 41,2 43,7 41,8
Decreased 42,9 38,2 31,7 28,7 28,1
Stayed the same 25,5 29,2 27,1 27,6 30,1
2.0
2.5
3.0
3.5
4.0
4.5P
erc
en
tag
e
Statistics South Africa
Crime Statistics Series Volume I: Exploring the extent of and circumstances surrounding housebreaking/burglary and home robbery, 2015–2016
13
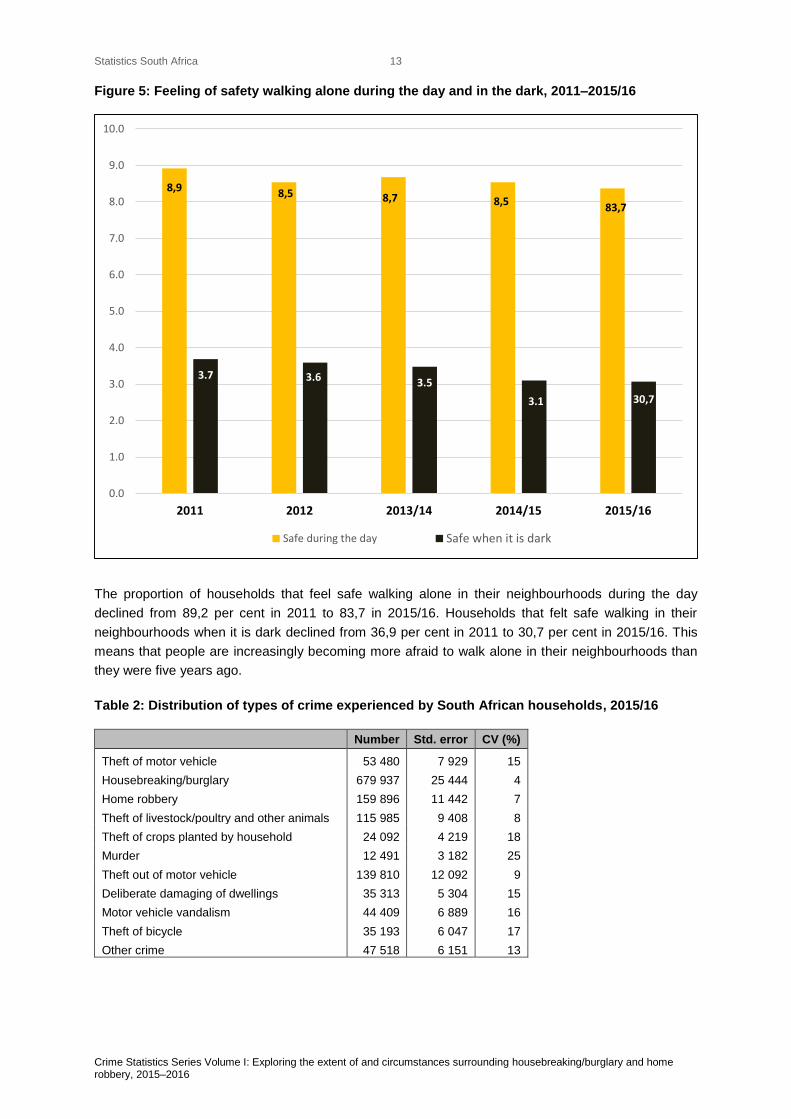
Figure 5: Feeling of safety walking alone during the day and in the dark, 2011–2015/16
The proportion of households that feel safe walking alone in their neighbourhoods during the day
declined from 89,2 per cent in 2011 to 83,7 in 2015/16. Households that felt safe walking in their
neighbourhoods when it is dark declined from 36,9 per cent in 2011 to 30,7 per cent in 2015/16. This
means that people are increasingly becoming more afraid to walk alone in their neighbourhoods than
they were five years ago.
Table 2: Distribution of types of crime experienced by South African households, 2015/16
Number Std. error CV (%)
Theft of motor vehicle 53 480 7 929 15
Housebreaking/burglary 679 937 25 444 4
Home robbery 159 896 11 442 7
Theft of livestock/poultry and other animals 115 985 9 408 8
Theft of crops planted by household 24 092 4 219 18
Murder 12 491 3 182 25
Theft out of motor vehicle 139 810 12 092 9
Deliberate damaging of dwellings 35 313 5 304 15
Motor vehicle vandalism 44 409 6 889 16
Theft of bicycle 35 193 6 047 17
Other crime 47 518 6 151 13
8,9 8,5 8,7 8,583,7
3.7 3.6 3.5
3.1 30,7
0.0
1.0
2.0
3.0
4.0
5.0
6.0
7.0
8.0
9.0
10.0
2011 2012 2013/14 2014/15 2015/16
Safe during the day Safe when it is dark
Statistics South Africa
Crime Statistics Series Volume I: Exploring the extent of and circumstances surrounding housebreaking/burglary and home robbery, 2015–2016
14
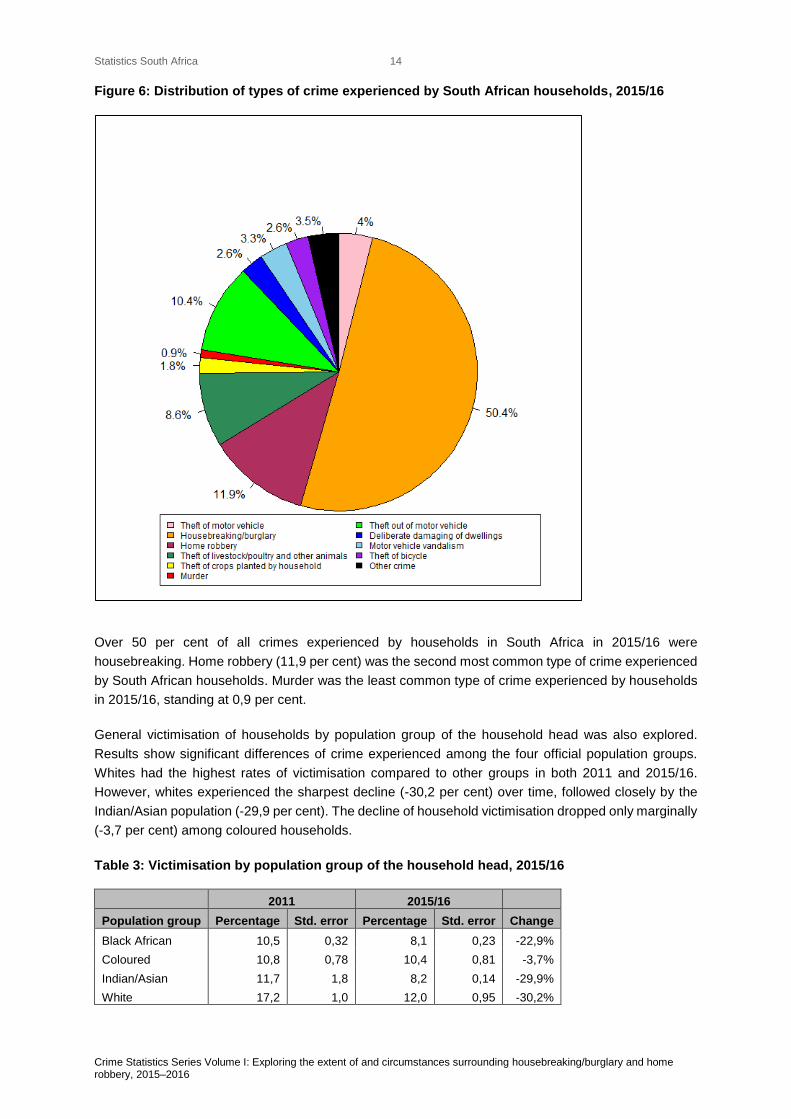
Figure 6: Distribution of types of crime experienced by South African households, 2015/16
Over 50 per cent of all crimes experienced by households in South Africa in 2015/16 were
housebreaking. Home robbery (11,9 per cent) was the second most common type of crime experienced
by South African households. Murder was the least common type of crime experienced by households
in 2015/16, standing at 0,9 per cent.
General victimisation of households by population group of the household head was also explored.
Results show significant differences of crime experienced among the four official population groups.
Whites had the highest rates of victimisation compared to other groups in both 2011 and 2015/16.
However, whites experienced the sharpest decline (-30,2 per cent) over time, followed closely by the
Indian/Asian population (-29,9 per cent). The decline of household victimisation dropped only marginally
(-3,7 per cent) among coloured households.
Table 3: Victimisation by population group of the household head, 2015/16
2011 2015/16
Population group Percentage Std. error Percentage Std. error Change
Black African 10,5 0,32 8,1 0,23 -22,9%
Coloured 10,8 0,78 10,4 0,81 -3,7%
Indian/Asian 11,7 1,8 8,2 0,14 -29,9%
White 17,2 1,0 12,0 0,95 -30,2%
Statistics South Africa
Crime Statistics Series Volume I: Exploring the extent of and circumstances surrounding housebreaking/burglary and home robbery, 2015–2016
15
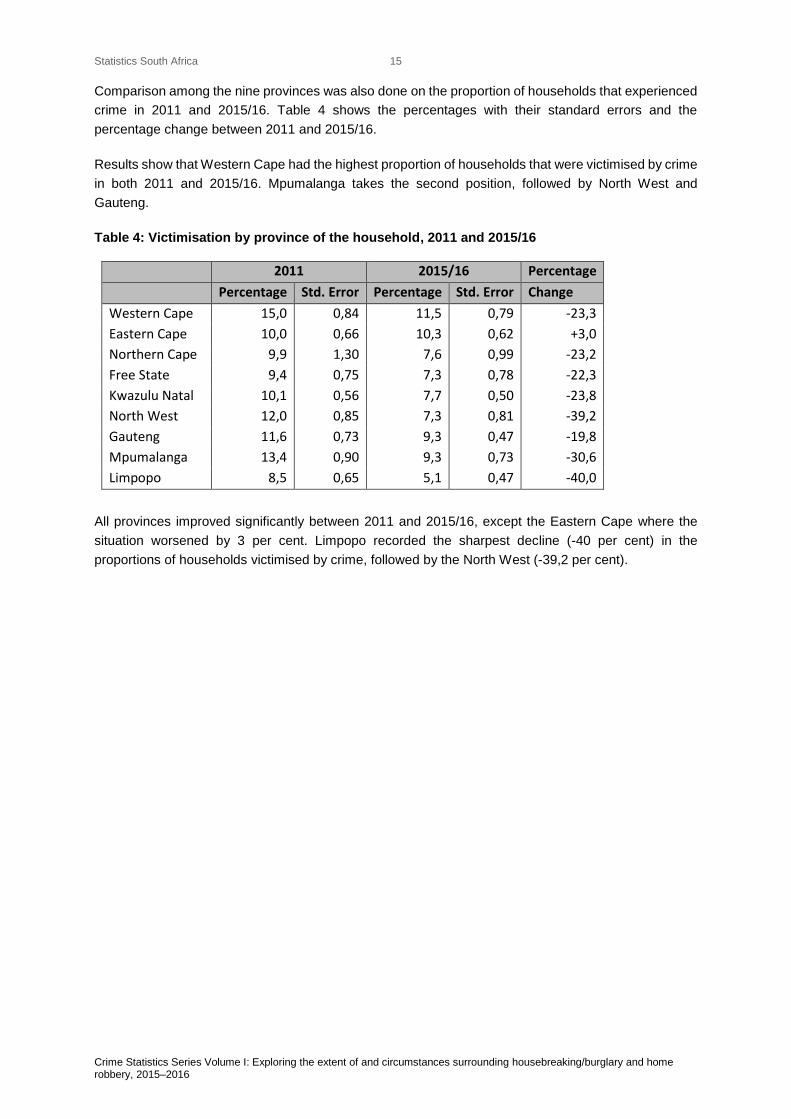
Comparison among the nine provinces was also done on the proportion of households that experienced
crime in 2011 and 2015/16. Table 4 shows the percentages with their standard errors and the
percentage change between 2011 and 2015/16.
Results show that Western Cape had the highest proportion of households that were victimised by crime
in both 2011 and 2015/16. Mpumalanga takes the second position, followed by North West and
Gauteng.
Table 4: Victimisation by province of the household, 2011 and 2015/16
2011 2015/16 Percentage
Percentage Std. Error Percentage Std. Error Change
Western Cape 15,0 0,84 11,5 0,79 -23,3
Eastern Cape 10,0 0,66 10,3 0,62 +3,0
Northern Cape 9,9 1,30 7,6 0,99 -23,2
Free State 9,4 0,75 7,3 0,78 -22,3
Kwazulu Natal 10,1 0,56 7,7 0,50 -23,8
North West 12,0 0,85 7,3 0,81 -39,2
Gauteng 11,6 0,73 9,3 0,47 -19,8
Mpumalanga 13,4 0,90 9,3 0,73 -30,6
Limpopo 8,5 0,65 5,1 0,47 -40,0
All provinces improved significantly between 2011 and 2015/16, except the Eastern Cape where the
situation worsened by 3 per cent. Limpopo recorded the sharpest decline (-40 per cent) in the
proportions of households victimised by crime, followed by the North West (-39,2 per cent).
Statistics South Africa
Crime Statistics Series Volume I: Exploring the extent of and circumstances surrounding housebreaking/burglary and home robbery, 2015–2016
16
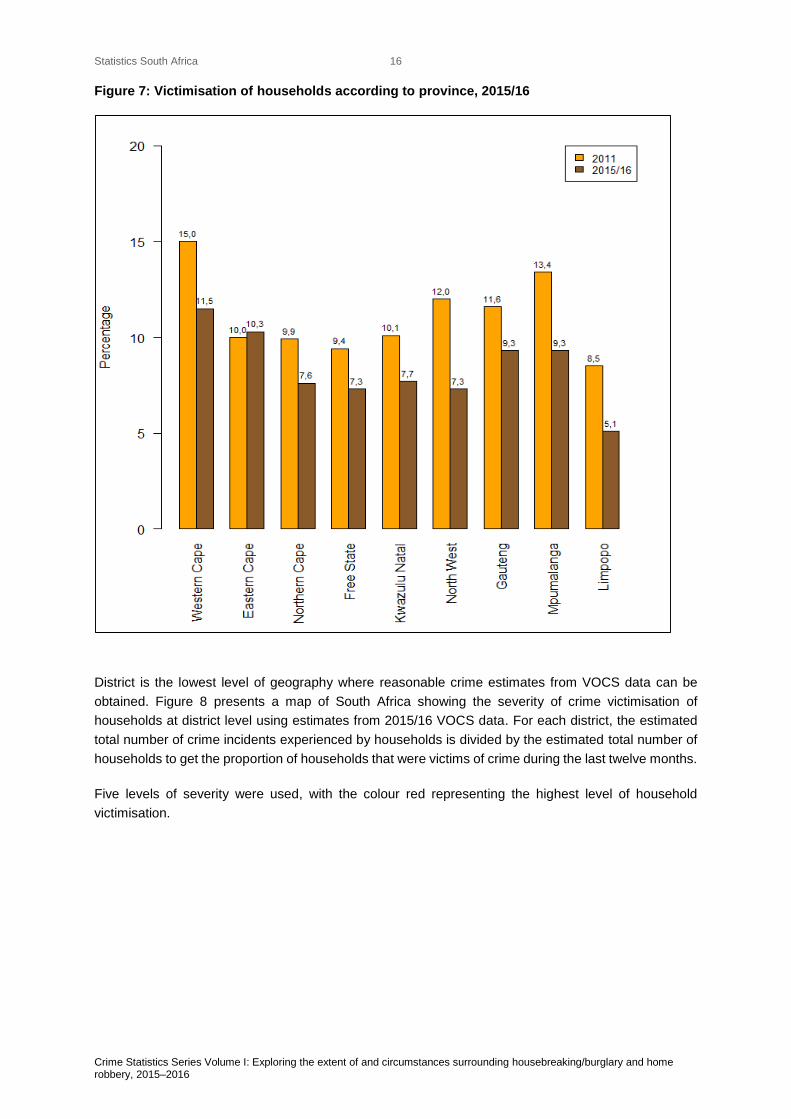
Figure 7: Victimisation of households according to province, 2015/16
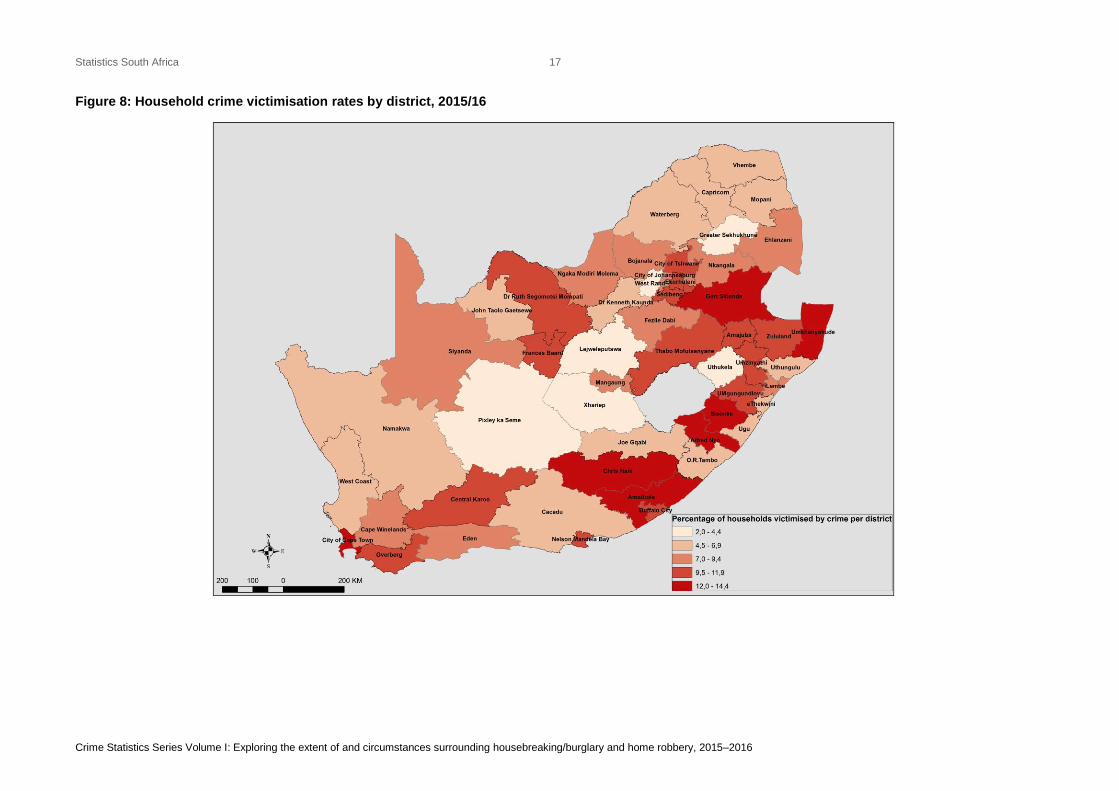
District is the lowest level of geography where reasonable crime estimates from VOCS data can be
obtained. Figure 8 presents a map of South Africa showing the severity of crime victimisation of
households at district level using estimates from 2015/16 VOCS data. For each district, the estimated
total number of crime incidents experienced by households is divided by the estimated total number of
households to get the proportion of households that were victims of crime during the last twelve months.
Five levels of severity were used, with the colour red representing the highest level of household
victimisation.
Statistics South Africa
Crime Statistics Series Volume I: Exploring the extent of and circumstances surrounding housebreaking/burglary and home robbery, 2015–2016
17
Figure 8: Household crime victimisation rates by district, 2015/16
Statistics South Africa
Crime Statistics Series Volume I: Exploring the extent of and circumstances surrounding housebreaking/burglary and home robbery, 2015–2016
18
Estimates for Cape Winelands, Central Karoo, Greater Sekhukhune, John Taolo Gaetsewe, Namakwa,
Ngaka Modiri Molema, Overberg, Pixley ka Seme, Ugu, West Coast and Xhariep must be used with
care, because in each case the error of estimation is very high (coefficient of variation over 30 per cent
– see Appendix 1).
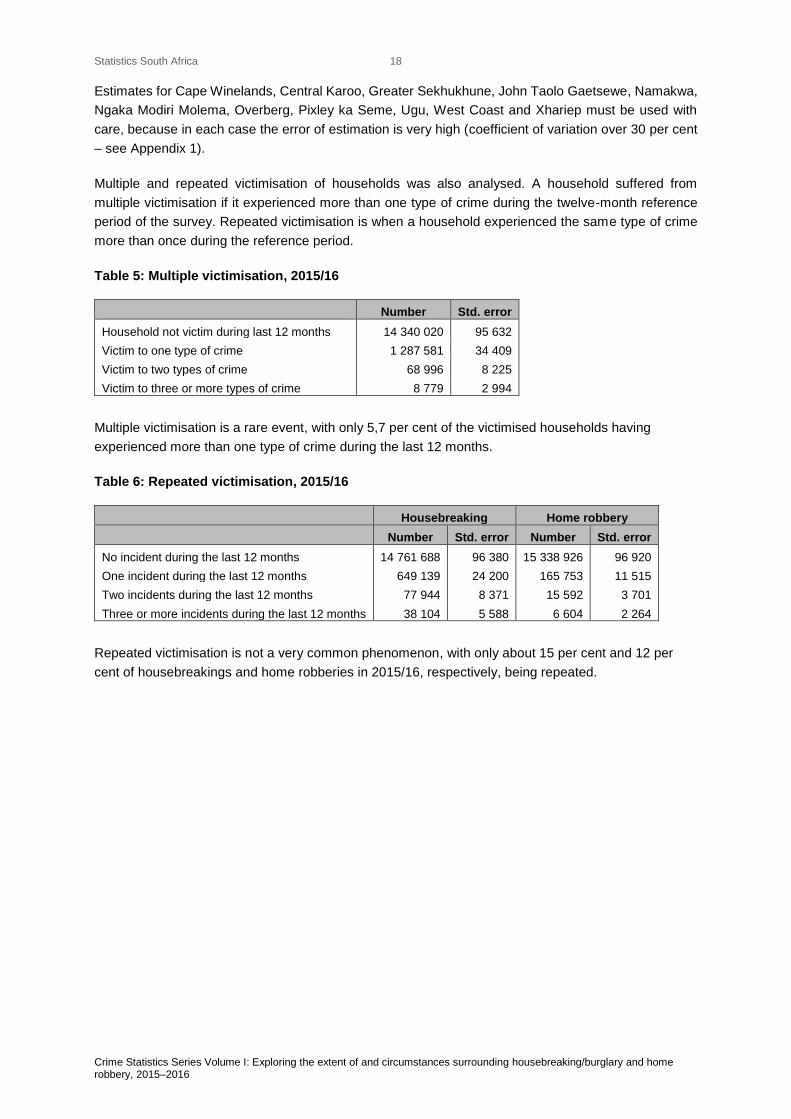
Multiple and repeated victimisation of households was also analysed. A household suffered from
multiple victimisation if it experienced more than one type of crime during the twelve-month reference
period of the survey. Repeated victimisation is when a household experienced the same type of crime
more than once during the reference period.
Table 5: Multiple victimisation, 2015/16
Number Std. error
Household not victim during last 12 months 14 340 020 95 632
Victim to one type of crime 1 287 581 34 409
Victim to two types of crime 68 996 8 225
Victim to three or more types of crime 8 779 2 994
Multiple victimisation is a rare event, with only 5,7 per cent of the victimised households having
experienced more than one type of crime during the last 12 months.
Table 6: Repeated victimisation, 2015/16
Housebreaking Home robbery
Number Std. error Number Std. error
No incident during the last 12 months 14 761 688 96 380 15 338 926 96 920
One incident during the last 12 months 649 139 24 200 165 753 11 515
Two incidents during the last 12 months 77 944 8 371 15 592 3 701
Three or more incidents during the last 12 months 38 104 5 588 6 604 2 264
Repeated victimisation is not a very common phenomenon, with only about 15 per cent and 12 per
cent of housebreakings and home robberies in 2015/16, respectively, being repeated.
Statistics South Africa
Crime Statistics Series Volume I: Exploring the extent of and circumstances surrounding housebreaking/burglary and home robbery, 2015–2016
19
5. Findings on housebreaking and home robbery
The report now focuses on two types of crime, namely housebreaking or burglary, and home robbery.
The intention is to extract all useful information on the circumstances around these crimes with the
purpose of assisting households and crime enforcement agents in their quest to fight crime.
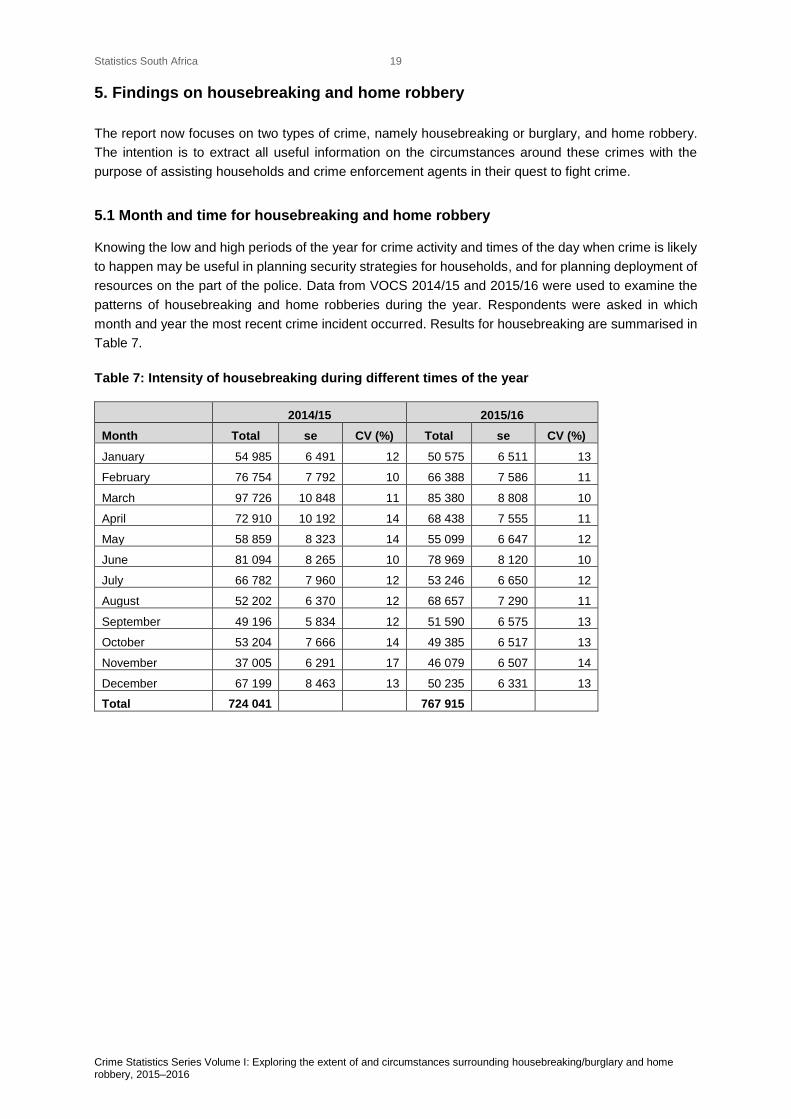
5.1 Month and time for housebreaking and home robbery
Knowing the low and high periods of the year for crime activity and times of the day when crime is likely
to happen may be useful in planning security strategies for households, and for planning deployment of
resources on the part of the police. Data from VOCS 2014/15 and 2015/16 were used to examine the
patterns of housebreaking and home robberies during the year. Respondents were asked in which
month and year the most recent crime incident occurred. Results for housebreaking are summarised in
Table 7.
Table 7: Intensity of housebreaking during different times of the year
2014/15 2015/16
Month Total se CV (%) Total se CV (%)
January 54 985 6 491 12 50 575 6 511 13
February 76 754 7 792 10 66 388 7 586 11
March 97 726 10 848 11 85 380 8 808 10
April 72 910 10 192 14 68 438 7 555 11
May 58 859 8 323 14 55 099 6 647 12
June 81 094 8 265 10 78 969 8 120 10
July 66 782 7 960 12 53 246 6 650 12
August 52 202 6 370 12 68 657 7 290 11
September 49 196 5 834 12 51 590 6 575 13
October 53 204 7 666 14 49 385 6 517 13
November 37 005 6 291 17 46 079 6 507 14
December 67 199 8 463 13 50 235 6 331 13
Total 724 041 767 915
Statistics South Africa
Crime Statistics Series Volume I: Exploring the extent of and circumstances surrounding housebreaking/burglary and home robbery, 2015–2016
20
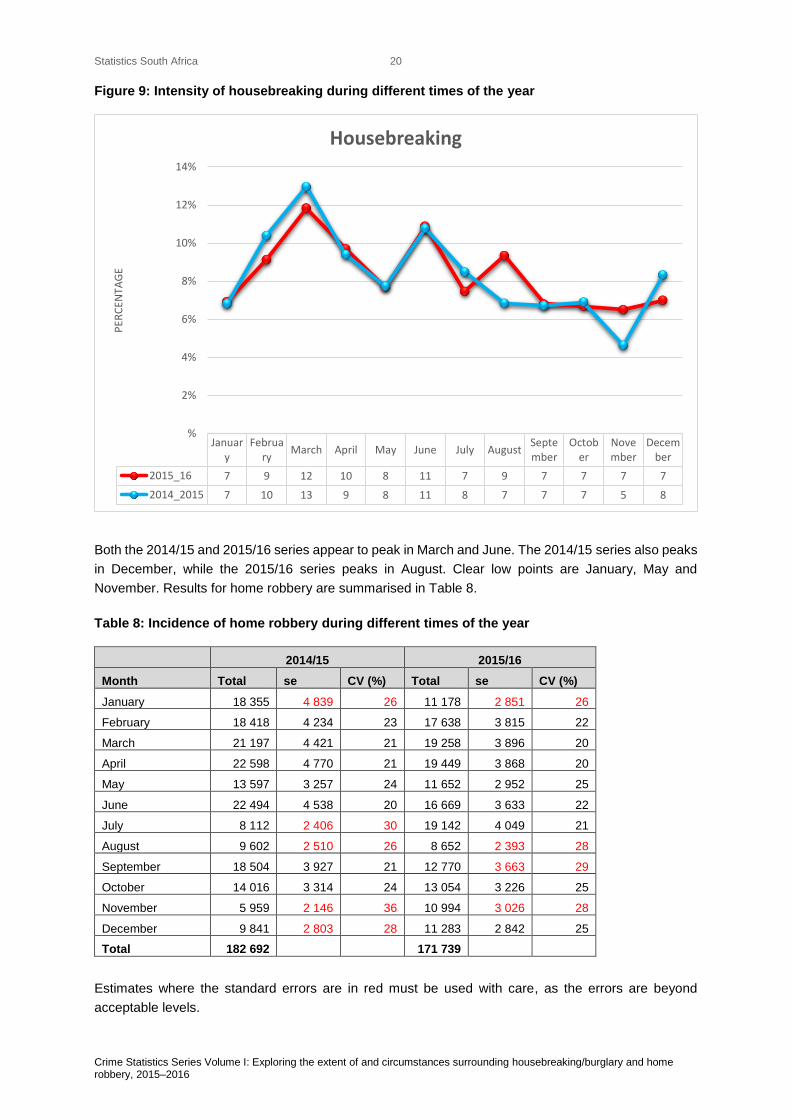
Figure 9: Intensity of housebreaking during different times of the year
Both the 2014/15 and 2015/16 series appear to peak in March and June. The 2014/15 series also peaks
in December, while the 2015/16 series peaks in August. Clear low points are January, May and
November. Results for home robbery are summarised in Table 8.
Table 8: Incidence of home robbery during different times of the year
2014/15 2015/16
Month Total se CV (%) Total se CV (%)
January 18 355 4 839 26 11 178 2 851 26
February 18 418 4 234 23 17 638 3 815 22
March 21 197 4 421 21 19 258 3 896 20
April 22 598 4 770 21 19 449 3 868 20
May 13 597 3 257 24 11 652 2 952 25
June 22 494 4 538 20 16 669 3 633 22
July 8 112 2 406 30 19 142 4 049 21
August 9 602 2 510 26 8 652 2 393 28
September 18 504 3 927 21 12 770 3 663 29
October 14 016 3 314 24 13 054 3 226 25
November 5 959 2 146 36 10 994 3 026 28
December 9 841 2 803 28 11 283 2 842 25
Total 182 692 171 739
Estimates where the standard errors are in red must be used with care, as the errors are beyond
acceptable levels.
January
February
March April May June July AugustSeptember
October
November
December
2015_16 7 9 12 10 8 11 7 9 7 7 7 7
2014_2015 7 10 13 9 8 11 8 7 7 7 5 8
%
2%
4%
6%
8%
10%
12%
14%
PER
CEN
TAG
E
Housebreaking
Statistics South Africa
Crime Statistics Series Volume I: Exploring the extent of and circumstances surrounding housebreaking/burglary and home robbery, 2015–2016
21
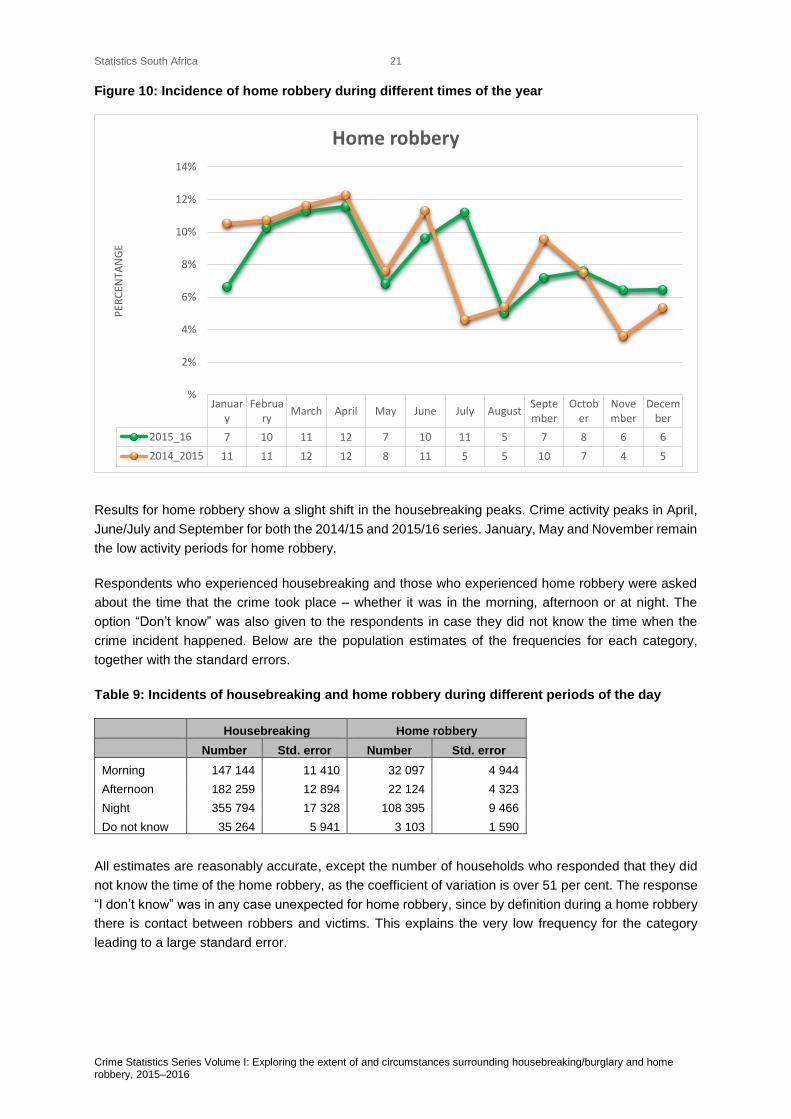
Figure 10: Incidence of home robbery during different times of the year
Results for home robbery show a slight shift in the housebreaking peaks. Crime activity peaks in April,
June/July and September for both the 2014/15 and 2015/16 series. January, May and November remain
the low activity periods for home robbery.
Respondents who experienced housebreaking and those who experienced home robbery were asked
about the time that the crime took place – whether it was in the morning, afternoon or at night. The
option “Don’t know” was also given to the respondents in case they did not know the time when the
crime incident happened. Below are the population estimates of the frequencies for each category,
together with the standard errors.
Table 9: Incidents of housebreaking and home robbery during different periods of the day
Housebreaking Home robbery
Number Std. error Number Std. error
Morning 147 144 11 410 32 097 4 944
Afternoon 182 259 12 894 22 124 4 323
Night 355 794 17 328 108 395 9 466
Do not know 35 264 5 941 3 103 1 590
All estimates are reasonably accurate, except the number of households who responded that they did
not know the time of the home robbery, as the coefficient of variation is over 51 per cent. The response
“I don’t know” was in any case unexpected for home robbery, since by definition during a home robbery
there is contact between robbers and victims. This explains the very low frequency for the category
leading to a large standard error.
January
February
March April May June July AugustSeptember
October
November
December
2015_16 7 10 11 12 7 10 11 5 7 8 6 6
2014_2015 11 11 12 12 8 11 5 5 10 7 4 5
%
2%
4%
6%
8%
10%
12%
14%
PER
CEN
TAN
GE
Home robbery
Statistics South Africa
Crime Statistics Series Volume I: Exploring the extent of and circumstances surrounding housebreaking/burglary and home robbery, 2015–2016
22
The bar chart below will assist in the interpretation of the data.
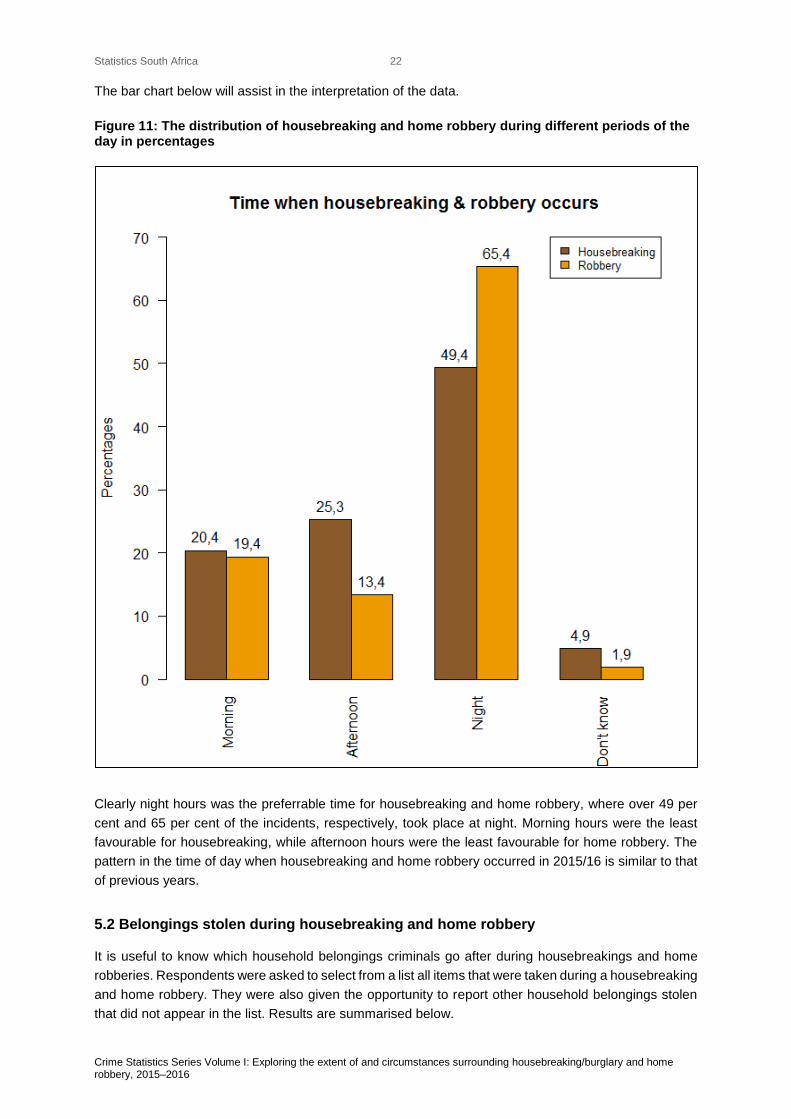
Figure 11: The distribution of housebreaking and home robbery during different periods of the day in percentages
Clearly night hours was the preferrable time for housebreaking and home robbery, where over 49 per
cent and 65 per cent of the incidents, respectively, took place at night. Morning hours were the least
favourable for housebreaking, while afternoon hours were the least favourable for home robbery. The
pattern in the time of day when housebreaking and home robbery occurred in 2015/16 is similar to that
of previous years.
5.2 Belongings stolen during housebreaking and home robbery
It is useful to know which household belongings criminals go after during housebreakings and home
robberies. Respondents were asked to select from a list all items that were taken during a housebreaking
and home robbery. They were also given the opportunity to report other household belongings stolen
that did not appear in the list. Results are summarised below.
Statistics South Africa
Crime Statistics Series Volume I: Exploring the extent of and circumstances surrounding housebreaking/burglary and home robbery, 2015–2016
23
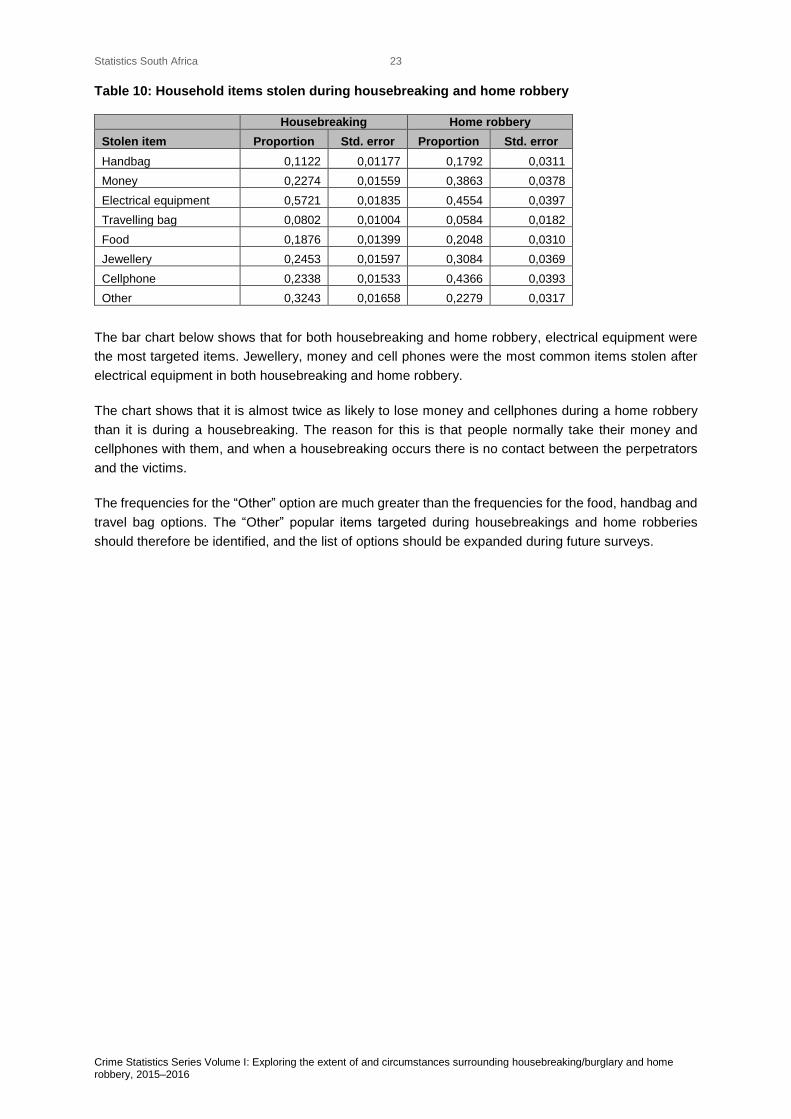
Table 10: Household items stolen during housebreaking and home robbery
Housebreaking Home robbery
Stolen item Proportion Std. error Proportion Std. error
Handbag 0,1122 0,01177 0,1792 0,0311
Money 0,2274 0,01559 0,3863 0,0378
Electrical equipment 0,5721 0,01835 0,4554 0,0397
Travelling bag 0,0802 0,01004 0,0584 0,0182
Food 0,1876 0,01399 0,2048 0,0310
Jewellery 0,2453 0,01597 0,3084 0,0369
Cellphone 0,2338 0,01533 0,4366 0,0393
Other 0,3243 0,01658 0,2279 0,0317
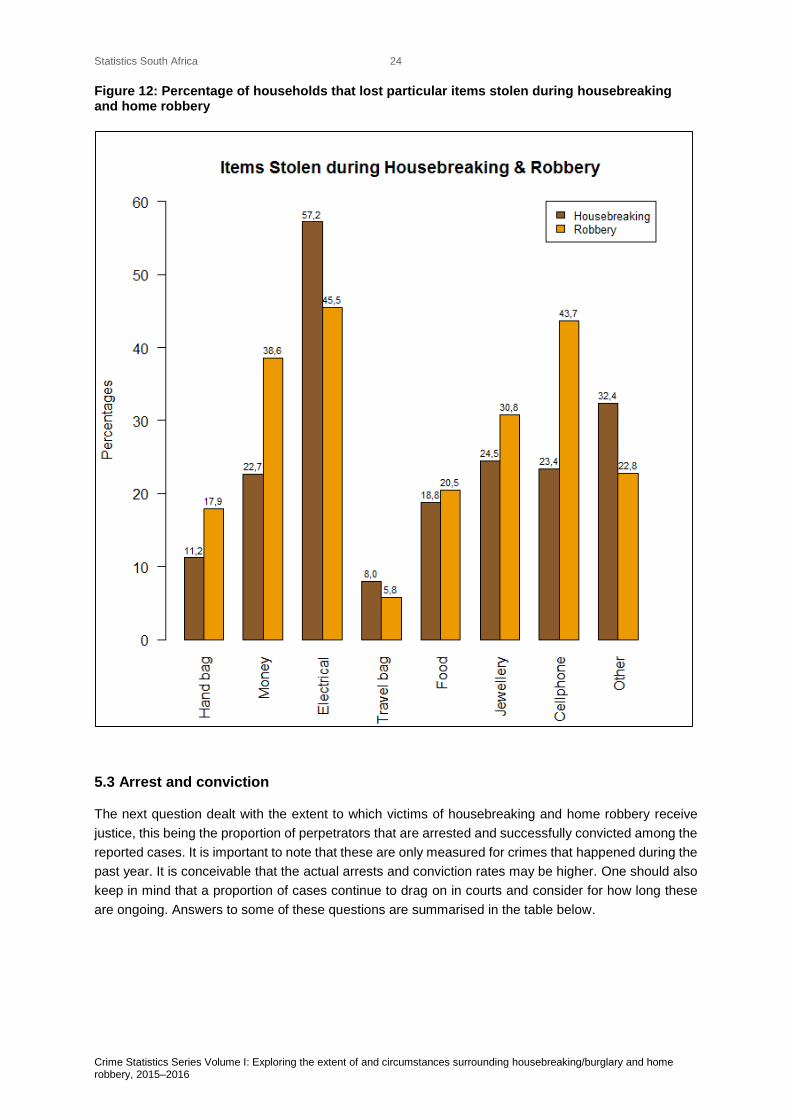
The bar chart below shows that for both housebreaking and home robbery, electrical equipment were
the most targeted items. Jewellery, money and cell phones were the most common items stolen after
electrical equipment in both housebreaking and home robbery.
The chart shows that it is almost twice as likely to lose money and cellphones during a home robbery
than it is during a housebreaking. The reason for this is that people normally take their money and
cellphones with them, and when a housebreaking occurs there is no contact between the perpetrators
and the victims.
The frequencies for the “Other” option are much greater than the frequencies for the food, handbag and
travel bag options. The “Other” popular items targeted during housebreakings and home robberies
should therefore be identified, and the list of options should be expanded during future surveys.
Statistics South Africa
Crime Statistics Series Volume I: Exploring the extent of and circumstances surrounding housebreaking/burglary and home robbery, 2015–2016
24
Figure 12: Percentage of households that lost particular items stolen during housebreaking and home robbery
5.3 Arrest and conviction
The next question dealt with the extent to which victims of housebreaking and home robbery receive
justice, this being the proportion of perpetrators that are arrested and successfully convicted among the
reported cases. It is important to note that these are only measured for crimes that happened during the
past year. It is conceivable that the actual arrests and conviction rates may be higher. One should also
keep in mind that a proportion of cases continue to drag on in courts and consider for how long these
are ongoing. Answers to some of these questions are summarised in the table below.
Statistics South Africa
Crime Statistics Series Volume I: Exploring the extent of and circumstances surrounding housebreaking/burglary and home robbery, 2015–2016
25
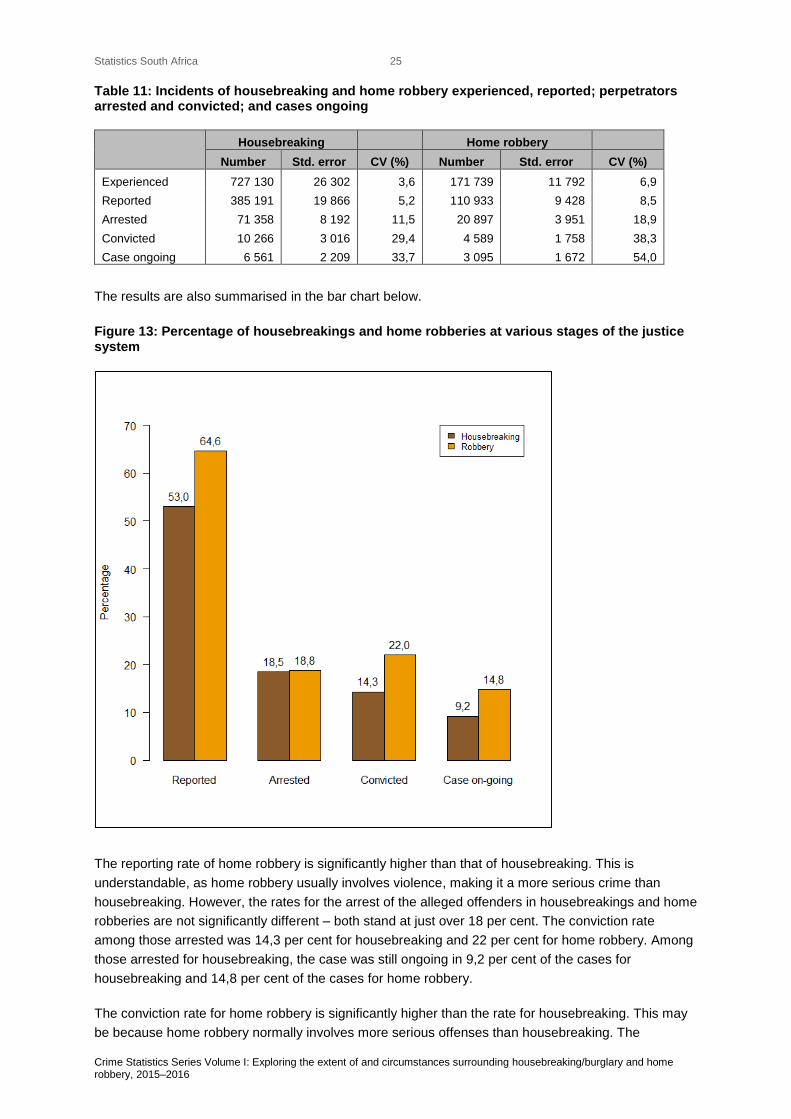
Table 11: Incidents of housebreaking and home robbery experienced, reported; perpetrators arrested and convicted; and cases ongoing
Housebreaking Home robbery
Number Std. error CV (%) Number Std. error CV (%)
Experienced 727 130 26 302 3,6 171 739 11 792 6,9
Reported 385 191 19 866 5,2 110 933 9 428 8,5
Arrested 71 358 8 192 11,5 20 897 3 951 18,9
Convicted 10 266 3 016 29,4 4 589 1 758 38,3
Case ongoing 6 561 2 209 33,7 3 095 1 672 54,0
The results are also summarised in the bar chart below.
Figure 13: Percentage of housebreakings and home robberies at various stages of the justice system
The reporting rate of home robbery is significantly higher than that of housebreaking. This is
understandable, as home robbery usually involves violence, making it a more serious crime than
housebreaking. However, the rates for the arrest of the alleged offenders in housebreakings and home
robberies are not significantly different – both stand at just over 18 per cent. The conviction rate
among those arrested was 14,3 per cent for housebreaking and 22 per cent for home robbery. Among
those arrested for housebreaking, the case was still ongoing in 9,2 per cent of the cases for
housebreaking and 14,8 per cent of the cases for home robbery.
The conviction rate for home robbery is significantly higher than the rate for housebreaking. This may
be because home robbery normally involves more serious offenses than housebreaking. The
Statistics South Africa
Crime Statistics Series Volume I: Exploring the extent of and circumstances surrounding housebreaking/burglary and home robbery, 2015–2016
26
downside of justice for home robbery is that the cases are not easily finalised, as reflected by the
percentage of cases still ongoing.
The results above must be used cautiously due to the low accuracy of some of the estimates –
particularly estimates for the number of convicted perpetrators and ongoing cases. The coefficients of
variation for these estimates are above the normal levels of tolerance. The other reason the estimates
are not reliable is the fact that only crimes experienced during the past year were included and
convictions normally takes a long time to realise.
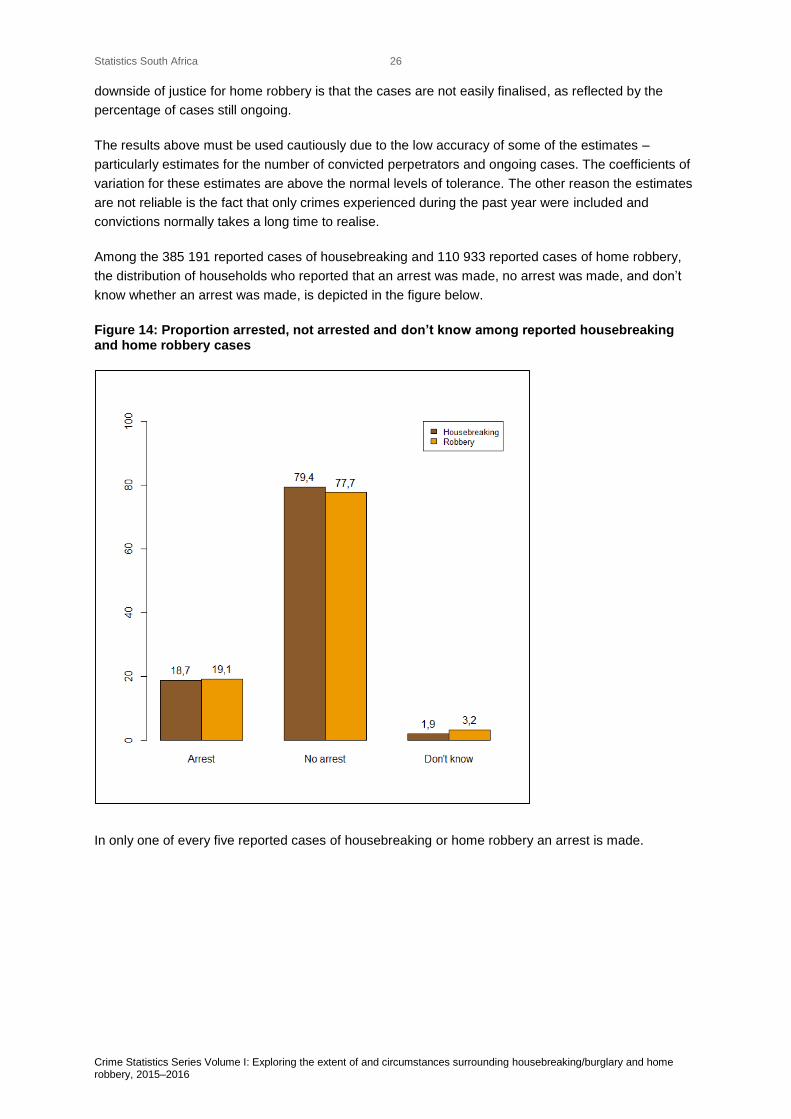
Among the 385 191 reported cases of housebreaking and 110 933 reported cases of home robbery,
the distribution of households who reported that an arrest was made, no arrest was made, and don’t
know whether an arrest was made, is depicted in the figure below.
Figure 14: Proportion arrested, not arrested and don’t know among reported housebreaking and home robbery cases
In only one of every five reported cases of housebreaking or home robbery an arrest is made.
Statistics South Africa
Crime Statistics Series Volume I: Exploring the extent of and circumstances surrounding housebreaking/burglary and home robbery, 2015–2016
27
Figure 15: Proportion convicted, not convicted, case ongoing and don’t know among those arrested for housebreaking and home robbery
Only one in five people arrested for housebreaking was convicted, and one in three people arrested
for home robbery was convicted. The poor record of arrest and conviction of perpetrators may cause
dissatisfaction with the police.
5.4 Satisfaction with the police
It is natural to ask at this stage whether the effectiveness of the justice system has anything to do with
people’s satisfaction with the police. A simple logistic regression model was used to investigate this.
The model included demographic variables of gender, race and education level of the respondent as
well as the variable of interest “arrested”. The variables “convicted” and “case ongoing” were left out
because the effective sample sizes were too small. Below are the results of the fitted model.
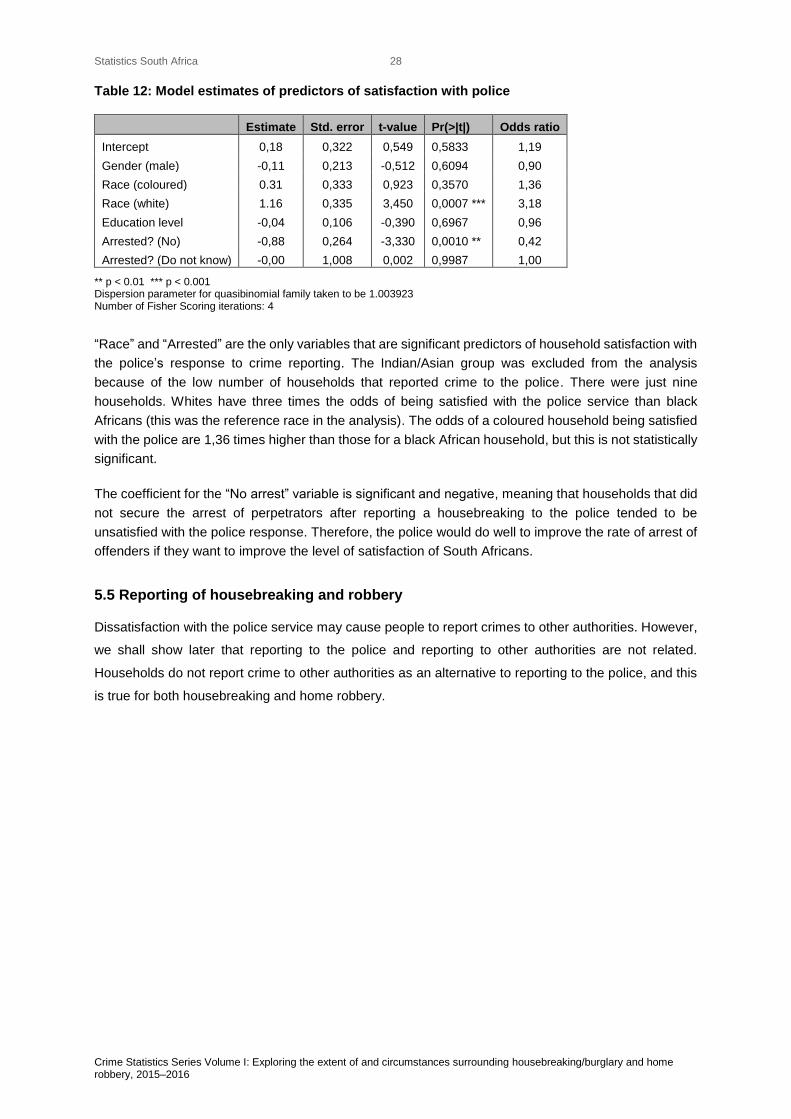
Statistics South Africa
Crime Statistics Series Volume I: Exploring the extent of and circumstances surrounding housebreaking/burglary and home robbery, 2015–2016
28
Table 12: Model estimates of predictors of satisfaction with police
Estimate Std. error t-value Pr(>|t|) Odds ratio
Intercept 0,18 0,322 0,549 0,5833 1,19
Gender (male) -0,11 0,213 -0,512 0,6094 0,90
Race (coloured) 0.31 0,333 0,923 0,3570 1,36
Race (white) 1.16 0,335 3,450 0,0007 *** 3,18
Education level -0,04 0,106 -0,390 0,6967 0,96
Arrested? (No) -0,88 0,264 -3,330 0,0010 ** 0,42
Arrested? (Do not know) -0,00 1,008 0,002 0,9987 1,00
** p < 0.01 *** p < 0.001 Dispersion parameter for quasibinomial family taken to be 1.003923 Number of Fisher Scoring iterations: 4
“Race” and “Arrested” are the only variables that are significant predictors of household satisfaction with
the police’s response to crime reporting. The Indian/Asian group was excluded from the analysis
because of the low number of households that reported crime to the police. There were just nine
households. Whites have three times the odds of being satisfied with the police service than black
Africans (this was the reference race in the analysis). The odds of a coloured household being satisfied
with the police are 1,36 times higher than those for a black African household, but this is not statistically
significant.
The coefficient for the “No arrest” variable is significant and negative, meaning that households that did
not secure the arrest of perpetrators after reporting a housebreaking to the police tended to be
unsatisfied with the police response. Therefore, the police would do well to improve the rate of arrest of
offenders if they want to improve the level of satisfaction of South Africans.
5.5 Reporting of housebreaking and robbery
Dissatisfaction with the police service may cause people to report crimes to other authorities. However,
we shall show later that reporting to the police and reporting to other authorities are not related.
Households do not report crime to other authorities as an alternative to reporting to the police, and this
is true for both housebreaking and home robbery.
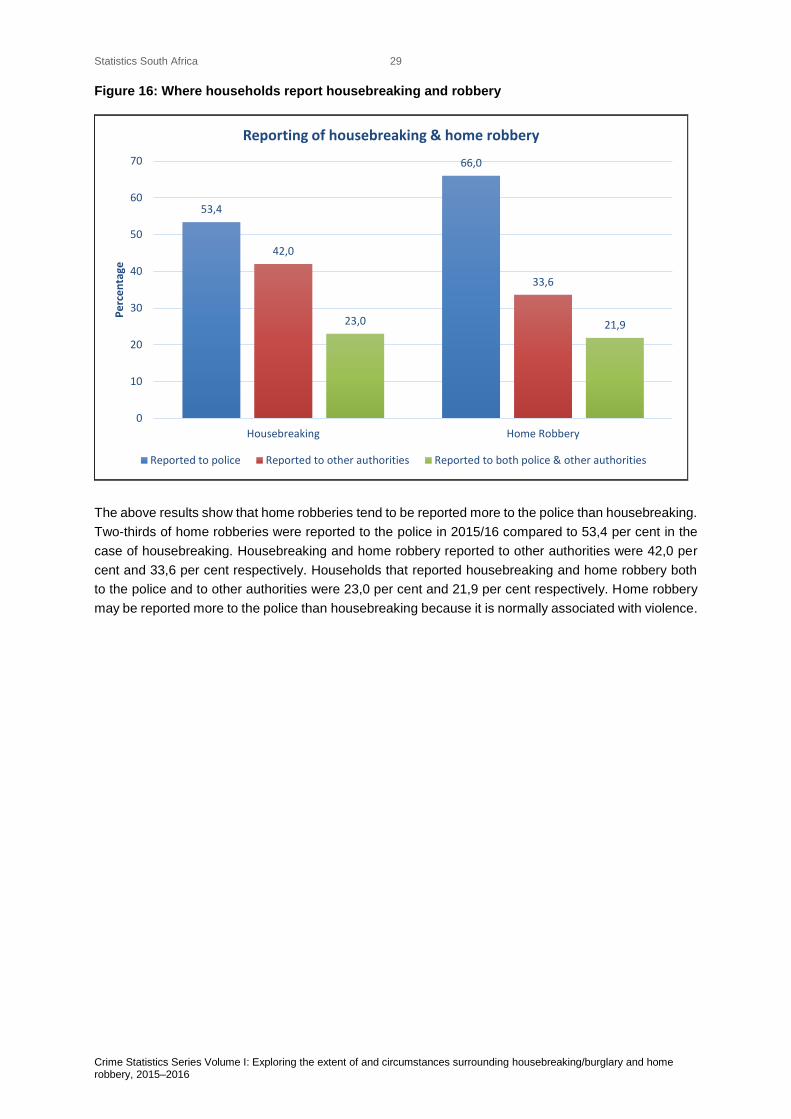
Statistics South Africa
Crime Statistics Series Volume I: Exploring the extent of and circumstances surrounding housebreaking/burglary and home robbery, 2015–2016
29
Figure 16: Where households report housebreaking and robbery
The above results show that home robberies tend to be reported more to the police than housebreaking.
Two-thirds of home robberies were reported to the police in 2015/16 compared to 53,4 per cent in the
case of housebreaking. Housebreaking and home robbery reported to other authorities were 42,0 per
cent and 33,6 per cent respectively. Households that reported housebreaking and home robbery both
to the police and to other authorities were 23,0 per cent and 21,9 per cent respectively. Home robbery
may be reported more to the police than housebreaking because it is normally associated with violence.
53,4
66,0
42,0
33,6
23,0 21,9
0
10
20
30
40
50
60
70
Housebreaking Home Robbery
Pe
rce
nta
ge
Reporting of housebreaking & home robbery
Reported to police Reported to other authorities Reported to both police & other authorities
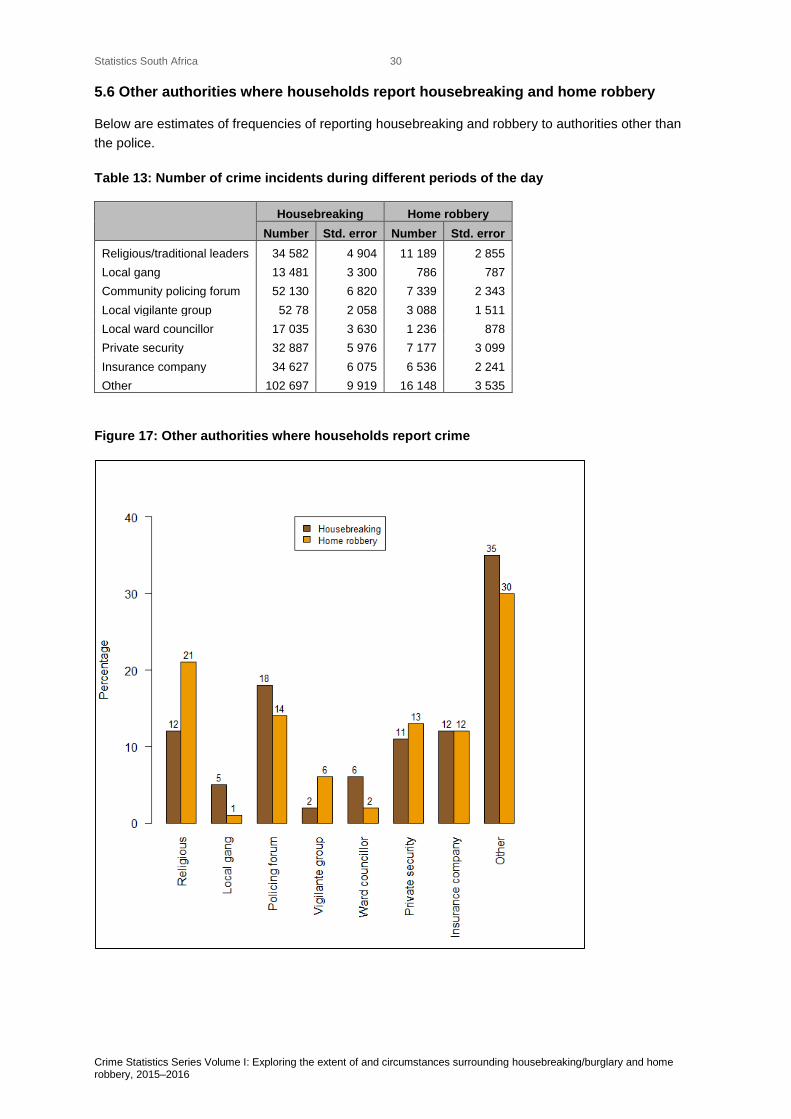
Statistics South Africa
Crime Statistics Series Volume I: Exploring the extent of and circumstances surrounding housebreaking/burglary and home robbery, 2015–2016
30
5.6 Other authorities where households report housebreaking and home robbery
Below are estimates of frequencies of reporting housebreaking and robbery to authorities other than
the police.
Table 13: Number of crime incidents during different periods of the day
Housebreaking Home robbery
Number Std. error Number Std. error
Religious/traditional leaders 34 582 4 904 11 189 2 855
Local gang 13 481 3 300 786 787
Community policing forum 52 130 6 820 7 339 2 343
Local vigilante group 52 78 2 058 3 088 1 511
Local ward councillor 17 035 3 630 1 236 878
Private security 32 887 5 976 7 177 3 099
Insurance company 34 627 6 075 6 536 2 241
Other 102 697 9 919 16 148 3 535
Figure 17: Other authorities where households report crime
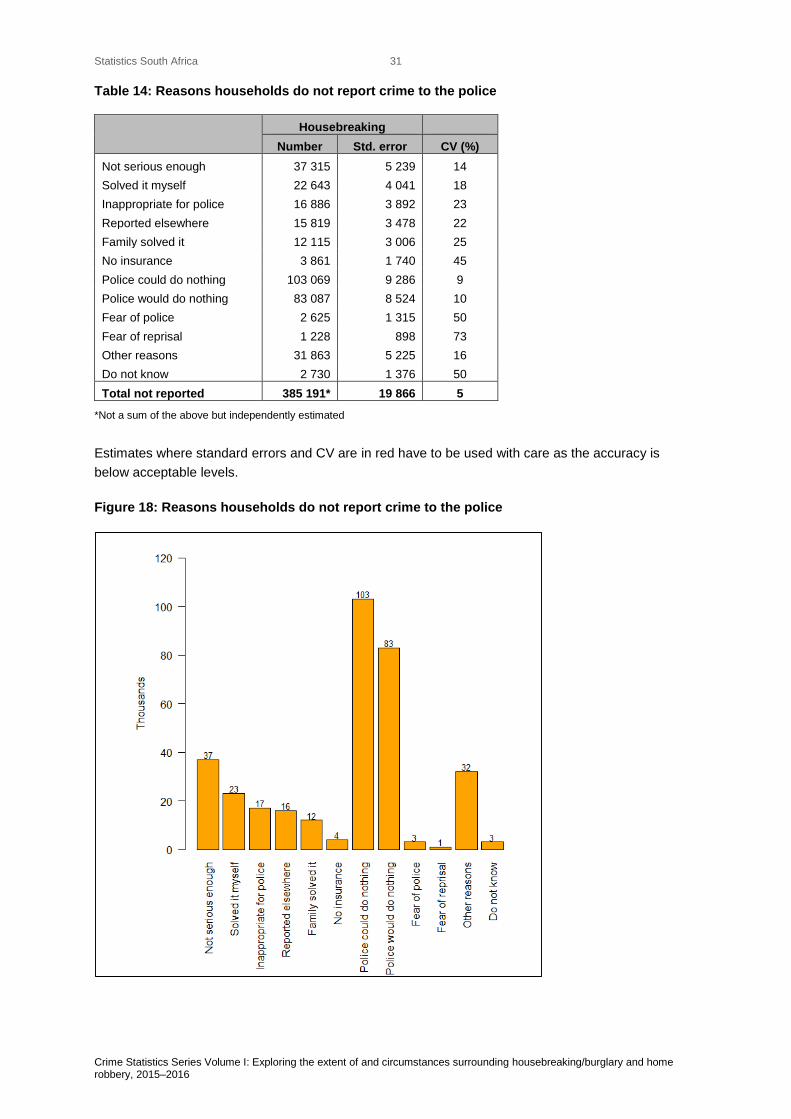
Statistics South Africa
Crime Statistics Series Volume I: Exploring the extent of and circumstances surrounding housebreaking/burglary and home robbery, 2015–2016
31
Table 14: Reasons households do not report crime to the police
Housebreaking
Number Std. error CV (%)
Not serious enough 37 315 5 239 14
Solved it myself 22 643 4 041 18
Inappropriate for police 16 886 3 892 23
Reported elsewhere 15 819 3 478 22
Family solved it 12 115 3 006 25
No insurance 3 861 1 740 45
Police could do nothing 103 069 9 286 9
Police would do nothing 83 087 8 524 10
Fear of police 2 625 1 315 50
Fear of reprisal 1 228 898 73
Other reasons 31 863 5 225 16
Do not know 2 730 1 376 50
Total not reported 385 191* 19 866 5
*Not a sum of the above but independently estimated
Estimates where standard errors and CV are in red have to be used with care as the accuracy is
below acceptable levels.
Figure 18: Reasons households do not report crime to the police
Statistics South Africa
Crime Statistics Series Volume I: Exploring the extent of and circumstances surrounding housebreaking/burglary and home robbery, 2015–2016
32
5.7 Modelling housebreaking and home robbery
Heeringa (2010) recommends the use of the following Hosmer and Lemeshow specification steps for
developing a logistic regression model for analysis of complex sample survey data:
Perform initial bivariate analysis of the relationship of y to individual predictor variable candidates.
Select the predictors that have a bivariate association with y at significance p < 0.25 as candidates
for main effects in a multivariate logistic regression model.
Evaluate the contribution of each predictor to the multivariate model using the Wald test.
Check the linearity assumption for continuous predictors.
Check for scientifically justified interactions among predictors.
Chi-squared tests for survey data were used to select categorical predictor variable candidates for the
logistic regression model. The R-code for this is svychisq(~y+x,des), where y is the binary dependent
variable and x is a categorical predictor variable being tested whether it is significantly related to y, and
des is a variable specifying the survey design. For more information about the R software and programs
used see Annexure 2. The dependent variable y in this case is the indicator of a housebreaking/burglary
and has value 1 if a household experienced a break-in during the last 12 months and 0 otherwise. Nine
possible candidates for predictor variables were selected subjectively, focusing on those that were likely
to have an influence on housebreaking. The variables entered at the screening stage were:
Gender Gender of the household head/acting household head
Race Race of the household head/acting household head
Marital status Education level of the household head/acting household head
Education level Marital status of the household head/acting household head
Police visibility How often are police in uniform seen in the area
Special police operation If there has been a special police operation in the area during
the last 12 months
Community crime prevention
forum
If a community crime prevention forum exists in the area
Time to police station How long it takes to get to a police station by usual mode of
transport
Police emergency call response
time
How long it takes for police to respond to an emergency call
Geotype Geographical area where the household is located
Age Age of the household head/acting household head
The following logistic regression model was fitted:
9988777655443322110)(1
)(ln( xxxxxxxxx
x
x
On the left-hand side is the log of the odds ratio as the dependent variable. The j are the regression
parameters to be estimated and the jx are categorical or continuous predictors of the odds.
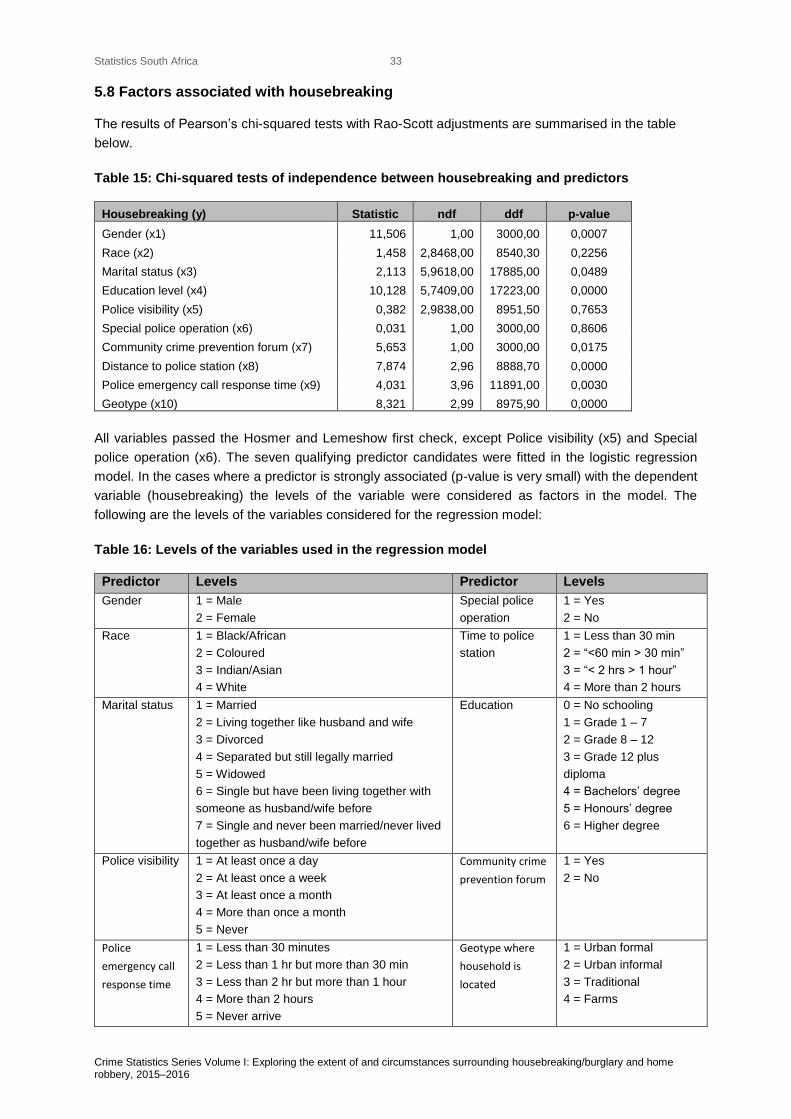
Statistics South Africa
Crime Statistics Series Volume I: Exploring the extent of and circumstances surrounding housebreaking/burglary and home robbery, 2015–2016
33
5.8 Factors associated with housebreaking
The results of Pearson’s chi-squared tests with Rao-Scott adjustments are summarised in the table
below.
Table 15: Chi-squared tests of independence between housebreaking and predictors
Housebreaking (y) Statistic ndf ddf p-value
Gender (x1) 11,506 1,00 3000,00 0,0007
Race (x2) 1,458 2,8468,00 8540,30 0,2256
Marital status (x3) 2,113 5,9618,00 17885,00 0,0489
Education level (x4) 10,128 5,7409,00 17223,00 0,0000
Police visibility (x5) 0,382 2,9838,00 8951,50 0,7653
Special police operation (x6) 0,031 1,00 3000,00 0,8606
Community crime prevention forum (x7) 5,653 1,00 3000,00 0,0175
Distance to police station (x8) 7,874 2,96 8888,70 0,0000
Police emergency call response time (x9) 4,031 3,96 11891,00 0,0030
Geotype (x10) 8,321 2,99 8975,90 0,0000
All variables passed the Hosmer and Lemeshow first check, except Police visibility (x5) and Special
police operation (x6). The seven qualifying predictor candidates were fitted in the logistic regression
model. In the cases where a predictor is strongly associated (p-value is very small) with the dependent
variable (housebreaking) the levels of the variable were considered as factors in the model. The
following are the levels of the variables considered for the regression model:
Table 16: Levels of the variables used in the regression model
Predictor Levels Predictor Levels
Gender 1 = Male
2 = Female
Special police
operation
1 = Yes
2 = No
Race 1 = Black/African
2 = Coloured
3 = Indian/Asian
4 = White
Time to police
station
1 = Less than 30 min
2 = “<60 min > 30 min”
3 = “< 2 hrs > 1 hour”
4 = More than 2 hours
Marital status 1 = Married
2 = Living together like husband and wife
3 = Divorced
4 = Separated but still legally married
5 = Widowed
6 = Single but have been living together with
someone as husband/wife before
7 = Single and never been married/never lived
together as husband/wife before
Education 0 = No schooling
1 = Grade 1 – 7
2 = Grade 8 – 12
3 = Grade 12 plus
diploma
4 = Bachelors’ degree
5 = Honours’ degree
6 = Higher degree
Police visibility 1 = At least once a day
2 = At least once a week
3 = At least once a month
4 = More than once a month
5 = Never
Community crime
prevention forum
1 = Yes
2 = No
Police
emergency call
response time
1 = Less than 30 minutes
2 = Less than 1 hr but more than 30 min
3 = Less than 2 hr but more than 1 hour
4 = More than 2 hours
5 = Never arrive
Geotype where
household is
located
1 = Urban formal
2 = Urban informal
3 = Traditional
4 = Farms
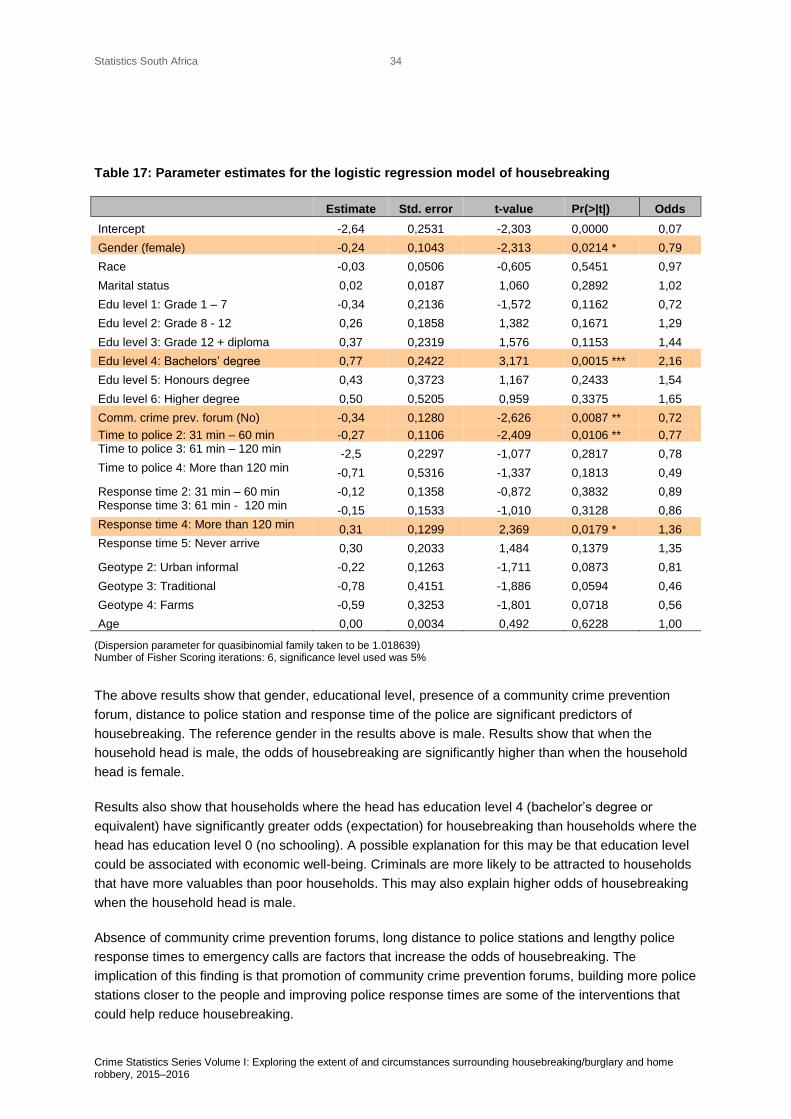
Statistics South Africa
Crime Statistics Series Volume I: Exploring the extent of and circumstances surrounding housebreaking/burglary and home robbery, 2015–2016
34
Table 17: Parameter estimates for the logistic regression model of housebreaking
Estimate Std. error t-value Pr(>|t|) Odds
Intercept -2,64 0,2531 -2,303 0,0000 0,07
Gender (female) -0,24 0,1043 -2,313 0,0214 * 0,79
Race -0,03 0,0506 -0,605 0,5451 0,97
Marital status 0,02 0,0187 1,060 0,2892 1,02
Edu level 1: Grade 1 – 7 -0,34 0,2136 -1,572 0,1162 0,72
Edu level 2: Grade 8 - 12 0,26 0,1858 1,382 0,1671 1,29
Edu level 3: Grade 12 + diploma 0,37 0,2319 1,576 0,1153 1,44
Edu level 4: Bachelors’ degree 0,77 0,2422 3,171 0,0015 *** 2,16
Edu level 5: Honours degree 0,43 0,3723 1,167 0,2433 1,54
Edu level 6: Higher degree 0,50 0,5205 0,959 0,3375 1,65
Comm. crime prev. forum (No) -0,34 0,1280 -2,626 0,0087 ** 0,72
Time to police 2: 31 min – 60 min -0,27 0,1106 -2,409 0,0106 ** 0,77 Time to police 3: 61 min – 120 min -2,5 0,2297 -1,077 0,2817 0,78 Time to police 4: More than 120 min -0,71 0,5316 -1,337 0,1813 0,49
Response time 2: 31 min – 60 min -0,12 0,1358 -0,872 0,3832 0,89 Response time 3: 61 min - 120 min -0,15 0,1533 -1,010 0,3128 0,86 Response time 4: More than 120 min 0,31 0,1299 2,369 0,0179 * 1,36 Response time 5: Never arrive 0,30 0,2033 1,484 0,1379 1,35
Geotype 2: Urban informal -0,22 0,1263 -1,711 0,0873 0,81
Geotype 3: Traditional -0,78 0,4151 -1,886 0,0594 0,46
Geotype 4: Farms -0,59 0,3253 -1,801 0,0718 0,56
Age 0,00 0,0034 0,492 0,6228 1,00
(Dispersion parameter for quasibinomial family taken to be 1.018639) Number of Fisher Scoring iterations: 6, significance level used was 5%
The above results show that gender, educational level, presence of a community crime prevention
forum, distance to police station and response time of the police are significant predictors of
housebreaking. The reference gender in the results above is male. Results show that when the
household head is male, the odds of housebreaking are significantly higher than when the household
head is female.
Results also show that households where the head has education level 4 (bachelor’s degree or
equivalent) have significantly greater odds (expectation) for housebreaking than households where the
head has education level 0 (no schooling). A possible explanation for this may be that education level
could be associated with economic well-being. Criminals are more likely to be attracted to households
that have more valuables than poor households. This may also explain higher odds of housebreaking
when the household head is male.
Absence of community crime prevention forums, long distance to police stations and lengthy police
response times to emergency calls are factors that increase the odds of housebreaking. The
implication of this finding is that promotion of community crime prevention forums, building more police
stations closer to the people and improving police response times are some of the interventions that
could help reduce housebreaking.
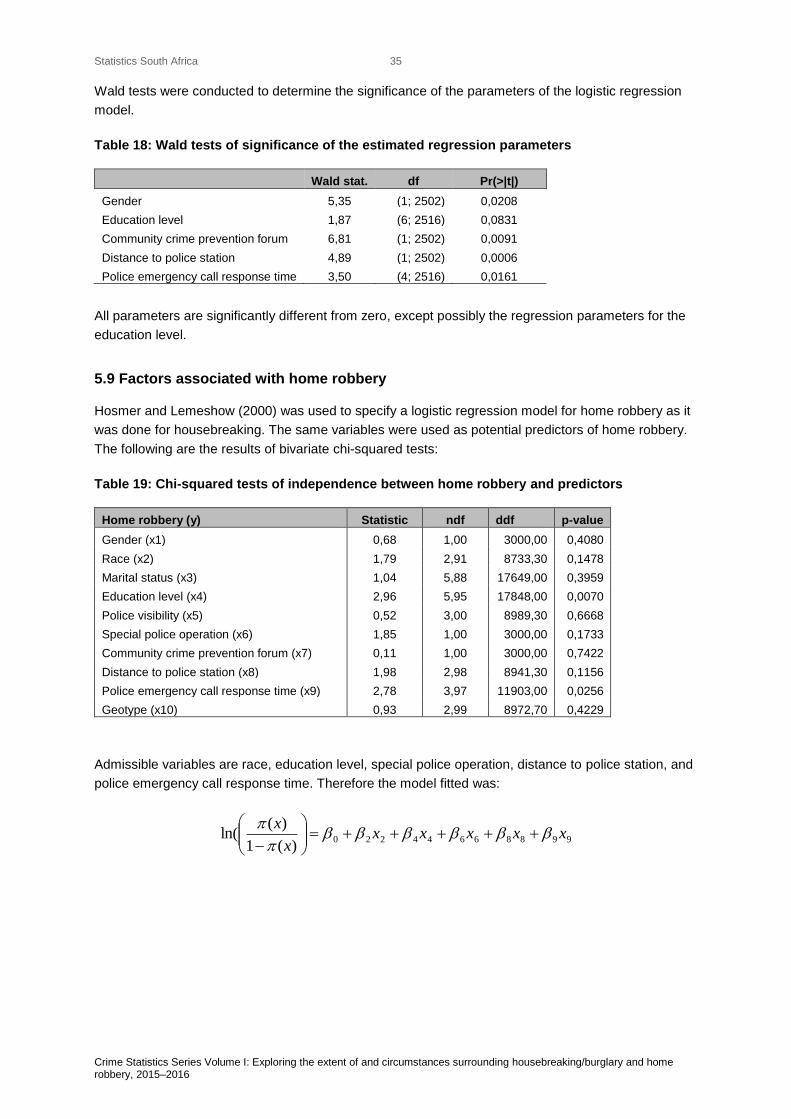
Statistics South Africa
Crime Statistics Series Volume I: Exploring the extent of and circumstances surrounding housebreaking/burglary and home robbery, 2015–2016
35
Wald tests were conducted to determine the significance of the parameters of the logistic regression
model.
Table 18: Wald tests of significance of the estimated regression parameters
Wald stat. df Pr(>|t|)
Gender 5,35 (1; 2502) 0,0208
Education level 1,87 (6; 2516) 0,0831
Community crime prevention forum 6,81 (1; 2502) 0,0091
Distance to police station 4,89 (1; 2502) 0,0006
Police emergency call response time 3,50 (4; 2516) 0,0161
All parameters are significantly different from zero, except possibly the regression parameters for the
education level.
5.9 Factors associated with home robbery
Hosmer and Lemeshow (2000) was used to specify a logistic regression model for home robbery as it
was done for housebreaking. The same variables were used as potential predictors of home robbery.
The following are the results of bivariate chi-squared tests:
Table 19: Chi-squared tests of independence between home robbery and predictors
Home robbery (y) Statistic ndf ddf p-value
Gender (x1) 0,68 1,00 3000,00 0,4080
Race (x2) 1,79 2,91 8733,30 0,1478
Marital status (x3) 1,04 5,88 17649,00 0,3959
Education level (x4) 2,96 5,95 17848,00 0,0070
Police visibility (x5) 0,52 3,00 8989,30 0,6668
Special police operation (x6) 1,85 1,00 3000,00 0,1733
Community crime prevention forum (x7) 0,11 1,00 3000,00 0,7422
Distance to police station (x8) 1,98 2,98 8941,30 0,1156
Police emergency call response time (x9) 2,78 3,97 11903,00 0,0256
Geotype (x10) 0,93 2,99 8972,70 0,4229
Admissible variables are race, education level, special police operation, distance to police station, and
police emergency call response time. Therefore the model fitted was:
99886644220)(1
)(ln( xxxxx
x
x
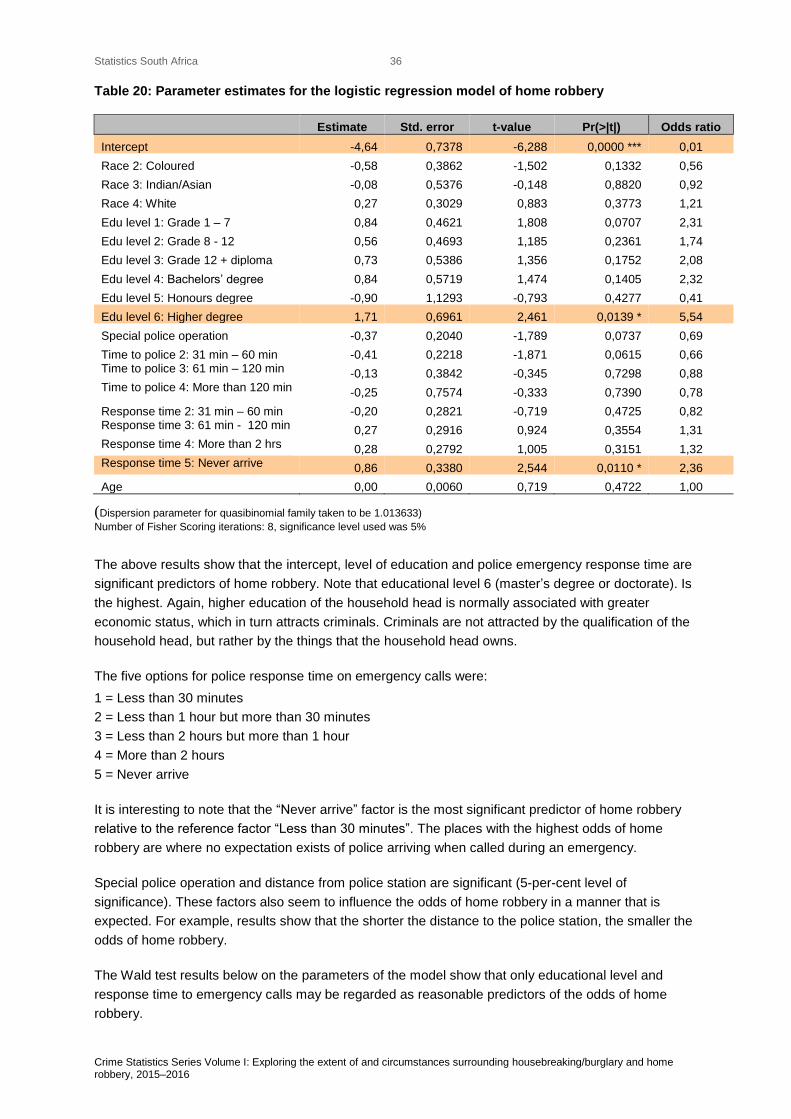
Statistics South Africa
Crime Statistics Series Volume I: Exploring the extent of and circumstances surrounding housebreaking/burglary and home robbery, 2015–2016
36
Table 20: Parameter estimates for the logistic regression model of home robbery
Estimate Std. error t-value Pr(>|t|) Odds ratio
Intercept -4,64 0,7378 -6,288 0,0000 *** 0,01
Race 2: Coloured -0,58 0,3862 -1,502 0,1332 0,56
Race 3: Indian/Asian -0,08 0,5376 -0,148 0,8820 0,92
Race 4: White 0,27 0,3029 0,883 0,3773 1,21
Edu level 1: Grade 1 – 7 0,84 0,4621 1,808 0,0707 2,31
Edu level 2: Grade 8 - 12 0,56 0,4693 1,185 0,2361 1,74
Edu level 3: Grade 12 + diploma 0,73 0,5386 1,356 0,1752 2,08
Edu level 4: Bachelors’ degree 0,84 0,5719 1,474 0,1405 2,32
Edu level 5: Honours degree -0,90 1,1293 -0,793 0,4277 0,41
Edu level 6: Higher degree 1,71 0,6961 2,461 0,0139 * 5,54
Special police operation -0,37 0,2040 -1,789 0,0737 0,69
Time to police 2: 31 min – 60 min -0,41 0,2218 -1,871 0,0615 0,66 Time to police 3: 61 min – 120 min -0,13 0,3842 -0,345 0,7298 0,88 Time to police 4: More than 120 min -0,25 0,7574 -0,333 0,7390 0,78
Response time 2: 31 min – 60 min -0,20 0,2821 -0,719 0,4725 0,82 Response time 3: 61 min - 120 min 0,27 0,2916 0,924 0,3554 1,31 Response time 4: More than 2 hrs 0,28 0,2792 1,005 0,3151 1,32 Response time 5: Never arrive 0,86 0,3380 2,544 0,0110 * 2,36
Age 0,00 0,0060 0,719 0,4722 1,00
(Dispersion parameter for quasibinomial family taken to be 1.013633)
Number of Fisher Scoring iterations: 8, significance level used was 5%
The above results show that the intercept, level of education and police emergency response time are
significant predictors of home robbery. Note that educational level 6 (master’s degree or doctorate). Is
the highest. Again, higher education of the household head is normally associated with greater
economic status, which in turn attracts criminals. Criminals are not attracted by the qualification of the
household head, but rather by the things that the household head owns.
The five options for police response time on emergency calls were:
1 = Less than 30 minutes
2 = Less than 1 hour but more than 30 minutes
3 = Less than 2 hours but more than 1 hour
4 = More than 2 hours
5 = Never arrive
It is interesting to note that the “Never arrive” factor is the most significant predictor of home robbery
relative to the reference factor “Less than 30 minutes”. The places with the highest odds of home
robbery are where no expectation exists of police arriving when called during an emergency.
Special police operation and distance from police station are significant (5-per-cent level of
significance). These factors also seem to influence the odds of home robbery in a manner that is
expected. For example, results show that the shorter the distance to the police station, the smaller the
odds of home robbery.
The Wald test results below on the parameters of the model show that only educational level and
response time to emergency calls may be regarded as reasonable predictors of the odds of home
robbery.
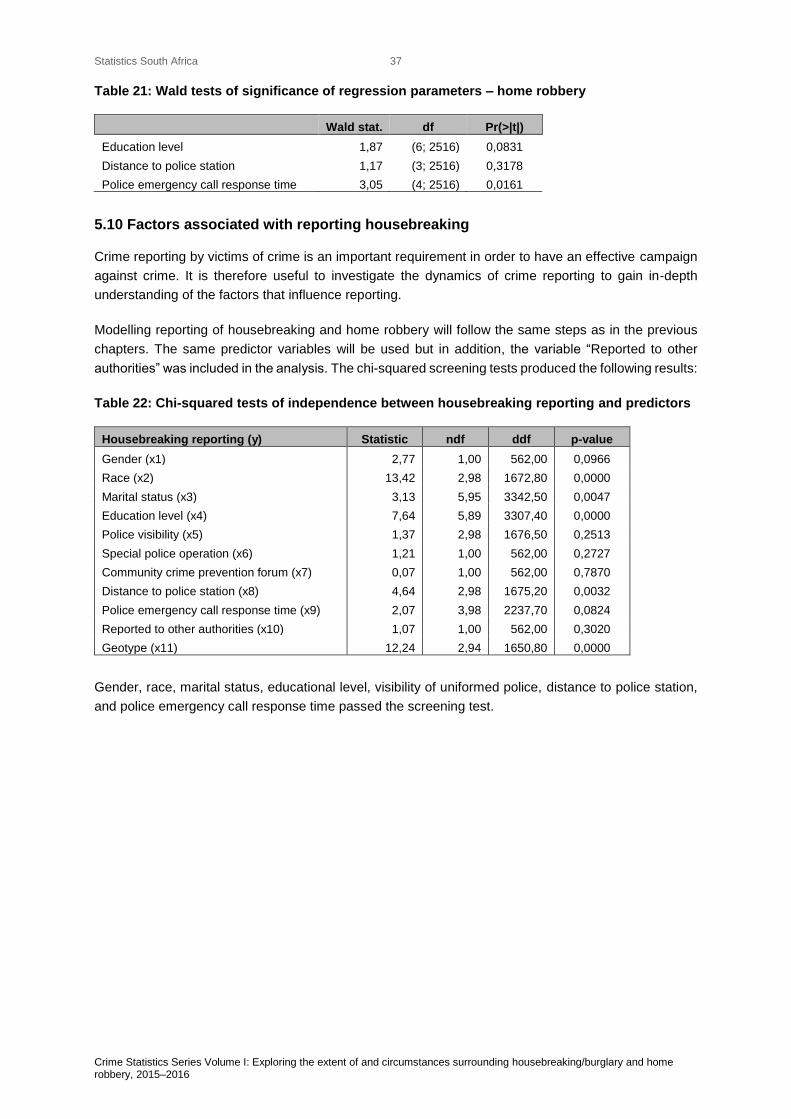
Statistics South Africa
Crime Statistics Series Volume I: Exploring the extent of and circumstances surrounding housebreaking/burglary and home robbery, 2015–2016
37
Table 21: Wald tests of significance of regression parameters – home robbery
Wald stat. df Pr(>|t|)
Education level 1,87 (6; 2516) 0,0831
Distance to police station 1,17 (3; 2516) 0,3178
Police emergency call response time 3,05 (4; 2516) 0,0161
5.10 Factors associated with reporting housebreaking
Crime reporting by victims of crime is an important requirement in order to have an effective campaign
against crime. It is therefore useful to investigate the dynamics of crime reporting to gain in-depth
understanding of the factors that influence reporting.
Modelling reporting of housebreaking and home robbery will follow the same steps as in the previous
chapters. The same predictor variables will be used but in addition, the variable “Reported to other
authorities” was included in the analysis. The chi-squared screening tests produced the following results:
Table 22: Chi-squared tests of independence between housebreaking reporting and predictors
Housebreaking reporting (y) Statistic ndf ddf p-value
Gender (x1) 2,77 1,00 562,00 0,0966
Race (x2) 13,42 2,98 1672,80 0,0000
Marital status (x3) 3,13 5,95 3342,50 0,0047
Education level (x4) 7,64 5,89 3307,40 0,0000
Police visibility (x5) 1,37 2,98 1676,50 0,2513
Special police operation (x6) 1,21 1,00 562,00 0,2727
Community crime prevention forum (x7) 0,07 1,00 562,00 0,7870
Distance to police station (x8) 4,64 2,98 1675,20 0,0032
Police emergency call response time (x9) 2,07 3,98 2237,70 0,0824
Reported to other authorities (x10) 1,07 1,00 562,00 0,3020
Geotype (x11) 12,24 2,94 1650,80 0,0000
Gender, race, marital status, educational level, visibility of uniformed police, distance to police station,
and police emergency call response time passed the screening test.
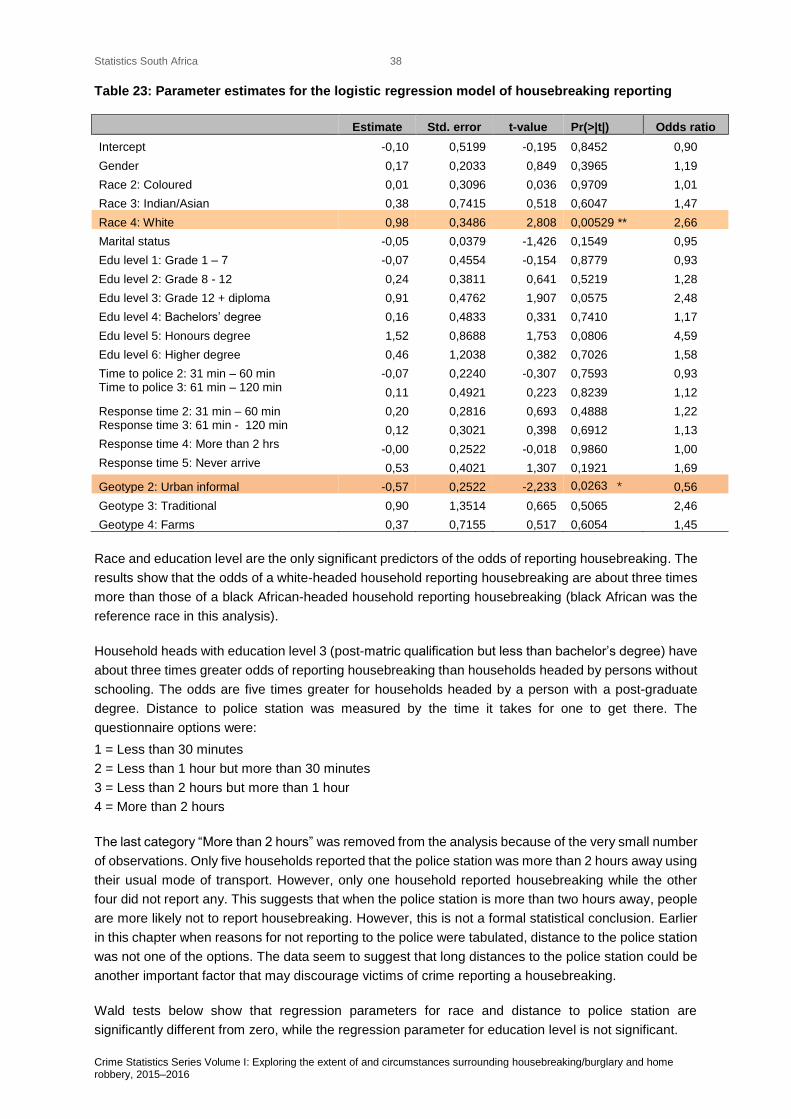
Statistics South Africa
Crime Statistics Series Volume I: Exploring the extent of and circumstances surrounding housebreaking/burglary and home robbery, 2015–2016
38
Table 23: Parameter estimates for the logistic regression model of housebreaking reporting
Estimate Std. error t-value Pr(>|t|) Odds ratio
Intercept -0,10 0,5199 -0,195 0,8452 0,90
Gender 0,17 0,2033 0,849 0,3965 1,19
Race 2: Coloured 0,01 0,3096 0,036 0,9709 1,01
Race 3: Indian/Asian 0,38 0,7415 0,518 0,6047 1,47
Race 4: White 0,98 0,3486 2,808 0,00529 ** 2,66
Marital status -0,05 0,0379 -1,426 0,1549 0,95
Edu level 1: Grade 1 – 7 -0,07 0,4554 -0,154 0,8779 0,93
Edu level 2: Grade 8 - 12 0,24 0,3811 0,641 0,5219 1,28
Edu level 3: Grade 12 + diploma 0,91 0,4762 1,907 0,0575 2,48
Edu level 4: Bachelors’ degree 0,16 0,4833 0,331 0,7410 1,17
Edu level 5: Honours degree 1,52 0,8688 1,753 0,0806 4,59
Edu level 6: Higher degree 0,46 1,2038 0,382 0,7026 1,58
Time to police 2: 31 min – 60 min -0,07 0,2240 -0,307 0,7593 0,93 Time to police 3: 61 min – 120 min 0,11 0,4921 0,223 0,8239 1,12
Response time 2: 31 min – 60 min 0,20 0,2816 0,693 0,4888 1,22 Response time 3: 61 min - 120 min 0,12 0,3021 0,398 0,6912 1,13 Response time 4: More than 2 hrs -0,00 0,2522 -0,018 0,9860 1,00 Response time 5: Never arrive 0,53 0,4021 1,307 0,1921 1,69
Geotype 2: Urban informal -0,57 0,2522 -2,233 0,0263 * 0,56
Geotype 3: Traditional 0,90 1,3514 0,665 0,5065 2,46
Geotype 4: Farms 0,37 0,7155 0,517 0,6054 1,45
Race and education level are the only significant predictors of the odds of reporting housebreaking. The
results show that the odds of a white-headed household reporting housebreaking are about three times
more than those of a black African-headed household reporting housebreaking (black African was the
reference race in this analysis).
Household heads with education level 3 (post-matric qualification but less than bachelor’s degree) have
about three times greater odds of reporting housebreaking than households headed by persons without
schooling. The odds are five times greater for households headed by a person with a post-graduate
degree. Distance to police station was measured by the time it takes for one to get there. The
questionnaire options were:
1 = Less than 30 minutes
2 = Less than 1 hour but more than 30 minutes
3 = Less than 2 hours but more than 1 hour
4 = More than 2 hours
The last category “More than 2 hours” was removed from the analysis because of the very small number
of observations. Only five households reported that the police station was more than 2 hours away using
their usual mode of transport. However, only one household reported housebreaking while the other
four did not report any. This suggests that when the police station is more than two hours away, people
are more likely not to report housebreaking. However, this is not a formal statistical conclusion. Earlier
in this chapter when reasons for not reporting to the police were tabulated, distance to the police station
was not one of the options. The data seem to suggest that long distances to the police station could be
another important factor that may discourage victims of crime reporting a housebreaking.
Wald tests below show that regression parameters for race and distance to police station are
significantly different from zero, while the regression parameter for education level is not significant.
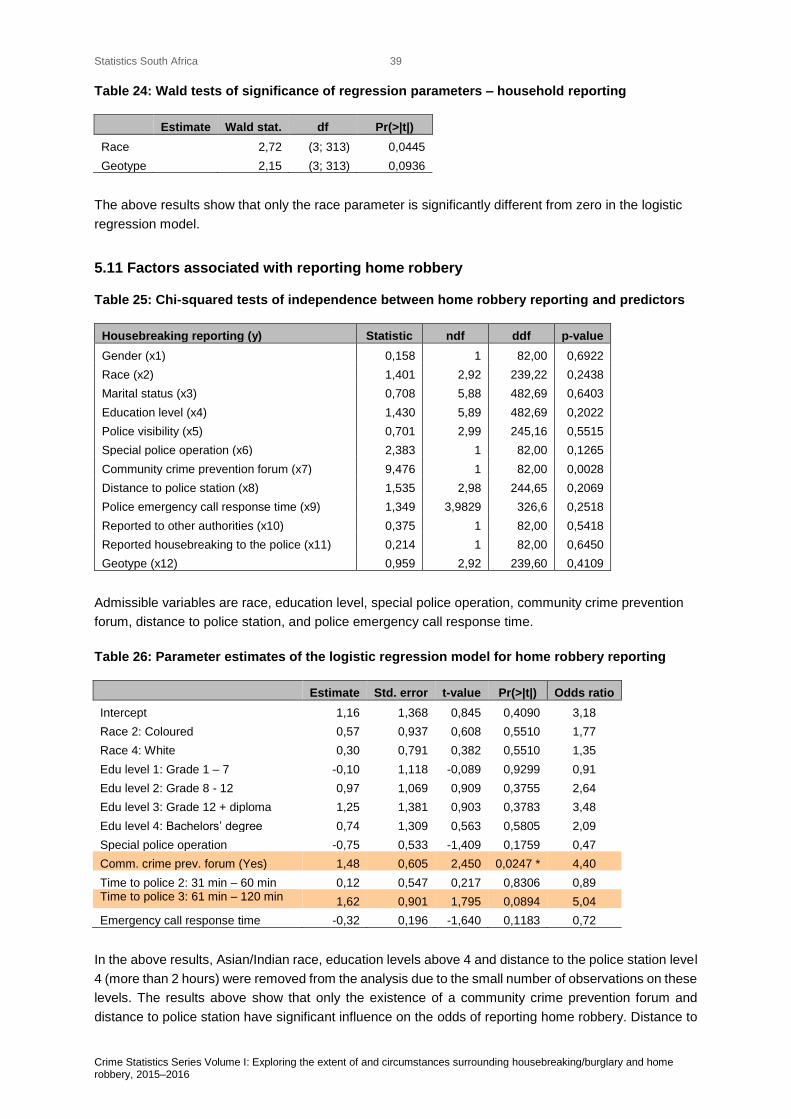
Statistics South Africa
Crime Statistics Series Volume I: Exploring the extent of and circumstances surrounding housebreaking/burglary and home robbery, 2015–2016
39
Table 24: Wald tests of significance of regression parameters – household reporting
Estimate Wald stat. df Pr(>|t|)
Race 2,72 (3; 313) 0,0445
Geotype 2,15 (3; 313) 0,0936
The above results show that only the race parameter is significantly different from zero in the logistic
regression model.
5.11 Factors associated with reporting home robbery
Table 25: Chi-squared tests of independence between home robbery reporting and predictors
Housebreaking reporting (y) Statistic ndf ddf p-value
Gender (x1) 0,158 1 82,00 0,6922
Race (x2) 1,401 2,92 239,22 0,2438
Marital status (x3) 0,708 5,88 482,69 0,6403
Education level (x4) 1,430 5,89 482,69 0,2022
Police visibility (x5) 0,701 2,99 245,16 0,5515
Special police operation (x6) 2,383 1 82,00 0,1265
Community crime prevention forum (x7) 9,476 1 82,00 0,0028
Distance to police station (x8) 1,535 2,98 244,65 0,2069
Police emergency call response time (x9) 1,349 3,9829 326,6 0,2518
Reported to other authorities (x10) 0,375 1 82,00 0,5418
Reported housebreaking to the police (x11) 0,214 1 82,00 0,6450
Geotype (x12) 0,959 2,92 239,60 0,4109
Admissible variables are race, education level, special police operation, community crime prevention
forum, distance to police station, and police emergency call response time.
Table 26: Parameter estimates of the logistic regression model for home robbery reporting
Estimate Std. error t-value Pr(>|t|) Odds ratio
Intercept 1,16 1,368 0,845 0,4090 3,18
Race 2: Coloured 0,57 0,937 0,608 0,5510 1,77
Race 4: White 0,30 0,791 0,382 0,5510 1,35
Edu level 1: Grade 1 – 7 -0,10 1,118 -0,089 0,9299 0,91
Edu level 2: Grade 8 - 12 0,97 1,069 0,909 0,3755 2,64
Edu level 3: Grade 12 + diploma 1,25 1,381 0,903 0,3783 3,48
Edu level 4: Bachelors’ degree 0,74 1,309 0,563 0,5805 2,09
Special police operation -0,75 0,533 -1,409 0,1759 0,47
Comm. crime prev. forum (Yes) 1,48 0,605 2,450 0,0247 * 4,40
Time to police 2: 31 min – 60 min 0,12 0,547 0,217 0,8306 0,89 Time to police 3: 61 min – 120 min 1,62 0,901 1,795 0,0894 5,04
Emergency call response time -0,32 0,196 -1,640 0,1183 0,72
In the above results, Asian/Indian race, education levels above 4 and distance to the police station level
4 (more than 2 hours) were removed from the analysis due to the small number of observations on these
levels. The results above show that only the existence of a community crime prevention forum and
distance to police station have significant influence on the odds of reporting home robbery. Distance to
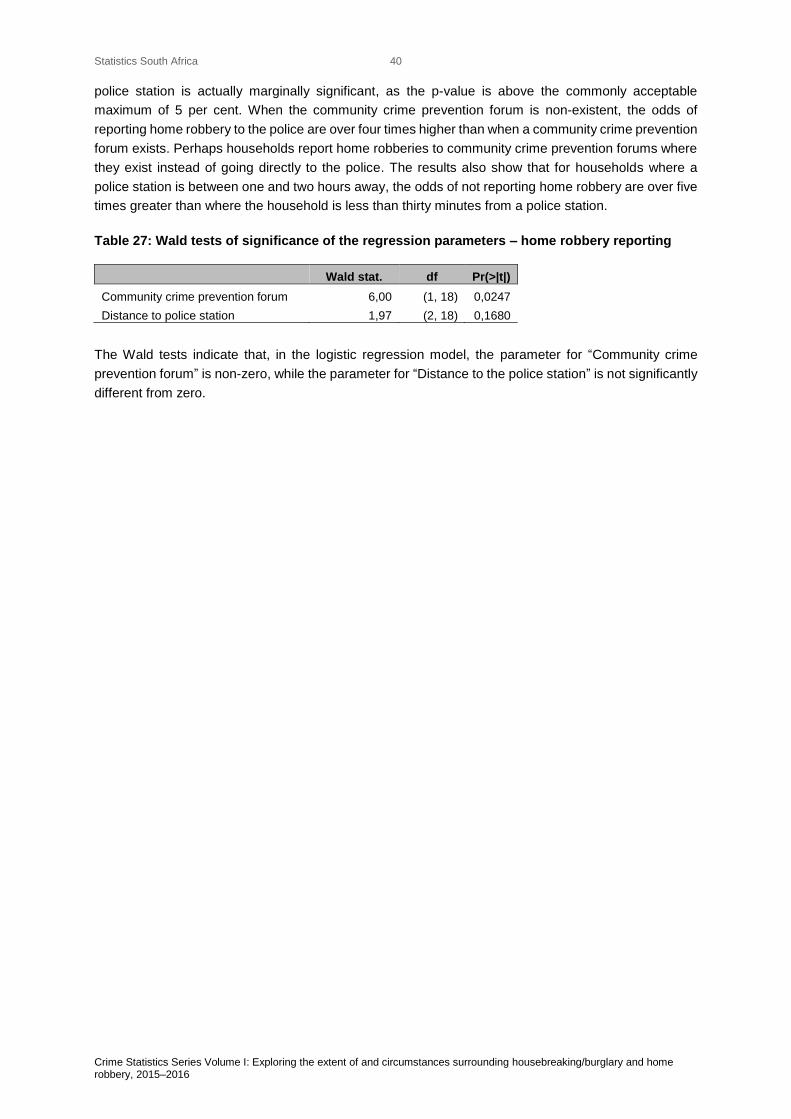
Statistics South Africa
Crime Statistics Series Volume I: Exploring the extent of and circumstances surrounding housebreaking/burglary and home robbery, 2015–2016
40
police station is actually marginally significant, as the p-value is above the commonly acceptable
maximum of 5 per cent. When the community crime prevention forum is non-existent, the odds of
reporting home robbery to the police are over four times higher than when a community crime prevention
forum exists. Perhaps households report home robberies to community crime prevention forums where
they exist instead of going directly to the police. The results also show that for households where a
police station is between one and two hours away, the odds of not reporting home robbery are over five
times greater than where the household is less than thirty minutes from a police station.
Table 27: Wald tests of significance of the regression parameters – home robbery reporting
Wald stat. df Pr(>|t|)
Community crime prevention forum 6,00 (1, 18) 0,0247
Distance to police station 1,97 (2, 18) 0,1680
The Wald tests indicate that, in the logistic regression model, the parameter for “Community crime
prevention forum” is non-zero, while the parameter for “Distance to the police station” is not significantly
different from zero.
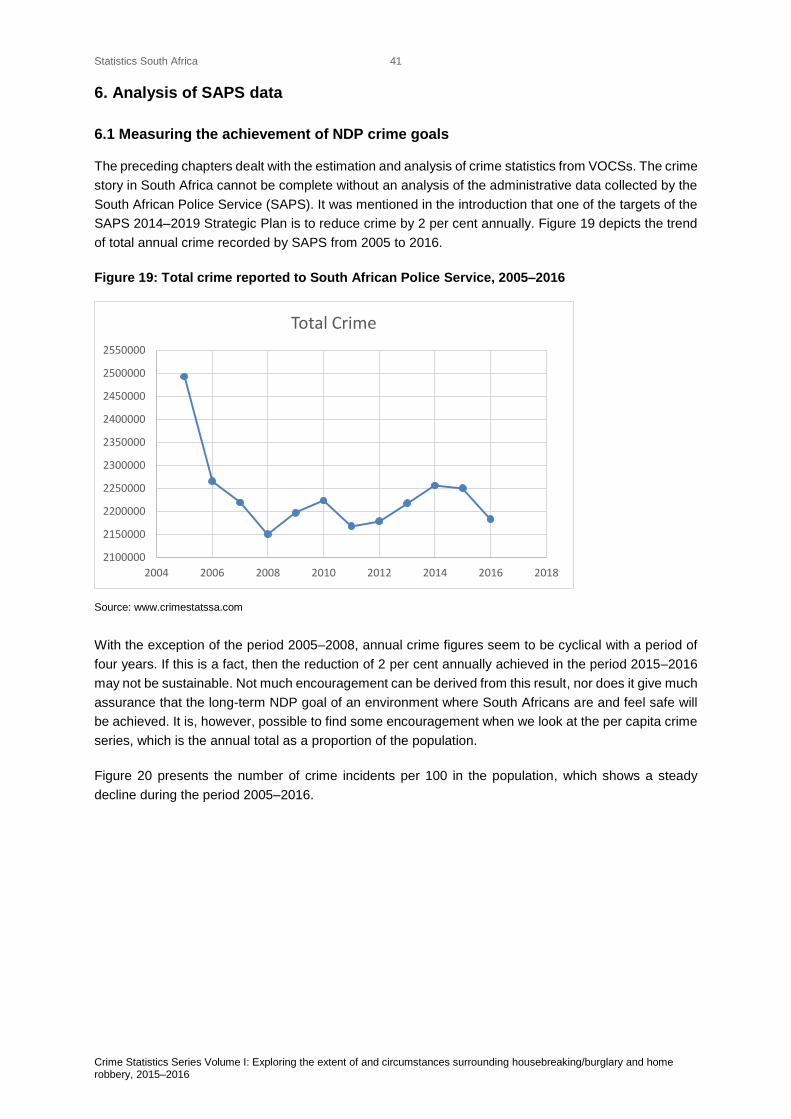
Statistics South Africa
Crime Statistics Series Volume I: Exploring the extent of and circumstances surrounding housebreaking/burglary and home robbery, 2015–2016
41
6. Analysis of SAPS data
6.1 Measuring the achievement of NDP crime goals
The preceding chapters dealt with the estimation and analysis of crime statistics from VOCSs. The crime
story in South Africa cannot be complete without an analysis of the administrative data collected by the
South African Police Service (SAPS). It was mentioned in the introduction that one of the targets of the
SAPS 2014–2019 Strategic Plan is to reduce crime by 2 per cent annually. Figure 19 depicts the trend
of total annual crime recorded by SAPS from 2005 to 2016.
Figure 19: Total crime reported to South African Police Service, 2005–2016
Source: www.crimestatssa.com
With the exception of the period 2005–2008, annual crime figures seem to be cyclical with a period of
four years. If this is a fact, then the reduction of 2 per cent annually achieved in the period 2015–2016
may not be sustainable. Not much encouragement can be derived from this result, nor does it give much
assurance that the long-term NDP goal of an environment where South Africans are and feel safe will
be achieved. It is, however, possible to find some encouragement when we look at the per capita crime
series, which is the annual total as a proportion of the population.
Figure 20 presents the number of crime incidents per 100 in the population, which shows a steady
decline during the period 2005–2016.
2100000
2150000
2200000
2250000
2300000
2350000
2400000
2450000
2500000
2550000
2004 2006 2008 2010 2012 2014 2016 2018
Total Crime
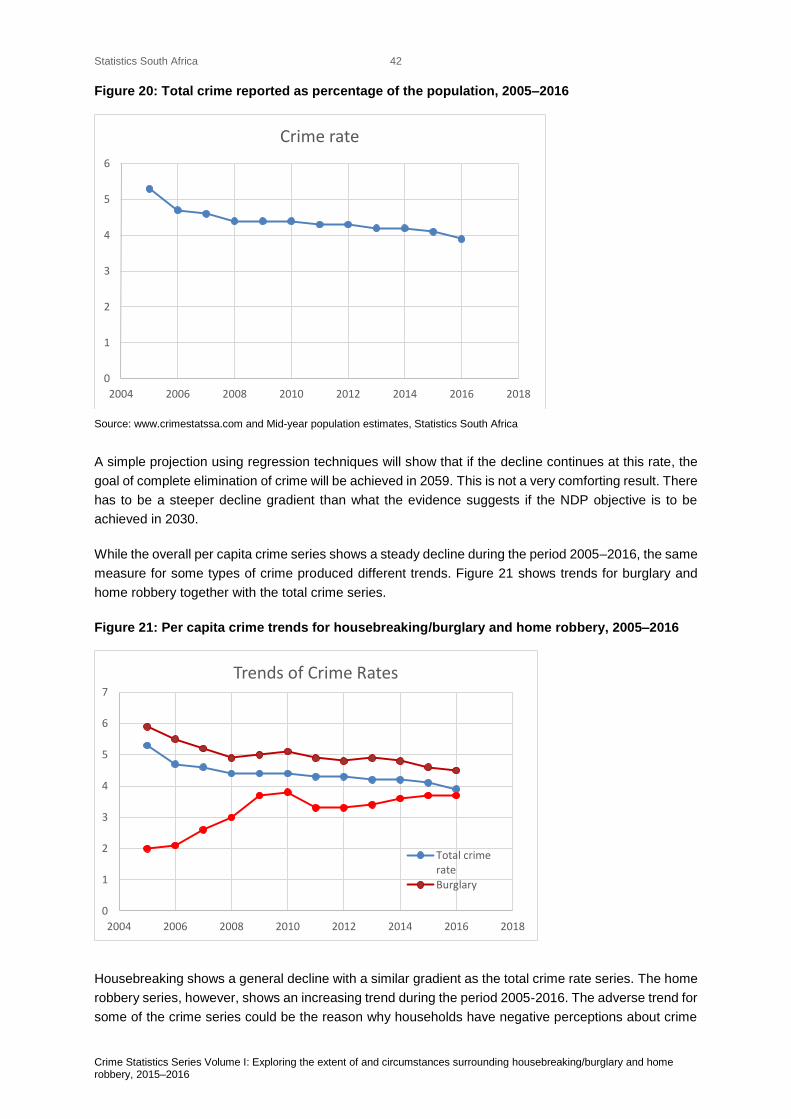
Statistics South Africa
Crime Statistics Series Volume I: Exploring the extent of and circumstances surrounding housebreaking/burglary and home robbery, 2015–2016
42
Figure 20: Total crime reported as percentage of the population, 2005–2016
Source: www.crimestatssa.com and Mid-year population estimates, Statistics South Africa
A simple projection using regression techniques will show that if the decline continues at this rate, the
goal of complete elimination of crime will be achieved in 2059. This is not a very comforting result. There
has to be a steeper decline gradient than what the evidence suggests if the NDP objective is to be
achieved in 2030.
While the overall per capita crime series shows a steady decline during the period 2005–2016, the same
measure for some types of crime produced different trends. Figure 21 shows trends for burglary and
home robbery together with the total crime series.
Figure 21: Per capita crime trends for housebreaking/burglary and home robbery, 2005–2016
Housebreaking shows a general decline with a similar gradient as the total crime rate series. The home
robbery series, however, shows an increasing trend during the period 2005-2016. The adverse trend for
some of the crime series could be the reason why households have negative perceptions about crime
0
1
2
3
4
5
6
2004 2006 2008 2010 2012 2014 2016 2018
Crime rate
0
1
2
3
4
5
6
7
2004 2006 2008 2010 2012 2014 2016 2018
Trends of Crime Rates
Total crimerateBurglary
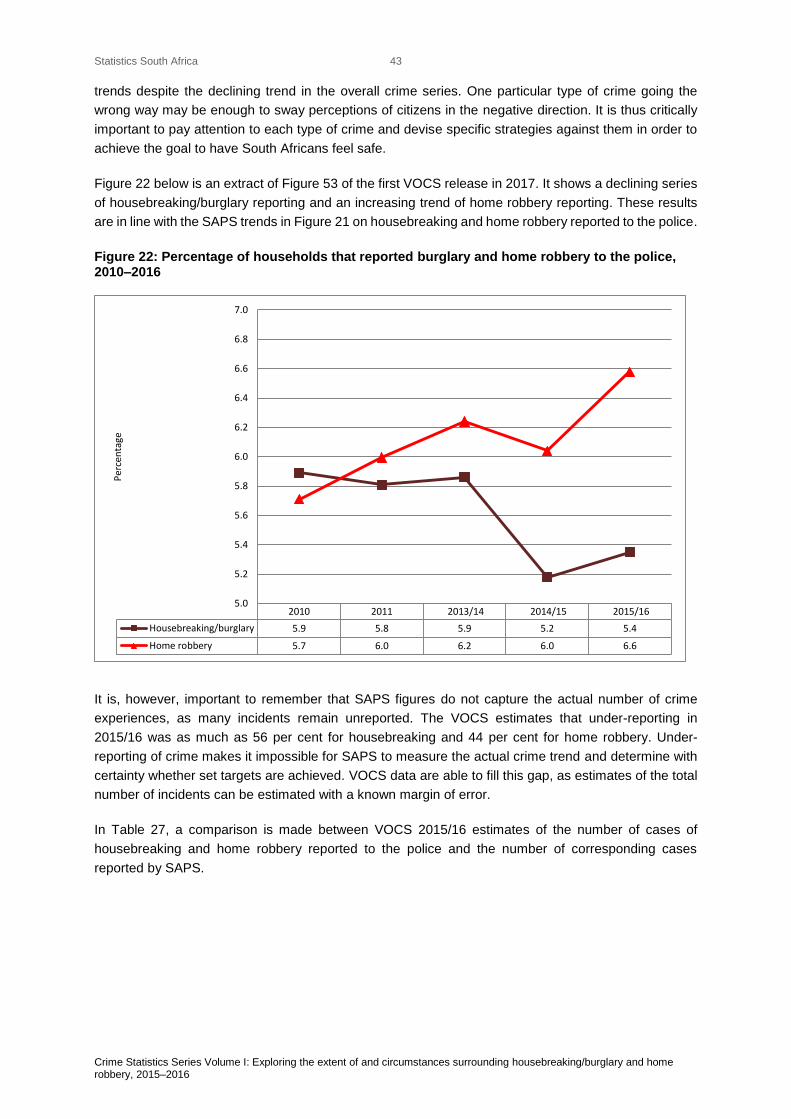
Statistics South Africa
Crime Statistics Series Volume I: Exploring the extent of and circumstances surrounding housebreaking/burglary and home robbery, 2015–2016
43
trends despite the declining trend in the overall crime series. One particular type of crime going the
wrong way may be enough to sway perceptions of citizens in the negative direction. It is thus critically
important to pay attention to each type of crime and devise specific strategies against them in order to
achieve the goal to have South Africans feel safe.
Figure 22 below is an extract of Figure 53 of the first VOCS release in 2017. It shows a declining series
of housebreaking/burglary reporting and an increasing trend of home robbery reporting. These results
are in line with the SAPS trends in Figure 21 on housebreaking and home robbery reported to the police.
Figure 22: Percentage of households that reported burglary and home robbery to the police, 2010–2016
It is, however, important to remember that SAPS figures do not capture the actual number of crime
experiences, as many incidents remain unreported. The VOCS estimates that under-reporting in
2015/16 was as much as 56 per cent for housebreaking and 44 per cent for home robbery. Under-
reporting of crime makes it impossible for SAPS to measure the actual crime trend and determine with
certainty whether set targets are achieved. VOCS data are able to fill this gap, as estimates of the total
number of incidents can be estimated with a known margin of error.
In Table 27, a comparison is made between VOCS 2015/16 estimates of the number of cases of
housebreaking and home robbery reported to the police and the number of corresponding cases
reported by SAPS.
2010 2011 2013/14 2014/15 2015/16
Housebreaking/burglary 5.9 5.8 5.9 5.2 5.4
Home robbery 5.7 6.0 6.2 6.0 6.6
5.0
5.2
5.4
5.6
5.8
6.0
6.2
6.4
6.6
6.8
7.0
Per
cen
tage
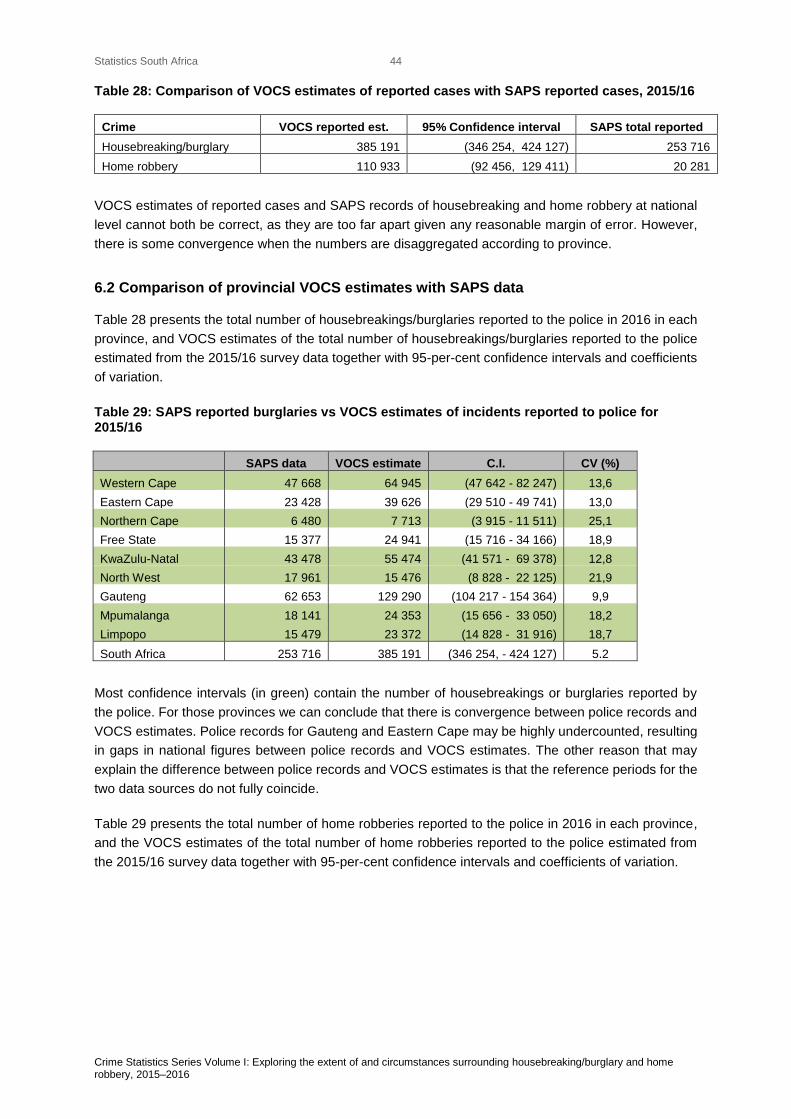
Statistics South Africa
Crime Statistics Series Volume I: Exploring the extent of and circumstances surrounding housebreaking/burglary and home robbery, 2015–2016
44
Table 28: Comparison of VOCS estimates of reported cases with SAPS reported cases, 2015/16
Crime VOCS reported est. 95% Confidence interval SAPS total reported
Housebreaking/burglary 385 191 (346 254, 424 127) 253 716
Home robbery 110 933 (92 456, 129 411) 20 281
VOCS estimates of reported cases and SAPS records of housebreaking and home robbery at national
level cannot both be correct, as they are too far apart given any reasonable margin of error. However,
there is some convergence when the numbers are disaggregated according to province.
6.2 Comparison of provincial VOCS estimates with SAPS data
Table 28 presents the total number of housebreakings/burglaries reported to the police in 2016 in each
province, and VOCS estimates of the total number of housebreakings/burglaries reported to the police
estimated from the 2015/16 survey data together with 95-per-cent confidence intervals and coefficients
of variation.
Table 29: SAPS reported burglaries vs VOCS estimates of incidents reported to police for 2015/16
SAPS data VOCS estimate C.I. CV (%)
Western Cape 47 668 64 945 (47 642 - 82 247) 13,6
Eastern Cape 23 428 39 626 (29 510 - 49 741) 13,0
Northern Cape 6 480 7 713 (3 915 - 11 511) 25,1
Free State 15 377 24 941 (15 716 - 34 166) 18,9
KwaZulu-Natal 43 478 55 474 (41 571 - 69 378) 12,8
North West 17 961 15 476 (8 828 - 22 125) 21,9
Gauteng 62 653 129 290 (104 217 - 154 364) 9,9
Mpumalanga 18 141 24 353 (15 656 - 33 050) 18,2
Limpopo 15 479 23 372 (14 828 - 31 916) 18,7
South Africa 253 716 385 191 (346 254, - 424 127) 5.2
Most confidence intervals (in green) contain the number of housebreakings or burglaries reported by
the police. For those provinces we can conclude that there is convergence between police records and
VOCS estimates. Police records for Gauteng and Eastern Cape may be highly undercounted, resulting
in gaps in national figures between police records and VOCS estimates. The other reason that may
explain the difference between police records and VOCS estimates is that the reference periods for the
two data sources do not fully coincide.
Table 29 presents the total number of home robberies reported to the police in 2016 in each province,
and the VOCS estimates of the total number of home robberies reported to the police estimated from
the 2015/16 survey data together with 95-per-cent confidence intervals and coefficients of variation.
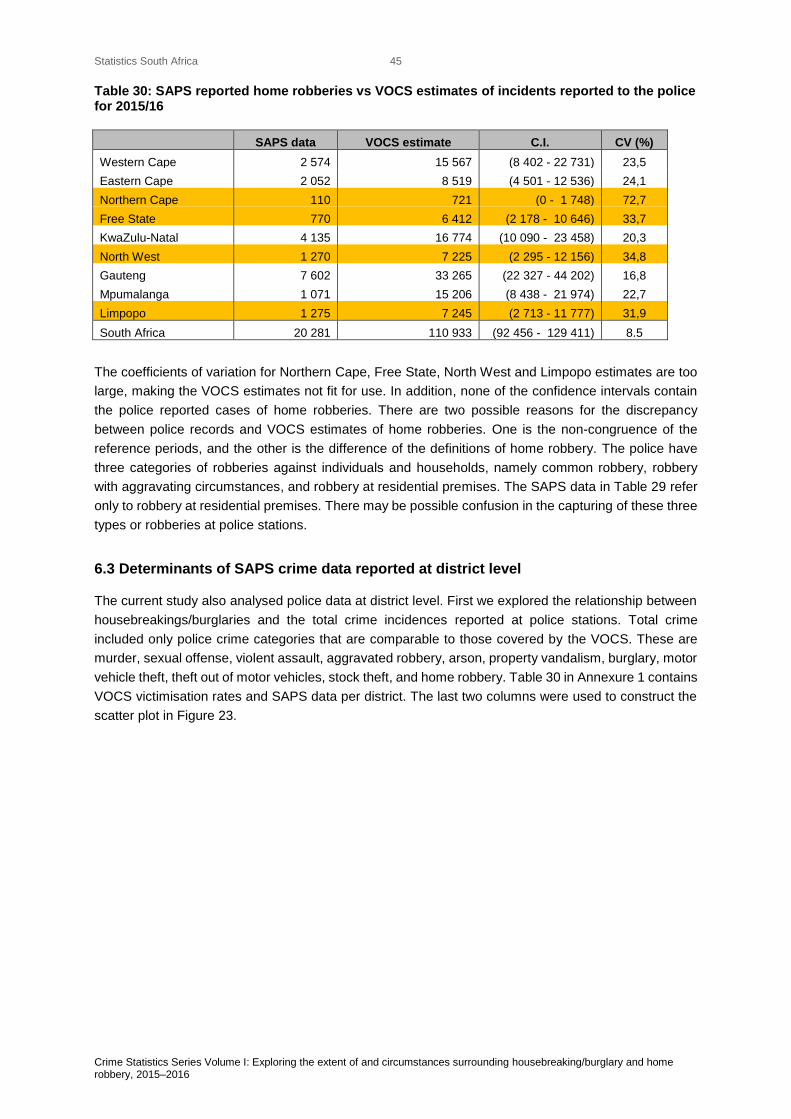
Statistics South Africa
Crime Statistics Series Volume I: Exploring the extent of and circumstances surrounding housebreaking/burglary and home robbery, 2015–2016
45
Table 30: SAPS reported home robberies vs VOCS estimates of incidents reported to the police for 2015/16
SAPS data VOCS estimate C.I. CV (%)
Western Cape 2 574 15 567 (8 402 - 22 731) 23,5
Eastern Cape 2 052 8 519 (4 501 - 12 536) 24,1
Northern Cape 110 721 (0 - 1 748) 72,7
Free State 770 6 412 (2 178 - 10 646) 33,7
KwaZulu-Natal 4 135 16 774 (10 090 - 23 458) 20,3
North West 1 270 7 225 (2 295 - 12 156) 34,8
Gauteng 7 602 33 265 (22 327 - 44 202) 16,8
Mpumalanga 1 071 15 206 (8 438 - 21 974) 22,7
Limpopo 1 275 7 245 (2 713 - 11 777) 31,9
South Africa 20 281 110 933 (92 456 - 129 411) 8.5
The coefficients of variation for Northern Cape, Free State, North West and Limpopo estimates are too
large, making the VOCS estimates not fit for use. In addition, none of the confidence intervals contain
the police reported cases of home robberies. There are two possible reasons for the discrepancy
between police records and VOCS estimates of home robberies. One is the non-congruence of the
reference periods, and the other is the difference of the definitions of home robbery. The police have
three categories of robberies against individuals and households, namely common robbery, robbery
with aggravating circumstances, and robbery at residential premises. The SAPS data in Table 29 refer
only to robbery at residential premises. There may be possible confusion in the capturing of these three
types or robberies at police stations.
6.3 Determinants of SAPS crime data reported at district level
The current study also analysed police data at district level. First we explored the relationship between
housebreakings/burglaries and the total crime incidences reported at police stations. Total crime
included only police crime categories that are comparable to those covered by the VOCS. These are
murder, sexual offense, violent assault, aggravated robbery, arson, property vandalism, burglary, motor
vehicle theft, theft out of motor vehicles, stock theft, and home robbery. Table 30 in Annexure 1 contains
VOCS victimisation rates and SAPS data per district. The last two columns were used to construct the
scatter plot in Figure 23.
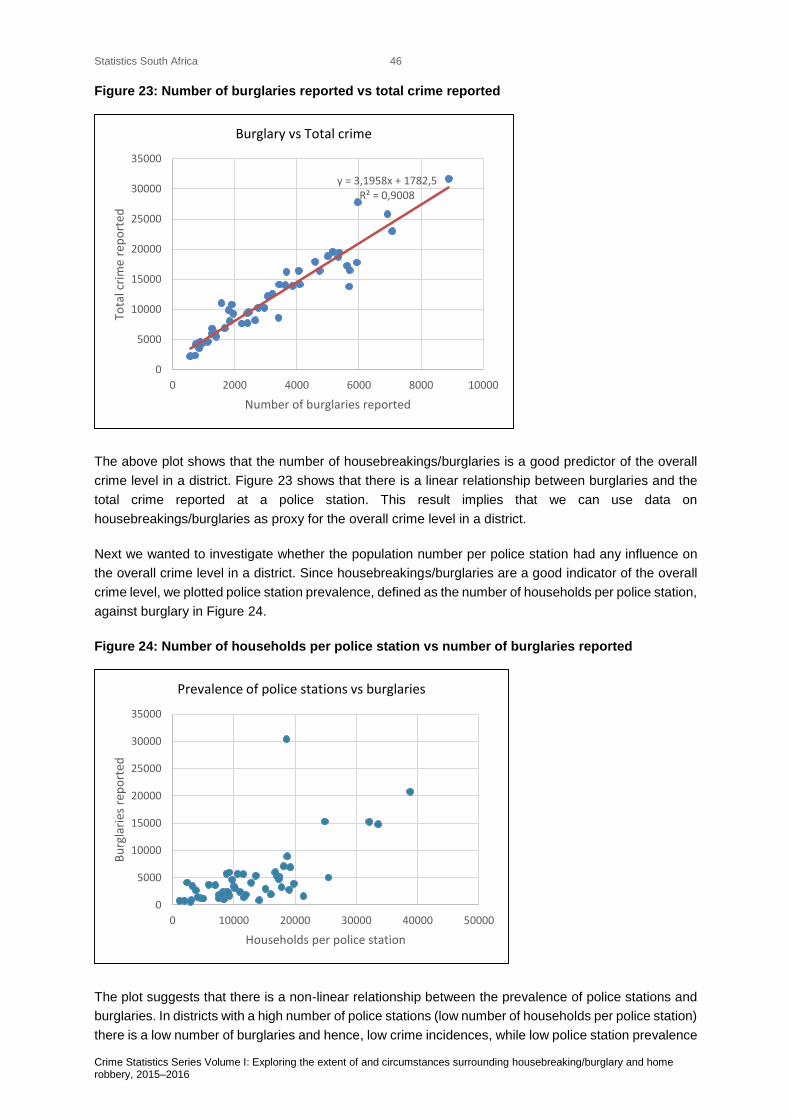
Statistics South Africa
Crime Statistics Series Volume I: Exploring the extent of and circumstances surrounding housebreaking/burglary and home robbery, 2015–2016
46
Figure 23: Number of burglaries reported vs total crime reported
The above plot shows that the number of housebreakings/burglaries is a good predictor of the overall
crime level in a district. Figure 23 shows that there is a linear relationship between burglaries and the
total crime reported at a police station. This result implies that we can use data on
housebreakings/burglaries as proxy for the overall crime level in a district.
Next we wanted to investigate whether the population number per police station had any influence on
the overall crime level in a district. Since housebreakings/burglaries are a good indicator of the overall
crime level, we plotted police station prevalence, defined as the number of households per police station,
against burglary in Figure 24.
Figure 24: Number of households per police station vs number of burglaries reported
The plot suggests that there is a non-linear relationship between the prevalence of police stations and
burglaries. In districts with a high number of police stations (low number of households per police station)
there is a low number of burglaries and hence, low crime incidences, while low police station prevalence
y = 3,1958x + 1782,5R² = 0,9008
0
5000
10000
15000
20000
25000
30000
35000
0 2000 4000 6000 8000 10000
Tota
l cri
me
rep
ort
ed
Number of burglaries reported
Burglary vs Total crime
0
5000
10000
15000
20000
25000
30000
35000
0 10000 20000 30000 40000 50000
Bu
rgla
ries
rep
ort
ed
Households per police station
Prevalence of police stations vs burglaries
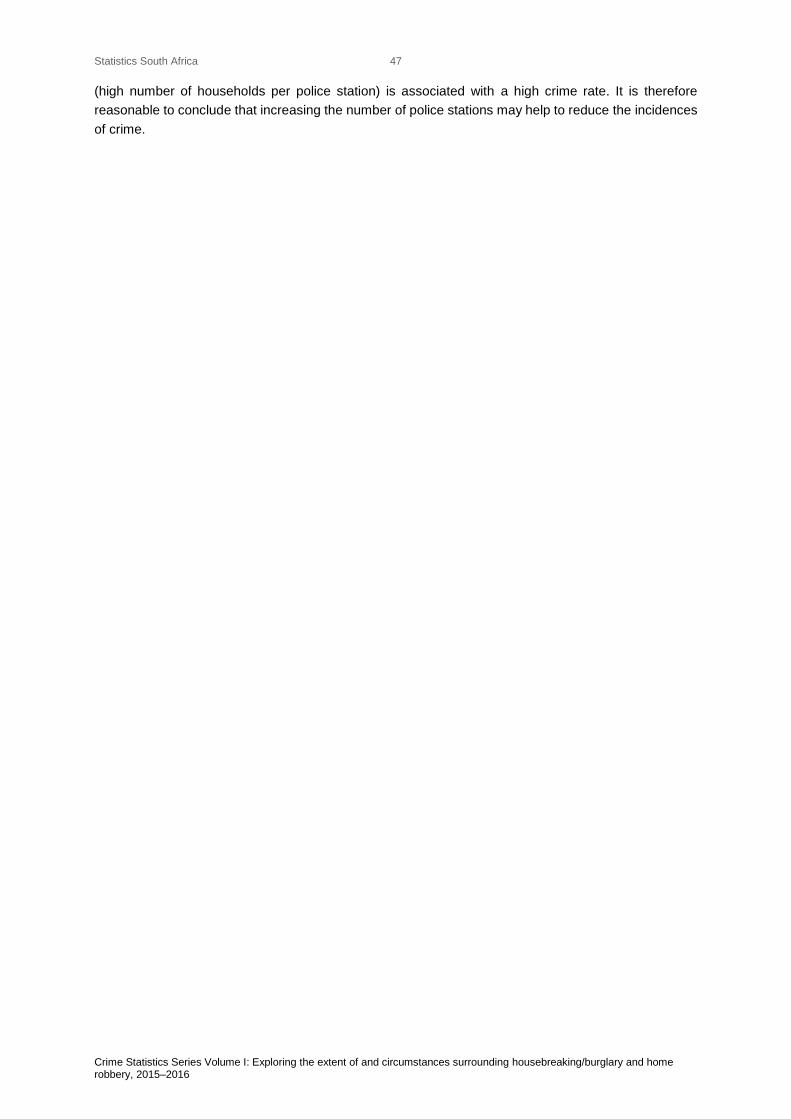
Statistics South Africa
Crime Statistics Series Volume I: Exploring the extent of and circumstances surrounding housebreaking/burglary and home robbery, 2015–2016
47
(high number of households per police station) is associated with a high crime rate. It is therefore
reasonable to conclude that increasing the number of police stations may help to reduce the incidences
of crime.
Statistics South Africa
Crime Statistics Series Volume I: Exploring the extent of and circumstances surrounding housebreaking/burglary and home robbery, 2015–2016
48
7. Conclusions and recommendations
7.1 Conclusions
Creating a nation where its citizens are safe and feel safe is one of the goals of the National
Development Plan, and these goals are expected to be fully achieved by 2030. The Medium Term
Strategic Framework is a vehicle that ensures that the nation is heading towards the goal, among other
goals, in stages. Progress towards the goal needs to be regularly monitored and evaluated to make sure
that the country is on track. SAPS crime statistics is a primary source of information for monitoring and
evaluation of crime in the country. However, SAPS data are inadequate, mainly because it depends on
voluntary reporting by individuals and institutions. Various research reports have shown that the levels
of under-reporting of crime are very high (as much as 70 per cent for theft of livestock). SAPS crime
statistics therefore present only a portion of the crime picture in the country, even if the capturing of data
was error free.
The Victims of Crime Survey (VOCS) is one of the attempts to address the gaps in the SAPS statistics.
Using a random sample drawn from the whole country it is possible to estimate the number of crime
incidents under specified margins of error. The VOCS sample design is scientific and follows strict
methodological processes, and therefore the estimates can be trusted with a high degree of confidence.
However, VOCS data have limitations of their own. The greatest limitation is that the sample size is not
large enough to make it possible to estimate at lower levels of geography, that is, municipality level and
lower. Even estimation at district level is possible for just over 50 per cent of the larger districts. Therefore
VOCS data do not provide information for monitoring and evaluating the national goal on crime at local
government level.
Notwithstanding the gaps in the SAPS statistics and the limitations of the VOCS data, these two main
sources of crime data provide useful information to guide policy and interventions on crime. Results from
both sources have shown that there is an ongoing improvement of aggregate crime levels when one
looks at the numbers as a proportion of population size (or total number of households). The term “per
capita crime rate” was used in the previous chapter in relation to SAPS data on housebreaking and
home robbery. This seems to be a better way to present and assess crime data as opposed to drawing
conclusions from absolute numbers. In absolute numbers, the total number of crime incidents may have
increased, but the rate relative to population size crime may actually have decreased.
Although the aggregate crime rate has been decreasing over the past five years (ten years for SAPS
data), perceptions of household representatives have not followed the same trend. Every measure of
perceptions of crime used in the VOCS shows a negative trend. The proportion of household heads who
think that crime has been escalating during the last three years is increasing, while the number of those
who think crime has been declining during the last three years is decreasing. The proportion of
household heads who feel safe walking alone in their neighbourhoods at night has been decreasing.
Clearly these indicators suggest that the country is not heading towards the goal “All South Africans feel
safe”, even though evidence on actual experience of crime shows that South Africa is becoming safer.
It would be useful to be able to explain the apparent discrepancy between perception and reality.
One possible explanation for the discrepancy between perception and evidence is that the evidence is
presented in terms of aggregate crime levels, while individuals and households focus on trends of
specific types of crime. Data from both SAPS and VOCS show that rates of some types of crime have
been increasing. The SAPS data in Figure 21 show that home robbery has been increasing between
2005 and 2016. An individual respondent would most likely conclude that crime is increasing if one type
of crime is increasing even if the aggregate crime rate is decreasing. Another possible explanation is
the intensity of media coverage of crime. Constant bombardment of crime reports on various media
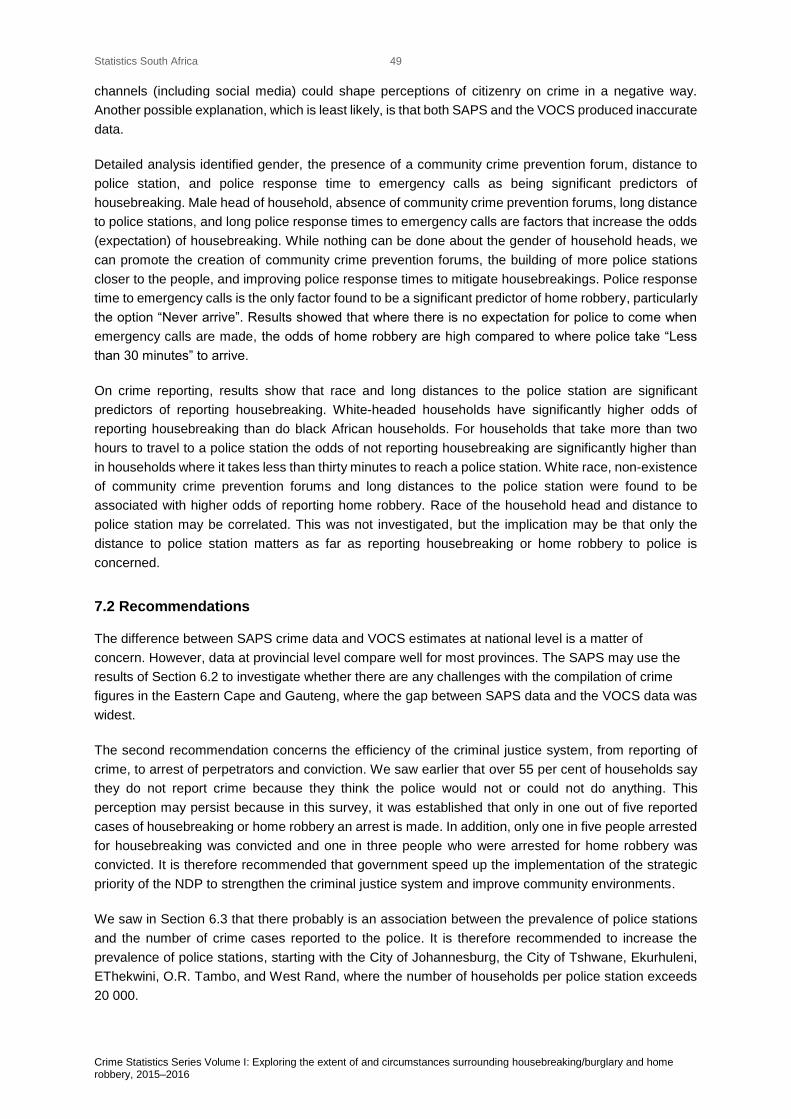
Statistics South Africa
Crime Statistics Series Volume I: Exploring the extent of and circumstances surrounding housebreaking/burglary and home robbery, 2015–2016
49
channels (including social media) could shape perceptions of citizenry on crime in a negative way.
Another possible explanation, which is least likely, is that both SAPS and the VOCS produced inaccurate
data.
Detailed analysis identified gender, the presence of a community crime prevention forum, distance to
police station, and police response time to emergency calls as being significant predictors of
housebreaking. Male head of household, absence of community crime prevention forums, long distance
to police stations, and long police response times to emergency calls are factors that increase the odds
(expectation) of housebreaking. While nothing can be done about the gender of household heads, we
can promote the creation of community crime prevention forums, the building of more police stations
closer to the people, and improving police response times to mitigate housebreakings. Police response
time to emergency calls is the only factor found to be a significant predictor of home robbery, particularly
the option “Never arrive”. Results showed that where there is no expectation for police to come when
emergency calls are made, the odds of home robbery are high compared to where police take “Less
than 30 minutes” to arrive.
On crime reporting, results show that race and long distances to the police station are significant
predictors of reporting housebreaking. White-headed households have significantly higher odds of
reporting housebreaking than do black African households. For households that take more than two
hours to travel to a police station the odds of not reporting housebreaking are significantly higher than
in households where it takes less than thirty minutes to reach a police station. White race, non-existence
of community crime prevention forums and long distances to the police station were found to be
associated with higher odds of reporting home robbery. Race of the household head and distance to
police station may be correlated. This was not investigated, but the implication may be that only the
distance to police station matters as far as reporting housebreaking or home robbery to police is
concerned.
7.2 Recommendations
The difference between SAPS crime data and VOCS estimates at national level is a matter of
concern. However, data at provincial level compare well for most provinces. The SAPS may use the
results of Section 6.2 to investigate whether there are any challenges with the compilation of crime
figures in the Eastern Cape and Gauteng, where the gap between SAPS data and the VOCS data was
widest.
The second recommendation concerns the efficiency of the criminal justice system, from reporting of
crime, to arrest of perpetrators and conviction. We saw earlier that over 55 per cent of households say
they do not report crime because they think the police would not or could not do anything. This
perception may persist because in this survey, it was established that only in one out of five reported
cases of housebreaking or home robbery an arrest is made. In addition, only one in five people arrested
for housebreaking was convicted and one in three people who were arrested for home robbery was
convicted. It is therefore recommended that government speed up the implementation of the strategic
priority of the NDP to strengthen the criminal justice system and improve community environments.
We saw in Section 6.3 that there probably is an association between the prevalence of police stations
and the number of crime cases reported to the police. It is therefore recommended to increase the
prevalence of police stations, starting with the City of Johannesburg, the City of Tshwane, Ekurhuleni,
EThekwini, O.R. Tambo, and West Rand, where the number of households per police station exceeds
20 000.
Statistics South Africa
Crime Statistics Series Volume I: Exploring the extent of and circumstances surrounding housebreaking/burglary and home robbery, 2015–2016
50
Other recommendations emanate from the logistic regression analysis, which identified several
predictors of housebreaking and home robbery. Although there may be no direct causal relationship
between these predictors and incidences or reporting of crime, it is reasonable to implement these
measures because they appeal to common sense as well. The following are measures that could be
taken to mitigate crime in the country:
Encourage the creation of and participation in community crime prevention forums especially in urban
informal settlements.
Increase the number of police stations to bring them closer to the people.
Improve police response time.
Statistics South Africa
Crime Statistics Series Volume I: Exploring the extent of and circumstances surrounding housebreaking/burglary and home robbery, 2015–2016
51
8. References
1. Bill of Rights of the Constitution of the Republic of South Africa, No. 108 of 1996. 1996.
Government Gazette No. 17678.
2. Heeringa, S.G., West, B.T. & Berglund, P.A. 2010. Applied Survey Data Analysis, Chapman &
Hall/CRC, Statistics in the Social and Behavioral Sciences Series.
3. Hosmer, D.W. & Lemeshow, S. 2000. Applied Logistic Regression, 2nd ed., John Wiley & Sons,
New York.
4. Lumley, T. 2016. Analysis of Complex Survey Samples, Package ‘survey’.
5. National Planning Commission (NPC). 2012. National Development Plan, 2030 (Executive
Summary). NPC. Pretoria: The Presidency.
6. South African Police Service. 2012. Analysis of the National Crime Statistics. Addendum to the
Annual Report 2011/2012. Pretoria: South African Police Service.
7. Statistics South Africa. 2011. Census 2011: Provinces at a glance. Report No. 03-01-43. Statistics
South Africa, Pretoria.
8. Statistics South Africa. 2011. Victims of Crime Survey (VOCS): Statistical Release P0341.
Statistics South Africa, Pretoria.
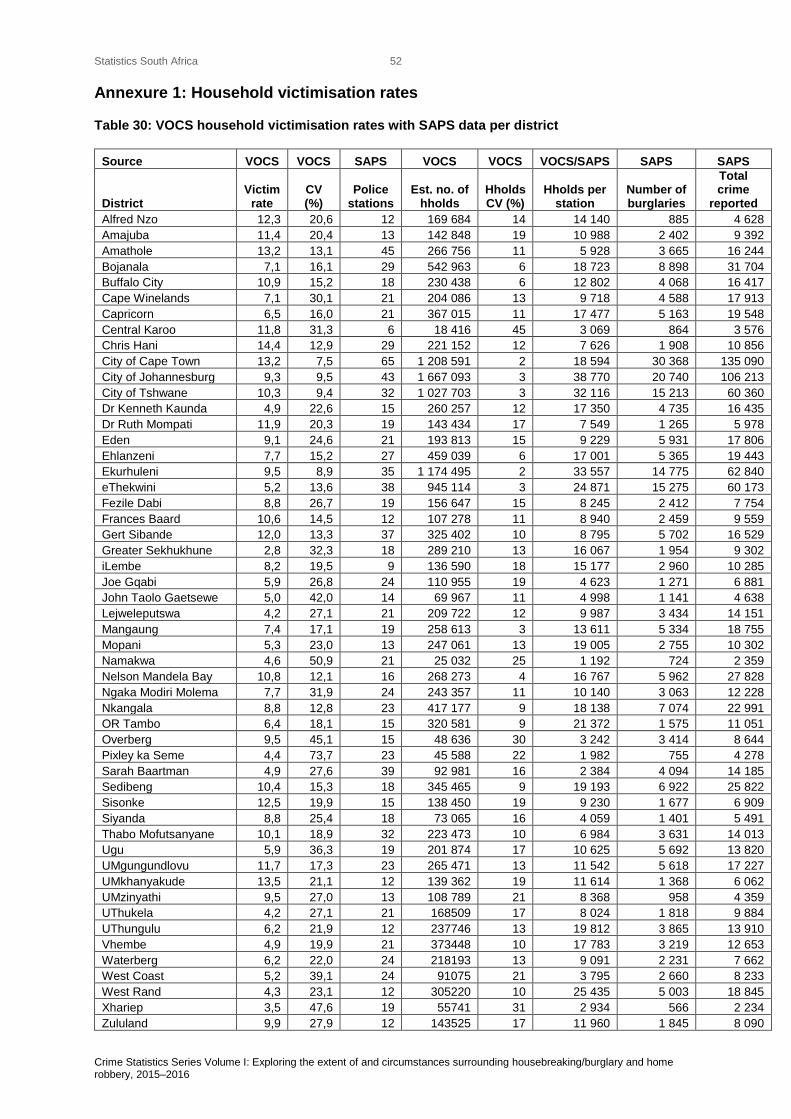
Statistics South Africa
Crime Statistics Series Volume I: Exploring the extent of and circumstances surrounding housebreaking/burglary and home robbery, 2015–2016
52
Annexure 1: Household victimisation rates
Table 30: VOCS household victimisation rates with SAPS data per district
Source VOCS VOCS SAPS VOCS VOCS VOCS/SAPS SAPS SAPS
District Victim
rate CV (%)
Police stations
Est. no. of hholds
Hholds CV (%)
Hholds per station
Number of burglaries
Total crime
reported
Alfred Nzo 12,3 20,6 12 169 684 14 14 140 885 4 628
Amajuba 11,4 20,4 13 142 848 19 10 988 2 402 9 392
Amathole 13,2 13,1 45 266 756 11 5 928 3 665 16 244
Bojanala 7,1 16,1 29 542 963 6 18 723 8 898 31 704
Buffalo City 10,9 15,2 18 230 438 6 12 802 4 068 16 417
Cape Winelands 7,1 30,1 21 204 086 13 9 718 4 588 17 913
Capricorn 6,5 16,0 21 367 015 11 17 477 5 163 19 548
Central Karoo 11,8 31,3 6 18 416 45 3 069 864 3 576
Chris Hani 14,4 12,9 29 221 152 12 7 626 1 908 10 856
City of Cape Town 13,2 7,5 65 1 208 591 2 18 594 30 368 135 090
City of Johannesburg 9,3 9,5 43 1 667 093 3 38 770 20 740 106 213
City of Tshwane 10,3 9,4 32 1 027 703 3 32 116 15 213 60 360
Dr Kenneth Kaunda 4,9 22,6 15 260 257 12 17 350 4 735 16 435
Dr Ruth Mompati 11,9 20,3 19 143 434 17 7 549 1 265 5 978
Eden 9,1 24,6 21 193 813 15 9 229 5 931 17 806
Ehlanzeni 7,7 15,2 27 459 039 6 17 001 5 365 19 443
Ekurhuleni 9,5 8,9 35 1 174 495 2 33 557 14 775 62 840
eThekwini 5,2 13,6 38 945 114 3 24 871 15 275 60 173
Fezile Dabi 8,8 26,7 19 156 647 15 8 245 2 412 7 754
Frances Baard 10,6 14,5 12 107 278 11 8 940 2 459 9 559
Gert Sibande 12,0 13,3 37 325 402 10 8 795 5 702 16 529
Greater Sekhukhune 2,8 32,3 18 289 210 13 16 067 1 954 9 302
iLembe 8,2 19,5 9 136 590 18 15 177 2 960 10 285
Joe Gqabi 5,9 26,8 24 110 955 19 4 623 1 271 6 881
John Taolo Gaetsewe 5,0 42,0 14 69 967 11 4 998 1 141 4 638
Lejweleputswa 4,2 27,1 21 209 722 12 9 987 3 434 14 151
Mangaung 7,4 17,1 19 258 613 3 13 611 5 334 18 755
Mopani 5,3 23,0 13 247 061 13 19 005 2 755 10 302
Namakwa 4,6 50,9 21 25 032 25 1 192 724 2 359
Nelson Mandela Bay 10,8 12,1 16 268 273 4 16 767 5 962 27 828
Ngaka Modiri Molema 7,7 31,9 24 243 357 11 10 140 3 063 12 228
Nkangala 8,8 12,8 23 417 177 9 18 138 7 074 22 991
OR Tambo 6,4 18,1 15 320 581 9 21 372 1 575 11 051
Overberg 9,5 45,1 15 48 636 30 3 242 3 414 8 644
Pixley ka Seme 4,4 73,7 23 45 588 22 1 982 755 4 278
Sarah Baartman 4,9 27,6 39 92 981 16 2 384 4 094 14 185
Sedibeng 10,4 15,3 18 345 465 9 19 193 6 922 25 822
Sisonke 12,5 19,9 15 138 450 19 9 230 1 677 6 909
Siyanda 8,8 25,4 18 73 065 16 4 059 1 401 5 491
Thabo Mofutsanyane 10,1 18,9 32 223 473 10 6 984 3 631 14 013
Ugu 5,9 36,3 19 201 874 17 10 625 5 692 13 820
UMgungundlovu 11,7 17,3 23 265 471 13 11 542 5 618 17 227
UMkhanyakude 13,5 21,1 12 139 362 19 11 614 1 368 6 062
UMzinyathi 9,5 27,0 13 108 789 21 8 368 958 4 359
UThukela 4,2 27,1 21 168509 17 8 024 1 818 9 884
UThungulu 6,2 21,9 12 237746 13 19 812 3 865 13 910
Vhembe 4,9 19,9 21 373448 10 17 783 3 219 12 653
Waterberg 6,2 22,0 24 218193 13 9 091 2 231 7 662
West Coast 5,2 39,1 24 91075 21 3 795 2 660 8 233
West Rand 4,3 23,1 12 305220 10 25 435 5 003 18 845
Xhariep 3,5 47,6 19 55741 31 2 934 566 2 234
Zululand 9,9 27,9 12 143525 17 11 960 1 845 8 090
Statistics South Africa
Crime Statistics Series Volume I: Exploring the extent of and circumstances surrounding housebreaking/burglary and home robbery, 2015–2016
53
Annexure 2: R code used in the analysis
setwd("C:/Users/kasonga/Documents/R-workspace") dat1 <- read.table("VOCS2015_16_HOUSEHOLDS_V8hbr0.txt",header=T,sep="\t") attach(dat1) dat1[1:3,] library(survey) colnames(dat1) des1 <-svydesign(id=~PSUNO, strata=~stratum, weights=~weight, data=dat1) summary(des1) ################################################################### svytotal(~Q10bBreak,des1,na.rm=TRUE) svytotal(~Q127CReport,subset(des1,Q10bBreak==1),na.rm=TRUE) svytotal(~factor(arrest),subset(des1,Q127CReport==1),na.rm=TRUE) svytotal(~factor(convicted),subset(des1,arrest==1),na.rm=TRUE) y <- c(385191,71358,10266,6561) lab <- c("Reported","Arrested","Convicted","Case on-going") barplot(y,names=lab,main="Justice in Housebreaking", col="orange") svytotal(~Q10cRob,des1,na.rm=TRUE) svytotal(~Q1312CReport,subset(des1,Q10cRob==1),na.rm=TRUE) svytotal(~factor(rArrest),subset(des1,Q1312CReport==1),na.rm=TRUE) svytotal(~factor(rConvicted),subset(des1,rArrest==1),na.rm=TRUE) y <- c(110933,20897,4590,3095) lab <- c("Reported","Arrested","Convicted","Case on-going") barplot(y,names=lab,main="Justice in Home Robbery", col="brown") ######################################################################## VOCS2015_16_HOUSEHOLDS_V8pe.txt tbl tbl <- svytotal(~CarTheft+HoBreak+HoRobbery+LiTheft+CpTheft+Murder+MoTheft+ DweDist+CarVand+Bicycle+OtherCri,des1,na.rm=TRUE) y <- as.matrix(tbl) piepercent<- round(100*y/sum(y), 1) lab <- c("Theft of motor vehicle","Housebreaking/burglary","Home robbery", "Theft of livestock/poultry and other animals", "Theft of crops planted by household", "Murder","Theft out of motor vehicle","Deliberate damaging of dwellings", "Motor vehicle vandalism","Theft of bicycle","Other crime") cl <- c("blue","green","skyblue","seagreen","yellow","red","orange", "pink","maroon","purple","black") pielabels <- paste(piepercent,"%",sep="") par(mar=c(1,0,3,0)) pie(y,labels=pielabels,main="Distribution of types of crime experienced by households in 2015/16", radius=0.7,col=cl,clockwise=TRUE) legend(-0.9,-0.72, ncol=2,lab, cex = 0.73,fill = cl) piepercent<- sort(round(100*y/sum(y), 1)) barplot(y, names=piepercent,main = "Experience of Crime",col = rainbow(length(y))) legend("topleft", names(y), cex = 0.8, fill = rainbow(length(y))) table(NoDied) svytotal(~one,des1) svytotal(~NoDied,des1) svyratio(~NoDied,~one,des1) 5885.9/19883 svyby(~NoDied, by=~gender, denominator=~one, design=des1, svyratio) dark <- svytotal(~factor(Q29WalkDark),des1,na.rm=TRUE) tbl <- as.matrix(dark) tbl y <- round(100000*tbl[,1]/15583262,0) lab <- c("Very safe","Fairly safe","A bit safe","Very unsafe") cl <- c("yellow","pink","orange","red") barplot(y,names=c("1","2","3","4"),mpiwain = "Number of Households Feeling of Safety in the Dark per 100,000",space=0,col=cl) legend("topleft", names(lab), cex = 0.8,fill = cl)
Statistics South Africa
Crime Statistics Series Volume I: Exploring the extent of and circumstances surrounding housebreaking/burglary and home robbery, 2015–2016
54
#################################################################################### m <- svytotal(~theft+hijack+robbery+sexual+assault+fraud+corruption+other,des1) svytotal(~crime,des1) ma <- as.matrix(m) sum(ma[,1]) sum(y) svytotal(~CarTheft+HoBreak+HoRobbery+LiTheft+CpTheft+Murder+MoTheft+ DweDist+CarVand+Bicycle+OtherCri,des1,na.rm=TRUE) svyratio(~HoCrime,~one,des1,na.rm=TRUE) svyby(~HoCrime, by=~gender, denominator=~one, design=des1, svyratio) svyratio(~rep4_P+rep4_O+rep4,sexual,des1,na.rm=TRUE) svytotal(~rep4_P+rep4_O+rep4,des1,na.rm=TRUE) ######################################################################### svyratio(~bbag+bmoney+belect+bBag+bfood+bjewry+bcell+bother,bloose, des1,na.rm=TRUE) lost <- c(11.2,22.7,57.2,8.0,18.8,24.5,23.4,32.4) lab <- c("Hand bag","Money","Electrical","Travel bag","Food","Jewry","Cellphone","Other") barplot(lost,names=lab,main="Items Stolen during Housebreaking", col="seagreen",las=2) ########################################################################### svyratio(~cbag+cmoney+celect+cBag+cfood+cjewry+ccell+cother,cloose, des1,na.rm=TRUE) lost <- c(17.9,38.6,45.5,5.8,20.5,30.8,43.7,22.8) lab <- c("Hand bag","Money","Electrical","Travel bag","Food","Jewry","Cellphone","Other") barplot(lost,names=lab,main="Items Stolen during Robbery", col="red",las=2) ################################################################################## lost <- matrix(c(11.2,22.7,57.2,8.0,18.8,24.5,23.4,32.4,17.9,38.6,45.5,5.8,20.5,30.8,43.7,22.8),c(8,2)) mat <- t(lost) cl <- c("tan4","orange2") rownames(mat) <- c("Housebreaking","Robbery") lab <- c("Hand bag","Money","Electrical","Travel bag","Food","Jewry","Cellphone","Other") barplot(mat,names=lab,main="Items Stolen during Housebreaking & Robbery", col=cl,las=2, beside=TRUE,ylab="Percentages") legend("topright", rownames(mat), cex = 0.8,fill = cl) ########################################################################################## norep <- svytotal(~factor(bwhynot),subset(des1,Q127Report==2),na.rm=TRUE) mat <- as.matrix(norep) y <- round(mat[,1]/1000,0) lab <- c("Not serious enough","Solved it myself","Inappropriate for police","Reported elsewhere", "Family solved it","No insurance","Police could do nothing","Police would do nothing", "Fear of police","Fear of reprisal","Other reasons","Do not know") par(mar=c(10,7,2,2)) barplot(y,names=lab,main="", col="orange",las=2,ylab="Thousands") ############################################################################################# glm1 <- svyglm(formula = satisfied ~ factor(gender) + factor(race) + factor(Q13EDUL) + factor(arrest) + factor(convicted), ## numbers are too small in "convicted" design = subset(des1,Q127Report==1), family = quasibinomial()) summary(glm1) cbind(exp(glm1$coef)) ####################################################################################### Time of housebreaking and robbery btime <- c(147144,182259,355794,35264) bsum <- sum(btime) rtime <- c(32097,22124,108395,3103) rsum <- sum(rtime) btime/bsum rtime/rsum ctime <- matrix(c(20.4,25.3,49.4,4.9,19.4,13.4,65.4,1.9),c(4,2)) mat <- t(ctime) cl <- c("tan4","orange2")
Statistics South Africa
Crime Statistics Series Volume I: Exploring the extent of and circumstances surrounding housebreaking/burglary and home robbery, 2015–2016
55
rownames(mat) <- c("Housebreaking","Robbery") lab <- c("Morning","Afternoon","Night","Don't know") barplot(mat,names=lab,main="Time when housebreaking & robbery occurs", col=cl,las=2, beside=TRUE,ylab="Percentages") legend("topright", rownames(mat), cex = 0.8,fill = cl) ################################################################################ Justice in housebreaking & robbery just <- matrix(c(18.5,2.7,1.7,18.8,4.1,2.9),c(3,2)) just <- matrix(c(53,18.5,14.3,9.2,64.6,18.8,22,14.8),c(4,2)) mat <- t(just) cl <- c("tan4","orange2") rownames(mat) <- c("Housebreaking","Robbery") lab <- c("Reported","Arrested","Convicted","Case on-going") barplot(mat,names=lab,main="",col=cl,las=1, beside=TRUE,ylab="Percentage") legend("topright", rownames(mat), cex = 0.8,fill = cl) ######################################################################################## Report to Other svytotal(~Q127CReport+breporto,des1,na.rm=TRUE) svytotal(~Q1312CReport+creporto,des1,na.rm=TRUE) brep <- 100*c(382785,299550)/(382785+299550) brep crep <- 100*c(106499,55319)/(106499+55319) crep report <- matrix(c(56.1,43.9,65.8,34.2),c(2,2)) mat <- report cl <- c("navyblue","skyblue") rownames(mat) <- c("Police","Other autorities") lab <- c("Housebreaking","Robbery") par(mar=c(3,5,4,5)) barplot(mat,names=lab,main="Where households report housbeaking & robbery", col=cl,las=1, beside=FALSE,ylab="Percentage",space=1.5) legend("top", rownames(mat), cex = 0.8,fill = cl) ########################################################################################## brepo <- svytotal(~factor(bwhorepo),des1,na.rm=TRUE) crepo <- svytotal(~factor(cwhorepo),des1,na.rm=TRUE) tb <- as.matrix(brepo) tc <- as.matrix(crepo) y1 <- round(100*tb[,1]/sum(tb[,1]),0) y2 <- round(100*tc[,1]/sum(tc[,1]),0) other <- matrix(c(y1,y2),c(8,2)) mat <- t(other) cl <- c("tan4","orange2") rownames(mat) <- c("Housebreaking","Robbery") lab <- c("Religious","Local gang","Policing forum","Vigilante group","Ward councillor", "Private security","Insurance company","Other") par(mar=c(9,4,4,4)) barplot(mat,names=lab,main="Other places where households report housebreaking & robbery", col=cl,las=2, beside=TRUE,ylab="Percentage") legend("top", rownames(mat), cex = 0.8,fill = cl) ############################################################################ svyby(~HoCrime, by=~gender,subset(des1,I_MOTORIS==1),svytotal) svyby(~HoCrime, by=~gender,denominator=~gender,des1,svyratio) svyratio(~HoCrime,denominator=~one,subset(des1,prov==2)) svytotal(~factor(RepBre)+factor(RepRob),des1,na.rm=TRUE) province <- unique(province_name) provS <- sort(province) for (i in provS) { rt <- svyratio(~HoCrime,denominator=~one,subset(des1,province_name==i)) print(i);print(rt) } district <- unique(district_name) distS <- sort(district) for (i in distS) {
Statistics South Africa
Crime Statistics Series Volume I: Exploring the extent of and circumstances surrounding housebreaking/burglary and home robbery, 2015–2016
56
rt <- svyratio(~HoCrime,denominator=~one,subset(des1,district_name==i)) print(i);print(rt) } ############################################################################################## y <- matrix(c(6.2,1.7,1.5,1.8,0.7,1.2,1.2,3.3,13.9,5.2,1.8,1.3,1.5,0.6,1.2,1.2,2.5,11.5),c(9,2)) lab <- c("Eastern Cape","Free State","Gauteng","Kwazulu Natal", "Limpopo","Mpumalanga","North West","Northern Cape", "Western Cape") x <- t(y) rownames(x) <- c("2014/15","2015/16") cl <- c("orange","tan4") par(mar=c(7,4,2,2)) barplot(x,names=lab,main="", col=cl,las=2,ylab="Percentage",beside=TRUE) legend("top", rownames(x), cex = 0.8,fill = cl) ######################################################################### SAPS DATA setwd("C:/Users/kasonga/Documents/R-workspace") dat <- read.table("SAPS2016 Crime_data4.txt",header=T,sep="\t") attach(dat) district <- sort(unique(district_name)) sbu <- rep(0,52) sro <- rep(0,52) for (k in 1:52) { sbu[k] <- sum(Burglary[code==k]) sro[k] <- sum(Home_robbery[code==k]) } data.frame(district,sbu) data.frame(district,sro) province svyby(~HoBreak+HoRobbery,by=~district_code,des1,na.rm=TRUE,vartype="cvpct",svytotal) sum(Burglary[pro_code==1]) province <- unique(province_name) sbu <- rep(0,9) sro <- rep(0,9) for (k in 1:9) { sbu[k] <- sum(Burglary[pro_code==k]) sro[k] <- sum(Home_robbery[pro_code==k]) } pro <- c("WC","EC","NC","FS","KZN","NW","GP","MP","LP") data.frame(province,sbu) data.frame(province,sro) m[order(cod),] (m <- svyby(~HoBreak+HoRobbery,by=~pro_code,des1,na.rm=TRUE,vartype=c("ci","cvpct"),svytotal)) c1 <- m[,4] c2 <- m[,6] cv <- m[,9] y <- m[,3] x <- sro plot(x,y) data.frame(pro,x,y,c1,c2,cv) c1 <- m[,5] c2 <- m[,7] municipality_name[district_name=="Central Karoo"] sum(weight[district_name=="Sarah Baartman"]) w1 <- weight[district_name=="Central Karoo"] sum(w1) sum(one[district_name=="City of Tshwane"]) w2 <- weight[district_name=="Sarah Baartman"] length(w2) ########################################################################################## #tbl <- svytable(~Q10bBreak+gender, des1) svychisq(~Q10bBreak+gender, des1) #summary(tbl,statistic="Chisq") glm1 <- svyglm(Q10bBreak ~ factor(gender) + race + Q12MSTATUS + factor(Q13EDUL) + factor(Q543CCPF) + Q62Time + factor(Q66Time) + ,design=des1,family=quasibinomial()) summary(glm1) cbind(exp(glm1$coef)) regTermTest(glm1, ~factor(gender)) regTermTest(glm1, ~factor(Q613EDUL))
Statistics South Africa
Crime Statistics Series Volume I: Exploring the extent of and circumstances surrounding housebreaking/burglary and home robbery, 2015–2016
57
regTermTest(glm1, ~factor(Q543CCPF)) regTermTest(glm1, ~factor(Q62Time)) regTermTest(glm1, ~factor(Q66Time)) #tbl <- svytable(~Q10cRob+gender, des1) svychisq(~Q10cRob+gender, des1) #summary(tbl, statistic="Chisq") glm1 <- svyglm(formula = Q10cRob ~ factor(race)+ factor(Q13EDUL) + Q611SPEC1YR + factor(Q62Time) + factor(Q66Time) + D_AGE, design = des1, family = quasibinomial()) summary(glm1) cbind(exp(glm1$coef)) regTermTest(glm1, ~factor(Q13EDUL)) regTermTest(glm1, ~factor(Q611SPEC1YR)) regTermTest(glm1, ~factor(Q62Time)) regTermTest(glm1, ~factor(Q66Time)) ########################################################################################## #Homebreaking reporting svychisq(~Q127CReport+gender, subset(des1,Q10bBreak==1)) #summary(tbl, statistic="Chisq") glm1 <- svyglm(formula = Q127CReport ~ gender + factor(race) + Q12MSTATUS + factor(Q13EDUL) + factor(Q62Time) + factor(Q66Time), design = subset(des1,Q10bBreak==1), family = quasibinomial()) summary(glm1) cbind(exp(glm1$coef)) regTermTest(glm1, ~factor(Q66Time )) regTermTest(glm1, ~factor(Q13EDUL)) regTermTest(glm1, ~factor(Q62Time)) ########################################################################################### svychisq(~Q1312CReport+gender, subset(des1,Q10cRob==1)) #summary(tbl, statistic="Chisq") glm1 <- svyglm(formula = Q1312CReport ~ factor(race) + factor(Q13EDUL) + Q611SPEC1YR+ factor(Q543CCPF) + factor(Q62Time) + Q66Time, design = subset(des1,Q10cRob==1), family = quasibinomial()) summary(glm1) cbind(exp(glm1$coef)) regTermTest(glm1, ~factor(race)) regTermTest(glm1, ~factor(Q13EDUL)) regTermTest(glm1, ~factor(Q543CCPF)) regTermTest(glm1, ~factor(Q62Time))
Recommended