31
Sponsored by Unisys
Independently conducted by Ponemon Institute LLC
Publication Date: July 2014
Critical Infrastructure: Security
Preparedness and Maturity
2
Part 1. Introduction Ponemon Institute is pleased to present the results of the “Critical Infrastructure: Security
Preparedness and Maturity” study, sponsored by Unisys. The purpose of this research is
to learn how utility, oil and gas, alternate energy and manufacturing organizations are
addressing cyber security threats. These industries have become a high profile target for
security exploits. Moreover, it has been reported that if their industrial controls systems
(ICS) and supervisory control and data acquisition (SCADA) systems were attacked the
damage could be enormous.
For example, an unnamed natural gas company hired an IT firm to test its corporate
information system. POWER Magazine reported, “The consulting organization carelessly
ventured into a part of the network that was directly connected the SCADA system. The
penetration test locked up the SCADA system and the utility was not able to send gas
through its pipelines for four hours. The outcome was the loss of service to its customer
base for those four hours.”1
As the findings reveal, organizations are not as prepared as they should be to deal with the
sophistication and frequency of a cyber threat or the negligence of an employee or third
party. In fact, the majority of participants in this study do not believe their companies’ IT
security programs are “mature.” For purposes of this research, a mature stage is defined
as having most IT security program activities deployed. Most companies have defined
what their security initiatives are but deployment and execution are still in the early or
middle stages.
We surveyed 599 Global IT and IT security executives in 13 countries. A list of
participating countries is presented in the appendix of this report. To ensure a
knowledgeable and quality response, only IT practitioners whose job involves securing or
overseeing the security of their organization’s information systems or IT infrastructure were
permitted to complete the survey. They are also familiar with security standards such as
NERC, CIP, NIST, ISO, PCI DSS, Sarbanes Oxley and other regulations on the protection
of information assets and the critical infrastructure.
Key findings of this research
Most companies have not fully deployed their IT security programs. Only 17 percent
of companies represented in this research self-report that most of their IT security program
activities are deployed. Fifty percent of respondents say their IT security activities have not
as yet been defined or deployed (7 percent) or they have defined activities but they are
only partially deployed (43 percent). A possible reason is that only 28 percent of
respondents agree that security is one of the top five strategic priorities across the
enterprise.
The risk to industrial control systems and SCADA is believed to have substantially
increased. Fifty-seven percent of respondents agree that cyber threats are putting
industrial control systems and SCADA at greater risk. Only 11 percent say the risk has
decreased due to heightened regulations and industry-based security standards.
1Cyber Threats to SCADA Systems Are Real, POWER Magazine, by Kennedy Maize, July 18, 2012
3
Security compromises are occurring in most companies. It is difficult to understand
why security is not a top a priority because 67 percent of respondents say their companies
have had at least one security compromise that that led to the loss of confidential
information or disruption to operations over the last 12 months. Twenty-four percent of
respondents say these compromises were due to an insider attack or negligent privileged
IT users.
Upgrading existing legacy systems may result in sacrificing mission-critical
security. Fifty-four percent of respondents are not confident (36 percent) or unsure (18
percent) that their organization would be able to upgrade legacy systems to the next
improved security state in cost-effective ways without sacrificing mission-critical security.
Many organizations are not getting actionable real-time threat alerts about security
exploits. According to 34 percent of respondents, their companies do not get real-time
alerts, threat analysis and threat prioritization intelligence that can be used to stop or
minimize the impact of a cyber attack. If they do receive such intelligence, 22 percent of
respondents say they are not effective. Only 15 percent of respondents say threat
intelligence is very effective and actionable.
4
Part 2. Key Findings In this section, we provide an analysis of the key findings. The complete results of the study
are presented in the appendix of this report. We have organized the report according to the
following themes:
The current state of security preparedness and maturity
Implementation of security practices and governance
Security threats and incidents
Barriers to addressing threats and incidents
The current state of security preparedness and maturity
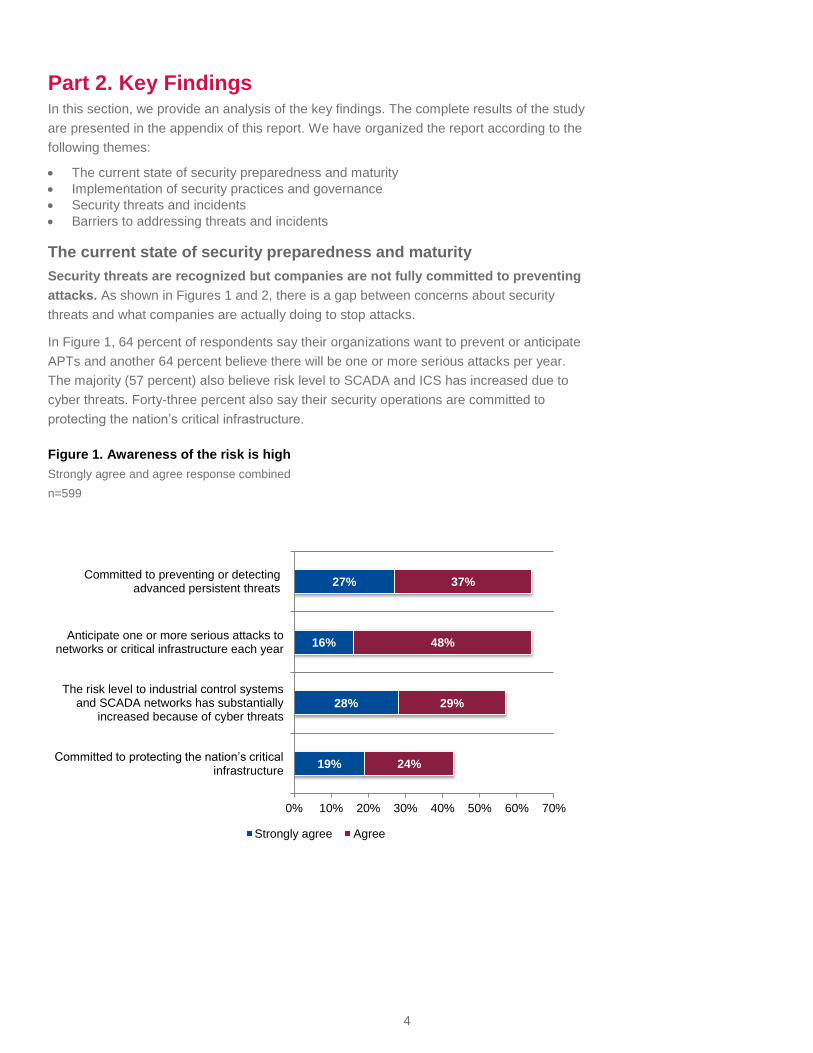
Security threats are recognized but companies are not fully committed to preventing
attacks. As shown in Figures 1 and 2, there is a gap between concerns about security
threats and what companies are actually doing to stop attacks.
In Figure 1, 64 percent of respondents say their organizations want to prevent or anticipate
APTs and another 64 percent believe there will be one or more serious attacks per year.
The majority (57 percent) also believe risk level to SCADA and ICS has increased due to
cyber threats. Forty-three percent also say their security operations are committed to
protecting the nation’s critical infrastructure.
Figure 1. Awareness of the risk is high
Strongly agree and agree response combined
n=599
19%
28%
16%
27%
24%
29%
48%
37%
0% 10% 20% 30% 40% 50% 60% 70%
Committed to protecting the nation’s critical infrastructure
The risk level to industrial control systemsand SCADA networks has substantially
increased because of cyber threats
Anticipate one or more serious attacks tonetworks or critical infrastructure each year
Committed to preventing or detectingadvanced persistent threats
Strongly agree Agree
5
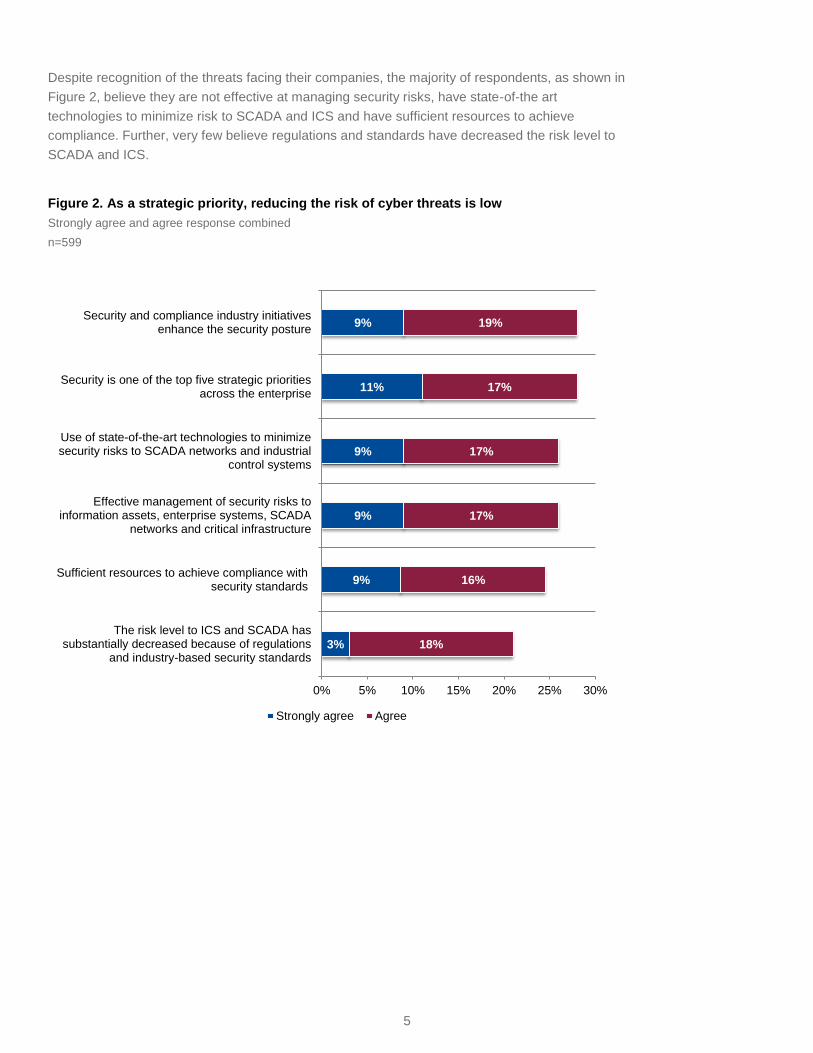
Despite recognition of the threats facing their companies, the majority of respondents, as shown in
Figure 2, believe they are not effective at managing security risks, have state-of-the art
technologies to minimize risk to SCADA and ICS and have sufficient resources to achieve
compliance. Further, very few believe regulations and standards have decreased the risk level to
SCADA and ICS.
Figure 2. As a strategic priority, reducing the risk of cyber threats is low
Strongly agree and agree response combined
n=599
3%
9%
9%
9%
11%
9%
18%
16%
17%
17%
17%
19%
0% 5% 10% 15% 20% 25% 30%
The risk level to ICS and SCADA hassubstantially decreased because of regulations
and industry-based security standards
Sufficient resources to achieve compliance withsecurity standards
Effective management of security risks toinformation assets, enterprise systems, SCADA
networks and critical infrastructure
Use of state-of-the-art technologies to minimizesecurity risks to SCADA networks and industrial
control systems
Security is one of the top five strategic prioritiesacross the enterprise
Security and compliance industry initiativesenhance the security posture
Strongly agree Agree
6
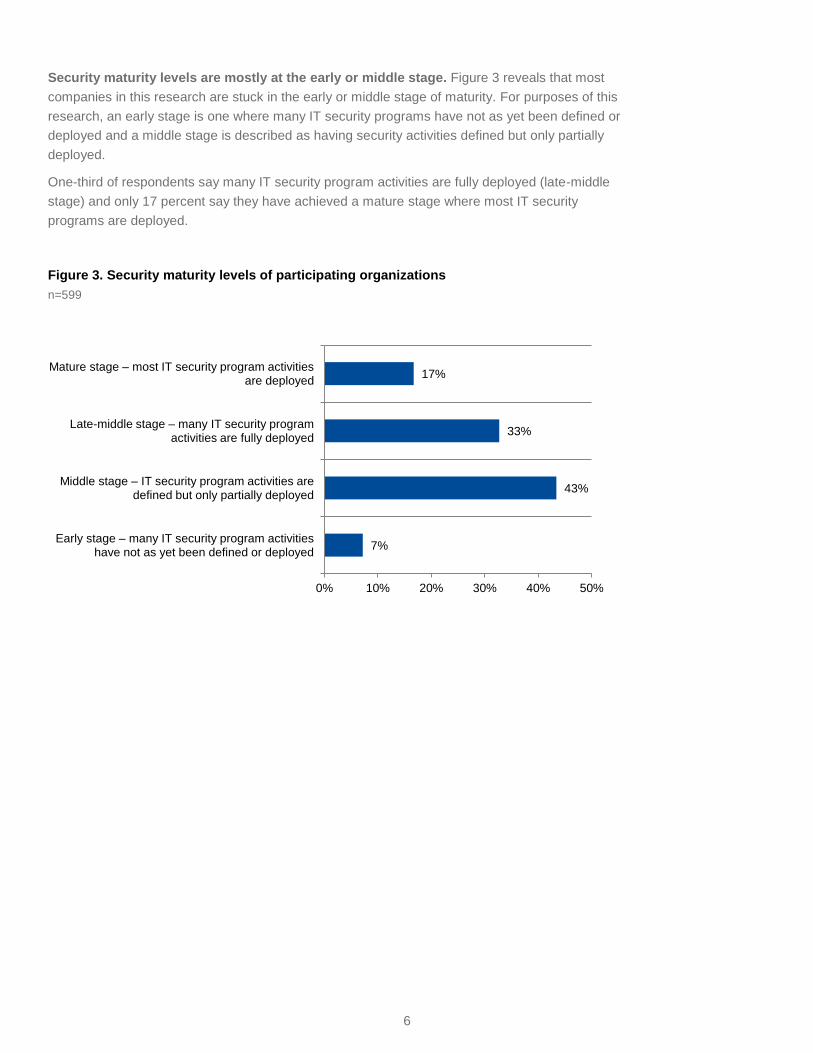
Security maturity levels are mostly at the early or middle stage. Figure 3 reveals that most
companies in this research are stuck in the early or middle stage of maturity. For purposes of this
research, an early stage is one where many IT security programs have not as yet been defined or
deployed and a middle stage is described as having security activities defined but only partially
deployed.
One-third of respondents say many IT security program activities are fully deployed (late-middle
stage) and only 17 percent say they have achieved a mature stage where most IT security
programs are deployed.
Figure 3. Security maturity levels of participating organizations
n=599
7%
43%
33%
17%
0% 10% 20% 30% 40% 50%
Early stage – many IT security program activities have not as yet been defined or deployed
Middle stage – IT security program activities are defined but only partially deployed
Late-middle stage – many IT security program activities are fully deployed
Mature stage – most IT security program activities are deployed
7
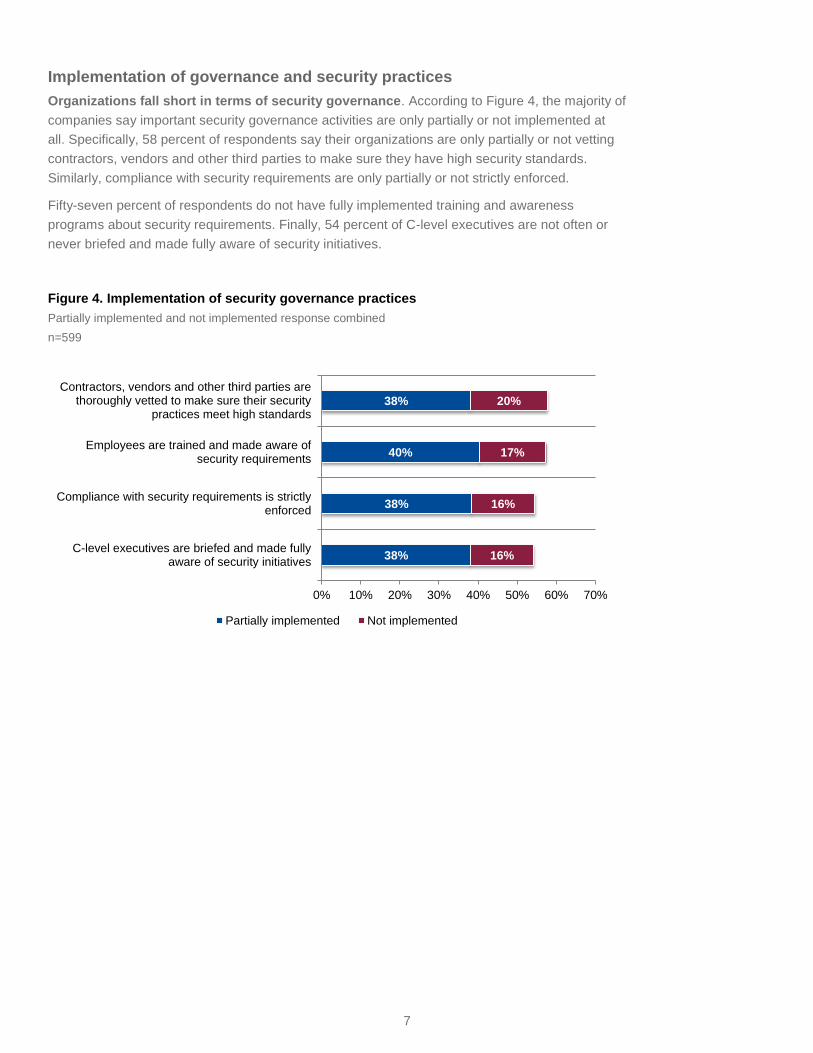
Implementation of governance and security practices
Organizations fall short in terms of security governance. According to Figure 4, the majority of
companies say important security governance activities are only partially or not implemented at
all. Specifically, 58 percent of respondents say their organizations are only partially or not vetting
contractors, vendors and other third parties to make sure they have high security standards.
Similarly, compliance with security requirements are only partially or not strictly enforced.
Fifty-seven percent of respondents do not have fully implemented training and awareness
programs about security requirements. Finally, 54 percent of C-level executives are not often or
never briefed and made fully aware of security initiatives.
Figure 4. Implementation of security governance practices
Partially implemented and not implemented response combined
n=599
38%
38%
40%
38%
16%
16%
17%
20%
0% 10% 20% 30% 40% 50% 60% 70%
C-level executives are briefed and made fullyaware of security initiatives
Compliance with security requirements is strictlyenforced
Employees are trained and made aware ofsecurity requirements
Contractors, vendors and other third parties arethoroughly vetted to make sure their security
practices meet high standards
Partially implemented Not implemented
8
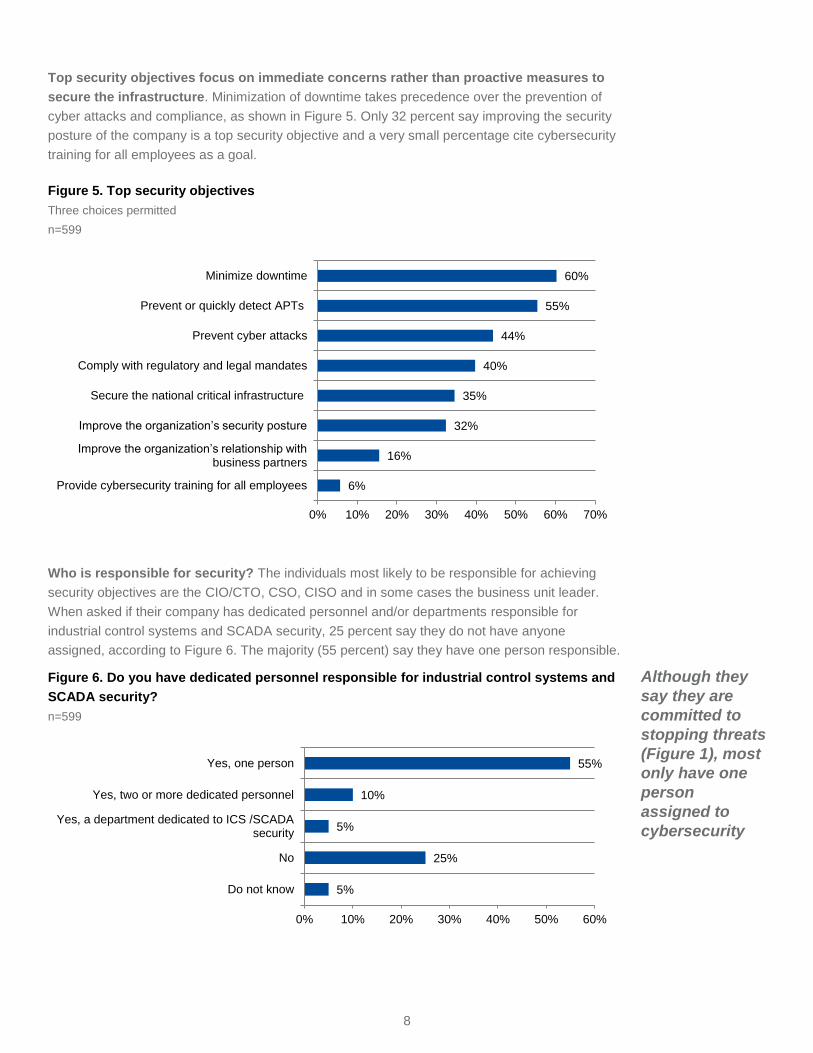
Top security objectives focus on immediate concerns rather than proactive measures to
secure the infrastructure. Minimization of downtime takes precedence over the prevention of
cyber attacks and compliance, as shown in Figure 5. Only 32 percent say improving the security
posture of the company is a top security objective and a very small percentage cite cybersecurity
training for all employees as a goal.
Figure 5. Top security objectives
Three choices permitted
n=599
Who is responsible for security? The individuals most likely to be responsible for achieving
security objectives are the CIO/CTO, CSO, CISO and in some cases the business unit leader.
When asked if their company has dedicated personnel and/or departments responsible for
industrial control systems and SCADA security, 25 percent say they do not have anyone
assigned, according to Figure 6. The majority (55 percent) say they have one person responsible.
Figure 6. Do you have dedicated personnel responsible for industrial control systems and
SCADA security?
n=599
Although they
say they are
committed to
stopping threats
(Figure 1), most
only have one
person
assigned to
cybersecurity
6%
16%
32%
35%
40%
44%
55%
60%
0% 10% 20% 30% 40% 50% 60% 70%
Provide cybersecurity training for all employees
Improve the organization’s relationship with business partners
Improve the organization’s security posture
Secure the national critical infrastructure
Comply with regulatory and legal mandates
Prevent cyber attacks
Prevent or quickly detect APTs
Minimize downtime
5%
25%
5%
10%
55%
0% 10% 20% 30% 40% 50% 60%
Do not know
No
Yes, a department dedicated to ICS /SCADAsecurity
Yes, two or more dedicated personnel
Yes, one person
9
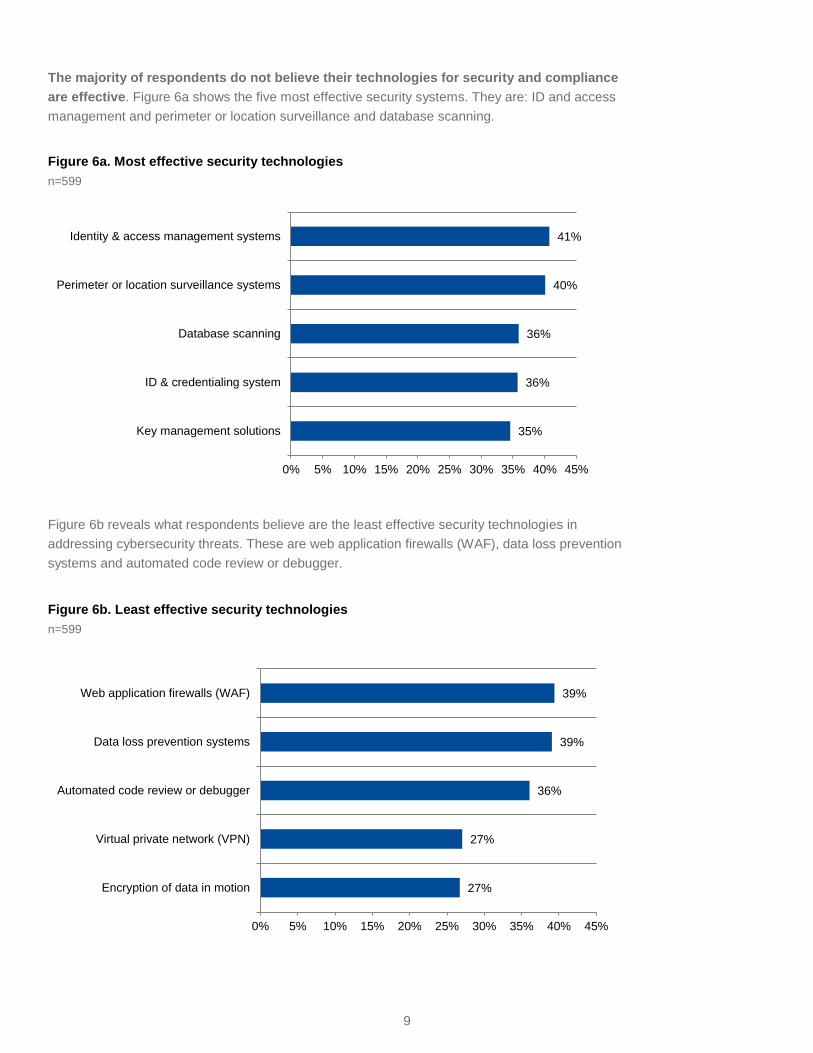
The majority of respondents do not believe their technologies for security and compliance
are effective. Figure 6a shows the five most effective security systems. They are: ID and access
management and perimeter or location surveillance and database scanning.
Figure 6a. Most effective security technologies
n=599
Figure 6b reveals what respondents believe are the least effective security technologies in
addressing cybersecurity threats. These are web application firewalls (WAF), data loss prevention
systems and automated code review or debugger.
Figure 6b. Least effective security technologies
n=599
35%
36%
36%
40%
41%
0% 5% 10% 15% 20% 25% 30% 35% 40% 45%
Key management solutions
ID & credentialing system
Database scanning
Perimeter or location surveillance systems
Identity & access management systems
27%
27%
36%
39%
39%
0% 5% 10% 15% 20% 25% 30% 35% 40% 45%
Encryption of data in motion
Virtual private network (VPN)
Automated code review or debugger
Data loss prevention systems
Web application firewalls (WAF)
10
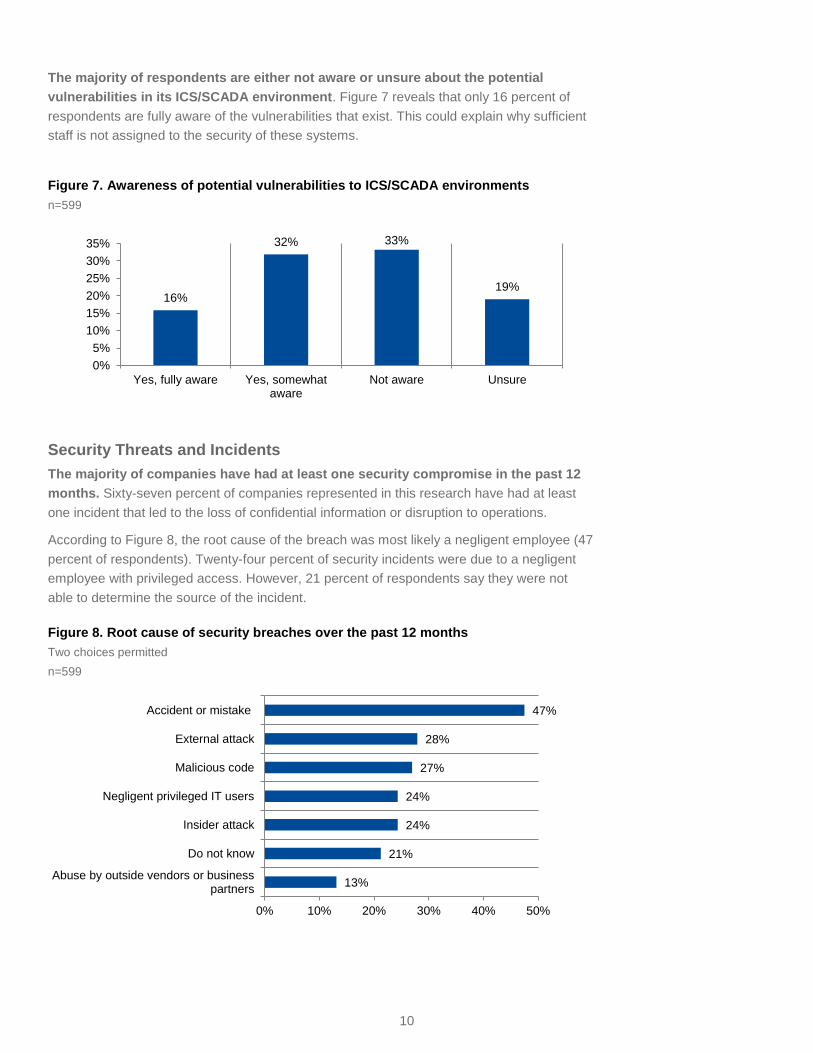
The majority of respondents are either not aware or unsure about the potential
vulnerabilities in its ICS/SCADA environment. Figure 7 reveals that only 16 percent of
respondents are fully aware of the vulnerabilities that exist. This could explain why sufficient
staff is not assigned to the security of these systems.
Figure 7. Awareness of potential vulnerabilities to ICS/SCADA environments
n=599
Security Threats and Incidents
The majority of companies have had at least one security compromise in the past 12
months. Sixty-seven percent of companies represented in this research have had at least
one incident that led to the loss of confidential information or disruption to operations.
According to Figure 8, the root cause of the breach was most likely a negligent employee (47
percent of respondents). Twenty-four percent of security incidents were due to a negligent
employee with privileged access. However, 21 percent of respondents say they were not
able to determine the source of the incident.
Figure 8. Root cause of security breaches over the past 12 months
Two choices permitted
n=599
16%
32% 33%
19%
0%
5%
10%
15%
20%
25%
30%
35%
Yes, fully aware Yes, somewhataware
Not aware Unsure
13%
21%
24%
24%
27%
28%
47%
0% 10% 20% 30% 40% 50%
Abuse by outside vendors or businesspartners
Do not know
Insider attack
Negligent privileged IT users
Malicious code
External attack
Accident or mistake
11
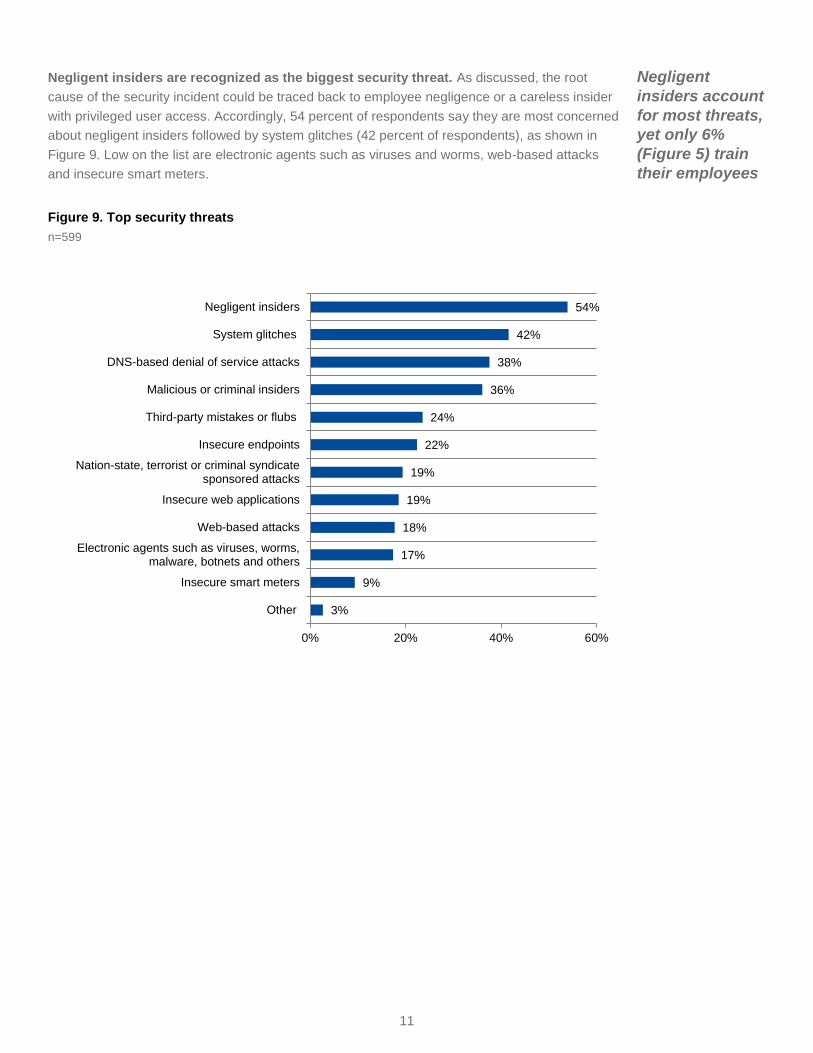
Negligent insiders are recognized as the biggest security threat. As discussed, the root
cause of the security incident could be traced back to employee negligence or a careless insider
with privileged user access. Accordingly, 54 percent of respondents say they are most concerned
about negligent insiders followed by system glitches (42 percent of respondents), as shown in
Figure 9. Low on the list are electronic agents such as viruses and worms, web-based attacks
and insecure smart meters.
Negligent
insiders account
for most threats,
yet only 6%
(Figure 5) train
their employees
Figure 9. Top security threats
n=599
3%
9%
17%
18%
19%
19%
22%
24%
36%
38%
42%
54%
0% 20% 40% 60%
Other
Insecure smart meters
Electronic agents such as viruses, worms,malware, botnets and others
Web-based attacks
Insecure web applications
Nation-state, terrorist or criminal syndicatesponsored attacks
Insecure endpoints
Third-party mistakes or flubs
Malicious or criminal insiders
DNS-based denial of service attacks
System glitches
Negligent insiders
12
14%
12%
13%
14%
22%
23%
26%
26%
29%
33%
36%
39%
0% 5% 10% 15% 20% 25% 30% 35% 40% 45%
Other
HR applications
SCADA networks
CRM applications
ERP applications
Do not know
Storage devices
Industrial control systems
Servers
Cloud-based systems
Desktops, laptops, smartphones and tablets
Databases
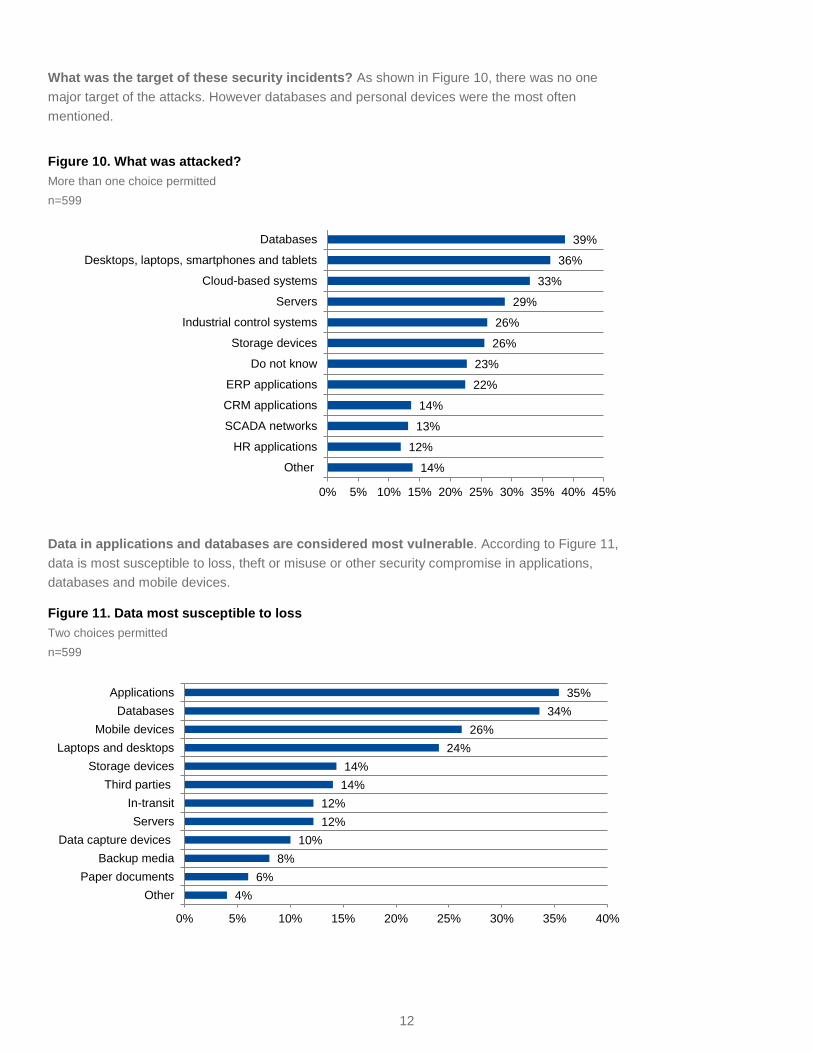
What was the target of these security incidents? As shown in Figure 10, there was no one
major target of the attacks. However databases and personal devices were the most often
mentioned.
Figure 10. What was attacked?
More than one choice permitted
n=599
Data in applications and databases are considered most vulnerable. According to Figure 11,
data is most susceptible to loss, theft or misuse or other security compromise in applications,
databases and mobile devices.
Figure 11. Data most susceptible to loss
Two choices permitted
n=599
4%
6%
8%
10%
12%
12%
14%
14%
24%
26%
34%
35%
0% 5% 10% 15% 20% 25% 30% 35% 40%
Other
Paper documents
Backup media
Data capture devices
Servers
In-transit
Third parties
Storage devices
Laptops and desktops
Mobile devices
Databases
Applications
13
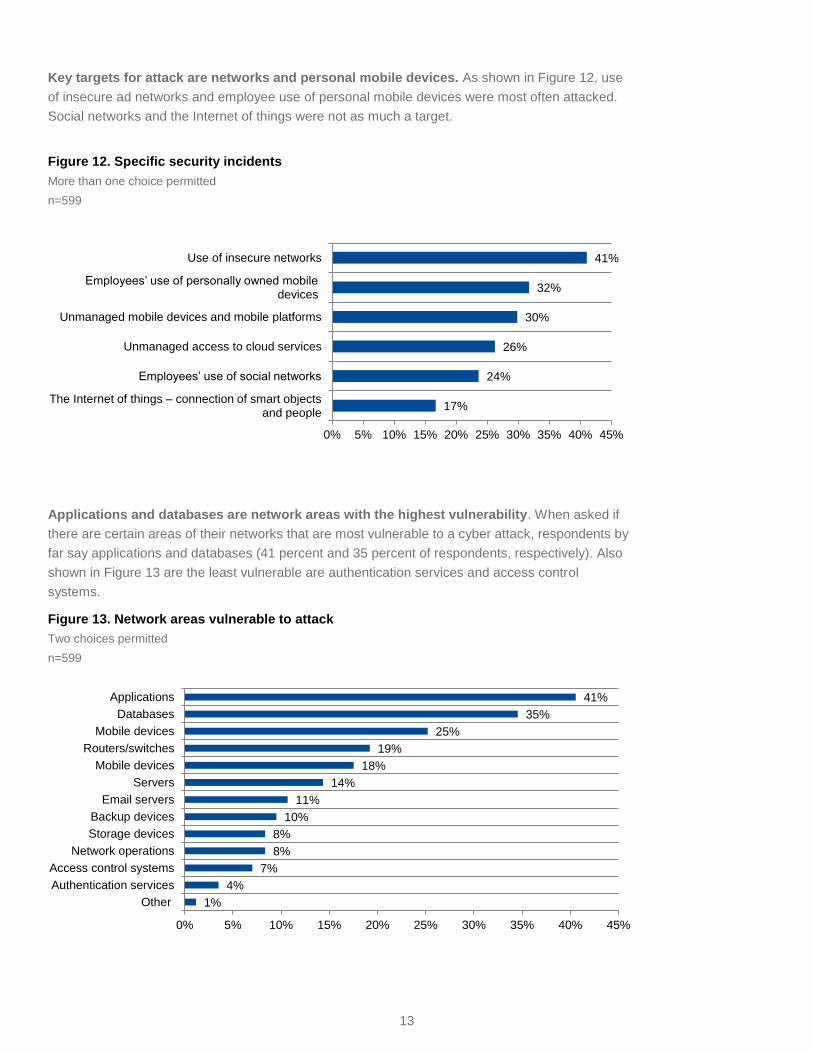
Key targets for attack are networks and personal mobile devices. As shown in Figure 12, use
of insecure ad networks and employee use of personal mobile devices were most often attacked.
Social networks and the Internet of things were not as much a target.
Figure 12. Specific security incidents
More than one choice permitted
n=599
Applications and databases are network areas with the highest vulnerability. When asked if
there are certain areas of their networks that are most vulnerable to a cyber attack, respondents by
far say applications and databases (41 percent and 35 percent of respondents, respectively). Also
shown in Figure 13 are the least vulnerable are authentication services and access control
systems.
Figure 13. Network areas vulnerable to attack
Two choices permitted
n=599
17%
24%
26%
30%
32%
41%
0% 5% 10% 15% 20% 25% 30% 35% 40% 45%
The Internet of things – connection of smart objects and people
Employees’ use of social networks
Unmanaged access to cloud services
Unmanaged mobile devices and mobile platforms
Employees’ use of personally owned mobile devices
Use of insecure networks
1%
4%
7%
8%
8%
10%
11%
14%
18%
19%
25%
35%
41%
0% 5% 10% 15% 20% 25% 30% 35% 40% 45%
Other
Authentication services
Access control systems
Network operations
Storage devices
Backup devices
Email servers
Servers
Mobile devices
Routers/switches
Mobile devices
Databases
Applications
14
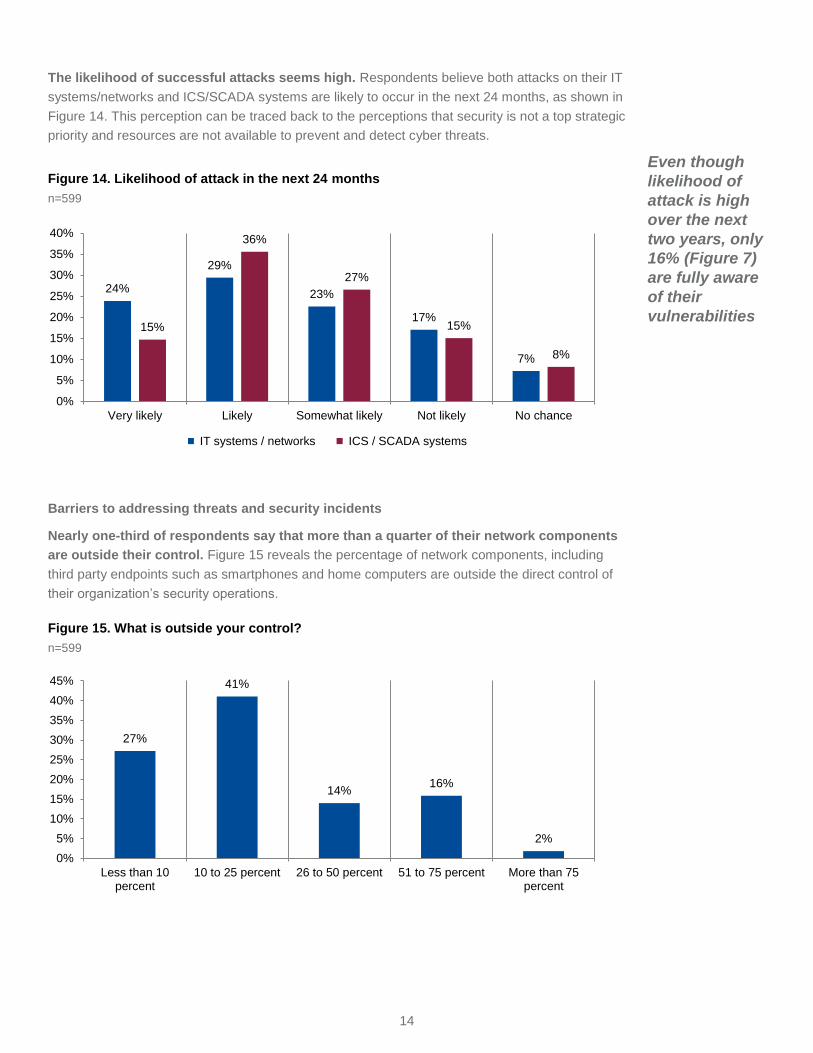
The likelihood of successful attacks seems high. Respondents believe both attacks on their IT
systems/networks and ICS/SCADA systems are likely to occur in the next 24 months, as shown in
Figure 14. This perception can be traced back to the perceptions that security is not a top strategic
priority and resources are not available to prevent and detect cyber threats.
Figure 14. Likelihood of attack in the next 24 months
n=599
Even though
likelihood of
attack is high
over the next
two years, only
16% (Figure 7)
are fully aware
of their
vulnerabilities
Barriers to addressing threats and security incidents
Nearly one-third of respondents say that more than a quarter of their network components
are outside their control. Figure 15 reveals the percentage of network components, including
third party endpoints such as smartphones and home computers are outside the direct control of
their organization’s security operations.
Figure 15. What is outside your control?
n=599
27%
41%
14% 16%
2%
0%
5%
10%
15%
20%
25%
30%
35%
40%
45%
Less than 10percent
10 to 25 percent 26 to 50 percent 51 to 75 percent More than 75percent
24%
29%
23%
17%
7%
15%
36%
27%
15%
8%
0%
5%
10%
15%
20%
25%
30%
35%
40%
Very likely Likely Somewhat likely Not likely No chance
IT systems / networks ICS / SCADA systems
15
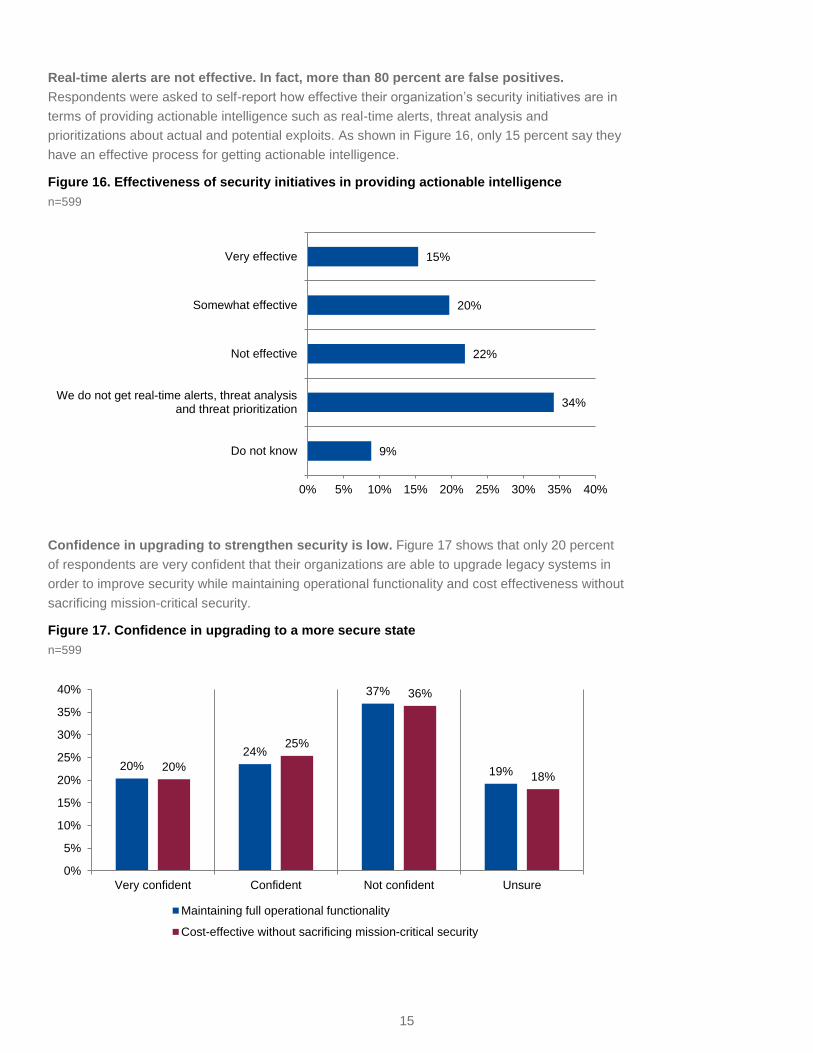
Real-time alerts are not effective. In fact, more than 80 percent are false positives.
Respondents were asked to self-report how effective their organization’s security initiatives are in
terms of providing actionable intelligence such as real-time alerts, threat analysis and
prioritizations about actual and potential exploits. As shown in Figure 16, only 15 percent say they
have an effective process for getting actionable intelligence.
Figure 16. Effectiveness of security initiatives in providing actionable intelligence
n=599
Confidence in upgrading to strengthen security is low. Figure 17 shows that only 20 percent
of respondents are very confident that their organizations are able to upgrade legacy systems in
order to improve security while maintaining operational functionality and cost effectiveness without
sacrificing mission-critical security.
Figure 17. Confidence in upgrading to a more secure state
n=599
9%
34%
22%
20%
15%
0% 5% 10% 15% 20% 25% 30% 35% 40%
Do not know
We do not get real-time alerts, threat analysisand threat prioritization
Not effective
Somewhat effective
Very effective
20%
24%
37%
19% 20%
25%
36%
18%
0%
5%
10%
15%
20%
25%
30%
35%
40%
Very confident Confident Not confident Unsure
Maintaining full operational functionality
Cost-effective without sacrificing mission-critical security
16
Unisys Perspective on Critical Infrastructure Security
Keeping the “lights on” and facilities safe are the primary concerns for companies in the
critical infrastructure sectors. The number and severity of cyber-attacks on these
companies is escalating and endangering those important goals, however. As this report
shows, a majority of industrial, utility, and manufacturing sector enterprises have already
experienced security breaches first-hand, and expect more to come in the future. What is
particularly disconcerting is that many of these targeted enterprises believe they do not
have mature, fully secured systems in place. This presents clear risks in downtime, loss of
intellectual property and safety of their infrastructures.
The Unisys/Ponemon research provides strong evidence that critical infrastructure
companies are not prepared to deal with a plethora of attacks against IT and industrial
control systems (ICS). More disconcerting is the fact that this lack of preparedness seems
to be a global phenomenon. We believe our study findings should serve as a wake-up call
to organizations and their leaders.
Why should critical infrastructure companies act now? It is generally known that the
sophistication and frequency of cyber-attacks is on the rise. Energy, utilities, industrial and
chemical manufacturing companies are prime targets, especially to attackers that are
financed by unfriendly nation-states or criminal organizations. These hackers have the
resources and ability to crack data centers as well as supervisory control and data acquisition
(SCADA) systems. Just imagine the catastrophic impact of a successful cyber attack that
brings down an electric utility or petroleum refinery for several days or weeks. While some
might see this as a science fiction scenario, most security experts agree that this scenario
can, will or has already happened.
ICS and SCADA vulnerabilities are well-documented and acknowledged within the
industries, but many enterprises have few resources for addressing the issue—either by
design, lack of expertise, budget constraints, or a combination of all these factors. This
unwillingness to allocate resources will continue until a major cyber incident occurs that
causes crippling financial or business disruption. Additionally, safety and 100 percent
uptime are crucial, and enterprises may see implementation of new security measures as
a potential disruption to their current, stable systems. Further complicating their security
posture, most companies do not get actionable intelligence on advanced persistent threats
(APTs), insider attacks, or any other alerts to contain or even repel cyber-threats. As a
result, they must rely on reactive tactics to cyber-threats. With this strategy, damage is
often already done, and typical remediation consists of an endless cycle of upgrades,
patches, and maintenance.
Unisys believes a proactive approach to critical infrastructure security is a more thorough
and cost effective strategy. Preventing attacks with non-disruptive, forward-thinking
architecture and practices can drastically diminish cyber incidents, now and in the future.
Suggested actions include:
1. Develop an all-encompassing security strategy that aligns security with business
strategies and goals, providing a roadmap to follow
2. Manage identities and entitlements to provide the highest level of identity assurance
and reduce critical employee errors, and
3. Isolate and cloak end-point devices to hide them from probing malware.
17
No enterprise is completely immune to cyber-attack, but a comprehensive proactive
strategy can eliminate many threats with the following:
Implement agile and non-disruptive security: In implementing security measures
for critical infrastructures, tactical security tools should not disrupt operations,
during installation or routine maintenance. Reliability, safety, and zero downtime
are paramount. In addition, these tactics should be easily adaptable to changing
business and infrastructure needs. For example, a significant number of new
ICS/SCADA and smart grid devices will come on line in the next five years—
Security systems must be agile enough to address the security requirements of a
wide array of these devices and their deployment with minimal effort.
Deploy better authentication for applications and users: User mistakes, system
glitches, and disgruntled employees may be the most prevalent threats to
enterprise infrastructure reliability and safety. Strictly enforced user credentials are
needed to shore-up existing network segmentation and security. Accidents
happen—but they can be prevented.
Reduce attack surfaces or targets: Common security measures still present too
many targets, or “attack surfaces,” to external hackers and malicious code. In fact,
the very discovery of a firewall or intrusion detection and prevention device is often
seen as a challenge to hackers. Masking the number and types of targets can
greatly reduce the number of incidents and hacking attempts. Similarly, by
reducing the attack surface using compartmentalization techniques, they can only
see the data, applications, and files they are allowed to access.
Protect mobile data: Mobile data, accessed via smart phones or laptops, is
particularly vulnerable to outside attacks. Many plants, pipeline controls, and
SCADA endpoints use mobile communications. As data travels across public
carriers or even private wireless networks, hackers already have well-developed
toolsets for intercepting and capturing data from mobile communications. These
interception tools are growing in sophistication. Proactively and non-disruptively
protecting this data with strong encryption greatly reduces this risk to any
enterprise that relies on wireless communications.
Secure BYOD: Employee and partner use of BYOD devices introduces yet
another attack surface for hackers and an entry point for malicious code.
Encrypting wireless data eliminates a vast number of potential vulnerabilities.
Isolate endpoints and devices: ICS/SCADA and other intelligent control devices
should be isolated and masked, much like users on the network. Again, this
presents fewer attack surfaces, and reduces incidents that potentially can take
down an electrical grid or halt factory production.
Unisys believes that higher reliability, safety, and compliance can come from a pre-emptive
security posture. It is also essential that a proactive approach be as non-disruptive and
agile as possible, helping enterprises reduce security costs while achieving more. The
stakes are high, and the attacks are becoming more sophisticated. All critical industries
and utilities have a goal of zero safety incidents and zero downtime, yet these goals
increasingly depend on zero security incidents.
18
19%
24%
20%
25%
10%
2%
Senior Executive
Vice President
Senior Director
Director
Manager
Other
Part 3. Methods A sampling frame of 9,880 experienced IT and IT security practitioners located in 13 countries were
selected as participants to this survey. To ensure knowledgeable responses, all participants in this
research are responsible for securing or overseeing the security of their organization’s information
systems or IT infrastructure. Table 1 shows 760 total returns. Screening and reliability checks
required the removal of 161 surveys. Our final sample consisted of 599 surveys or a 6.1 percent
response rate.
Table 1. Sample response Freq Pct%
Total sampling frame 9,880 100.0%
Total survey returns 760 7.7%
Rejected and screened surveys 161 1.6%
Final sample 599 6.1%
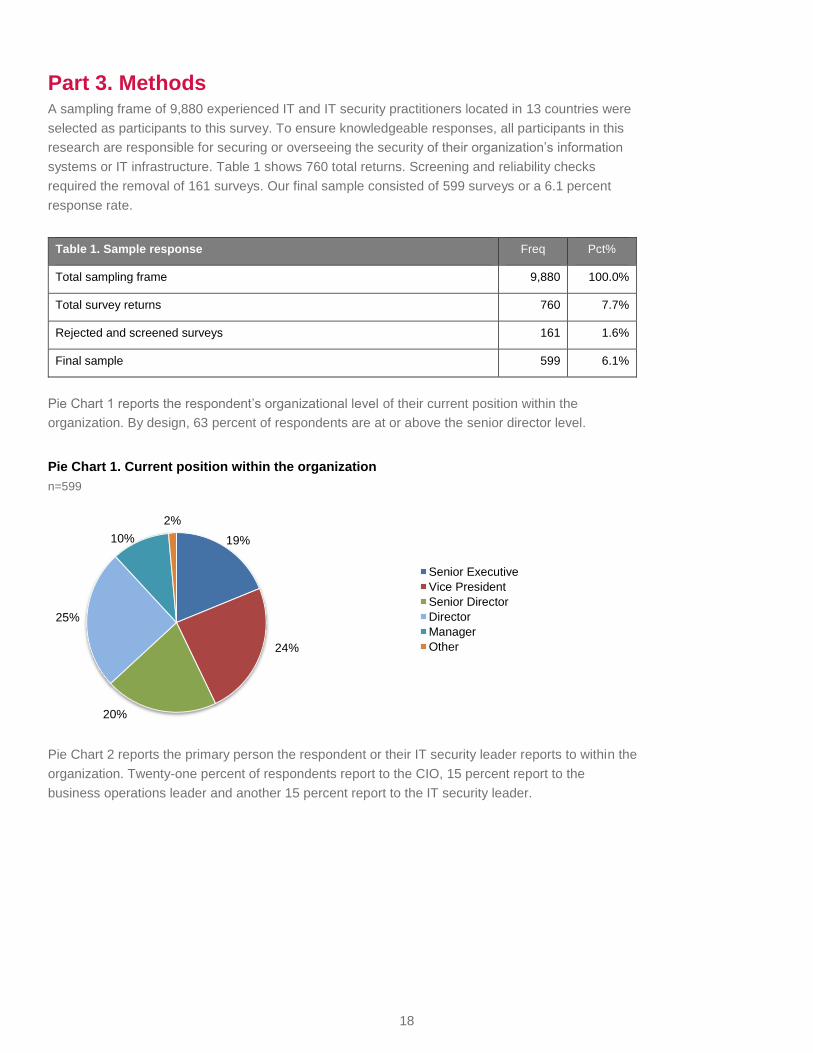
Pie Chart 1 reports the respondent’s organizational level of their current position within the
organization. By design, 63 percent of respondents are at or above the senior director level.
Pie Chart 1. Current position within the organization
n=599
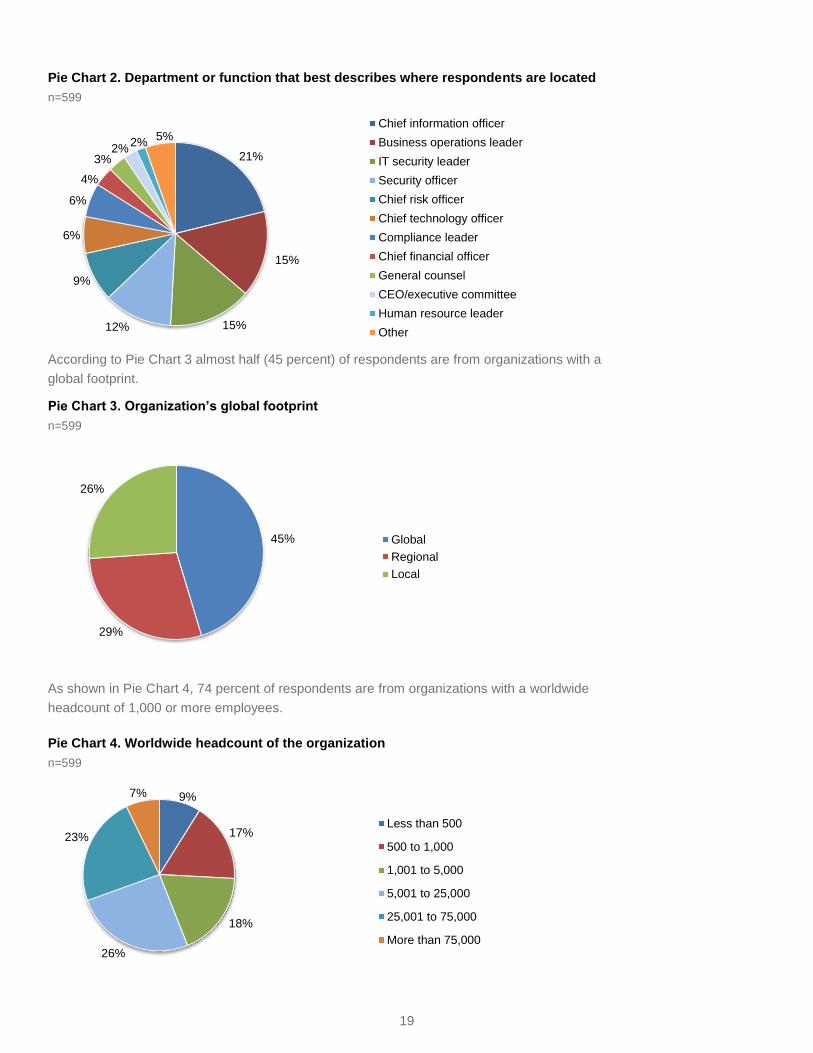
Pie Chart 2 reports the primary person the respondent or their IT security leader reports to within the
organization. Twenty-one percent of respondents report to the CIO, 15 percent report to the
business operations leader and another 15 percent report to the IT security leader.
19
21%
15%
15% 12%
9%
6%
6%
4%
3% 2%
2% 5%
Chief information officer
Business operations leader
IT security leader
Security officer
Chief risk officer
Chief technology officer
Compliance leader
Chief financial officer
General counsel
CEO/executive committee
Human resource leader
Other
45%
29%
26%
Global
Regional
Local
9%
17%
18%
26%
23%
7%
Less than 500
500 to 1,000
1,001 to 5,000
5,001 to 25,000
25,001 to 75,000
More than 75,000
Pie Chart 2. Department or function that best describes where respondents are located
n=599
According to Pie Chart 3 almost half (45 percent) of respondents are from organizations with a
global footprint.
Pie Chart 3. Organization’s global footprint
n=599
As shown in Pie Chart 4, 74 percent of respondents are from organizations with a worldwide
headcount of 1,000 or more employees.
Pie Chart 4. Worldwide headcount of the organization
n=599
20
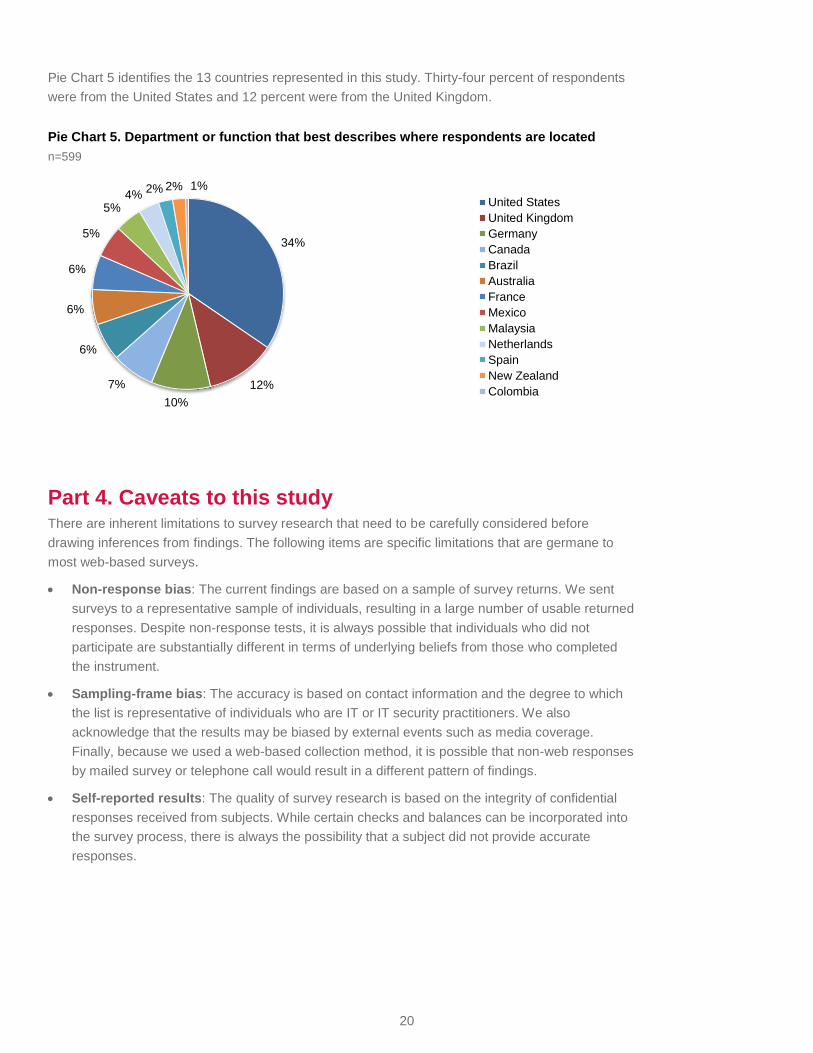
34%
12%
10%
7%
6%
6%
6%
5%
5% 4%
2% 2% 1%
United States
United Kingdom
Germany
Canada
Brazil
Australia
France
Mexico
Malaysia
Netherlands
Spain
New Zealand
Colombia
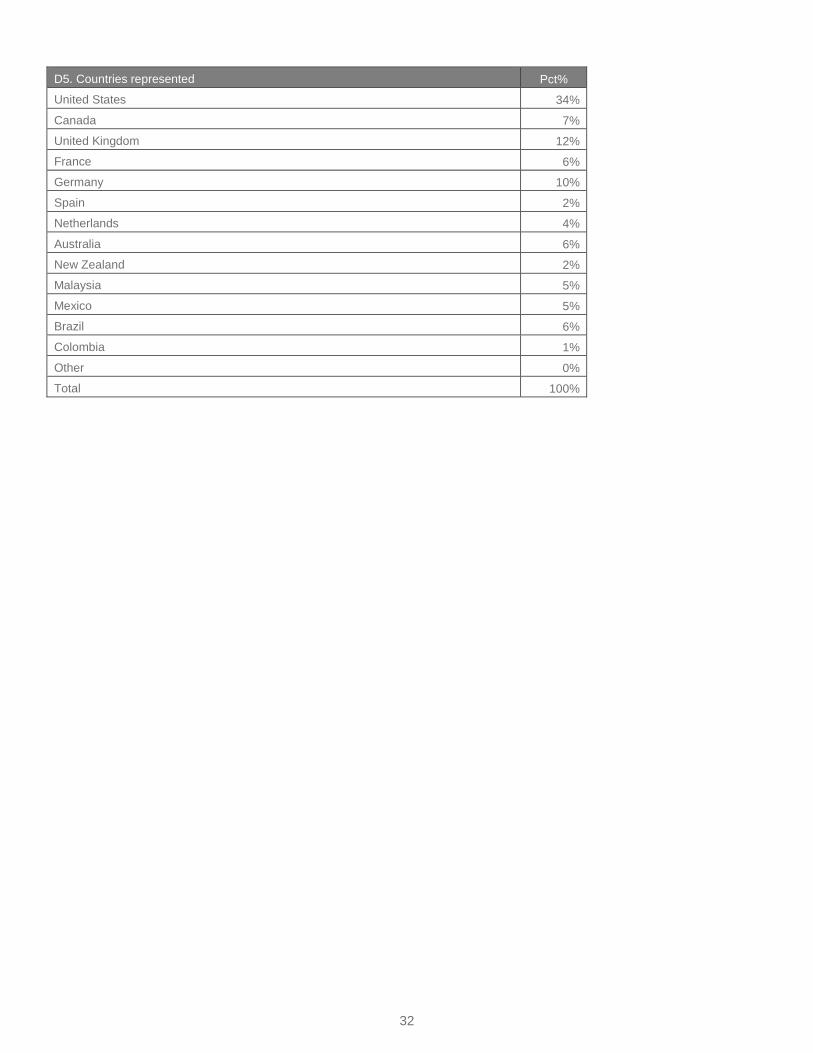
Pie Chart 5 identifies the 13 countries represented in this study. Thirty-four percent of respondents
were from the United States and 12 percent were from the United Kingdom.
Pie Chart 5. Department or function that best describes where respondents are located
n=599
Part 4. Caveats to this study There are inherent limitations to survey research that need to be carefully considered before
drawing inferences from findings. The following items are specific limitations that are germane to
most web-based surveys.
Non-response bias: The current findings are based on a sample of survey returns. We sent
surveys to a representative sample of individuals, resulting in a large number of usable returned
responses. Despite non-response tests, it is always possible that individuals who did not
participate are substantially different in terms of underlying beliefs from those who completed
the instrument.
Sampling-frame bias: The accuracy is based on contact information and the degree to which
the list is representative of individuals who are IT or IT security practitioners. We also
acknowledge that the results may be biased by external events such as media coverage.
Finally, because we used a web-based collection method, it is possible that non-web responses
by mailed survey or telephone call would result in a different pattern of findings.
Self-reported results: The quality of survey research is based on the integrity of confidential
responses received from subjects. While certain checks and balances can be incorporated into
the survey process, there is always the possibility that a subject did not provide accurate
responses.
21
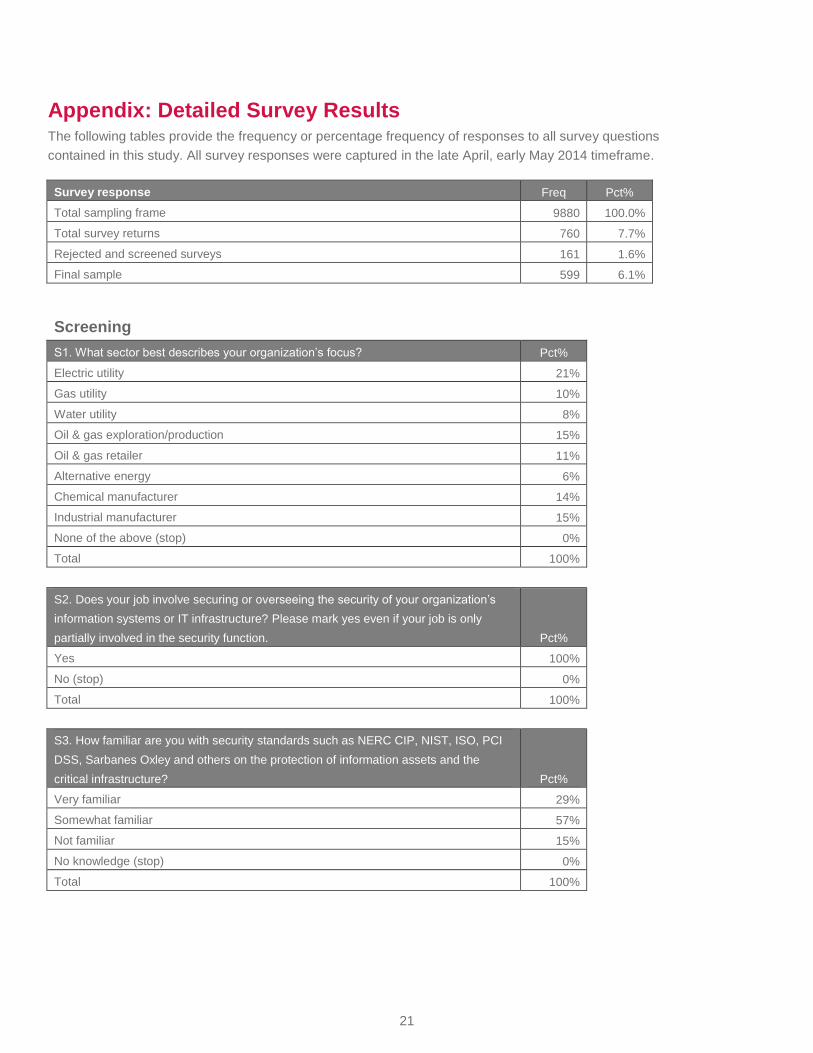
Appendix: Detailed Survey Results The following tables provide the frequency or percentage frequency of responses to all survey questions
contained in this study. All survey responses were captured in the late April, early May 2014 timeframe.
Survey response Freq Pct%
Total sampling frame 9880 100.0%
Total survey returns 760 7.7%
Rejected and screened surveys 161 1.6%
Final sample 599 6.1%
Screening
S1. What sector best describes your organization’s focus? Pct%
Electric utility 21%
Gas utility 10%
Water utility 8%
Oil & gas exploration/production 15%
Oil & gas retailer 11%
Alternative energy 6%
Chemical manufacturer 14%
Industrial manufacturer 15%
None of the above (stop) 0%
Total 100%
S2. Does your job involve securing or overseeing the security of your organization’s
information systems or IT infrastructure? Please mark yes even if your job is only
partially involved in the security function. Pct%
Yes 100%
No (stop) 0%
Total 100%
S3. How familiar are you with security standards such as NERC CIP, NIST, ISO, PCI
DSS, Sarbanes Oxley and others on the protection of information assets and the
critical infrastructure? Pct%
Very familiar 29%
Somewhat familiar 57%
Not familiar 15%
No knowledge (stop) 0%
Total 100%
22
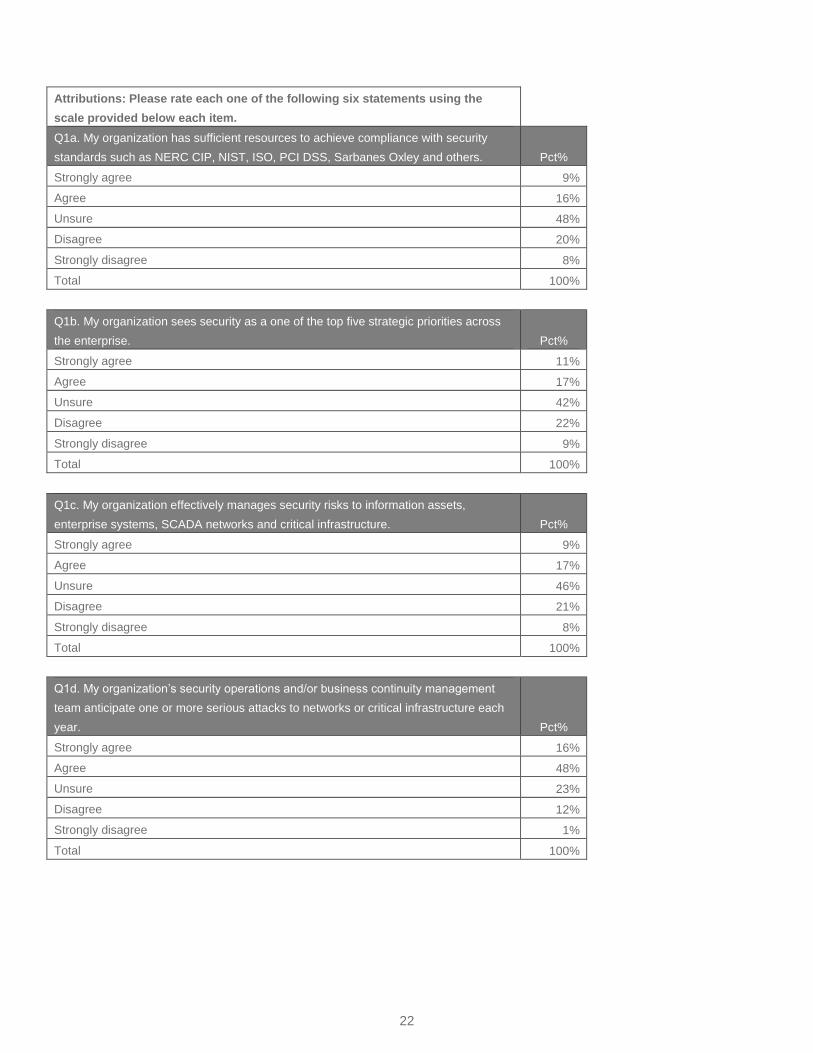
Attributions: Please rate each one of the following six statements using the
scale provided below each item.
Q1a. My organization has sufficient resources to achieve compliance with security
standards such as NERC CIP, NIST, ISO, PCI DSS, Sarbanes Oxley and others. Pct%
Strongly agree 9%
Agree 16%
Unsure 48%
Disagree 20%
Strongly disagree 8%
Total 100%
Q1b. My organization sees security as a one of the top five strategic priorities across
the enterprise. Pct%
Strongly agree 11%
Agree 17%
Unsure 42%
Disagree 22%
Strongly disagree 9%
Total 100%
Q1c. My organization effectively manages security risks to information assets,
enterprise systems, SCADA networks and critical infrastructure. Pct%
Strongly agree 9%
Agree 17%
Unsure 46%
Disagree 21%
Strongly disagree 8%
Total 100%
Q1d. My organization’s security operations and/or business continuity management
team anticipate one or more serious attacks to networks or critical infrastructure each
year. Pct%
Strongly agree 16%
Agree 48%
Unsure 23%
Disagree 12%
Strongly disagree 1%
Total 100%
23
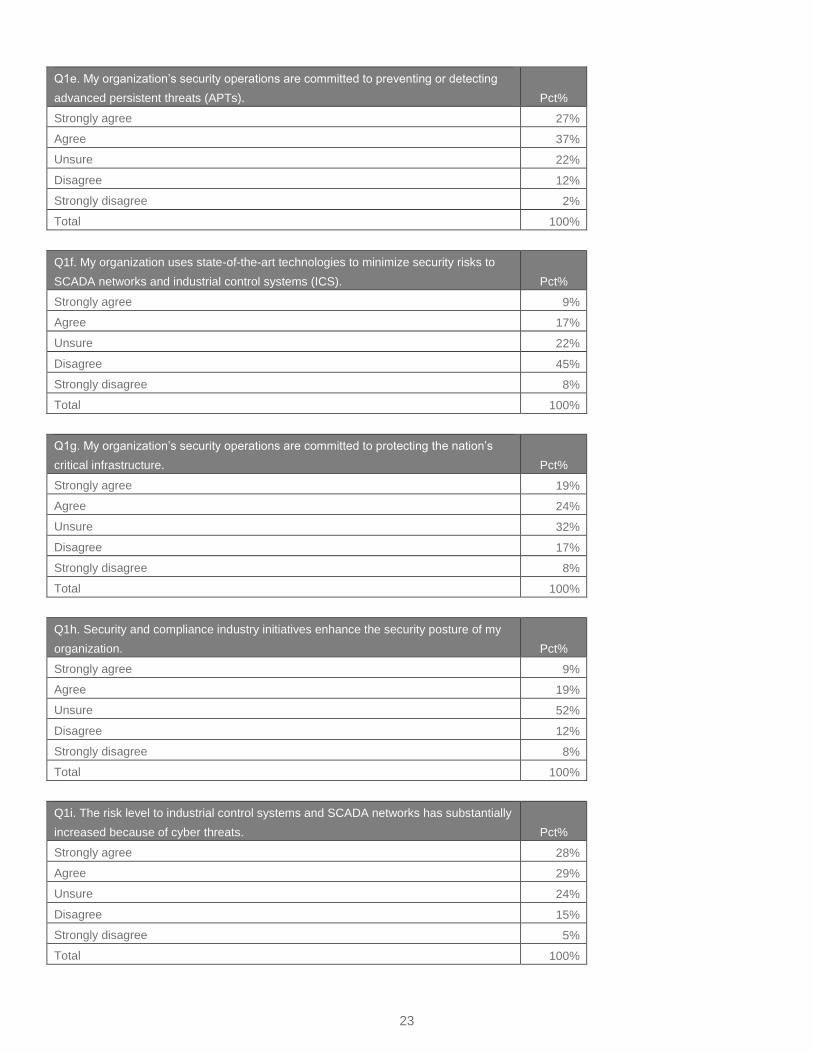
Q1e. My organization’s security operations are committed to preventing or detecting
advanced persistent threats (APTs). Pct%
Strongly agree 27%
Agree 37%
Unsure 22%
Disagree 12%
Strongly disagree 2%
Total 100%
Q1f. My organization uses state-of-the-art technologies to minimize security risks to
SCADA networks and industrial control systems (ICS). Pct%
Strongly agree 9%
Agree 17%
Unsure 22%
Disagree 45%
Strongly disagree 8%
Total 100%
Q1g. My organization’s security operations are committed to protecting the nation’s
critical infrastructure. Pct%
Strongly agree 19%
Agree 24%
Unsure 32%
Disagree 17%
Strongly disagree 8%
Total 100%
Q1h. Security and compliance industry initiatives enhance the security posture of my
organization. Pct%
Strongly agree 9%
Agree 19%
Unsure 52%
Disagree 12%
Strongly disagree 8%
Total 100%
Q1i. The risk level to industrial control systems and SCADA networks has substantially
increased because of cyber threats. Pct%
Strongly agree 28%
Agree 29%
Unsure 24%
Disagree 15%
Strongly disagree 5%
Total 100%
24
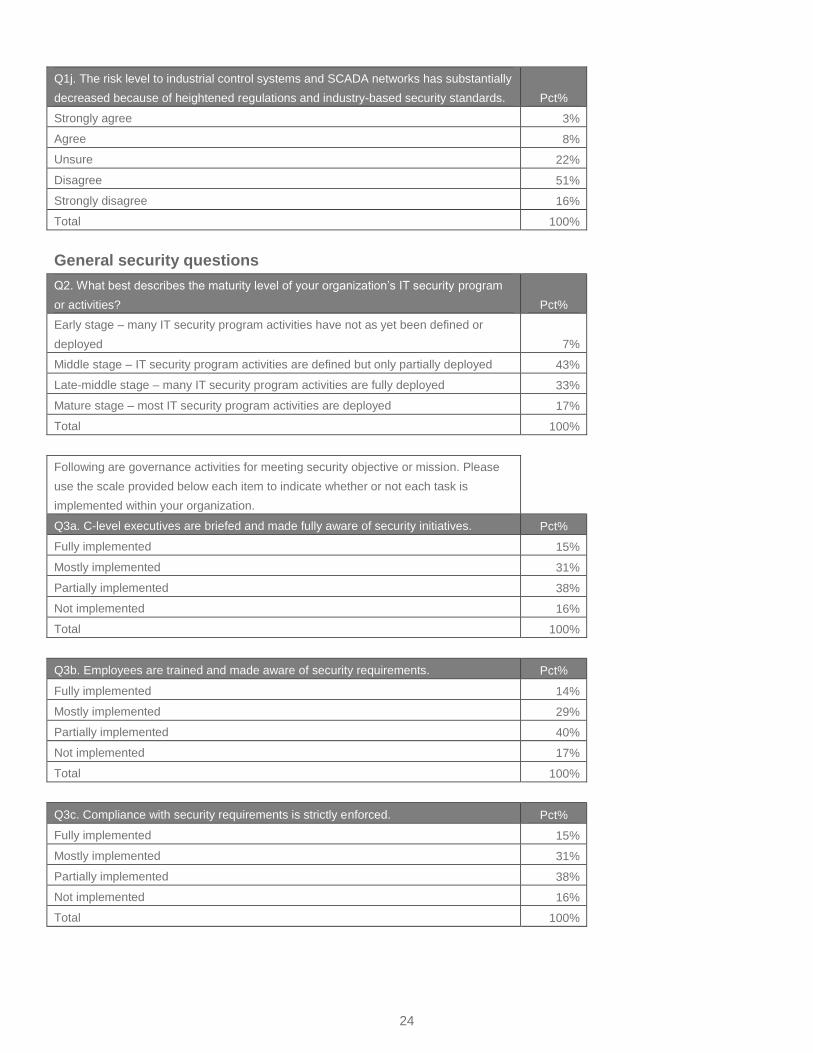
Q1j. The risk level to industrial control systems and SCADA networks has substantially
decreased because of heightened regulations and industry-based security standards. Pct%
Strongly agree 3%
Agree 8%
Unsure 22%
Disagree 51%
Strongly disagree 16%
Total 100%
General security questions
Q2. What best describes the maturity level of your organization’s IT security program
or activities? Pct%
Early stage – many IT security program activities have not as yet been defined or
deployed 7%
Middle stage – IT security program activities are defined but only partially deployed 43%
Late-middle stage – many IT security program activities are fully deployed 33%
Mature stage – most IT security program activities are deployed 17%
Total 100%
Following are governance activities for meeting security objective or mission. Please
use the scale provided below each item to indicate whether or not each task is
implemented within your organization.
Q3a. C-level executives are briefed and made fully aware of security initiatives. Pct%
Fully implemented 15%
Mostly implemented 31%
Partially implemented 38%
Not implemented 16%
Total 100%
Q3b. Employees are trained and made aware of security requirements. Pct%
Fully implemented 14%
Mostly implemented 29%
Partially implemented 40%
Not implemented 17%
Total 100%
Q3c. Compliance with security requirements is strictly enforced. Pct%
Fully implemented 15%
Mostly implemented 31%
Partially implemented 38%
Not implemented 16%
Total 100%
25
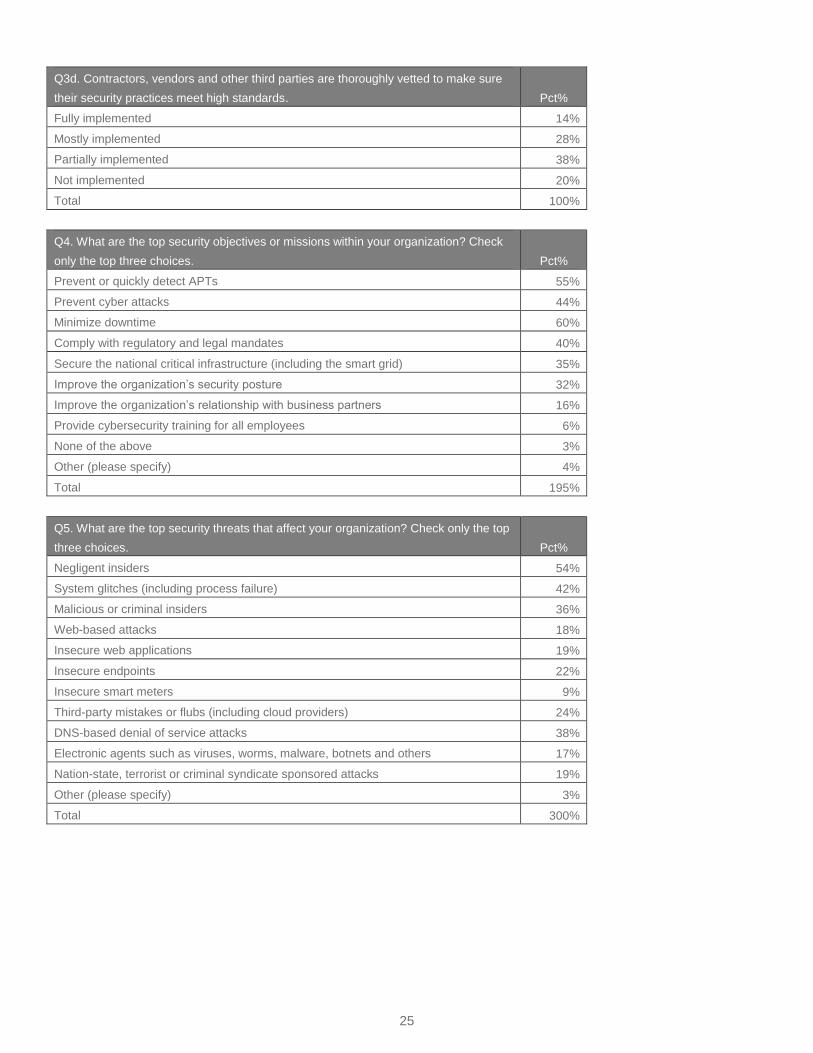
Q3d. Contractors, vendors and other third parties are thoroughly vetted to make sure
their security practices meet high standards. Pct%
Fully implemented 14%
Mostly implemented 28%
Partially implemented 38%
Not implemented 20%
Total 100%
Q4. What are the top security objectives or missions within your organization? Check
only the top three choices. Pct%
Prevent or quickly detect APTs 55%
Prevent cyber attacks 44%
Minimize downtime 60%
Comply with regulatory and legal mandates 40%
Secure the national critical infrastructure (including the smart grid) 35%
Improve the organization’s security posture 32%
Improve the organization’s relationship with business partners 16%
Provide cybersecurity training for all employees 6%
None of the above 3%
Other (please specify) 4%
Total 195%
Q5. What are the top security threats that affect your organization? Check only the top
three choices. Pct%
Negligent insiders 54%
System glitches (including process failure) 42%
Malicious or criminal insiders 36%
Web-based attacks 18%
Insecure web applications 19%
Insecure endpoints 22%
Insecure smart meters 9%
Third-party mistakes or flubs (including cloud providers) 24%
DNS-based denial of service attacks 38%
Electronic agents such as viruses, worms, malware, botnets and others 17%
Nation-state, terrorist or criminal syndicate sponsored attacks 19%
Other (please specify) 3%
Total 300%
26
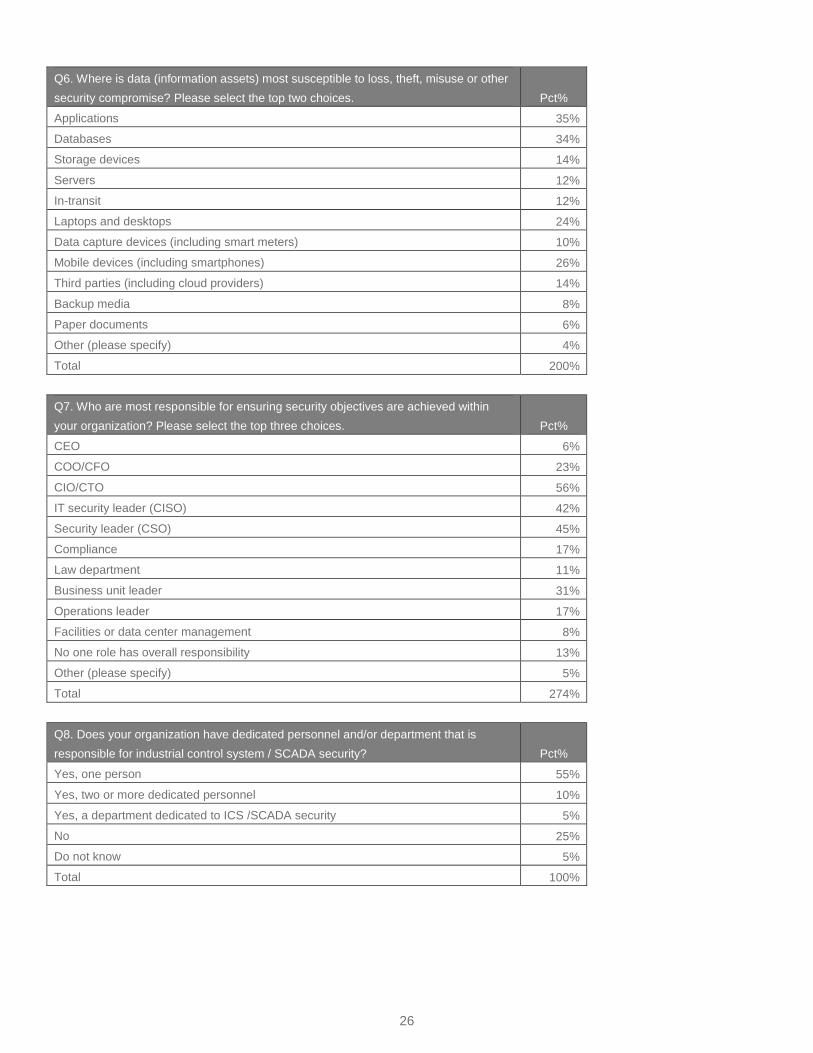
Q6. Where is data (information assets) most susceptible to loss, theft, misuse or other
security compromise? Please select the top two choices. Pct%
Applications 35%
Databases 34%
Storage devices 14%
Servers 12%
In-transit 12%
Laptops and desktops 24%
Data capture devices (including smart meters) 10%
Mobile devices (including smartphones) 26%
Third parties (including cloud providers) 14%
Backup media 8%
Paper documents 6%
Other (please specify) 4%
Total 200%
Q7. Who are most responsible for ensuring security objectives are achieved within
your organization? Please select the top three choices. Pct%
CEO 6%
COO/CFO 23%
CIO/CTO 56%
IT security leader (CISO) 42%
Security leader (CSO) 45%
Compliance 17%
Law department 11%
Business unit leader 31%
Operations leader 17%
Facilities or data center management 8%
No one role has overall responsibility 13%
Other (please specify) 5%
Total 274%
Q8. Does your organization have dedicated personnel and/or department that is
responsible for industrial control system / SCADA security? Pct%
Yes, one person 55%
Yes, two or more dedicated personnel 10%
Yes, a department dedicated to ICS /SCADA security 5%
No 25%
Do not know 5%
Total 100%
27
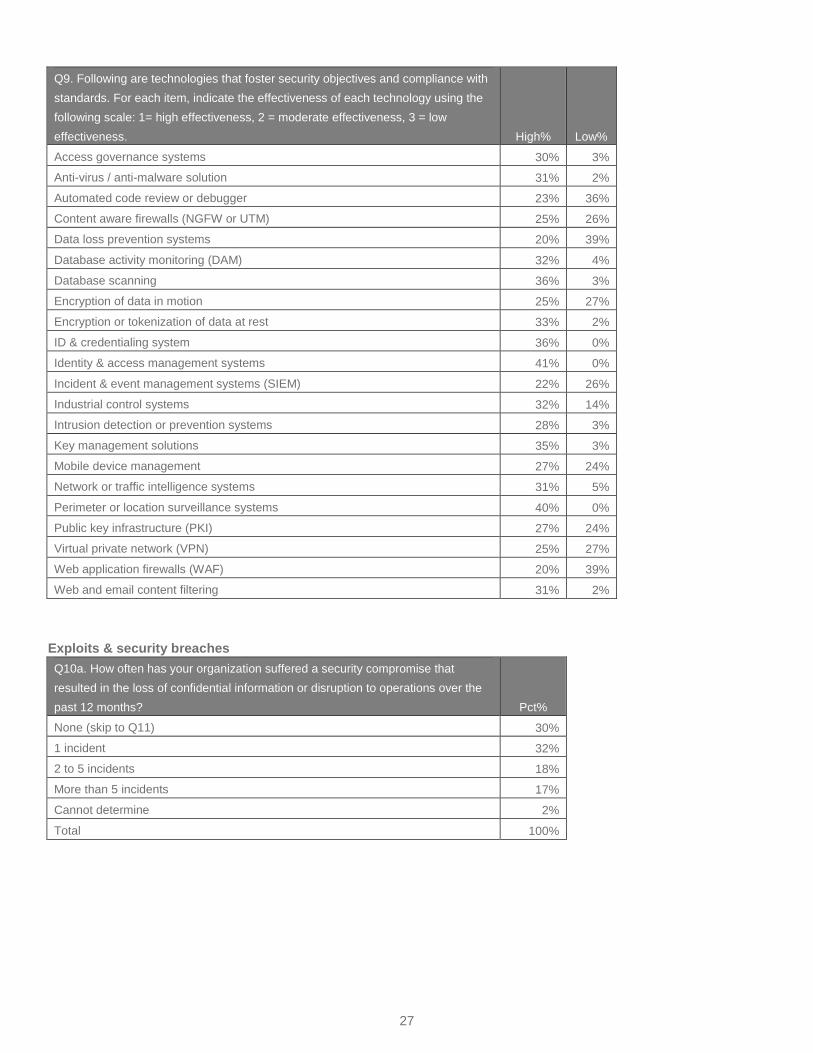
Q9. Following are technologies that foster security objectives and compliance with
standards. For each item, indicate the effectiveness of each technology using the
following scale: 1= high effectiveness, 2 = moderate effectiveness, 3 = low
effectiveness. High% Low%
Access governance systems 30% 3%
Anti-virus / anti-malware solution 31% 2%
Automated code review or debugger 23% 36%
Content aware firewalls (NGFW or UTM) 25% 26%
Data loss prevention systems 20% 39%
Database activity monitoring (DAM) 32% 4%
Database scanning 36% 3%
Encryption of data in motion 25% 27%
Encryption or tokenization of data at rest 33% 2%
ID & credentialing system 36% 0%
Identity & access management systems 41% 0%
Incident & event management systems (SIEM) 22% 26%
Industrial control systems 32% 14%
Intrusion detection or prevention systems 28% 3%
Key management solutions 35% 3%
Mobile device management 27% 24%
Network or traffic intelligence systems 31% 5%
Perimeter or location surveillance systems 40% 0%
Public key infrastructure (PKI) 27% 24%
Virtual private network (VPN) 25% 27%
Web application firewalls (WAF) 20% 39%
Web and email content filtering 31% 2%
Exploits & security breaches
Q10a. How often has your organization suffered a security compromise that
resulted in the loss of confidential information or disruption to operations over the
past 12 months? Pct%
None (skip to Q11) 30%
1 incident 32%
2 to 5 incidents 18%
More than 5 incidents 17%
Cannot determine 2%
Total 100%
28
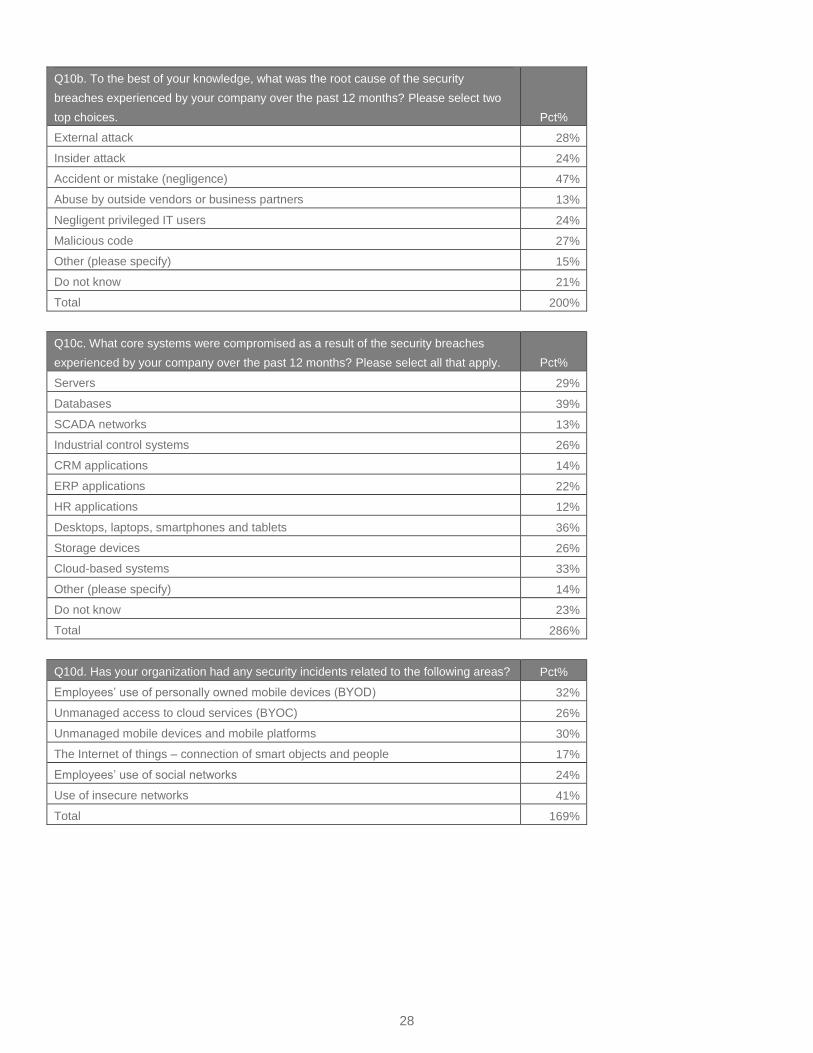
Q10b. To the best of your knowledge, what was the root cause of the security
breaches experienced by your company over the past 12 months? Please select two
top choices. Pct%
External attack 28%
Insider attack 24%
Accident or mistake (negligence) 47%
Abuse by outside vendors or business partners 13%
Negligent privileged IT users 24%
Malicious code 27%
Other (please specify) 15%
Do not know 21%
Total 200%
Q10c. What core systems were compromised as a result of the security breaches
experienced by your company over the past 12 months? Please select all that apply. Pct%
Servers 29%
Databases 39%
SCADA networks 13%
Industrial control systems 26%
CRM applications 14%
ERP applications 22%
HR applications 12%
Desktops, laptops, smartphones and tablets 36%
Storage devices 26%
Cloud-based systems 33%
Other (please specify) 14%
Do not know 23%
Total 286%
Q10d. Has your organization had any security incidents related to the following areas? Pct%
Employees’ use of personally owned mobile devices (BYOD) 32%
Unmanaged access to cloud services (BYOC) 26%
Unmanaged mobile devices and mobile platforms 30%
The Internet of things – connection of smart objects and people 17%
Employees’ use of social networks 24%
Use of insecure networks 41%
Total 169%
29
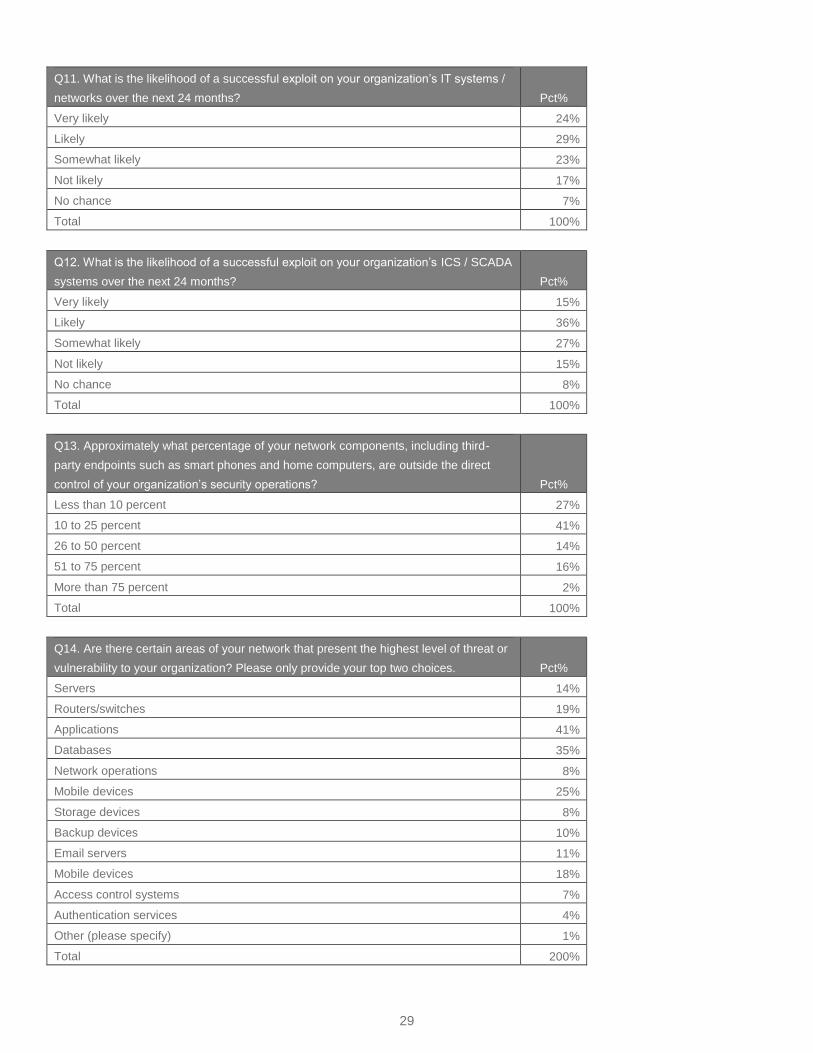
Q11. What is the likelihood of a successful exploit on your organization’s IT systems /
networks over the next 24 months? Pct%
Very likely 24%
Likely 29%
Somewhat likely 23%
Not likely 17%
No chance 7%
Total 100%
Q12. What is the likelihood of a successful exploit on your organization’s ICS / SCADA
systems over the next 24 months? Pct%
Very likely 15%
Likely 36%
Somewhat likely 27%
Not likely 15%
No chance 8%
Total 100%
Q13. Approximately what percentage of your network components, including third-
party endpoints such as smart phones and home computers, are outside the direct
control of your organization’s security operations? Pct%
Less than 10 percent 27%
10 to 25 percent 41%
26 to 50 percent 14%
51 to 75 percent 16%
More than 75 percent 2%
Total 100%
Q14. Are there certain areas of your network that present the highest level of threat or
vulnerability to your organization? Please only provide your top two choices. Pct%
Servers 14%
Routers/switches 19%
Applications 41%
Databases 35%
Network operations 8%
Mobile devices 25%
Storage devices 8%
Backup devices 10%
Email servers 11%
Mobile devices 18%
Access control systems 7%
Authentication services 4%
Other (please specify) 1%
Total 200%
30
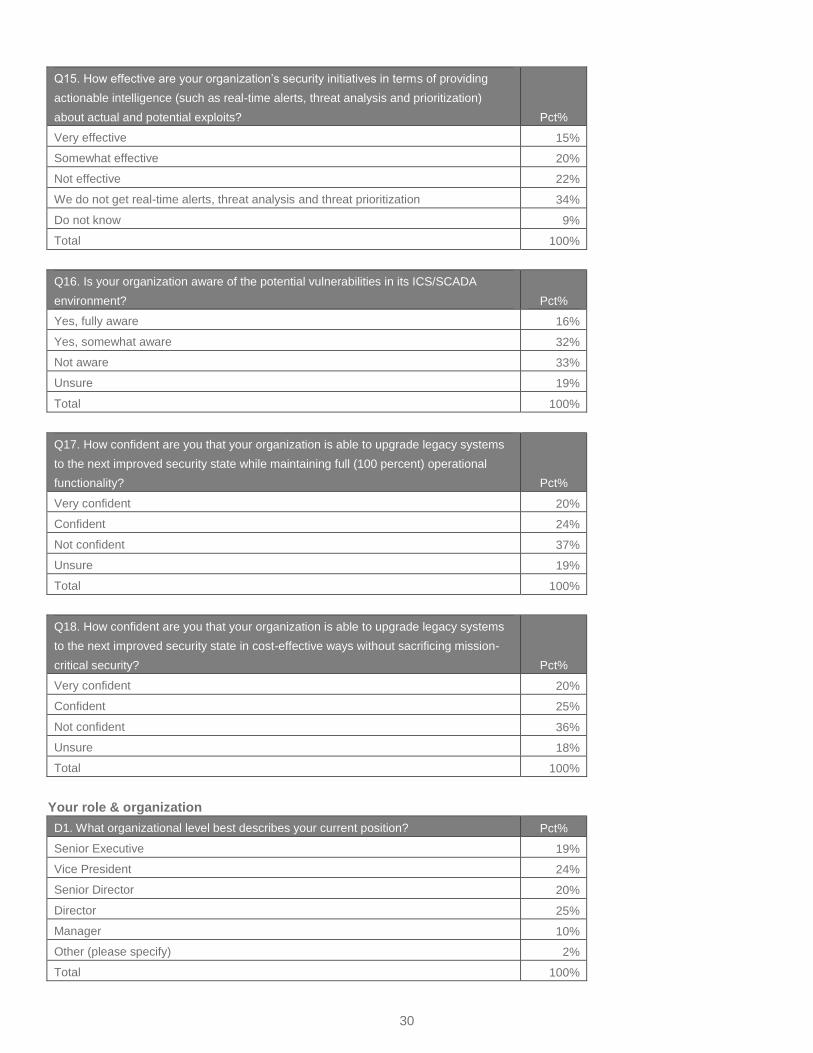
Q15. How effective are your organization’s security initiatives in terms of providing
actionable intelligence (such as real-time alerts, threat analysis and prioritization)
about actual and potential exploits? Pct%
Very effective 15%
Somewhat effective 20%
Not effective 22%
We do not get real-time alerts, threat analysis and threat prioritization 34%
Do not know 9%
Total 100%
Q16. Is your organization aware of the potential vulnerabilities in its ICS/SCADA
environment? Pct%
Yes, fully aware 16%
Yes, somewhat aware 32%
Not aware 33%
Unsure 19%
Total 100%
Q17. How confident are you that your organization is able to upgrade legacy systems
to the next improved security state while maintaining full (100 percent) operational
functionality? Pct%
Very confident 20%
Confident 24%
Not confident 37%
Unsure 19%
Total 100%
Q18. How confident are you that your organization is able to upgrade legacy systems
to the next improved security state in cost-effective ways without sacrificing mission-
critical security? Pct%
Very confident 20%
Confident 25%
Not confident 36%
Unsure 18%
Total 100%
Your role & organization
D1. What organizational level best describes your current position? Pct%
Senior Executive 19%
Vice President 24%
Senior Director 20%
Director 25%
Manager 10%
Other (please specify) 2%
Total 100%
31
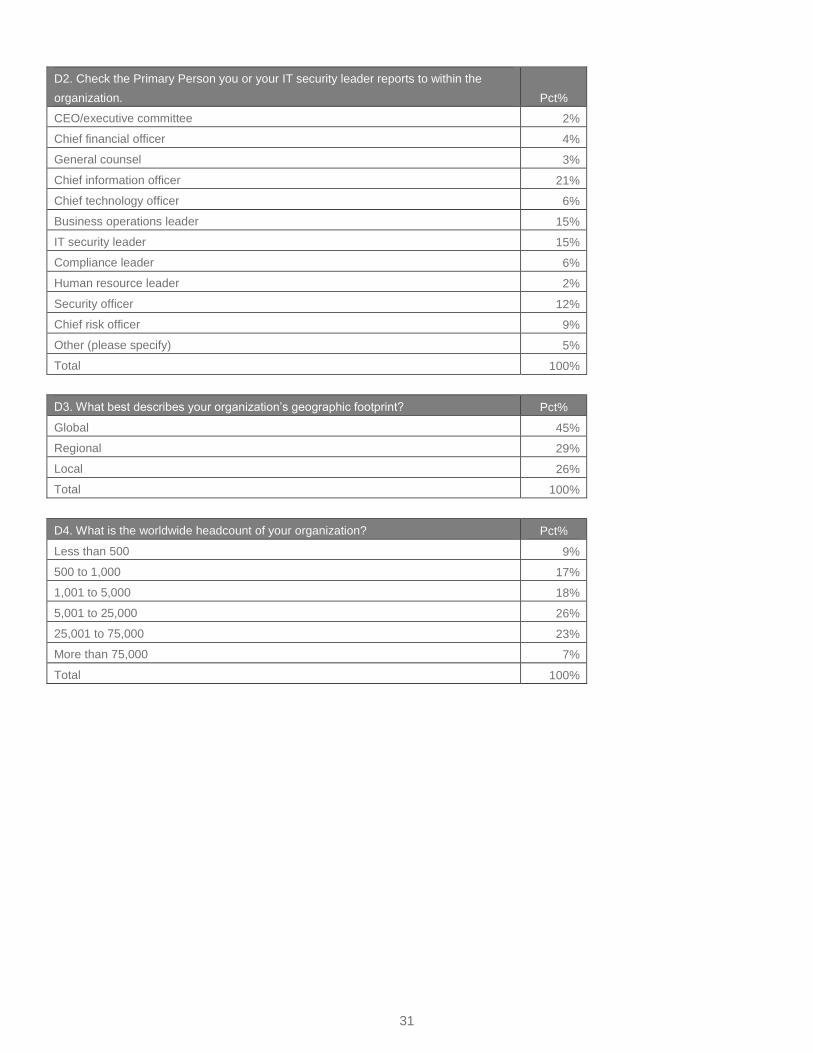
D2. Check the Primary Person you or your IT security leader reports to within the
organization. Pct%
CEO/executive committee 2%
Chief financial officer 4%
General counsel 3%
Chief information officer 21%
Chief technology officer 6%
Business operations leader 15%
IT security leader 15%
Compliance leader 6%
Human resource leader 2%
Security officer 12%
Chief risk officer 9%
Other (please specify) 5%
Total 100%
D3. What best describes your organization’s geographic footprint? Pct%
Global 45%
Regional 29%
Local 26%
Total 100%
D4. What is the worldwide headcount of your organization? Pct%
Less than 500 9%
500 to 1,000 17%
1,001 to 5,000 18%
5,001 to 25,000 26%
25,001 to 75,000 23%
More than 75,000 7%
Total 100%
32
D5. Countries represented Pct%
United States 34%
Canada 7%
United Kingdom 12%
France 6%
Germany 10%
Spain 2%
Netherlands 4%
Australia 6%
New Zealand 2%
Malaysia 5%
Mexico 5%
Brazil 6%
Colombia 1%
Other 0%
Total 100%
33
Ponemon Institute
Advancing Responsible Information Management
Ponemon Institute is dedicated to independent research and education that advances
responsible information and privacy management practices within business and
government. Our mission is to conduct high quality, empirical studies on critical issues
affecting the management and security of sensitive information about people and
organizations.
As a member of the Council of American Survey Research Organizations (CASRO),
we uphold strict data confidentiality, privacy and ethical research standards. We do not
collect any personally identifiable information from individuals (or company identifiable
information in our business research). Furthermore, we have strict quality standards to
ensure that subjects are not asked extraneous, irrelevant or improper questions.
For more information visit www.unisys.com
© 2014 Unisys Corporation. All rights reserved.
Unisys and the Unisys logo are registered trademarks of Unisys Corporation. All other brands and products
referenced herein are acknowledged to be trademarks or registered trademarks of their respective holders.
07/14 14-0316
About Unisys
Unisys brings together services and technology into solutions that solve mission-critical
problems for organizations around the world. With 23,000 employees in over 100
countries, we help our clients secure their operations, increase the efficiency and utilization
of their data centers, enhance support to their end users and constituents, and modernize
their enterprise applications.
The primary vertical markets Unisys serves worldwide include the public sector (including
the US federal government), financial services and other commercial markets including
communications and transportation. We have strong alliances and collaborative
relationships with technology leaders, including Microsoft, BMC, Intel, NetApp, EMC and
other solution providers.
Unisys supports millions of desktops worldwide, and delivers solutions for 22 of top 25
global banks, 8 of top 10 life insurers, and 15 of top 25 global airlines and more than 200
airlines worldwide. Our processes are end-to-end ITIL v3 compliant and Global ISO 20000,
27001 and 9001 certified. Unisys holds over 1,500 U.S. and non-U.S. patents.
To drive future growth, Unisys is focusing its resources and investments in four targeted
market areas: security; data center transformation, including our server business; end user
outsourcing; and applications modernization.
Recommended