CryoTEMPO-EOLIS
Elevation Over Land Ice from Swath
Product Handbook
Land Ice Elevation Thematic Point Product
Land Ice Elevation Thematic Gridded Product
Issue: 1.1
Date: 25th April 2020
Issue 1.1
CryoTEMPO-EOLIS: Product Handbook
ApprovalApprovalApprovalApproval
Name Date Signed
Jerome Bouffard
ESA
08/05/2020
Noel Gourmelen
University of Edinburgh
27/04/2020
Martin Ewart
Earthwave
27/04/2020
Document VersionsDocument VersionsDocument VersionsDocument Versions
Issue Date Doc ID Validated by Reason for change
1.0 10 Oct 2019 First version of document
1.1 25 Apr 2020 CS_CTS_PHB_EWAVE_0101 Revisions for first release
Issue 1.1
CryoTEMPO-EOLIS: Product Handbook
ContentsContentsContentsContents 1. Introduction .............................................................................................................................. 5
1.1 Acknowledgements ............................................................................................................ 6
1.2 Reference Documents ........................................................................................................ 7
1.3 Reference Websites ........................................................................................................... 7
1.4 Versioning .......................................................................................................................... 7
2. Processing ................................................................................................................................. 8
2.1 Swath generation and ingestion ......................................................................................... 8
2.2 POCA ingestion .................................................................................................................. 9
2.3 Coordinate System Projection ............................................................................................ 9
2.4 Uncertainty Score............................................................................................................. 10
2.5 Thematic Point Product .................................................................................................... 12
2.6 Thematic Gridded Product ............................................................................................... 12
2.6.1 Gridding Methodology.............................................................................................. 12
2.6.2 Uncertainty in gridded data ...................................................................................... 13
2.7 Masking of boundaries ..................................................................................................... 13
2.8 Known Issues ................................................................................................................... 14
2.8.1 Phase Model Correction ........................................................................................... 14
2.8.2 South Greenland Coverage ....................................................................................... 14
2.8.3 LRM Boundary .......................................................................................................... 15
3. Product Description ................................................................................................................. 16
3.1 Swath Thematic Point Product ......................................................................................... 16
3.1.1 Areas of Interest ....................................................................................................... 16
3.1.2 Temporal Coverage .................................................................................................. 17
3.2 Swath Thematic Gridded Product ..................................................................................... 18
3.2.1 Area of Interest ........................................................................................................ 18
3.2.2 Temporal Coverage .................................................................................................. 18
4. Format ..................................................................................................................................... 19
4.1 Nomenclature .................................................................................................................. 19
4.1.1 Point Product Nomenclature .................................................................................... 19
4.1.2 Gridded Product Nomenclature ................................................................................ 20
4.1.3 Shp file nomenclature .............................................................................................. 20
4.2 Thematic Point Product .................................................................................................... 20
4.2.1 Dimensions............................................................................................................... 20
4.2.2 Data Handling ........................................................................................................... 20
Issue 1.1
CryoTEMPO-EOLIS: Product Handbook
4.2.3 Attributes – Sample Data file .................................................................................... 21
4.2.4 Sample HDR file ........................................................................................................ 22
4.3 Thematic Gridded Product ............................................................................................... 23
4.3.1 Dimensions............................................................................................................... 23
4.3.2 Data Handling ........................................................................................................... 23
4.3.3 Attributes - Sample File ............................................................................................ 24
4.3.4 HDR File Description ................................................................................................. 25
5. Product Access ........................................................................................................................ 27
6. Contacts .................................................................................................................................. 28
List of acronymsList of acronymsList of acronymsList of acronyms
DEM Digital Elevation Model
EO Earth Observation
EOLIS Elevation Over Land Ice from Swath
ESA European Space Agency
FTP file transfer protocol
GDAL Geospatial Data Abstraction Library
GS Ground Segment
InSAR Interferometric Synthetic Aperture Radar
LRM Low Resolution Mode of the CryoSat-2 radar sensor
NetCDF Network Common Data Form ( binary file format )
OIB Operation Ice Bridge
PDGS Payload Download Ground Segment
POCA Point-Of-Closest-Approach
SARIn The CryoSat-2 SAR Interferometry mode
STSE Science, Technology, Society and Environment education
UoE University of Edinburgh
UTC Coordinated Universal Time
XML Extensible Mark-up Language
Issue 1.1
CryoTEMPO-EOLIS: Product Handbook
1.1.1.1. IntroductionIntroductionIntroductionIntroduction CryoSat-2’s primary mission objectives are to monitor the changes affecting the world’s sea-ice and
large ice sheets to quantify thickness, mass trends and the contribution to sea-level change. In
practice, CryoSat’s revolutionary interferometric design has allowed several technical breakthroughs
and led to the application of radar altimetry to environments that were previously unforeseen. One
such breakthrough is Swath processing of CryoSat’s SARIn mode making full exploitation of the
information contained in CryoSat’s waveforms and leading to one to two orders of magnitude more
measurements than the conventional so-called POCA technique.
Following on from the early demonstration of the technique and of its potential impact, the "CryoSat
ThEMatic PrOducts - SWATH Cryo-TEMPO" project (CryoTEMPO-EOLIS) aims to consolidate the
research and development undertaken during the CryoSat+ CryoTop / CryoTop evolution ESA STSE
projects (Gourmelen et al., 2018) into operational products. The purpose of the thematic products is
to make the data available to the wider scientific community in a form that does not require a detailed
understanding of the sensor used and extensive post-processing. The CryoTEMPO-EOLIS consists of
two distinct products;
1) a point product containing a cloud of elevations with an associated uncertainty in geo spatial
units; and
2) a gridded product containing a spatial interpolation of the point product onto a uniform grid
of elevation and uncertainty.
The products are first released over Greenland and Antarctica, and in a second phase for the other
major land ice regions.
This Product Handbook describes the operational products, a point cloud product containing the
elevations derived using a swath processing algorithm and a gridded product with elevations at
regularly spaced points on a grid. The operational products provide analysis ready data to a wider
community of scientists rather than individual altimetry experts.
Issue 1.1
CryoTEMPO-EOLIS: Product Handbook
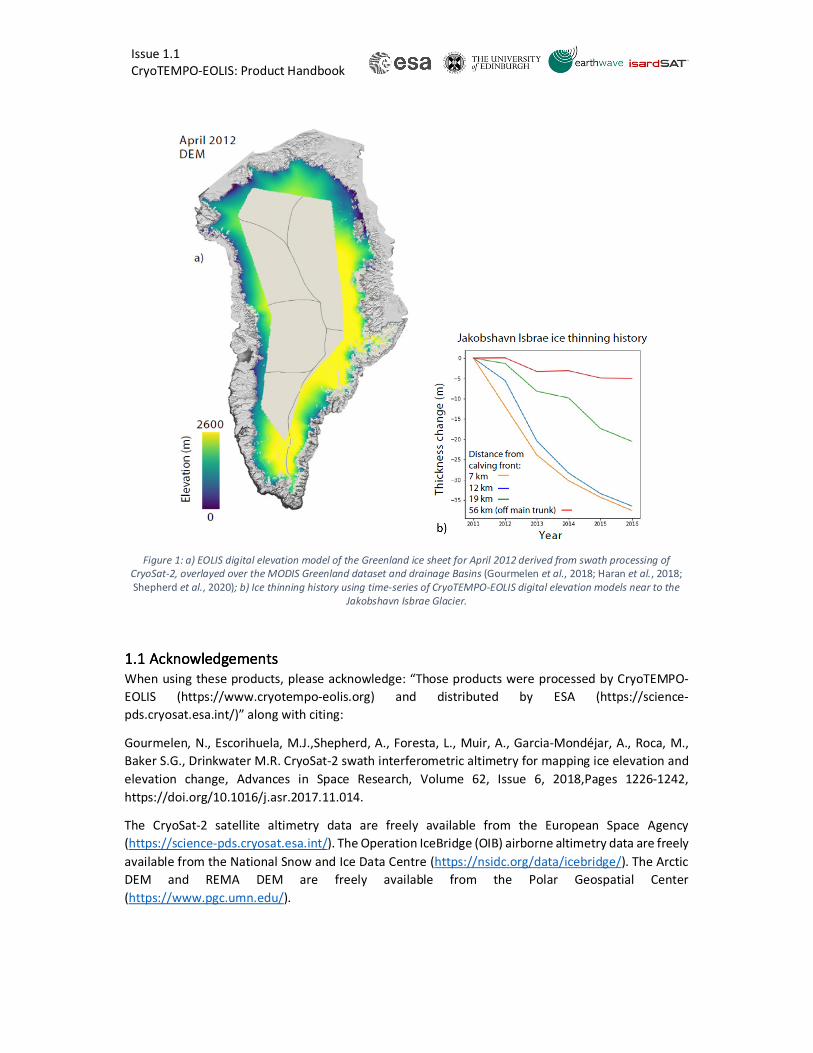
Figure 1: a) EOLIS digital elevation model of the Greenland ice sheet for April 2012 derived from swath processing of
CryoSat-2, overlayed over the MODIS Greenland dataset and drainage Basins (Gourmelen et al., 2018; Haran et al., 2018;
Shepherd et al., 2020); b) Ice thinning history using time-series of CryoTEMPO-EOLIS digital elevation models near to the
Jakobshavn Isbrae Glacier.
1.11.11.11.1 AcknowledgementsAcknowledgementsAcknowledgementsAcknowledgements
When using these products, please acknowledge: “Those products were processed by CryoTEMPO-
EOLIS (https://www.cryotempo-eolis.org) and distributed by ESA (https://science-
pds.cryosat.esa.int/)” along with citing:
Gourmelen, N., Escorihuela, M.J.,Shepherd, A., Foresta, L., Muir, A., Garcia-Mondéjar, A., Roca, M.,
Baker S.G., Drinkwater M.R. CryoSat-2 swath interferometric altimetry for mapping ice elevation and
elevation change, Advances in Space Research, Volume 62, Issue 6, 2018,Pages 1226-1242,
https://doi.org/10.1016/j.asr.2017.11.014.
The CryoSat-2 satellite altimetry data are freely available from the European Space Agency
(https://science-pds.cryosat.esa.int/). The Operation IceBridge (OIB) airborne altimetry data are freely
available from the National Snow and Ice Data Centre (https://nsidc.org/data/icebridge/). The Arctic
DEM and REMA DEM are freely available from the Polar Geospatial Center
(https://www.pgc.umn.edu/).
Issue 1.1
CryoTEMPO-EOLIS: Product Handbook
1.21.21.21.2 ReferenceReferenceReferenceReference DocumentsDocumentsDocumentsDocuments
Gourmelen, N. et al. (2018) ‘CryoSat-2 swath interferometric altimetry for mapping ice elevation and
elevation change’, Advances in Space Research. Pergamon, 62(6), pp. 1226–1242. doi:
10.1016/J.ASR.2017.11.014.
Haran, T. et al. (2018) MEaSUREs MODIS Mosaic of Greenland (MOG) 2005, 2010, and 2015 Image
Maps, Version 2. Boulder, Colorado USA. NSIDC: National Snow and Ice Data Center. doi:
https://doi.org/10.5067/9ZO79PHOTYE5.
Howat, I. M. et al. (2019) ‘The Reference Elevation Model of Antarctica’, The Cryosphere, 13, pp.
665–674. doi: https://doi.org/10.5194/tc-13-665-2019.
Krabill, W. B. (2016) IceBridge ATM L2 Icessn Elevation, Slope, and Roughness, Version 2. NASA
National Snow and Ice Data Center Distributed Active Archive Center, Boulder, Colorado USA. http://
nsidc.org/data/ilatm2.
Porter, C. et al. (2018) ArcticDEM, Harvard Dataverse, V1. doi:
https://doi.org/10.7910/DVN/OHHUKH.
Recchia, L. et al. (2017) ‘An Accurate Semianalytical Waveform Model for Mispointed SAR
Interferometric Altimeters’, IEEE Geoscience and Remote Sensing Letters, 14(9), pp. 1537–1541. doi:
10.1109/LGRS.2017.2720847.
Rignot, E. et al. (2011) ‘Acceleration of the contribution of the Greenland and Antarctic ice sheets to
sea level rise’, Geophysical Research Letters. John Wiley & Sons, Ltd, 38(5). doi:
10.1029/2011GL046583.
Shepherd, A. et al. (2020) ‘Mass balance of the Greenland Ice Sheet from 1992 to 2018’, Nature,
579(7798), pp. 233–239. doi: 10.1038/s41586-019-1855-2.
Wingham, D. J. et al. (2004) ‘The mean echo and echo cross product from a beamforming
interferometric altimeter and their application to elevation measurement’, IEEE Transactions on
Geoscience and Remote Sensing, 42(10), pp. 2305–2323. doi: 10.1109/TGRS.2004.834352.
1.31.31.31.3 Reference Reference Reference Reference WebsitesWebsitesWebsitesWebsites
CryoTEMPO-EOLIS Project Website: http://cryotempo-eolis.org/
CryoTOP Evolution: https://cryotop-evolution.org/
ESA CryoSat-2 Data Download: https://science-pds.cryosat.esa.int/
Operation IceBridge: https://nsidc.org/data/icebridge/
Arctic DEM: https://www.pgc.umn.edu/data/arcticdem/
REMA DEM: https://www.pgc.umn.edu/data/rema/
1.41.41.41.4 VersionVersionVersionVersioninginginging
The chapters below describe the processing of the version 1 of the products. For any new versions of
the products, you will be informed via the ESA PDGS website. The version number is indicated in the
product file name (See section 4.1).
Issue 1.1
CryoTEMPO-EOLIS: Product Handbook
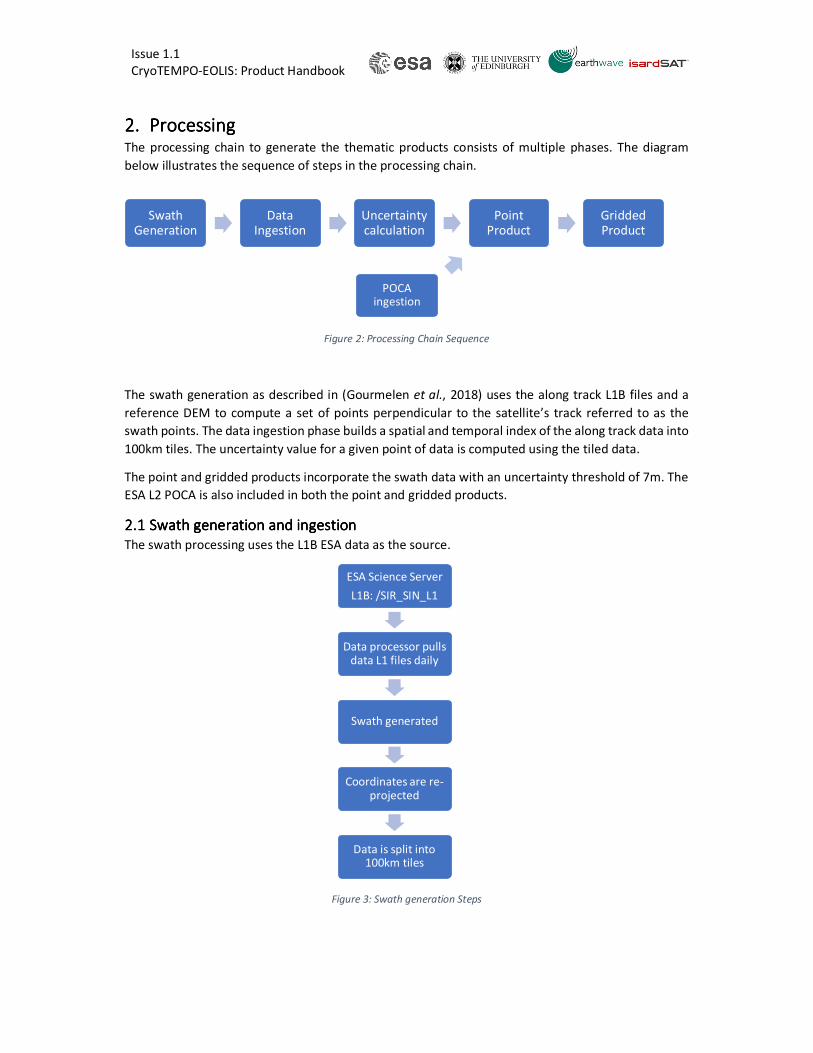
2.2.2.2. ProcessingProcessingProcessingProcessing The processing chain to generate the thematic products consists of multiple phases. The diagram
below illustrates the sequence of steps in the processing chain.
Figure 2: Processing Chain Sequence
The swath generation as described in (Gourmelen et al., 2018) uses the along track L1B files and a
reference DEM to compute a set of points perpendicular to the satellite’s track referred to as the
swath points. The data ingestion phase builds a spatial and temporal index of the along track data into
100km tiles. The uncertainty value for a given point of data is computed using the tiled data.
The point and gridded products incorporate the swath data with an uncertainty threshold of 7m. The
ESA L2 POCA is also included in both the point and gridded products.
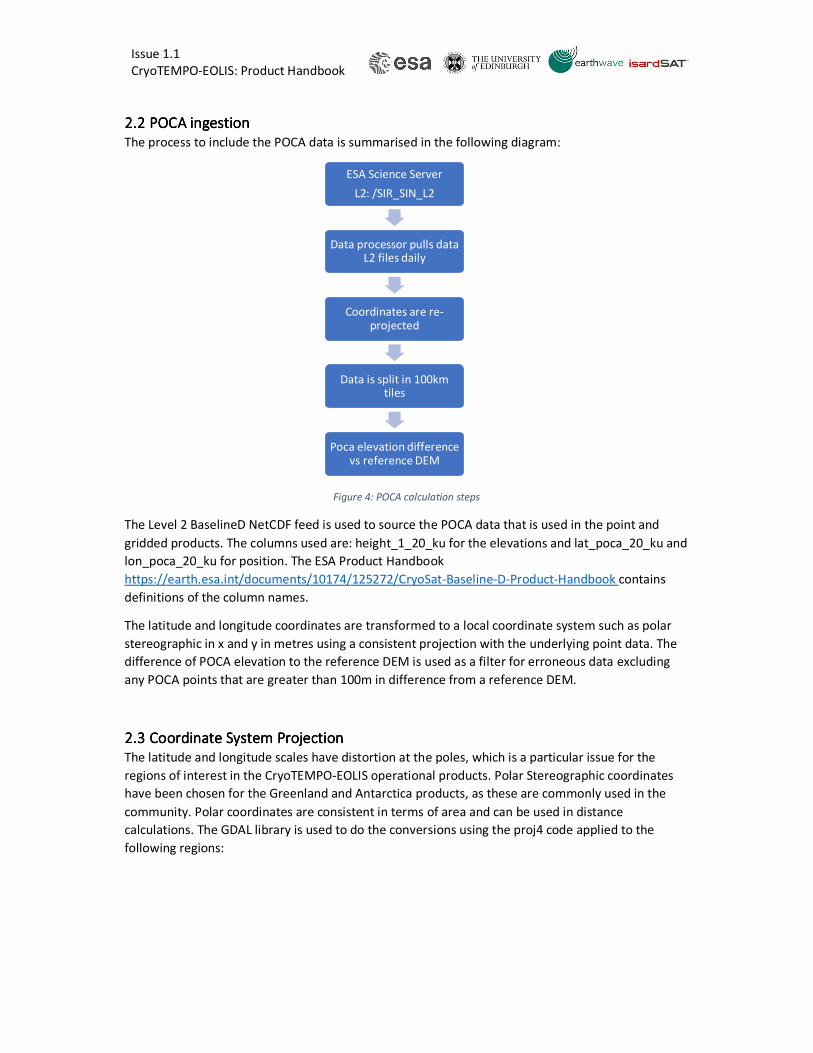
2.12.12.12.1 SwathSwathSwathSwath generation and ingestiongeneration and ingestiongeneration and ingestiongeneration and ingestion
The swath processing uses the L1B ESA data as the source.
Figure 3: Swath generation Steps
Swath Generation
Data Ingestion
Uncertainty calculation
Point Product
Gridded Product
POCA ingestion
ESA Science Server
L1B: /SIR_SIN_L1
Data processor pulls data L1 files daily
Swath generated
Coordinates are re-projected
Data is split into 100km tiles
Issue 1.1
CryoTEMPO-EOLIS: Product Handbook
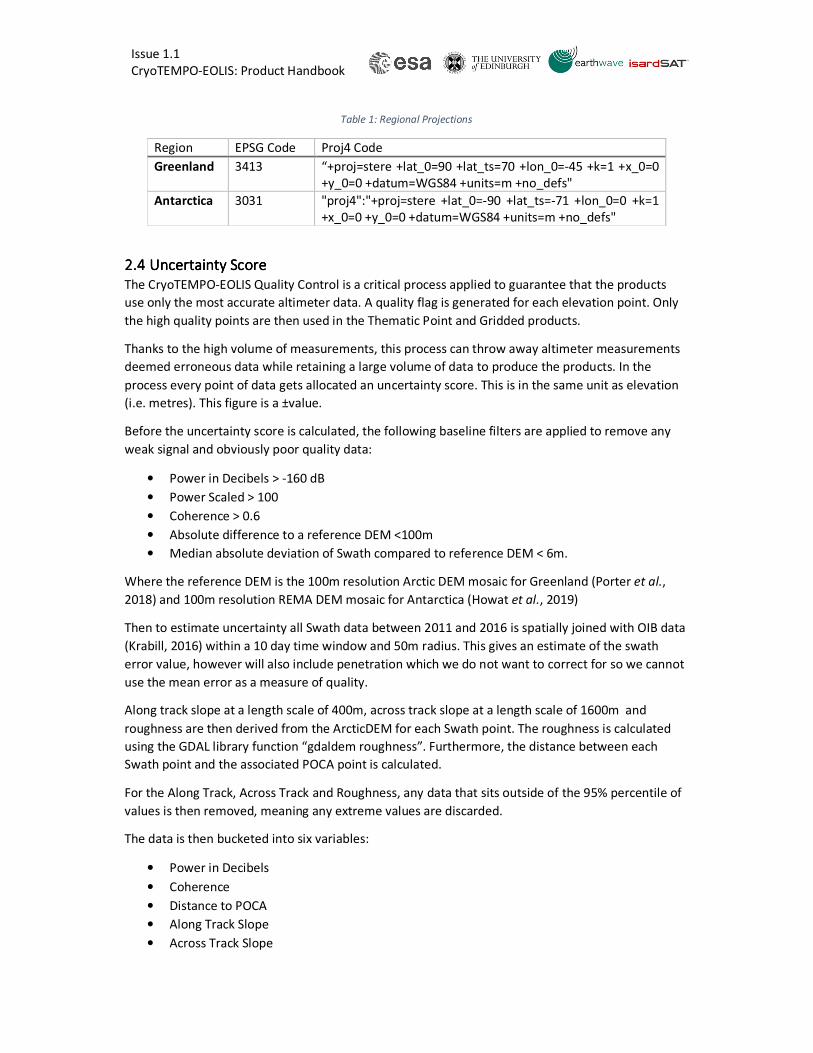
2.22.22.22.2 POCAPOCAPOCAPOCA iiiingestionngestionngestionngestion
The process to include the POCA data is summarised in the following diagram:
Figure 4: POCA calculation steps
The Level 2 BaselineD NetCDF feed is used to source the POCA data that is used in the point and
gridded products. The columns used are: height_1_20_ku for the elevations and lat_poca_20_ku and
lon_poca_20_ku for position. The ESA Product Handbook
https://earth.esa.int/documents/10174/125272/CryoSat-Baseline-D-Product-Handbook contains
definitions of the column names.
The latitude and longitude coordinates are transformed to a local coordinate system such as polar
stereographic in x and y in metres using a consistent projection with the underlying point data. The
difference of POCA elevation to the reference DEM is used as a filter for erroneous data excluding
any POCA points that are greater than 100m in difference from a reference DEM.
2.32.32.32.3 CoordinateCoordinateCoordinateCoordinate System ProjectionSystem ProjectionSystem ProjectionSystem Projection
The latitude and longitude scales have distortion at the poles, which is a particular issue for the
regions of interest in the CryoTEMPO-EOLIS operational products. Polar Stereographic coordinates
have been chosen for the Greenland and Antarctica products, as these are commonly used in the
community. Polar coordinates are consistent in terms of area and can be used in distance
calculations. The GDAL library is used to do the conversions using the proj4 code applied to the
following regions:
ESA Science Server
L2: /SIR_SIN_L2
Data processor pulls data L2 files daily
Coordinates are re-projected
Data is split in 100km tiles
Poca elevation difference vs reference DEM
Issue 1.1
CryoTEMPO-EOLIS: Product Handbook
Table 1: Regional Projections
Region EPSG Code Proj4 Code
Greenland 3413 “+proj=stere +lat_0=90 +lat_ts=70 +lon_0=-45 +k=1 +x_0=0
+y_0=0 +datum=WGS84 +units=m +no_defs"
Antarctica 3031 "proj4":"+proj=stere +lat_0=-90 +lat_ts=-71 +lon_0=0 +k=1
+x_0=0 +y_0=0 +datum=WGS84 +units=m +no_defs"
2.42.42.42.4 Uncertainty ScoreUncertainty ScoreUncertainty ScoreUncertainty Score
The CryoTEMPO-EOLIS Quality Control is a critical process applied to guarantee that the products
use only the most accurate altimeter data. A quality flag is generated for each elevation point. Only
the high quality points are then used in the Thematic Point and Gridded products.
Thanks to the high volume of measurements, this process can throw away altimeter measurements
deemed erroneous data while retaining a large volume of data to produce the products. In the
process every point of data gets allocated an uncertainty score. This is in the same unit as elevation
(i.e. metres). This figure is a ±value.
Before the uncertainty score is calculated, the following baseline filters are applied to remove any
weak signal and obviously poor quality data:
• Power in Decibels > -160 dB
• Power Scaled > 100
• Coherence > 0.6
• Absolute difference to a reference DEM <100m
• Median absolute deviation of Swath compared to reference DEM < 6m.
Where the reference DEM is the 100m resolution Arctic DEM mosaic for Greenland (Porter et al.,
2018) and 100m resolution REMA DEM mosaic for Antarctica (Howat et al., 2019)
Then to estimate uncertainty all Swath data between 2011 and 2016 is spatially joined with OIB data
(Krabill, 2016) within a 10 day time window and 50m radius. This gives an estimate of the swath
error value, however will also include penetration which we do not want to correct for so we cannot
use the mean error as a measure of quality.
Along track slope at a length scale of 400m, across track slope at a length scale of 1600m and
roughness are then derived from the ArcticDEM for each Swath point. The roughness is calculated
using the GDAL library function “gdaldem roughness”. Furthermore, the distance between each
Swath point and the associated POCA point is calculated.
For the Along Track, Across Track and Roughness, any data that sits outside of the 95% percentile of
values is then removed, meaning any extreme values are discarded.
The data is then bucketed into six variables:
• Power in Decibels
• Coherence
• Distance to POCA
• Along Track Slope
• Across Track Slope
Issue 1.1
CryoTEMPO-EOLIS: Product Handbook
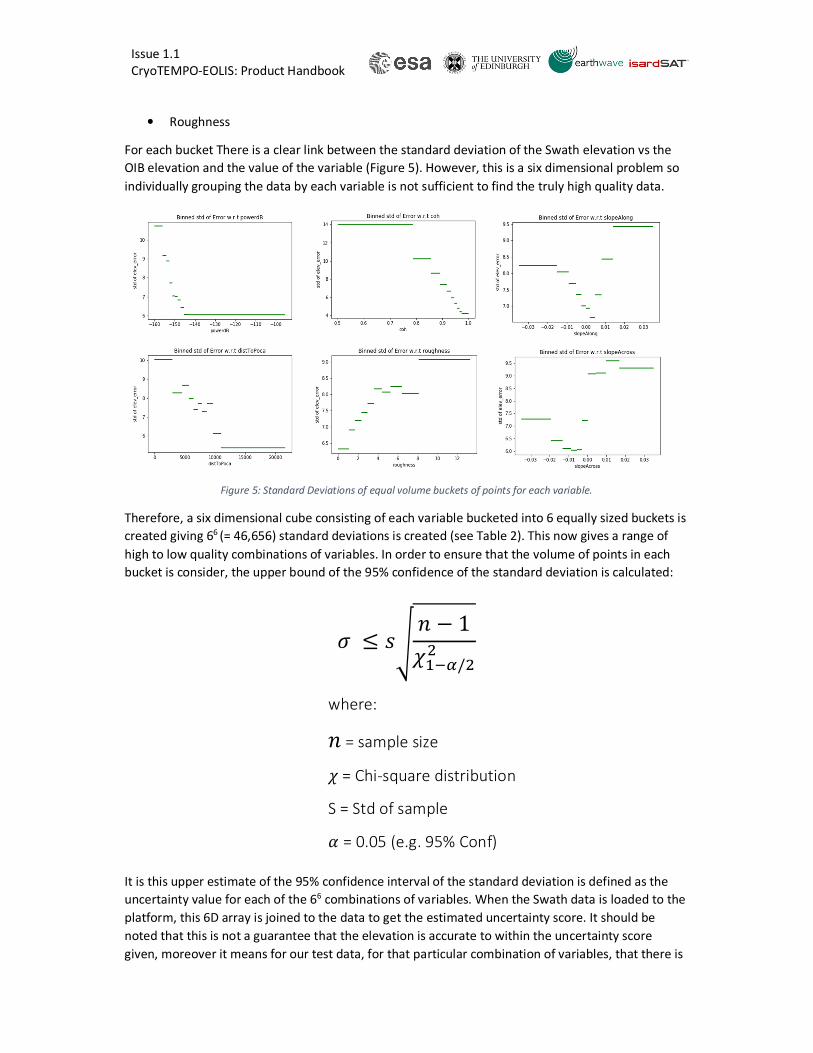
• Roughness
For each bucket There is a clear link between the standard deviation of the Swath elevation vs the
OIB elevation and the value of the variable (Figure 5). However, this is a six dimensional problem so
individually grouping the data by each variable is not sufficient to find the truly high quality data.
Figure 5: Standard Deviations of equal volume buckets of points for each variable.
Therefore, a six dimensional cube consisting of each variable bucketed into 6 equally sized buckets is
created giving 66 (= 46,656) standard deviations is created (see Table 2). This now gives a range of
high to low quality combinations of variables. In order to ensure that the volume of points in each
bucket is consider, the upper bound of the 95% confidence of the standard deviation is calculated:
It is this upper estimate of the 95% confidence interval of the standard deviation is defined as the
uncertainty value for each of the 66 combinations of variables. When the Swath data is loaded to the
platform, this 6D array is joined to the data to get the estimated uncertainty score. It should be
noted that this is not a guarantee that the elevation is accurate to within the uncertainty score
given, moreover it means for our test data, for that particular combination of variables, that there is
� � �� � � 1��/��
where:
� = sample size
= Chi-square distribution
S = Std of sample
� = 0.05 (e.g. 95% Conf)
Issue 1.1
CryoTEMPO-EOLIS: Product Handbook
a 95% confidence that the true standard deviation of the data will be less than the uncertainty score.
In other words, it is a conservative estimate of the uncertainty for a point, but does not guarantee
the point is not an outlier.
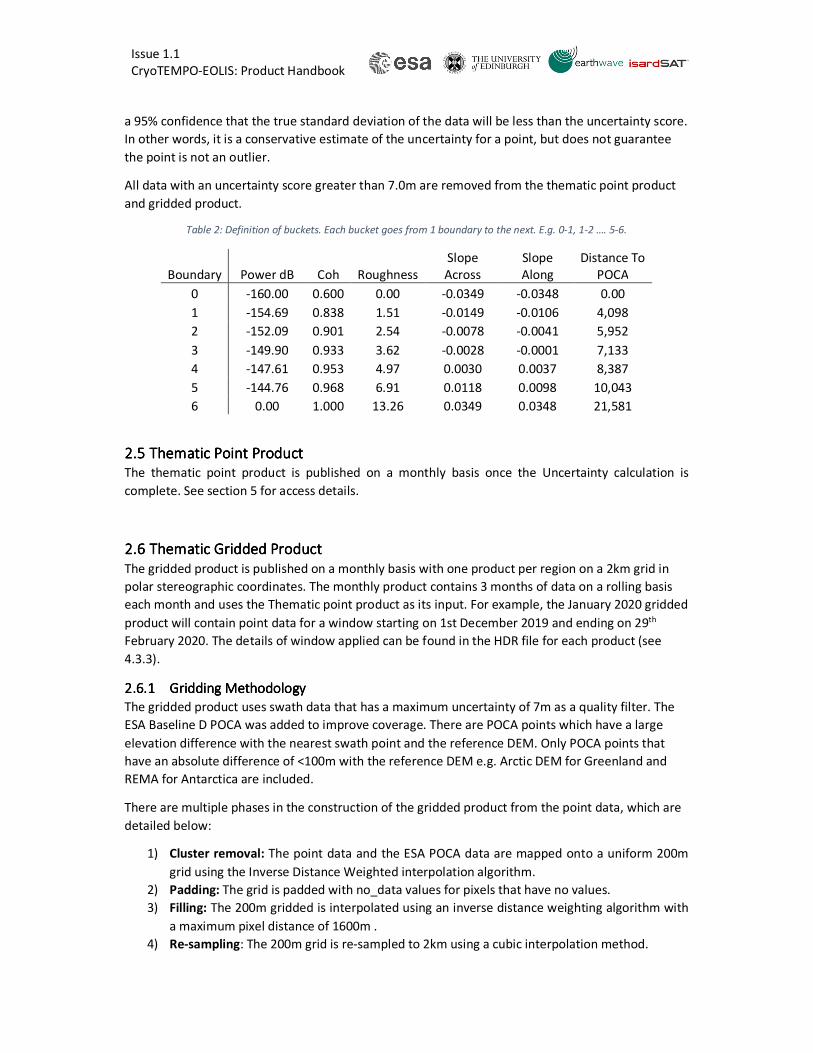
All data with an uncertainty score greater than 7.0m are removed from the thematic point product
and gridded product.
Table 2: Definition of buckets. Each bucket goes from 1 boundary to the next. E.g. 0-1, 1-2 …. 5-6.
Boundary Power dB Coh Roughness
Slope
Across
Slope
Along
Distance To
POCA
0 -160.00 0.600 0.00 -0.0349 -0.0348 0.00
1 -154.69 0.838 1.51 -0.0149 -0.0106 4,098
2 -152.09 0.901 2.54 -0.0078 -0.0041 5,952
3 -149.90 0.933 3.62 -0.0028 -0.0001 7,133
4 -147.61 0.953 4.97 0.0030 0.0037 8,387
5 -144.76 0.968 6.91 0.0118 0.0098 10,043
6 0.00 1.000 13.26 0.0349 0.0348 21,581
2.52.52.52.5 ThematicThematicThematicThematic Point ProductPoint ProductPoint ProductPoint Product
The thematic point product is published on a monthly basis once the Uncertainty calculation is
complete. See section 5 for access details.
2.62.62.62.6 Thematic Thematic Thematic Thematic GriddedGriddedGriddedGridded ProductProductProductProduct
The gridded product is published on a monthly basis with one product per region on a 2km grid in
polar stereographic coordinates. The monthly product contains 3 months of data on a rolling basis
each month and uses the Thematic point product as its input. For example, the January 2020 gridded
product will contain point data for a window starting on 1st December 2019 and ending on 29th
February 2020. The details of window applied can be found in the HDR file for each product (see
4.3.3).
2.6.12.6.12.6.12.6.1 Gridding Gridding Gridding Gridding MethodologyMethodologyMethodologyMethodology
The gridded product uses swath data that has a maximum uncertainty of 7m as a quality filter. The
ESA Baseline D POCA was added to improve coverage. There are POCA points which have a large
elevation difference with the nearest swath point and the reference DEM. Only POCA points that
have an absolute difference of <100m with the reference DEM e.g. Arctic DEM for Greenland and
REMA for Antarctica are included.
There are multiple phases in the construction of the gridded product from the point data, which are
detailed below:
1) Cluster removal: The point data and the ESA POCA data are mapped onto a uniform 200m
grid using the Inverse Distance Weighted interpolation algorithm.
2) Padding: The grid is padded with no_data values for pixels that have no values.
3) Filling: The 200m gridded is interpolated using an inverse distance weighting algorithm with
a maximum pixel distance of 1600m .
4) Re-sampling: The 200m grid is re-sampled to 2km using a cubic interpolation method.
Issue 1.1
CryoTEMPO-EOLIS: Product Handbook
5) Masking of LRM and Ice Sheet: a 2km raster mask is created that contains the region of
coverage of the product.
6) Compute difference to reference DEM: the median mask in the next step requires the
difference to a reference DEM.
7) Reduction of boundary noise and artefacts: The DEM is adjusted using a median filter to
exclude points that have large differences to reference DEM due to poor spatial coverage and
to smooth pixels where the surrounding spatial coverage has high quality.
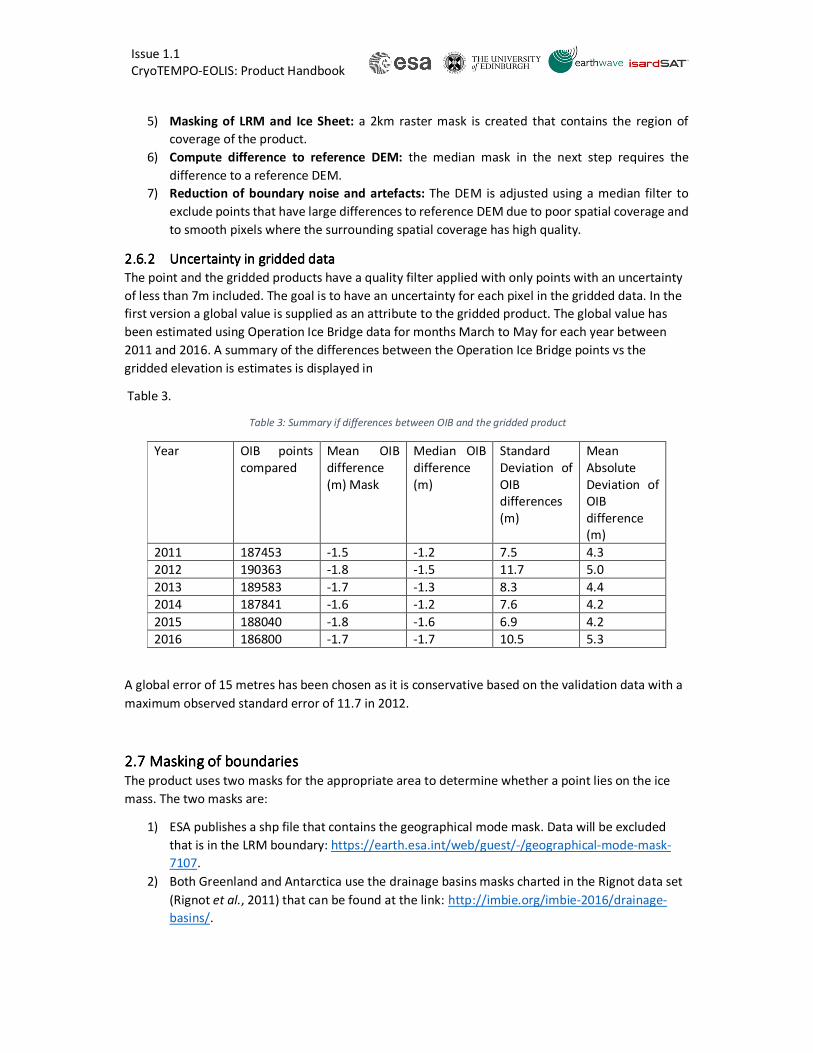
2.6.22.6.22.6.22.6.2 UncertaintyUncertaintyUncertaintyUncertainty in gridded datain gridded datain gridded datain gridded data
The point and the gridded products have a quality filter applied with only points with an uncertainty
of less than 7m included. The goal is to have an uncertainty for each pixel in the gridded data. In the
first version a global value is supplied as an attribute to the gridded product. The global value has
been estimated using Operation Ice Bridge data for months March to May for each year between
2011 and 2016. A summary of the differences between the Operation Ice Bridge points vs the
gridded elevation is estimates is displayed in
Table 3.
Table 3: Summary if differences between OIB and the gridded product
Year OIB points
compared
Mean OIB
difference
(m) Mask
Median OIB
difference
(m)
Standard
Deviation of
OIB
differences
(m)
Mean
Absolute
Deviation of
OIB
difference
(m)
2011 187453 -1.5 -1.2 7.5 4.3
2012 190363 -1.8 -1.5 11.7 5.0
2013 189583 -1.7 -1.3 8.3 4.4
2014 187841 -1.6 -1.2 7.6 4.2
2015 188040 -1.8 -1.6 6.9 4.2
2016 186800 -1.7 -1.7 10.5 5.3
A global error of 15 metres has been chosen as it is conservative based on the validation data with a
maximum observed standard error of 11.7 in 2012.
2.72.72.72.7 Masking of boundariesMasking of boundariesMasking of boundariesMasking of boundaries
The product uses two masks for the appropriate area to determine whether a point lies on the ice
mass. The two masks are:
1) ESA publishes a shp file that contains the geographical mode mask. Data will be excluded
that is in the LRM boundary: https://earth.esa.int/web/guest/-/geographical-mode-mask-
7107.
2) Both Greenland and Antarctica use the drainage basins masks charted in the Rignot data set
(Rignot et al., 2011) that can be found at the link: http://imbie.org/imbie-2016/drainage-
basins/.
Issue 1.1
CryoTEMPO-EOLIS: Product Handbook
2.82.82.82.8 Known IssuesKnown IssuesKnown IssuesKnown Issues
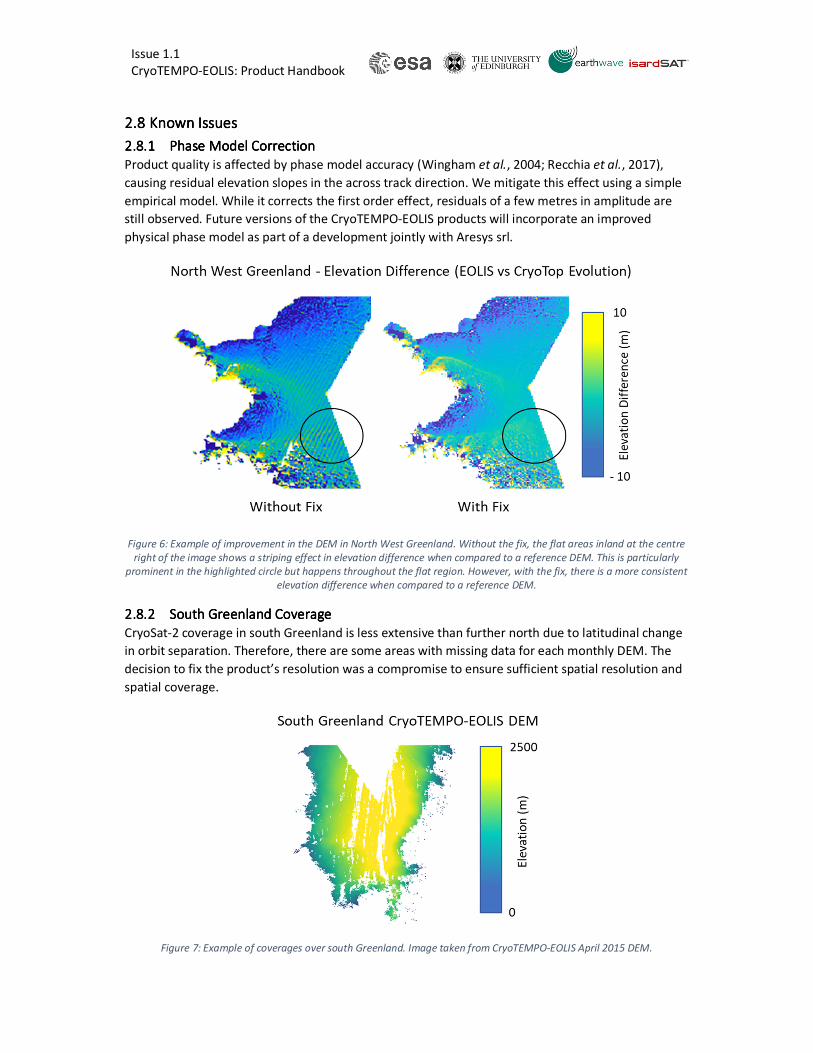
2.8.12.8.12.8.12.8.1 Phase Model CorrectionPhase Model CorrectionPhase Model CorrectionPhase Model Correction
Product quality is affected by phase model accuracy (Wingham et al., 2004; Recchia et al., 2017),
causing residual elevation slopes in the across track direction. We mitigate this effect using a simple
empirical model. While it corrects the first order effect, residuals of a few metres in amplitude are
still observed. Future versions of the CryoTEMPO-EOLIS products will incorporate an improved
physical phase model as part of a development jointly with Aresys srl.
Figure 6: Example of improvement in the DEM in North West Greenland. Without the fix, the flat areas inland at the centre
right of the image shows a striping effect in elevation difference when compared to a reference DEM. This is particularly
prominent in the highlighted circle but happens throughout the flat region. However, with the fix, there is a more consistent
elevation difference when compared to a reference DEM.
2.8.22.8.22.8.22.8.2 South GreenlandSouth GreenlandSouth GreenlandSouth Greenland CoverageCoverageCoverageCoverage
CryoSat-2 coverage in south Greenland is less extensive than further north due to latitudinal change
in orbit separation. Therefore, there are some areas with missing data for each monthly DEM. The
decision to fix the product’s resolution was a compromise to ensure sufficient spatial resolution and
spatial coverage.
Figure 7: Example of coverages over south Greenland. Image taken from CryoTEMPO-EOLIS April 2015 DEM.
Issue 1.1
CryoTEMPO-EOLIS: Product Handbook
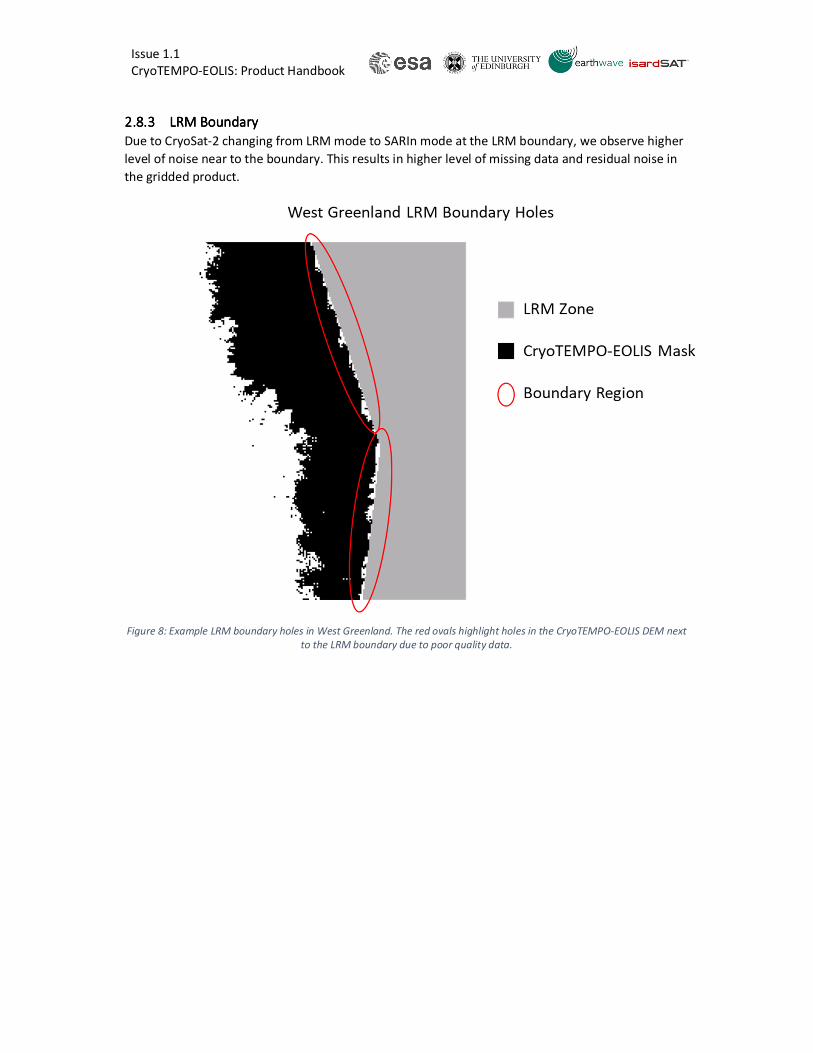
2.8.32.8.32.8.32.8.3 LRM BoundaryLRM BoundaryLRM BoundaryLRM Boundary
Due to CryoSat-2 changing from LRM mode to SARIn mode at the LRM boundary, we observe higher
level of noise near to the boundary. This results in higher level of missing data and residual noise in
the gridded product.
Figure 8: Example LRM boundary holes in West Greenland. The red ovals highlight holes in the CryoTEMPO-EOLIS DEM next
to the LRM boundary due to poor quality data.
Issue 1.1
CryoTEMPO-EOLIS: Product Handbook
3.3.3.3. ProductProductProductProduct DescriptionDescriptionDescriptionDescription
3.13.13.13.1 Swath Swath Swath Swath ThematicThematicThematicThematic PointPointPointPoint ProductProductProductProduct
3.1.13.1.13.1.13.1.1 AreaAreaAreaAreassss of Interestof Interestof Interestof Interest
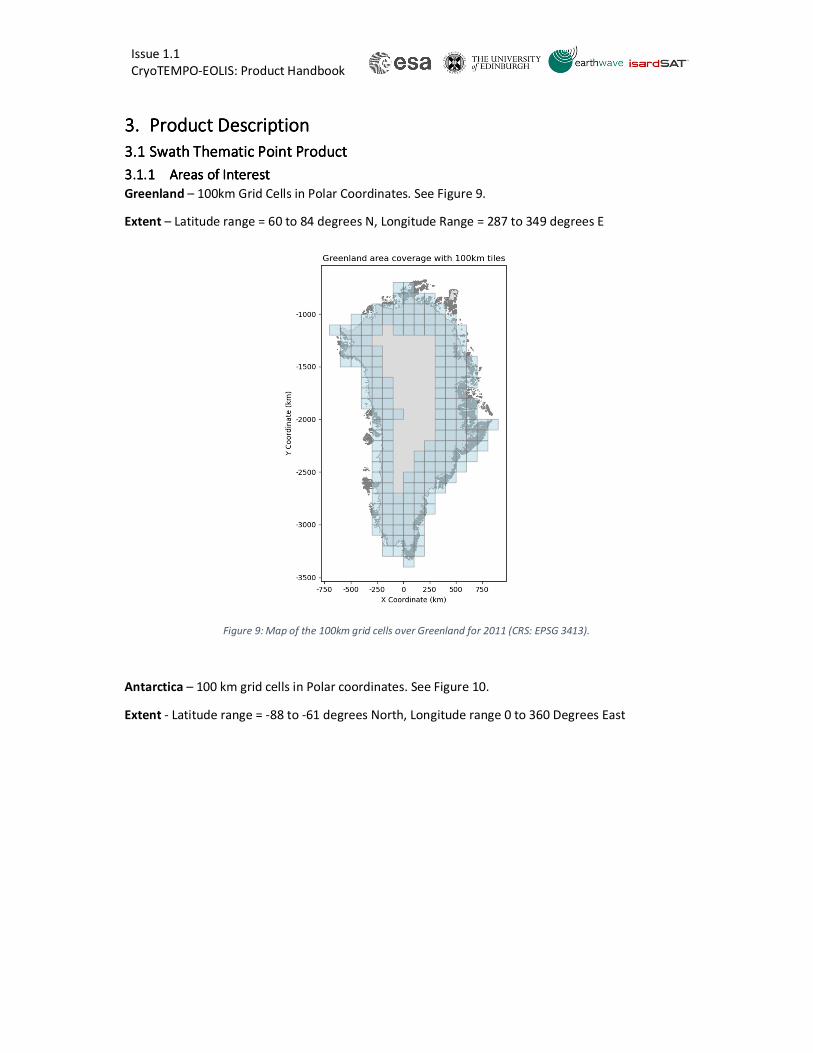
Greenland – 100km Grid Cells in Polar Coordinates. See Figure 9.
Extent – Latitude range = 60 to 84 degrees N, Longitude Range = 287 to 349 degrees E
Figure 9: Map of the 100km grid cells over Greenland for 2011 (CRS: EPSG 3413).
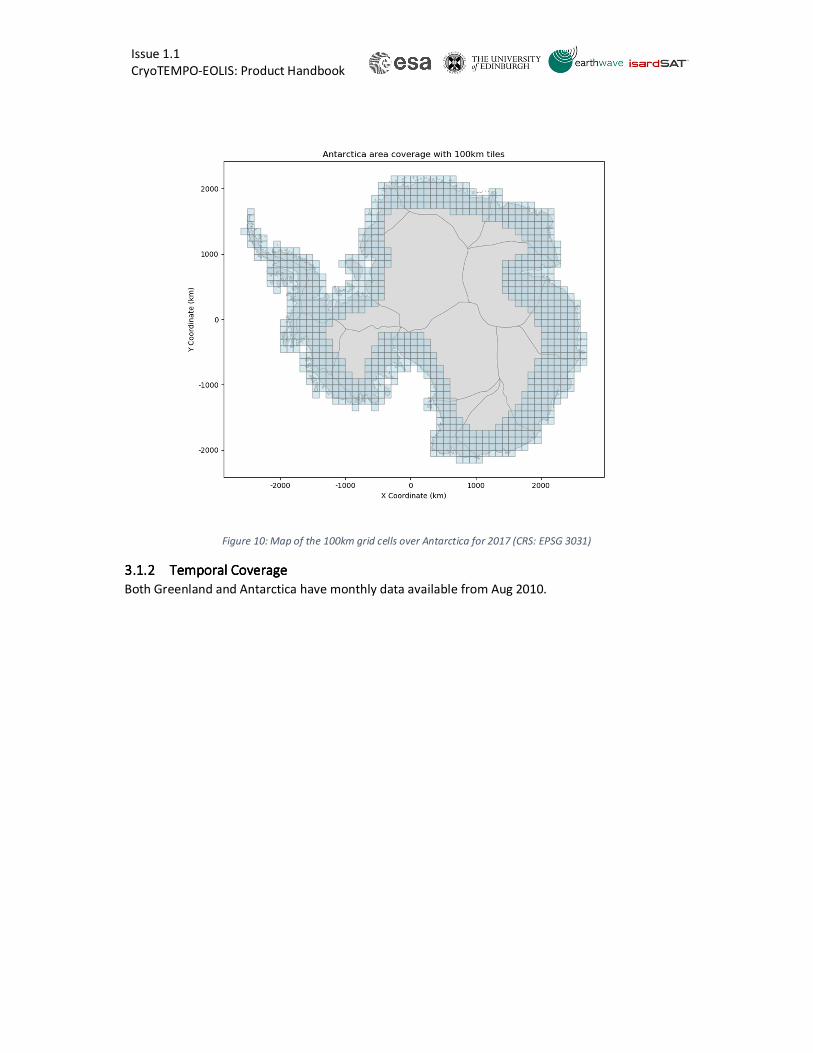
Antarctica – 100 km grid cells in Polar coordinates. See Figure 10.
Extent - Latitude range = -88 to -61 degrees North, Longitude range 0 to 360 Degrees East
Issue 1.1
CryoTEMPO-EOLIS: Product Handbook
Figure 10: Map of the 100km grid cells over Antarctica for 2017 (CRS: EPSG 3031)
3.1.23.1.23.1.23.1.2 TemporalTemporalTemporalTemporal CoverageCoverageCoverageCoverage
Both Greenland and Antarctica have monthly data available from Aug 2010.
Issue 1.1
CryoTEMPO-EOLIS: Product Handbook
3.23.23.23.2 Swath Swath Swath Swath Thematic Thematic Thematic Thematic Gridded ProductGridded ProductGridded ProductGridded Product
3.2.13.2.13.2.13.2.1 Area of InterestArea of InterestArea of InterestArea of Interest
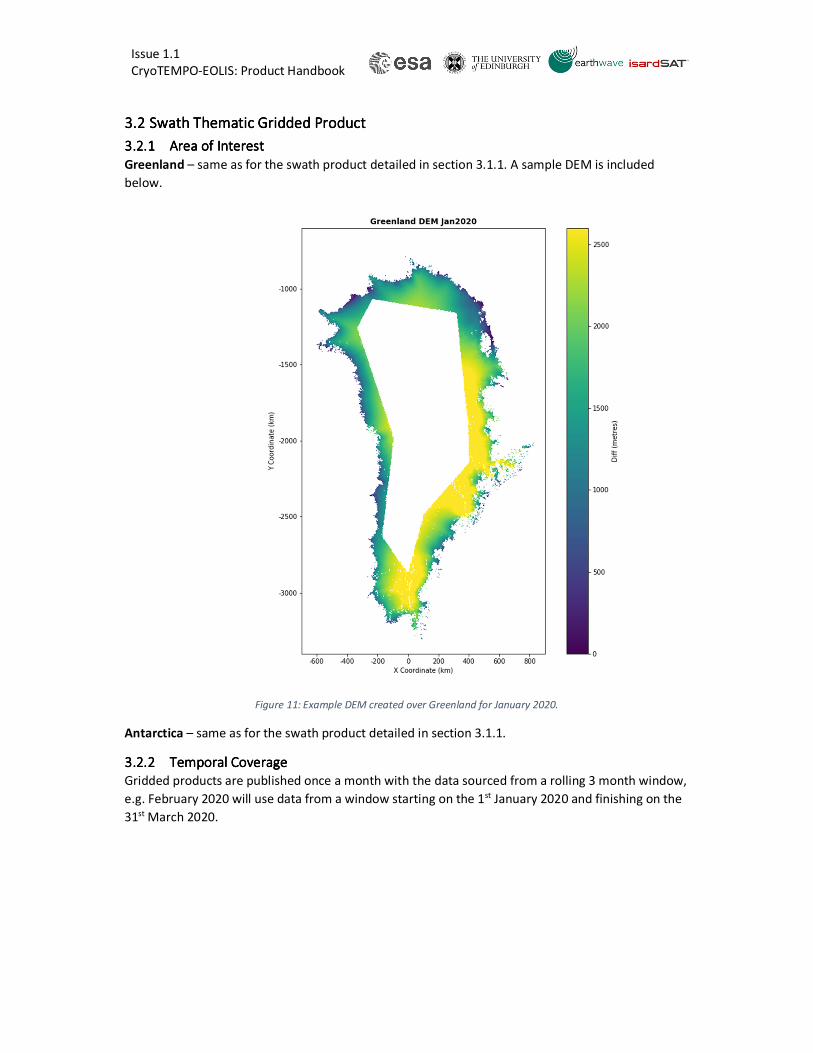
Greenland – same as for the swath product detailed in section 3.1.1. A sample DEM is included
below.
Figure 11: Example DEM created over Greenland for January 2020.
Antarctica – same as for the swath product detailed in section 3.1.1.
3.2.23.2.23.2.23.2.2 TemporalTemporalTemporalTemporal CoverageCoverageCoverageCoverage
Gridded products are published once a month with the data sourced from a rolling 3 month window,
e.g. February 2020 will use data from a window starting on the 1st January 2020 and finishing on the
31st March 2020.
Issue 1.1
CryoTEMPO-EOLIS: Product Handbook
4.4.4.4. FormatFormatFormatFormat
4.14.14.14.1 NomenclatureNomenclatureNomenclatureNomenclature
There are 2 files for each instance of a data product:
• XML HDR file that contains detailed product metadata.
This follows the specification: “EO GS File Format Standard", with small modifications to refer
to polar coordinates rather than longitude and latitude.
• NetCDF data file that contains the point cloud and gridded products respectively.
4.1.14.1.14.1.14.1.1 Point ProduPoint ProduPoint ProduPoint Product Nomenclaturect Nomenclaturect Nomenclaturect Nomenclature
Each CryoTEMPO-EOLIS TEMPO_SWATH_POINT product consists of a pair of files:
• a header file (with extension .HDR) in XML format
• a data block file (with extension .nc) in netCDF format.
The folder structure on the ESA Science Server is: TEMPO_SWATH_POINT/YYYY/MM/<ZONE>
The file naming convention is:
CS_OFFL_THEM_POINT_<ZONE>_<YYYY>_<MM>_<X>_<Y>_<VERSION>
Where:
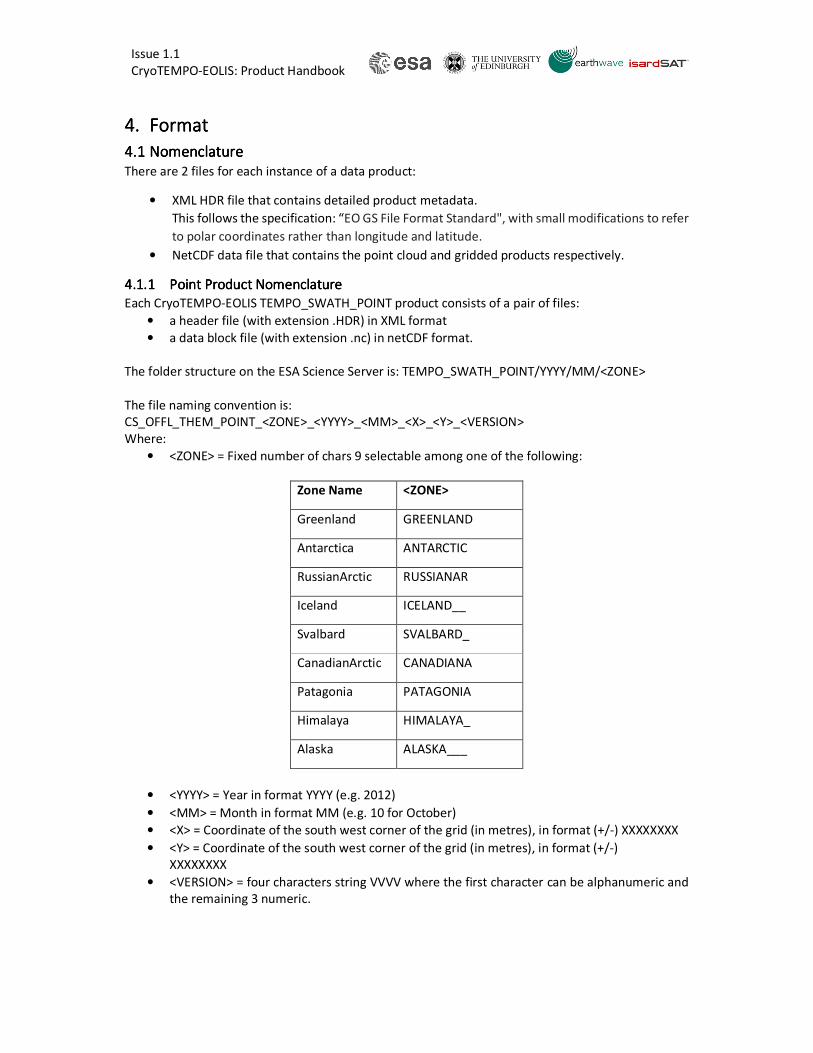
• <ZONE> = Fixed number of chars 9 selectable among one of the following:
Zone Name <ZONE>
Greenland GREENLAND
Antarctica ANTARCTIC
RussianArctic RUSSIANAR
Iceland ICELAND__
Svalbard SVALBARD_
CanadianArctic CANADIANA
Patagonia PATAGONIA
Himalaya HIMALAYA_
Alaska ALASKA___
• <YYYY> = Year in format YYYY (e.g. 2012)
• <MM> = Month in format MM (e.g. 10 for October)
• <X> = Coordinate of the south west corner of the grid (in metres), in format (+/-) XXXXXXXX
• <Y> = Coordinate of the south west corner of the grid (in metres), in format (+/-)
XXXXXXXX
• <VERSION> = four characters string VVVV where the first character can be alphanumeric and
the remaining 3 numeric.
Issue 1.1
CryoTEMPO-EOLIS: Product Handbook
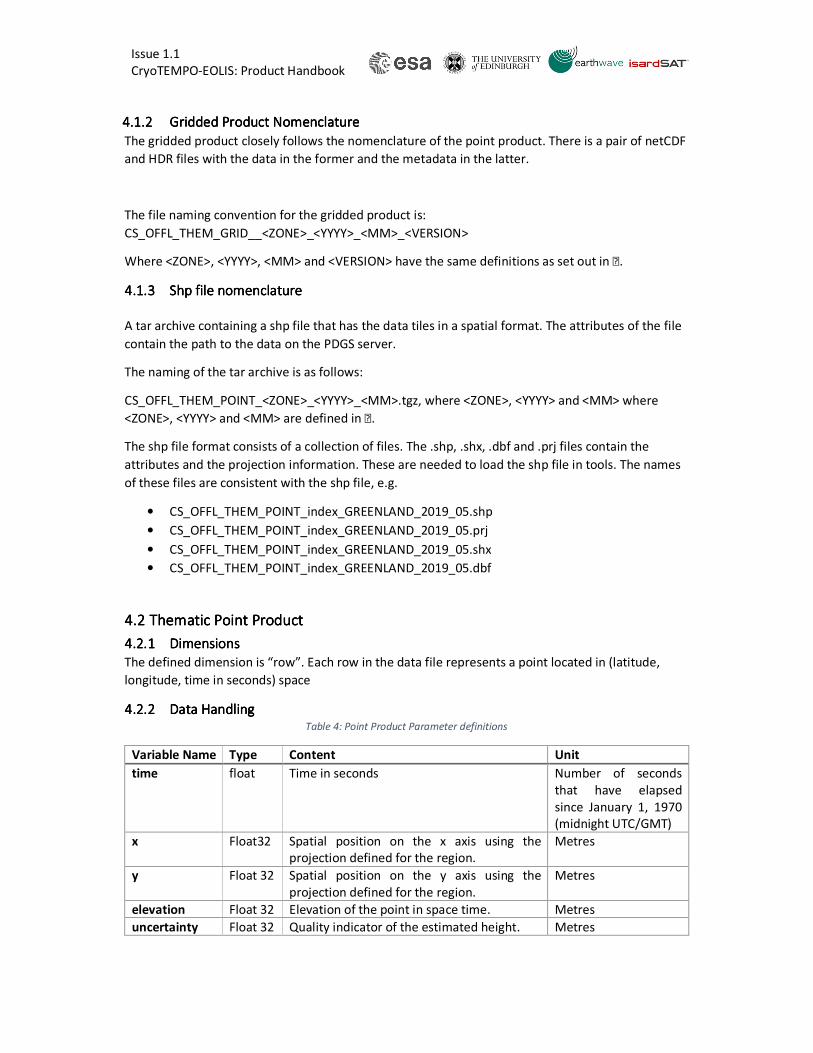
4.1.24.1.24.1.24.1.2 Gridded Product NomenclatureGridded Product NomenclatureGridded Product NomenclatureGridded Product Nomenclature
The gridded product closely follows the nomenclature of the point product. There is a pair of netCDF
and HDR files with the data in the former and the metadata in the latter.
The file naming convention for the gridded product is:
CS_OFFL_THEM_GRID__<ZONE>_<YYYY>_<MM>_<VERSION>
Where <ZONE>, <YYYY>, <MM> and <VERSION> have the same definitions as set out in .
4.1.34.1.34.1.34.1.3 ShpShpShpShp file nomenclaturefile nomenclaturefile nomenclaturefile nomenclature
A tar archive containing a shp file that has the data tiles in a spatial format. The attributes of the file
contain the path to the data on the PDGS server.
The naming of the tar archive is as follows:
CS_OFFL_THEM_POINT_<ZONE>_<YYYY>_<MM>.tgz, where <ZONE>, <YYYY> and <MM> where
<ZONE>, <YYYY> and <MM> are defined in .
The shp file format consists of a collection of files. The .shp, .shx, .dbf and .prj files contain the
attributes and the projection information. These are needed to load the shp file in tools. The names
of these files are consistent with the shp file, e.g.
• CS_OFFL_THEM_POINT_index_GREENLAND_2019_05.shp
• CS_OFFL_THEM_POINT_index_GREENLAND_2019_05.prj
• CS_OFFL_THEM_POINT_index_GREENLAND_2019_05.shx
• CS_OFFL_THEM_POINT_index_GREENLAND_2019_05.dbf
4.24.24.24.2 ThematicThematicThematicThematic Point Point Point Point ProductProductProductProduct
4.2.14.2.14.2.14.2.1 DimensionsDimensionsDimensionsDimensions
The defined dimension is “row”. Each row in the data file represents a point located in (latitude,
longitude, time in seconds) space
4.2.24.2.24.2.24.2.2 Data Data Data Data HandlingHandlingHandlingHandling Table 4: Point Product Parameter definitions
Variable Name Type Content Unit
time float Time in seconds Number of seconds
that have elapsed
since January 1, 1970
(midnight UTC/GMT)
x Float32 Spatial position on the x axis using the
projection defined for the region.
Metres
y Float 32 Spatial position on the y axis using the
projection defined for the region.
Metres
elevation Float 32 Elevation of the point in space time. Metres
uncertainty Float 32 Quality indicator of the estimated height. Metres
Issue 1.1
CryoTEMPO-EOLIS: Product Handbook
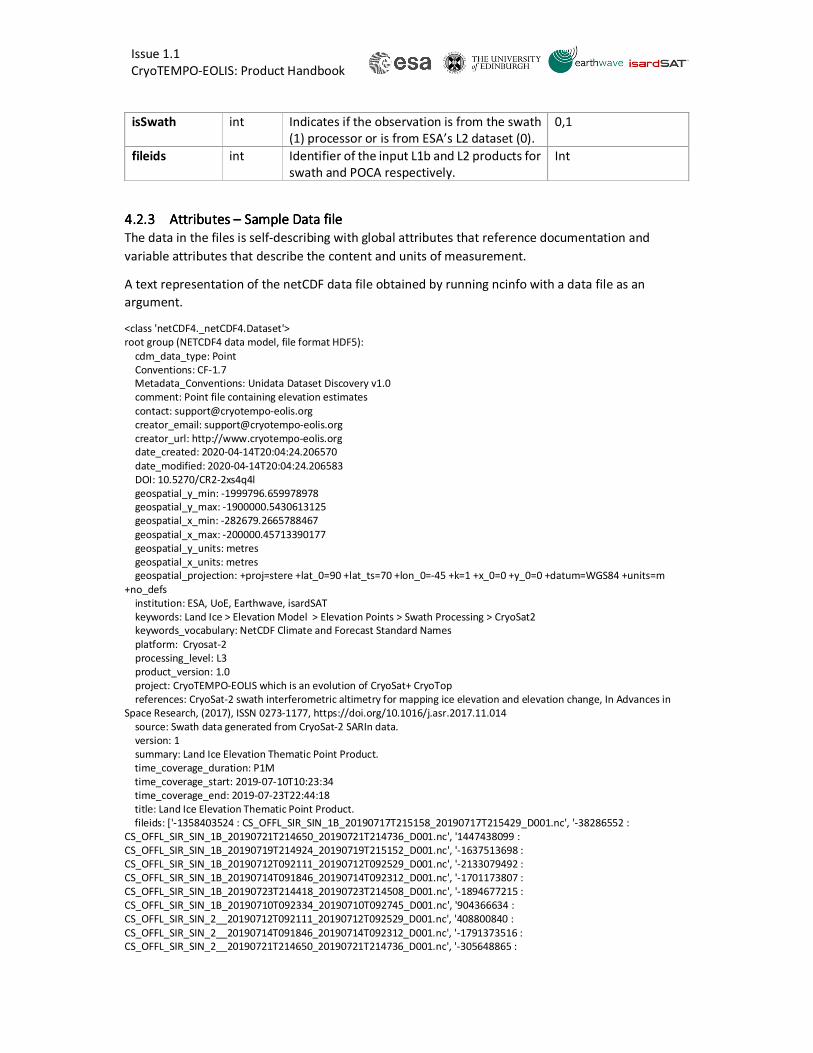
isSwath int Indicates if the observation is from the swath
(1) processor or is from ESA’s L2 dataset (0).
0,1
fileids int Identifier of the input L1b and L2 products for
swath and POCA respectively.
Int
4.2.34.2.34.2.34.2.3 Attributes Attributes Attributes Attributes –––– SampleSampleSampleSample DataDataDataData filefilefilefile
The data in the files is self-describing with global attributes that reference documentation and
variable attributes that describe the content and units of measurement.
A text representation of the netCDF data file obtained by running ncinfo with a data file as an
argument.
<class 'netCDF4._netCDF4.Dataset'>
root group (NETCDF4 data model, file format HDF5):
cdm_data_type: Point
Conventions: CF-1.7
Metadata_Conventions: Unidata Dataset Discovery v1.0
comment: Point file containing elevation estimates
contact: [email protected]
creator_email: [email protected]
creator_url: http://www.cryotempo-eolis.org
date_created: 2020-04-14T20:04:24.206570
date_modified: 2020-04-14T20:04:24.206583
DOI: 10.5270/CR2-2xs4q4l
geospatial_y_min: -1999796.659978978
geospatial_y_max: -1900000.5430613125
geospatial_x_min: -282679.2665788467
geospatial_x_max: -200000.45713390177
geospatial_y_units: metres
geospatial_x_units: metres
geospatial_projection: +proj=stere +lat_0=90 +lat_ts=70 +lon_0=-45 +k=1 +x_0=0 +y_0=0 +datum=WGS84 +units=m
+no_defs
institution: ESA, UoE, Earthwave, isardSAT
keywords: Land Ice > Elevation Model > Elevation Points > Swath Processing > CryoSat2
keywords_vocabulary: NetCDF Climate and Forecast Standard Names
platform: Cryosat-2
processing_level: L3
product_version: 1.0
project: CryoTEMPO-EOLIS which is an evolution of CryoSat+ CryoTop
references: CryoSat-2 swath interferometric altimetry for mapping ice elevation and elevation change, In Advances in
Space Research, (2017), ISSN 0273-1177, https://doi.org/10.1016/j.asr.2017.11.014
source: Swath data generated from CryoSat-2 SARIn data.
version: 1
summary: Land Ice Elevation Thematic Point Product.
time_coverage_duration: P1M
time_coverage_start: 2019-07-10T10:23:34
time_coverage_end: 2019-07-23T22:44:18
title: Land Ice Elevation Thematic Point Product.
fileids: ['-1358403524 : CS_OFFL_SIR_SIN_1B_20190717T215158_20190717T215429_D001.nc', '-38286552 :
CS_OFFL_SIR_SIN_1B_20190721T214650_20190721T214736_D001.nc', '1447438099 :
CS_OFFL_SIR_SIN_1B_20190719T214924_20190719T215152_D001.nc', '-1637513698 :
CS_OFFL_SIR_SIN_1B_20190712T092111_20190712T092529_D001.nc', '-2133079492 :
CS_OFFL_SIR_SIN_1B_20190714T091846_20190714T092312_D001.nc', '-1701173807 :
CS_OFFL_SIR_SIN_1B_20190723T214418_20190723T214508_D001.nc', '-1894677215 :
CS_OFFL_SIR_SIN_1B_20190710T092334_20190710T092745_D001.nc', '904366634 :
CS_OFFL_SIR_SIN_2__20190712T092111_20190712T092529_D001.nc', '408800840 :
CS_OFFL_SIR_SIN_2__20190714T091846_20190714T092312_D001.nc', '-1791373516 :
CS_OFFL_SIR_SIN_2__20190721T214650_20190721T214736_D001.nc', '-305648865 :
Issue 1.1
CryoTEMPO-EOLIS: Product Handbook
CS_OFFL_SIR_SIN_2__20190719T214924_20190719T215152_D001.nc', '1183476808 :
CS_OFFL_SIR_SIN_2__20190717T215158_20190717T215429_D001.nc', '840706525 :
CS_OFFL_SIR_SIN_2__20190723T214418_20190723T214508_D001.nc', '647203117 :
CS_OFFL_SIR_SIN_2__20190710T092334_20190710T092745_D001.nc']
dimensions(sizes): row(61057)
variables(dimensions): int32 time(row), float32 x(row), float32 y(row), float32 elevation(row), float32 uncertainty(row),
int32 isSwath(row), int32 inputfileid(row)
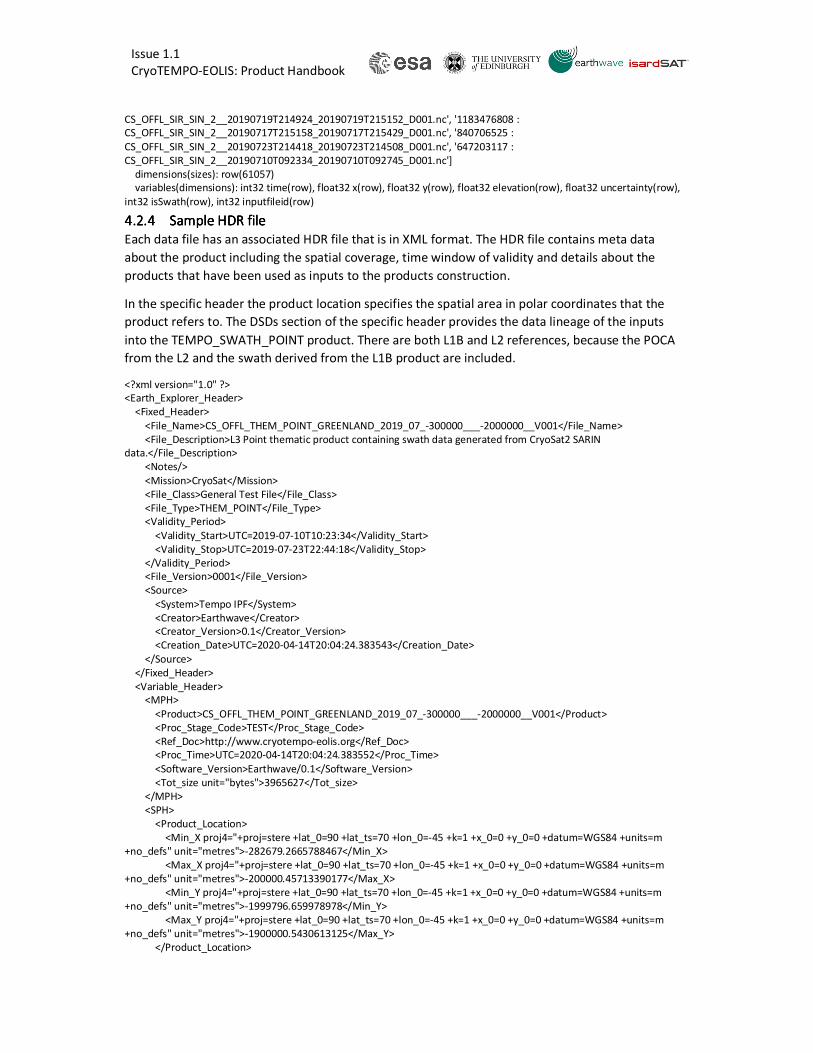
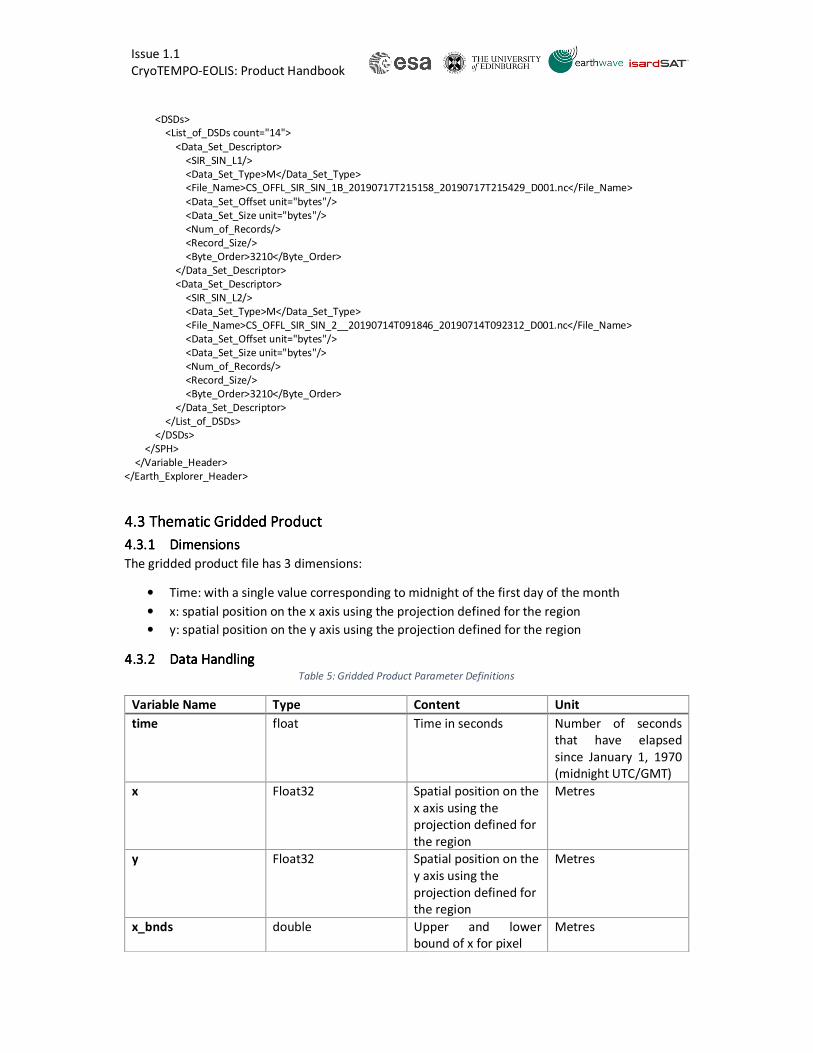
4.2.44.2.44.2.44.2.4 Sample HDR filSample HDR filSample HDR filSample HDR fileeee
Each data file has an associated HDR file that is in XML format. The HDR file contains meta data
about the product including the spatial coverage, time window of validity and details about the
products that have been used as inputs to the products construction.
In the specific header the product location specifies the spatial area in polar coordinates that the
product refers to. The DSDs section of the specific header provides the data lineage of the inputs
into the TEMPO_SWATH_POINT product. There are both L1B and L2 references, because the POCA
from the L2 and the swath derived from the L1B product are included.
<?xml version="1.0" ?>
<Earth_Explorer_Header>
<Fixed_Header>
<File_Name>CS_OFFL_THEM_POINT_GREENLAND_2019_07_-300000___-2000000__V001</File_Name>
<File_Description>L3 Point thematic product containing swath data generated from CryoSat2 SARIN
data.</File_Description>
<Notes/>
<Mission>CryoSat</Mission>
<File_Class>General Test File</File_Class>
<File_Type>THEM_POINT</File_Type>
<Validity_Period>
<Validity_Start>UTC=2019-07-10T10:23:34</Validity_Start>
<Validity_Stop>UTC=2019-07-23T22:44:18</Validity_Stop>
</Validity_Period>
<File_Version>0001</File_Version>
<Source>
<System>Tempo IPF</System>
<Creator>Earthwave</Creator>
<Creator_Version>0.1</Creator_Version>
<Creation_Date>UTC=2020-04-14T20:04:24.383543</Creation_Date>
</Source>
</Fixed_Header>
<Variable_Header>
<MPH>
<Product>CS_OFFL_THEM_POINT_GREENLAND_2019_07_-300000___-2000000__V001</Product>
<Proc_Stage_Code>TEST</Proc_Stage_Code>
<Ref_Doc>http://www.cryotempo-eolis.org</Ref_Doc>
<Proc_Time>UTC=2020-04-14T20:04:24.383552</Proc_Time>
<Software_Version>Earthwave/0.1</Software_Version>
<Tot_size unit="bytes">3965627</Tot_size>
</MPH>
<SPH>
<Product_Location>
<Min_X proj4="+proj=stere +lat_0=90 +lat_ts=70 +lon_0=-45 +k=1 +x_0=0 +y_0=0 +datum=WGS84 +units=m
+no_defs" unit="metres">-282679.2665788467</Min_X>
<Max_X proj4="+proj=stere +lat_0=90 +lat_ts=70 +lon_0=-45 +k=1 +x_0=0 +y_0=0 +datum=WGS84 +units=m
+no_defs" unit="metres">-200000.45713390177</Max_X>
<Min_Y proj4="+proj=stere +lat_0=90 +lat_ts=70 +lon_0=-45 +k=1 +x_0=0 +y_0=0 +datum=WGS84 +units=m
+no_defs" unit="metres">-1999796.659978978</Min_Y>
<Max_Y proj4="+proj=stere +lat_0=90 +lat_ts=70 +lon_0=-45 +k=1 +x_0=0 +y_0=0 +datum=WGS84 +units=m
+no_defs" unit="metres">-1900000.5430613125</Max_Y>
</Product_Location>
Issue 1.1
CryoTEMPO-EOLIS: Product Handbook
<DSDs>
<List_of_DSDs count="14">
<Data_Set_Descriptor>
<SIR_SIN_L1/>
<Data_Set_Type>M</Data_Set_Type>
<File_Name>CS_OFFL_SIR_SIN_1B_20190717T215158_20190717T215429_D001.nc</File_Name>
<Data_Set_Offset unit="bytes"/>
<Data_Set_Size unit="bytes"/>
<Num_of_Records/>
<Record_Size/>
<Byte_Order>3210</Byte_Order>
</Data_Set_Descriptor>
<Data_Set_Descriptor>
<SIR_SIN_L2/>
<Data_Set_Type>M</Data_Set_Type>
<File_Name>CS_OFFL_SIR_SIN_2__20190714T091846_20190714T092312_D001.nc</File_Name>
<Data_Set_Offset unit="bytes"/>
<Data_Set_Size unit="bytes"/>
<Num_of_Records/>
<Record_Size/>
<Byte_Order>3210</Byte_Order>
</Data_Set_Descriptor>
</List_of_DSDs>
</DSDs>
</SPH>
</Variable_Header>
</Earth_Explorer_Header>
4.34.34.34.3 ThematicThematicThematicThematic GriddedGriddedGriddedGridded ProductProductProductProduct
4.3.14.3.14.3.14.3.1 DimensionsDimensionsDimensionsDimensions
The gridded product file has 3 dimensions:
• Time: with a single value corresponding to midnight of the first day of the month
• x: spatial position on the x axis using the projection defined for the region
• y: spatial position on the y axis using the projection defined for the region
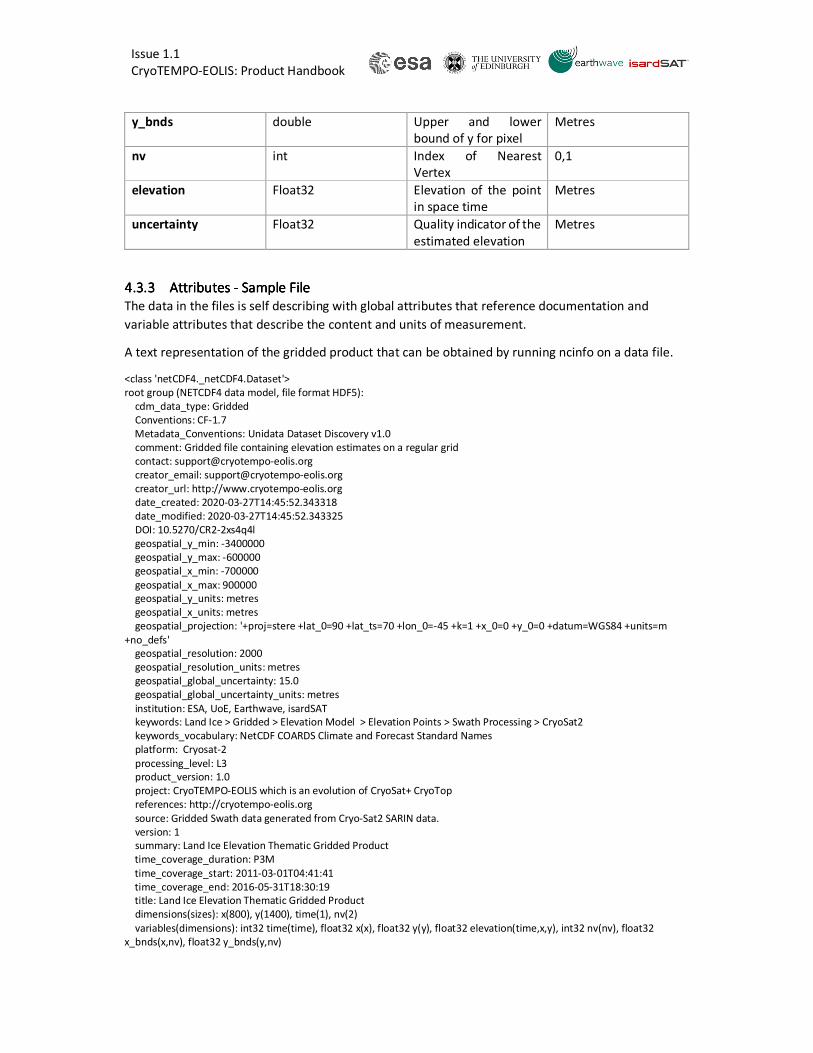
4.3.24.3.24.3.24.3.2 Data Data Data Data HandlingHandlingHandlingHandling Table 5: Gridded Product Parameter Definitions
Variable Name Type Content Unit
time float Time in seconds Number of seconds
that have elapsed
since January 1, 1970
(midnight UTC/GMT)
x Float32 Spatial position on the
x axis using the
projection defined for
the region
Metres
y Float32 Spatial position on the
y axis using the
projection defined for
the region
Metres
x_bnds_bnds double Upper and lower
bound of x for pixel
Metres
Issue 1.1
CryoTEMPO-EOLIS: Product Handbook
y_bnds double Upper and lower
bound of y for pixel
Metres
nv int Index of Nearest
Vertex
0,1
elevation Float32 Elevation of the point
in space time
Metres
uncertainty Float32 Quality indicator of the
estimated elevation
Metres
4.3.34.3.34.3.34.3.3 Attributes Attributes Attributes Attributes ---- Sample FileSample FileSample FileSample File
The data in the files is self describing with global attributes that reference documentation and
variable attributes that describe the content and units of measurement.
A text representation of the gridded product that can be obtained by running ncinfo on a data file.
<class 'netCDF4._netCDF4.Dataset'>
root group (NETCDF4 data model, file format HDF5):
cdm_data_type: Gridded
Conventions: CF-1.7
Metadata_Conventions: Unidata Dataset Discovery v1.0
comment: Gridded file containing elevation estimates on a regular grid
contact: [email protected]
creator_email: [email protected]
creator_url: http://www.cryotempo-eolis.org
date_created: 2020-03-27T14:45:52.343318
date_modified: 2020-03-27T14:45:52.343325
DOI: 10.5270/CR2-2xs4q4l
geospatial_y_min: -3400000
geospatial_y_max: -600000
geospatial_x_min: -700000
geospatial_x_max: 900000
geospatial_y_units: metres
geospatial_x_units: metres
geospatial_projection: '+proj=stere +lat_0=90 +lat_ts=70 +lon_0=-45 +k=1 +x_0=0 +y_0=0 +datum=WGS84 +units=m
+no_defs'
geospatial_resolution: 2000
geospatial_resolution_units: metres
geospatial_global_uncertainty: 15.0
geospatial_global_uncertainty_units: metres
institution: ESA, UoE, Earthwave, isardSAT
keywords: Land Ice > Gridded > Elevation Model > Elevation Points > Swath Processing > CryoSat2
keywords_vocabulary: NetCDF COARDS Climate and Forecast Standard Names
platform: Cryosat-2
processing_level: L3
product_version: 1.0
project: CryoTEMPO-EOLIS which is an evolution of CryoSat+ CryoTop
references: http://cryotempo-eolis.org
source: Gridded Swath data generated from Cryo-Sat2 SARIN data.
version: 1
summary: Land Ice Elevation Thematic Gridded Product
time_coverage_duration: P3M
time_coverage_start: 2011-03-01T04:41:41
time_coverage_end: 2016-05-31T18:30:19
title: Land Ice Elevation Thematic Gridded Product
dimensions(sizes): x(800), y(1400), time(1), nv(2)
variables(dimensions): int32 time(time), float32 x(x), float32 y(y), float32 elevation(time,x,y), int32 nv(nv), float32
x_bnds(x,nv), float32 y_bnds(y,nv)
Issue 1.1
CryoTEMPO-EOLIS: Product Handbook
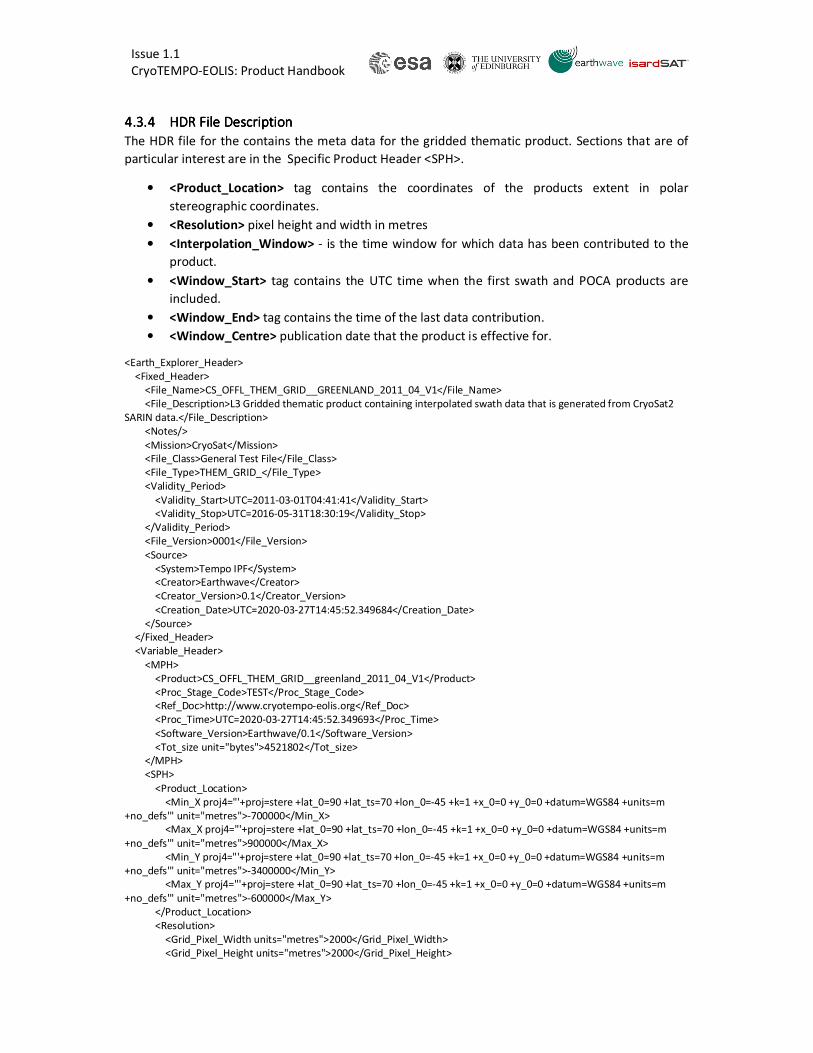
4.3.44.3.44.3.44.3.4 HDR File DescriptionHDR File DescriptionHDR File DescriptionHDR File Description
The HDR file for the contains the meta data for the gridded thematic product. Sections that are of
particular interest are in the Specific Product Header <SPH>.
• <Product_Location> tag contains the coordinates of the products extent in polar
stereographic coordinates.
• <Resolution> pixel height and width in metres
• <Interpolation_Window> - is the time window for which data has been contributed to the
product.
• <Window_Start> tag contains the UTC time when the first swath and POCA products are
included.
• <Window_End> tag contains the time of the last data contribution.
• <Window_Centre> publication date that the product is effective for.
<Earth_Explorer_Header>
<Fixed_Header>
<File_Name>CS_OFFL_THEM_GRID__GREENLAND_2011_04_V1</File_Name>
<File_Description>L3 Gridded thematic product containing interpolated swath data that is generated from CryoSat2
SARIN data.</File_Description>
<Notes/>
<Mission>CryoSat</Mission>
<File_Class>General Test File</File_Class>
<File_Type>THEM_GRID_</File_Type>
<Validity_Period>
<Validity_Start>UTC=2011-03-01T04:41:41</Validity_Start>
<Validity_Stop>UTC=2016-05-31T18:30:19</Validity_Stop>
</Validity_Period>
<File_Version>0001</File_Version>
<Source>
<System>Tempo IPF</System>
<Creator>Earthwave</Creator>
<Creator_Version>0.1</Creator_Version>
<Creation_Date>UTC=2020-03-27T14:45:52.349684</Creation_Date>
</Source>
</Fixed_Header>
<Variable_Header>
<MPH>
<Product>CS_OFFL_THEM_GRID__greenland_2011_04_V1</Product>
<Proc_Stage_Code>TEST</Proc_Stage_Code>
<Ref_Doc>http://www.cryotempo-eolis.org</Ref_Doc>
<Proc_Time>UTC=2020-03-27T14:45:52.349693</Proc_Time>
<Software_Version>Earthwave/0.1</Software_Version>
<Tot_size unit="bytes">4521802</Tot_size>
</MPH>
<SPH>
<Product_Location>
<Min_X proj4="'+proj=stere +lat_0=90 +lat_ts=70 +lon_0=-45 +k=1 +x_0=0 +y_0=0 +datum=WGS84 +units=m
+no_defs'" unit="metres">-700000</Min_X>
<Max_X proj4="'+proj=stere +lat_0=90 +lat_ts=70 +lon_0=-45 +k=1 +x_0=0 +y_0=0 +datum=WGS84 +units=m
+no_defs'" unit="metres">900000</Max_X>
<Min_Y proj4="'+proj=stere +lat_0=90 +lat_ts=70 +lon_0=-45 +k=1 +x_0=0 +y_0=0 +datum=WGS84 +units=m
+no_defs'" unit="metres">-3400000</Min_Y>
<Max_Y proj4="'+proj=stere +lat_0=90 +lat_ts=70 +lon_0=-45 +k=1 +x_0=0 +y_0=0 +datum=WGS84 +units=m
+no_defs'" unit="metres">-600000</Max_Y>
</Product_Location>
<Resolution>
<Grid_Pixel_Width units="metres">2000</Grid_Pixel_Width>
<Grid_Pixel_Height units="metres">2000</Grid_Pixel_Height>

Issue 1.1
CryoTEMPO-EOLIS: Product Handbook
</Resolution>
<Interpolation_Window>
<Window_Start>UTC=2011-03-01T04:41:41</Window_Start>
<Window_End>UTC=2016-05-31T18:30:19</Window_End>
<Window_Centre>UTC=2011-04-15T00:00:00</Window_Centre>
</Interpolation_Window>
<DSDs>
<List_of_DSDs count="0"/>
</DSDs>
</SPH>
</Variable_Header>
</Earth_Explorer_Header>
Issue 1.1
CryoTEMPO-EOLIS: Product Handbook
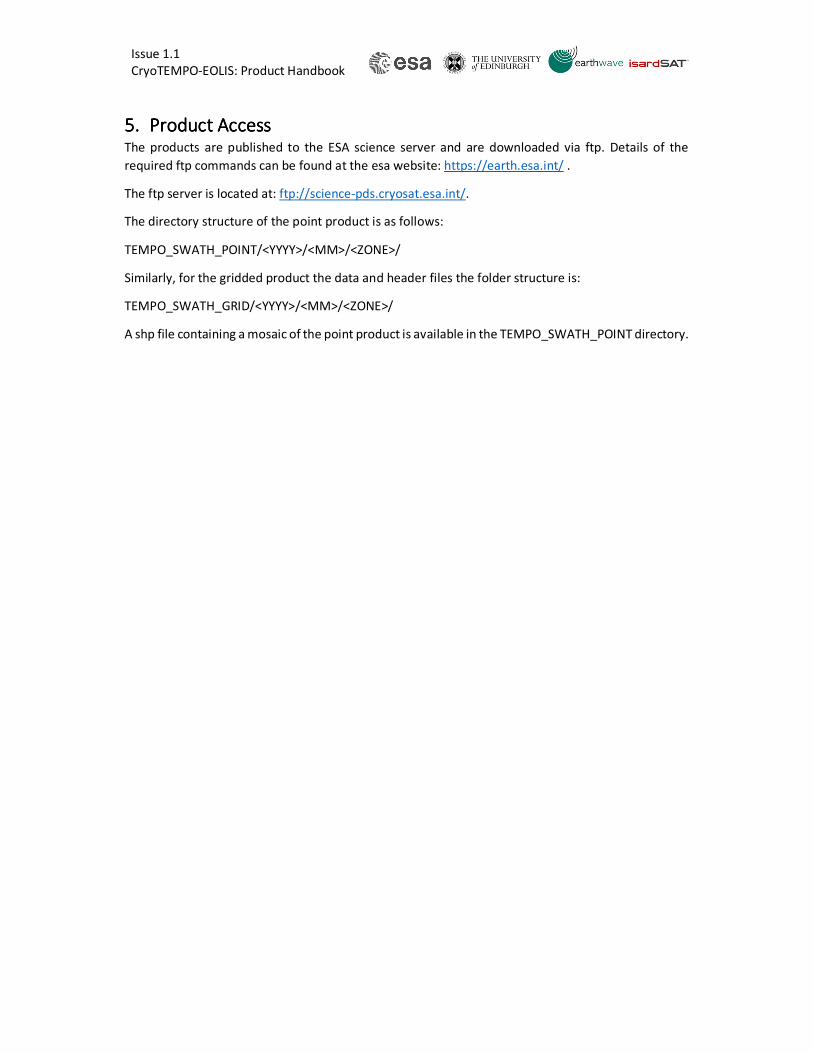
5.5.5.5. Product Product Product Product AccessAccessAccessAccess The products are published to the ESA science server and are downloaded via ftp. Details of the
required ftp commands can be found at the esa website: https://earth.esa.int/ .
The ftp server is located at: ftp://science-pds.cryosat.esa.int/.
The directory structure of the point product is as follows:
TEMPO_SWATH_POINT/<YYYY>/<MM>/<ZONE>/
Similarly, for the gridded product the data and header files the folder structure is:
TEMPO_SWATH_GRID/<YYYY>/<MM>/<ZONE>/
A shp file containing a mosaic of the point product is available in the TEMPO_SWATH_POINT directory.

Issue 1.1
CryoTEMPO-EOLIS: Product Handbook
6.6.6.6. ContactsContactsContactsContacts Feedback or questions about the CryoTEMPO-EOLIS Thematic Products is welcomed. Please use the
following contact details:
e-mail: [email protected]
Website: http://www.cryotempo-eolis.org
Recommended