Third Quarter 2012 Results
CTC Media, Inc.
Investor Presentation

A Leading Independent Broadcaster in Russia
1
From Private TV Network to Public Media Holding
2
1989 1994 1996 2002 2005 2006 2008 2009 2010 2011 2012
CTC Media was
founded as StoryFirst
Communications
Launch of CTC
Network
Launch of CTC
Network Modern Times Group
became a shareholder
of CTC Media
Launch of
Domashny Network
Initial Public Offering
on NASDAQ
Acquisition of the DTV
group
Acquisition of
Channel 31 in
Kazakhstan
CTC Media enters
Moldova free-to-air TV
market
Acquisition of
Costafilm and Soho
Media production
companies
Launch of CTC-
international in
Kazakhstan,
Kyrgyzstan,
Armenia, Georgia,
Azerbaijan,
Thailand
Uplink of СTC-
international to the
HOT BIRD satellite
(Europe, Middle
East, North Africa
and Central Asia)
Launch of CTC-international
in Germany and the Baltics
Telcrest Investments
Limited acquired a 25%
stake in СTС Media from
Alfa Group
Costafilm and Soho Media
united into Story First
Production
DTV is rebranded to Peretz
Launch of CTC-
international in
USA
Launch of CTC-
international in
Israel
Establishment of
CTC Media’s
internal advertising
sales house
‘Everest Sales’
Launch of
‘Videomore’ online
social television
network
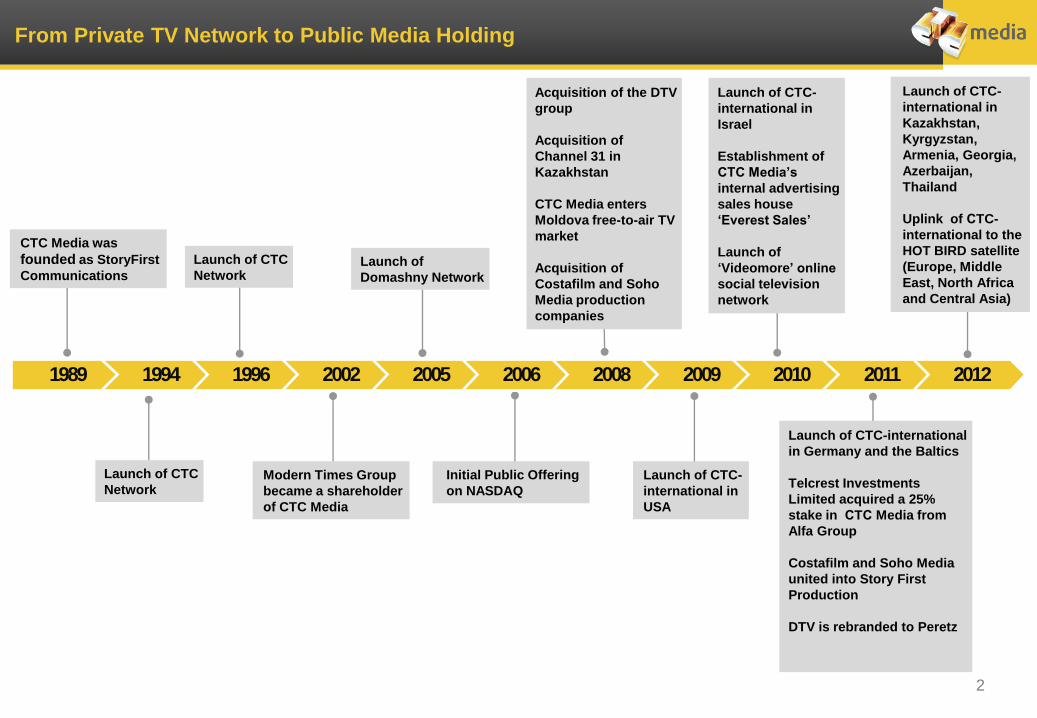
NEW MEDIA
CTC-INTERNATIONAL (PAY-TV)
AD SALES
CONTENT PRODUCTION
FREE-TO-AIR (CIS)
We Fully Capture the Value Chain by Being a Vertically Integrated TV Broadcaster
3
FREE-TO-AIR ( RUSSIA)
Note: (*) DTV Network operates under Peretz brand name & logo starting from October 2011
CTC – target audience All 6-54 (All 10-45 starting 2013)
Domashny – target audience Females 25-59
Peretz – target audience All 25-59 (All 25-49 starting 2013)
Free-to-air
TV ad maket growth1
Kazakhstan Channel 31
Moldova СTС Mega
Story First Production
Internal advertising sales house Everest
International version of CTC channel
Various digital projects
Online video portal Videomore.ru
Women’s portal Domashniy.ru
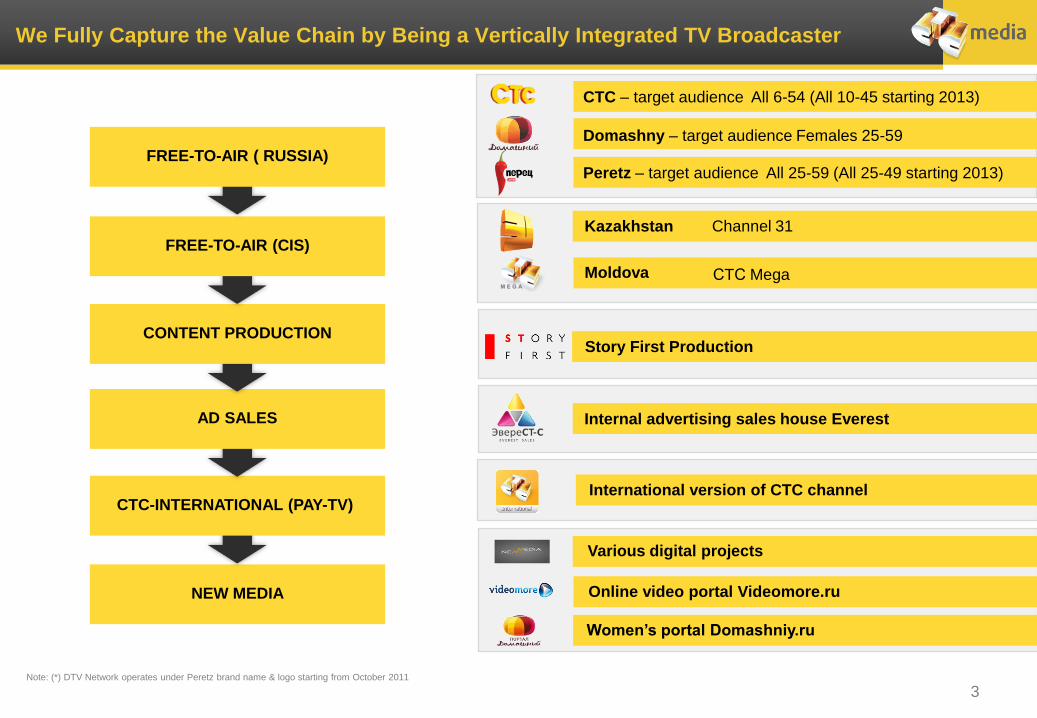
We Operate in Attractive Markets
4 Sources: Video International, Russian Association of Communications Agencies, ZenithOptimedia, CIA World Factbook, Rosstat, Russkiy Mir Foundation
Note: (*) All TV Ad Markets figures are net of VAT
Kazakhstan Population = 16.3 million
2011 TV Ad Market = US$ 120 million*
Russian-speaking population = 12.3 million
Kyrgyzstan Russian-speaking
population = 2.5 million
USA Russian-speaking
population = 3.5 million
Germany Russian-speaking
population = 6 million
Russia Population = 142 million
2011 TV Ad Market = US$ 4.4 billion*
Israel Russian-speaking
population = 1.5 million
Moldova Population = 3.6 million
2011 TV Ad Market = US$ 16.6 million*
Baltic states Russian-speaking
population = 4 million
Since February 2012
CTC-International
is available on the HOT
BIRDTM 8 satellite
(W/E Europe, North Africa,
Middle East and Central Asia
coverage)
Thailand Russian-speaking tourists = 0.8 million (2011)
Armenia, Georgia, Azerbaijan Russian-speaking population=10.4 mln
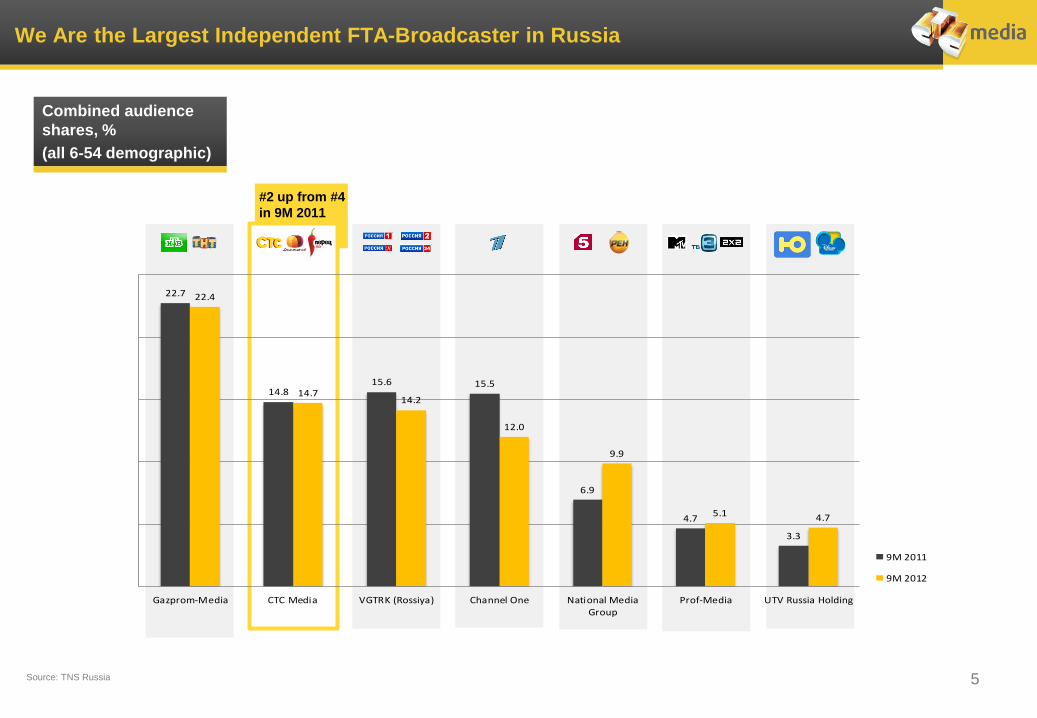
We Are the Largest Independent FTA-Broadcaster in Russia
5
Combined audience
shares, %
(all 6-54 demographic)
Source: TNS Russia
#2 up from #4
in 9M 2011
22.7
14.815.6 15.5
6.9
4.7
3.3
22.4
14.714.2
12.0
9.9
5.1 4.7
Gazprom-Media СTС Media VGTRK (Rossiya) Channel One National MediaGroup
Prof-Media UTV Russia Holding
9M 2011
9M 2012

6
Growth Company Operating in a Dynamic Market
USA Japan China Brazil Russia Germany Italy France
131
190
275
2011 2015F 2020F7
US
$ b
ln
4.4
19.2
11.4
10.9
5.4 5.1
4.9
58.0
4.5
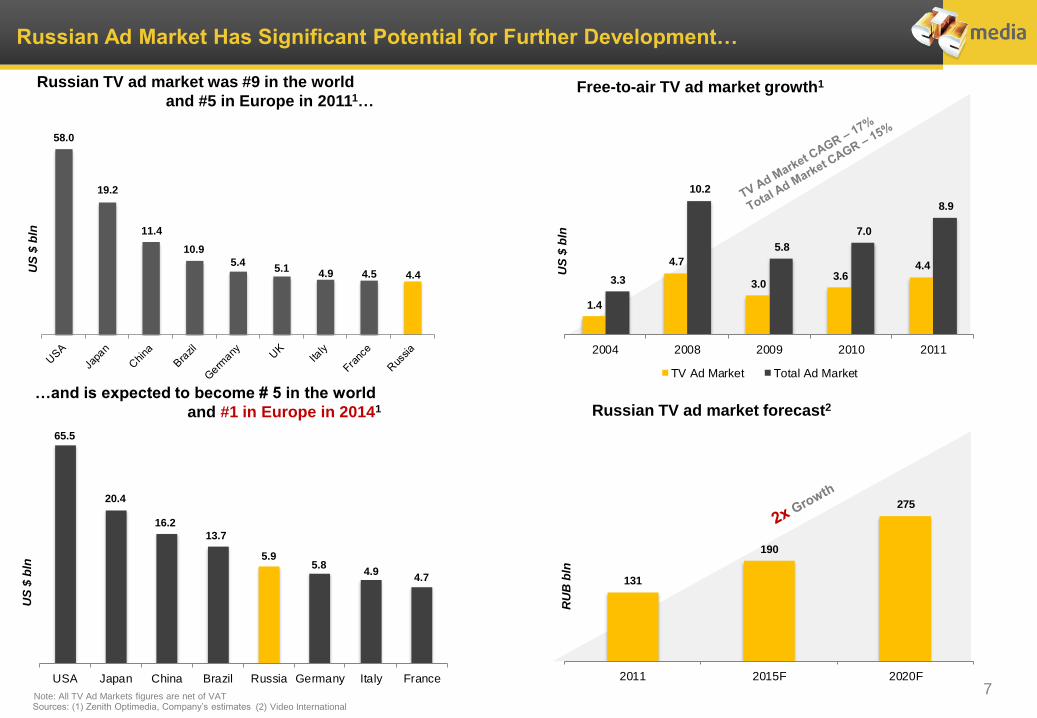
Russian Ad Market Has Significant Potential for Further Development…
Russian TV ad market was #9 in the world
and #5 in Europe in 20111…
…and is expected to become # 5 in the world
and #1 in Europe in 20141
US
$ b
ln
65.5
4.9
13.7
5.9 5.8
4.7
16.2
20.4
Free-to-air TV ad market growth1
US
$ b
ln
RU
B b
ln
1.4
4.7
3.0 3.6
4.4
3.3
10.2
5.8
7.0
8.9
2004 2008 2009 2010 2011
TV Ad Market Total Ad Market
Russian TV ad market forecast2
Sources: (1) Zenith Optimedia, Company’s estimates Note: All TV Ad Markets figures are net of VAT
(2) Video International
1.4
1.7
0.9
1.2
0.90.9
0.80.8
0.7
0.6 0.6
1.8
1.4
1.11.0
1.0
0.80.7 0.7
0.60.5 0.5
Slo
ve
nia
Bu
lga
ria
Au
str
ia
US
A
Be
lgiu
m
UK
Ge
rma
ny
CE
E A
ve
rag
e
Russia
Ukra
ine
Po
lan
d2008 2011
8
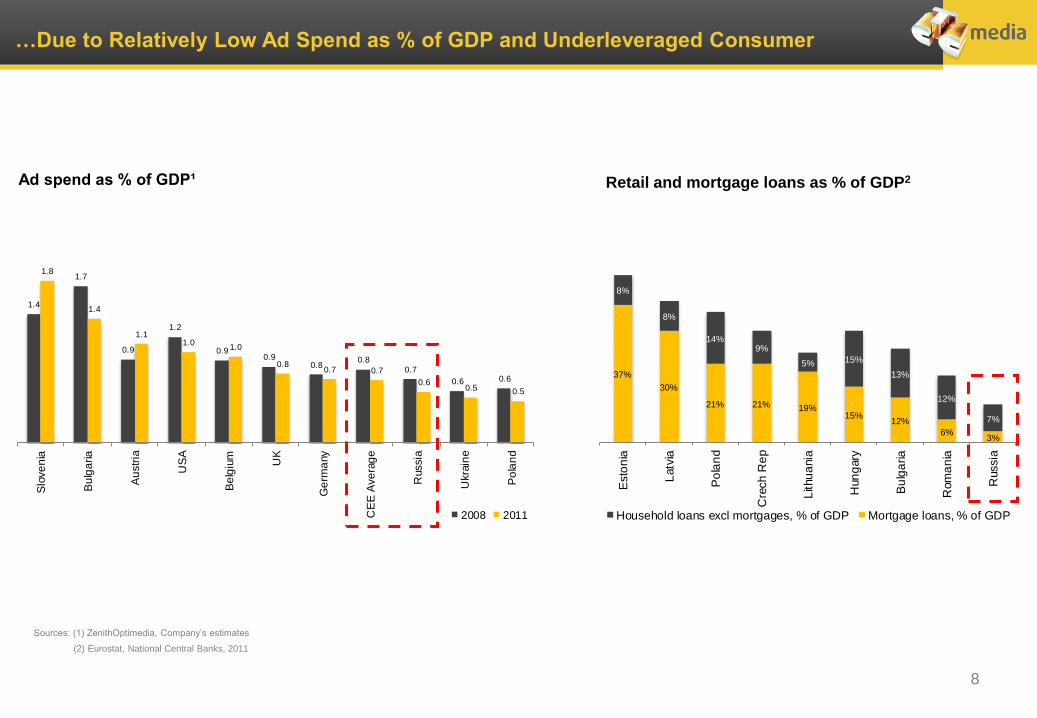
…Due to Relatively Low Ad Spend as % of GDP and Underleveraged Consumer
Ad spend as % of GDP¹
Sources: (1) ZenithOptimedia, Company’s estimates
(2) Eurostat, National Central Banks, 2011
Retail and mortgage loans as % of GDP2
37%
30%
21% 21% 19%15%
12%
6%3%
8%
8%
14%9%
5% 15%
13%
12%
7%
Esto
nia
Latv
ia
Po
lan
d
Cre
ch
Re
p
Lithu
ania
Hun
gary
Bu
lga
ria
Rom
an
ia
Russia
Household loans excl mortgages, % of GDP Mortgage loans, % of GDP
9
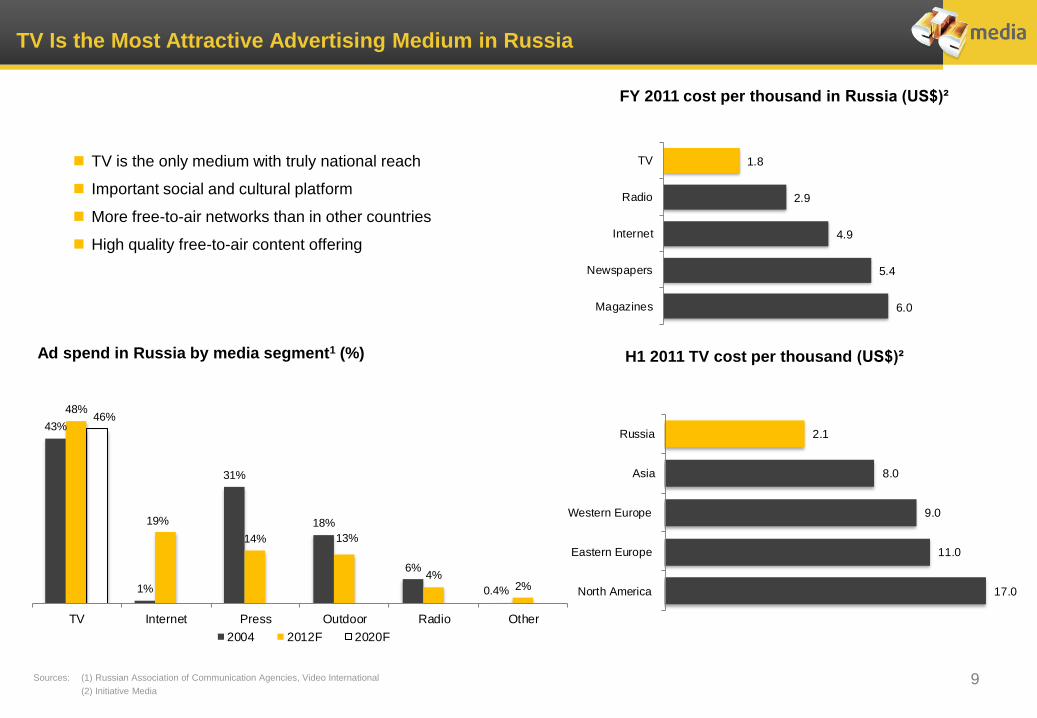
TV is the only medium with truly national reach
Important social and cultural platform
More free-to-air networks than in other countries
High quality free-to-air content offering
TV Is the Most Attractive Advertising Medium in Russia
Ad spend in Russia by media segment1 (%)
FY 2011 cost per thousand in Russia (US$)²
H1 2011 TV cost per thousand (US$)²
2.1
8.0
9.0
11.0
17.0
Russia
Asia
Western Europe
Eastern Europe
North America
1.8
2.9
4.9
5.4
6.0
TV
Radio
Internet
Newspapers
Magazines
43%
1%
31%
18%
6%
0.4%
48%
19%
14% 13%
4%2%
46%
TV Internet Press Outdoor Radio Other
2004 2012F 2020F
Sources: (1) Russian Association of Communication Agencies, Video International
(2) Initiative Media
2.7
1.7
0.9
0.5
2.3
2.93.1
2.42.1
0.7
China Russia Brazil India USA Japan
2009 2015E
10
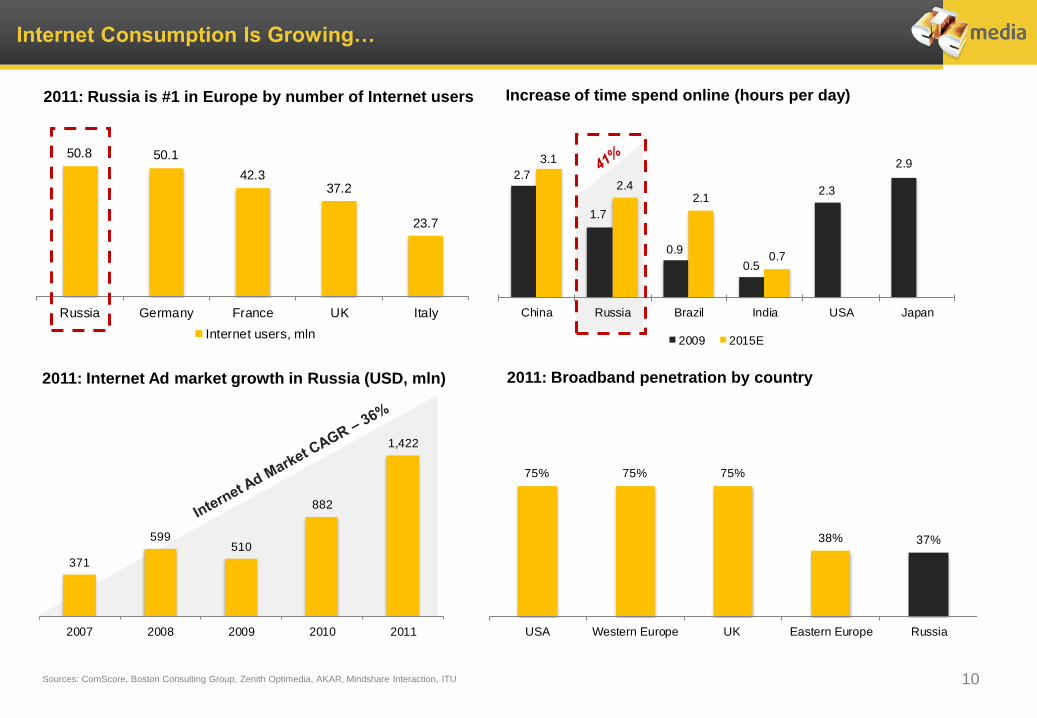
Internet Consumption Is Growing…
2011: Russia is #1 in Europe by number of Internet users
2011: Internet Ad market growth in Russia (USD, mln)
Increase of time spend online (hours per day)
2011: Broadband penetration by country
50.8 50.1
42.337.2
23.7
Russia Germany France UK Italy
Internet users, mln
371
599510
882
1,422
2007 2008 2009 2010 2011
75% 75% 75%
38% 37%
USA Western Europe UK Eastern Europe Russia
Sources: ComScore, Boston Consulting Group, Zenith Optimedia, AKAR, Mindshare Interaction, ITU
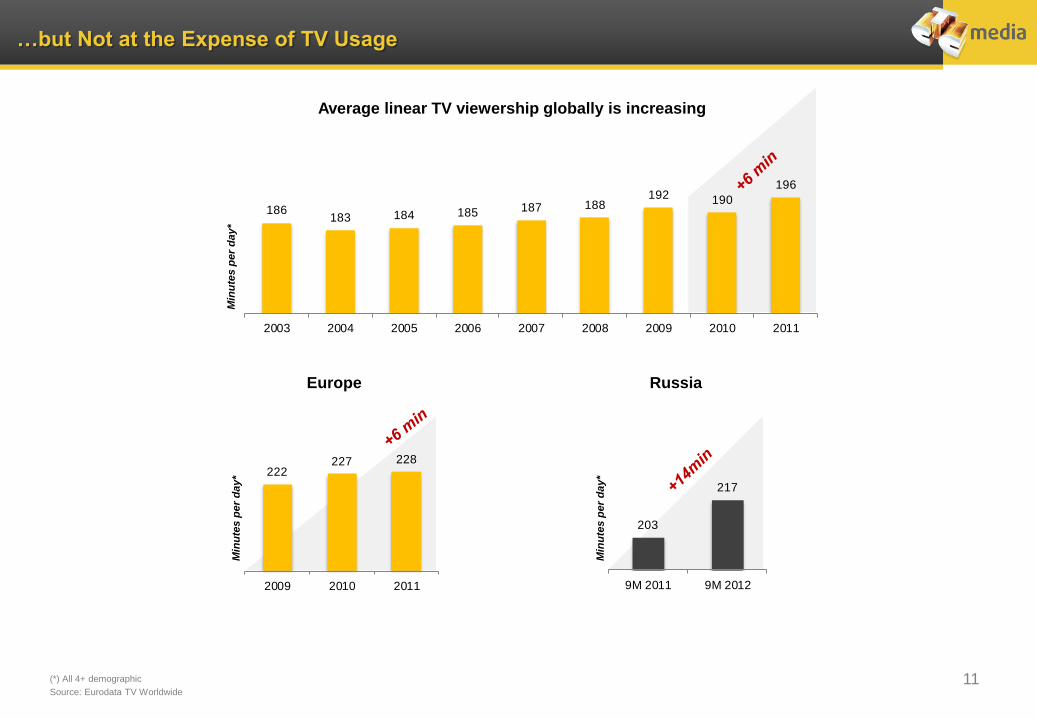
186183 184 185 187 188
192 190
196
2003 2004 2005 2006 2007 2008 2009 2010 2011
203
217
9M 2011 9M 2012
11
…but Not at the Expense of TV Usage
Average linear TV viewership globally is increasing
Europe Russia
Min
ute
s p
er
da
y*
222227 228
2009 2010 2011
(*) All 4+ demographic
Source: Eurodata TV Worldwide
Min
ute
s p
er
da
y*
Min
ute
s p
er
da
y*
12
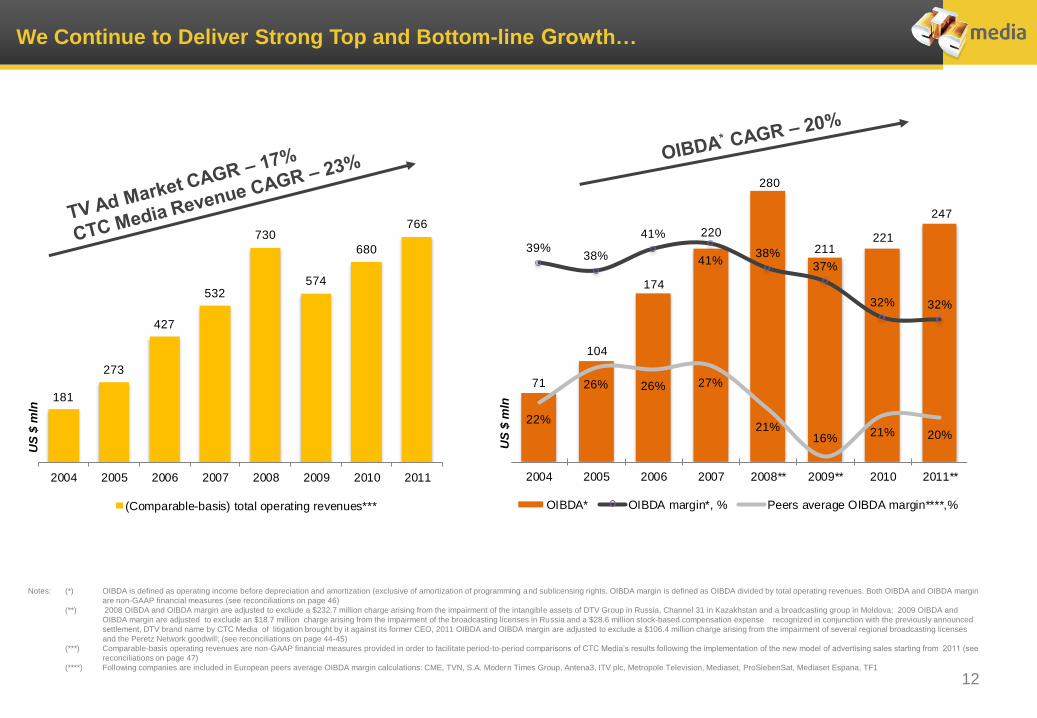
We Continue to Deliver Strong Top and Bottom-line Growth…
181
273
427
532
730
574
680
766
2004 2005 2006 2007 2008 2009 2010 2011
(Comparable-basis) total operating revenues***
71
104
174
220
280
211221
247
39%38%
41%
41%38%
37%
32% 32%
22%
26% 26% 27%
21%16%
21% 20%
15%
25%
35%
45%
0
50
100
150
200
250
2004 2005 2006 2007 2008** 2009** 2010 2011**
OIBDA* OIBDA margin*, % Peers average OIBDA margin****,%
Notes: (*) OIBDA is defined as operating income before depreciation and amortization (exclusive of amortization of programming and sublicensing rights. OIBDA margin is defined as OIBDA divided by total operating revenues. Both OIBDA and OIBDA margin
are non-GAAP financial measures (see reconciliations on page 46)
(**) 2008 OIBDA and OIBDA margin are adjusted to exclude a $232.7 million charge arising from the impairment of the intangible assets of DTV Group in Russia, Channel 31 in Kazakhstan and a broadcasting group in Moldova; 2009 OIBDA and
OIBDA margin are adjusted to exclude an $18.7 million charge arising from the impairment of the broadcasting licenses in Russia and a $28.6 million stock-based compensation expense recognized in conjunction with the previously announced
settlement, DTV brand name by CTC Media of litigation brought by it against its former CEO, 2011 OIBDA and OIBDA margin are adjusted to exclude a $106.4 million charge arising from the impairment of several regional broadcasting licenses
and the Peretz Network goodwill; (see reconciliations on page 44-45)
(***) Comparable-basis operating revenues are non-GAAP financial measures provided in order to facilitate period-to-period comparisons of CTC Media’s results following the implementation of the new model of advertising sales starting from 2011 (see
reconciliations on page 47)
(****) Following companies are included in European peers average OIBDA margin calculations: CME, TVN, S.A. Modern Times Group, Antena3, ITV plc, Metropole Television, Mediaset, ProSiebenSat, Mediaset Espana, TF1
US
$ m
ln
US
$ m
ln
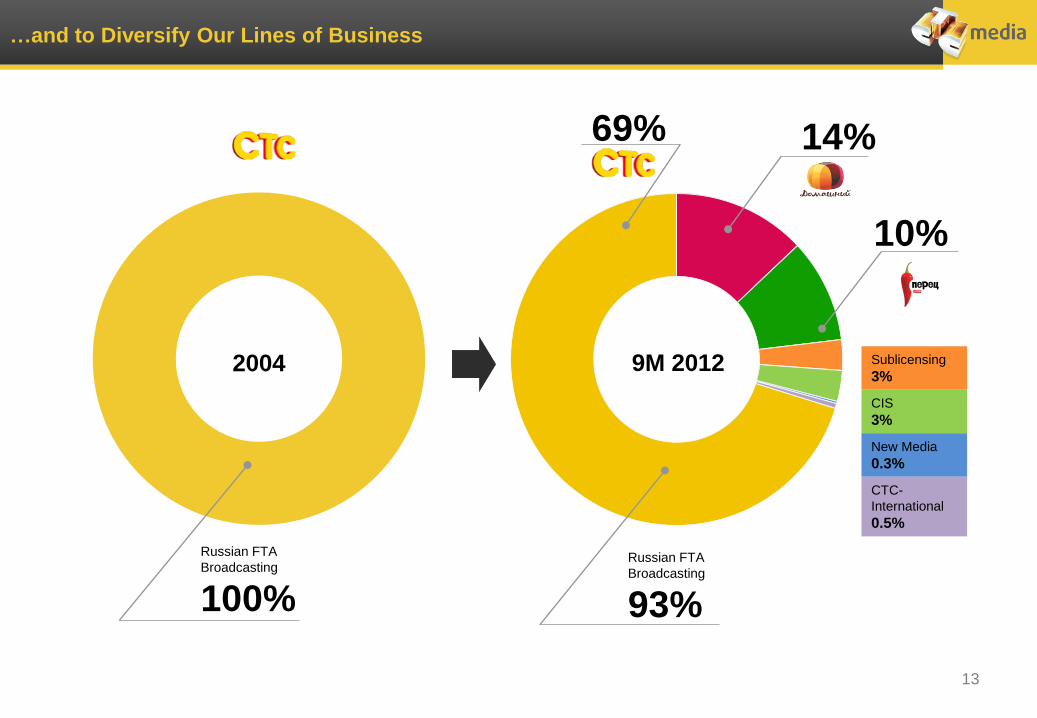
…and to Diversify Our Lines of Business
13
9M 2012
Russian FTA
Broadcasting
93%
69% 14%
10%
Sublicensing
3%
CIS
3%
New Media
0.3%
CTC-
International
0.5%
2004
Russian FTA
Broadcasting
100%
14
Strategic Focus on Long-Term Growth and Diversification
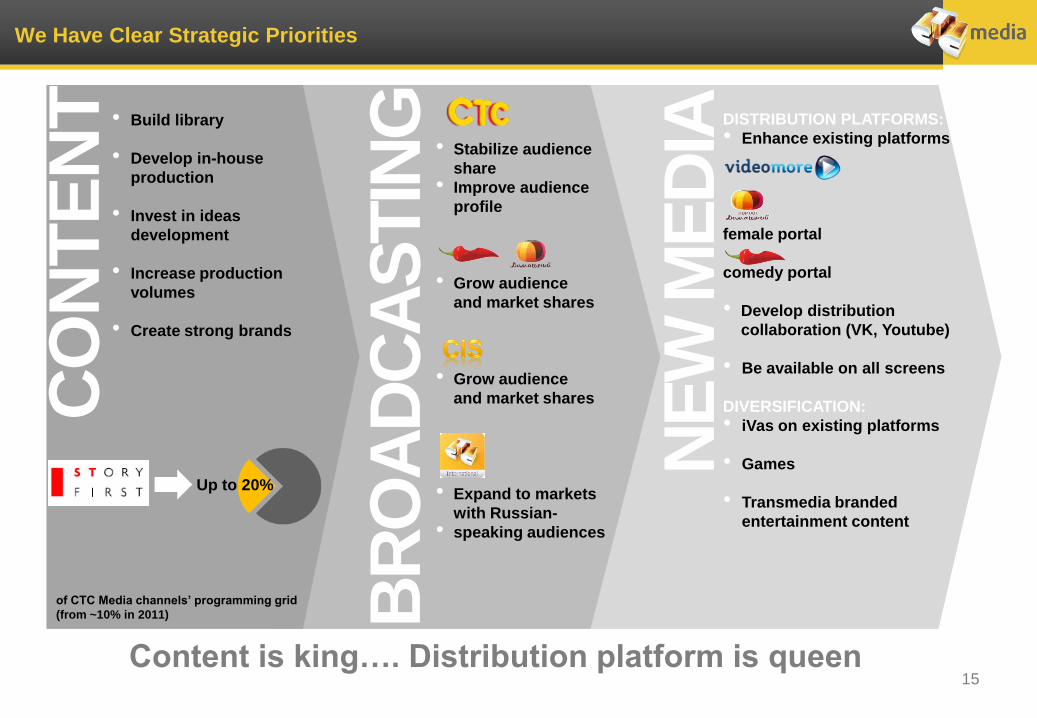
We Have Clear Strategic Priorities
CO
NT
EN
T
DISTRIBUTION PLATFORMS:
• Enhance existing platforms
female portal
comedy portal
• Develop distribution
collaboration (VK, Youtube)
• Be available on all screens
DIVERSIFICATION:
• iVas on existing platforms
• Games
• Transmedia branded
entertainment content
BR
OA
DC
AS
TIN
G
• Stabilize audience
share
• Improve audience
profile
• Grow audience
and market shares
• Grow audience
and market shares
• Expand to markets
with Russian-
• speaking audiences
• Build library
• Develop in-house
production
• Invest in ideas
development
• Increase production
volumes
• Create strong brands
Up to 20%
of CTC Media channels’ programming grid
(from ~10% in 2011)
Content is king…. Distribution platform is queen 15
CO
NT
EN
T
NE
W M
ED
IA
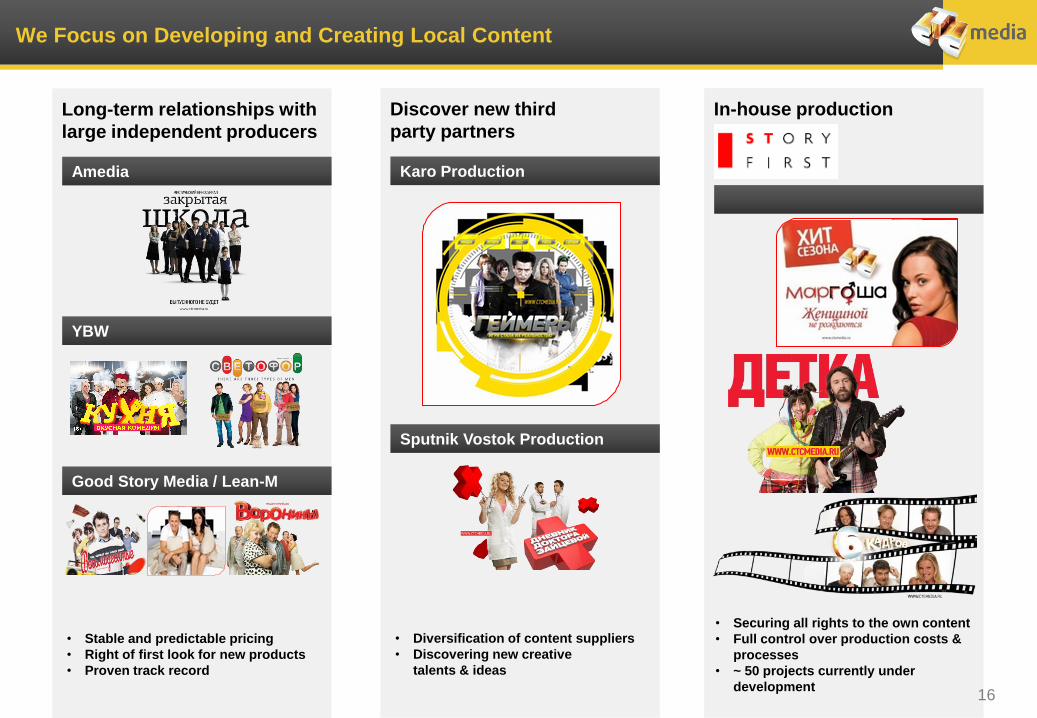
We Focus on Developing and Creating Local Content
16
Long-term relationships with
large independent producers
Amedia
YBW
Good Story Media / Lean-M
• Stable and predictable pricing
• Right of first look for new products
• Proven track record
Discover new third
party partners
Karo Production
Sputnik Vostok Production
• Diversification of content suppliers
• Discovering new creative
talents & ideas
In-house production
• Securing all rights to the own content
• Full control over production costs &
processes
• ~ 50 projects currently under
development 16
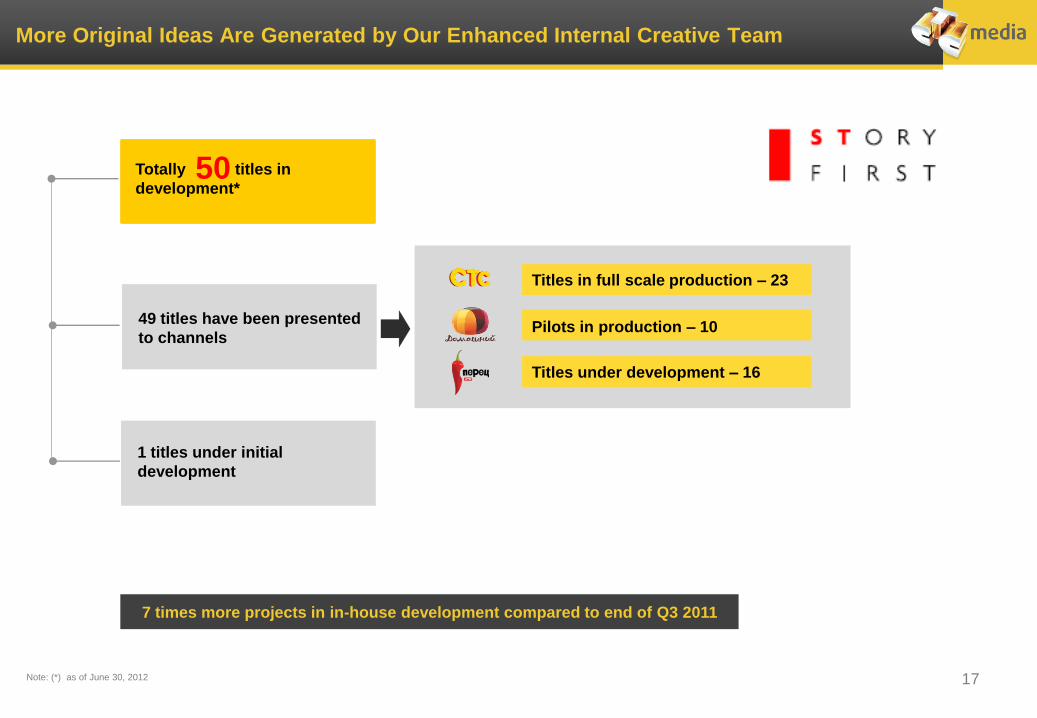
More Original Ideas Are Generated by Our Enhanced Internal Creative Team
17
49 titles have been presented
to channels
Totally titles in
development*
1 titles under initial
development
Titles in full scale production – 23
Pilots in production – 10
Titles under development – 16
7 times more projects in in-house development compared to end of Q3 2011
Note: (*) as of June 30, 2012
50
0.0%
0.5%
1.0%
1.5%
2.0%
2.5%
3.0%
3.5%
4.0%
4 9 14 19 24 29 34 39 44 49 54 59 64 69 74
Advertisers' demand CTC audience demographic profile
18
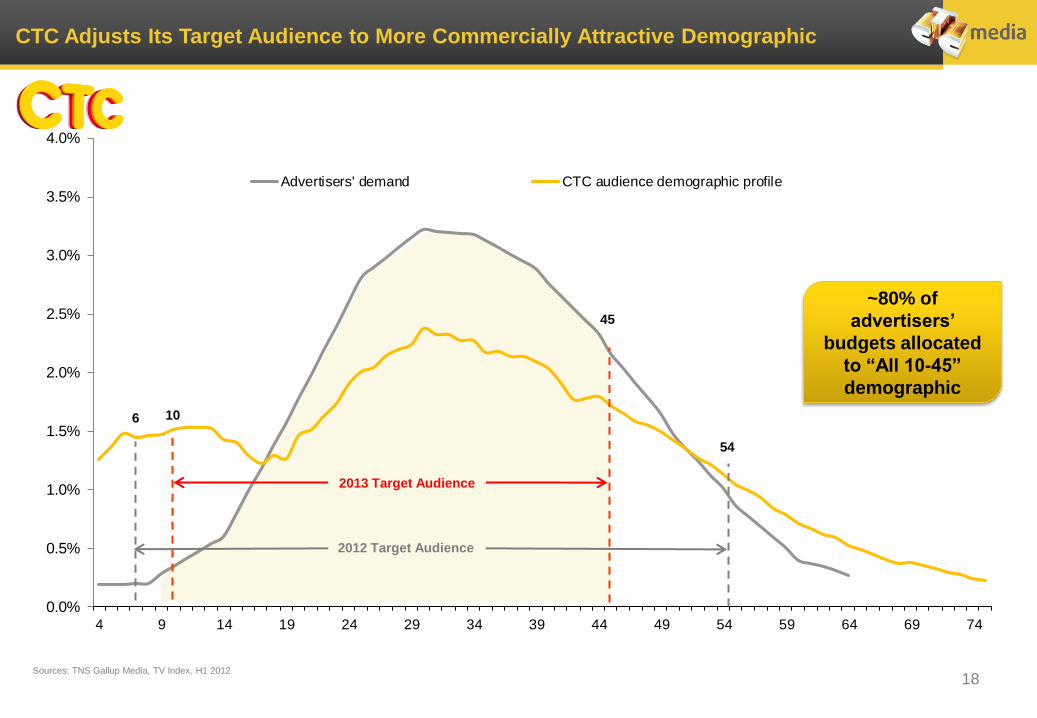
CTC Adjusts Its Target Audience to More Commercially Attractive Demographic
Sources: TNS Gallup Media, TV Index, H1 2012
~80% of
advertisers’
budgets allocated
to “All 10-45”
demographic
6 10
45
54
2013 Target Audience
2012 Target Audience
0.0%
0.5%
1.0%
1.5%
2.0%
2.5%
3.0%
3.5%
4.0%
4 6 8 10 12 14 16 18 20 22 24 26 28 30 32 34 36 38 40 42 44 46 48 50 52 54 56 58 60 62 64 66 68 70 72 74
Advertisers' demand Peretz audience demographic profile
19
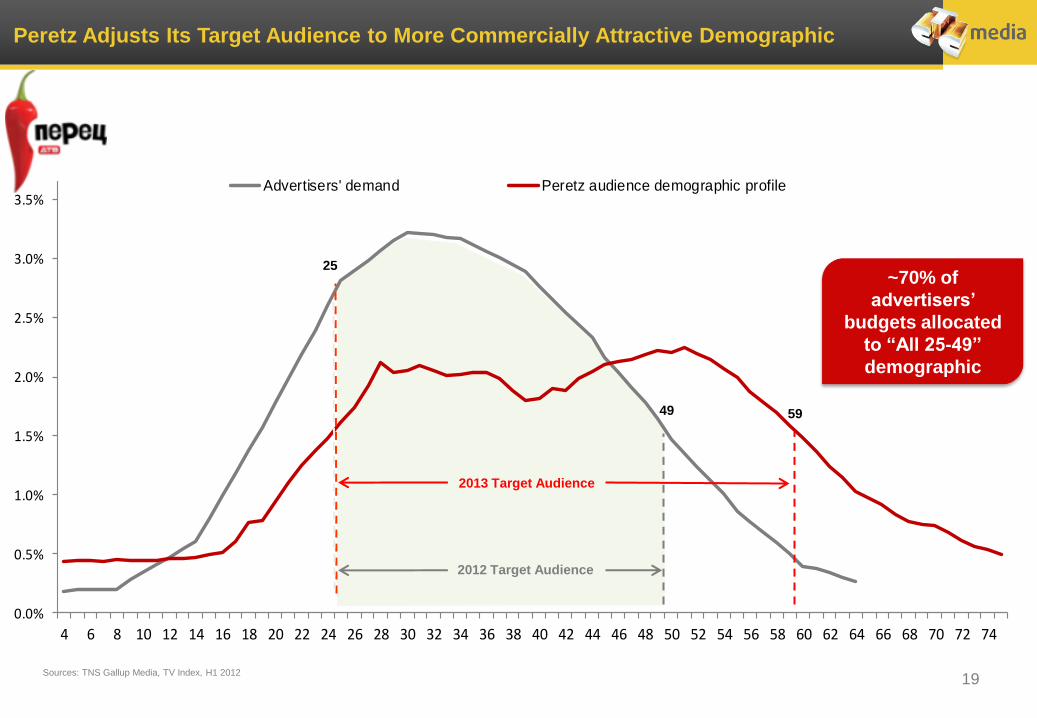
Peretz Adjusts Its Target Audience to More Commercially Attractive Demographic
~70% of
advertisers’
budgets allocated
to “All 25-49”
demographic
Sources: TNS Gallup Media, TV Index, H1 2012
25
49 59
2013 Target Audience
2012 Target Audience
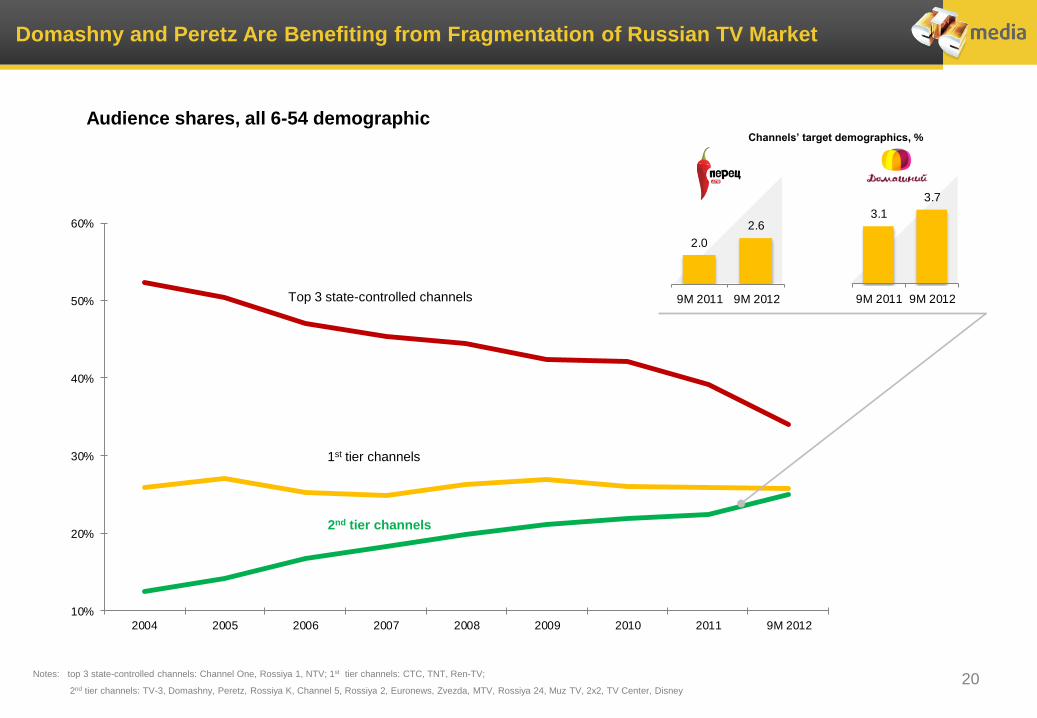
2.0
2.6
9M 2011 9M 2012
3.1
3.7
9M 2011 9M 2012
20
Domashny and Peretz Are Benefiting from Fragmentation of Russian TV Market
Audience shares, all 6-54 demographic
Top 3 state-controlled channels
1st tier channels
2nd tier channels
Channels’ target demographics, %
Notes: top 3 state-controlled channels: Channel One, Rossiya 1, NTV; 1st tier channels: CTC, TNT, Ren-TV;
2nd tier channels: TV-3, Domashny, Peretz, Rossiya K, Channel 5, Rossiya 2, Euronews, Zvezda, MTV, Rossiya 24, Muz TV, 2x2, TV Center, Disney
10%
20%
30%
40%
50%
60%
2004 2005 2006 2007 2008 2009 2010 2011 9M 2012
W 25-59 All 10-45
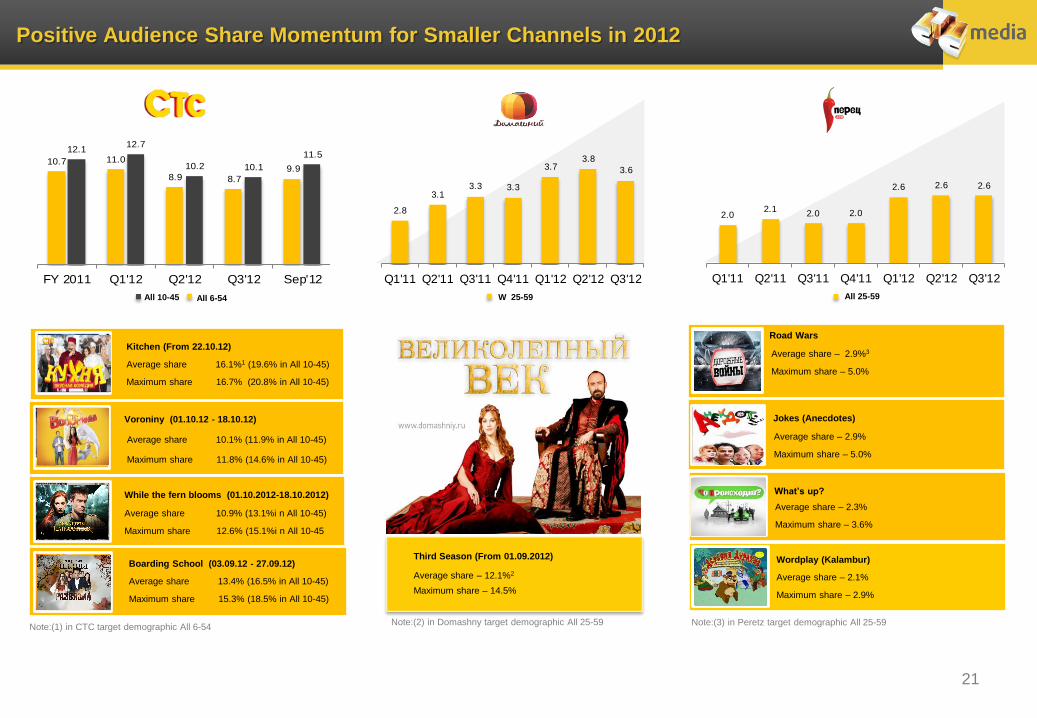
10.7 11.0
8.9 8.79.9
12.112.7
10.2 10.1
11.5
FY 2011 Q1'12 Q2'12 Q3'12 Sep'12
2.8
3.13.3 3.3
3.73.8
3.6
Q1'11 Q2'11 Q3'11 Q4'11 Q1'12 Q2'12 Q3'12
2.02.1
2.0 2.0
2.6 2.6 2.6
Q1'11 Q2'11 Q3'11 Q4'11 Q1'12 Q2'12 Q3'12
All 25-59
21
Kitchen (From 22.10.12)
Average share 16.1%1 (19.6% in All 10-45)
Maximum share 16.7% (20.8% in All 10-45)
Voroniny (01.10.12 - 18.10.12)
Average share 10.1% (11.9% in All 10-45)
Maximum share 11.8% (14.6% in All 10-45)
While the fern blooms (01.10.2012-18.10.2012)
Average share 10.9% (13.1%i n All 10-45)
Maximum share 12.6% (15.1%i n All 10-45
Boarding School (03.09.12 - 27.09.12)
Average share 13.4% (16.5% in All 10-45)
Maximum share 15.3% (18.5% in All 10-45)
Road Wars
Average share – 2.9%3
Maximum share – 5.0%
Jokes (Anecdotes)
Average share – 2.9%
Maximum share – 5.0%
What’s up?
Average share – 2.3%
Maximum share – 3.6%
Wordplay (Kalambur)
Average share – 2.1%
Maximum share – 2.9%
Third Season (From 01.09.2012)
Average share – 12.1%2
Maximum share – 14.5%
Note:(1) in CTC target demographic All 6-54 Note:(2) in Domashny target demographic All 25-59 Note:(3) in Peretz target demographic All 25-59
All 6-54
Positive Audience Share Momentum for Smaller Channels in 2012
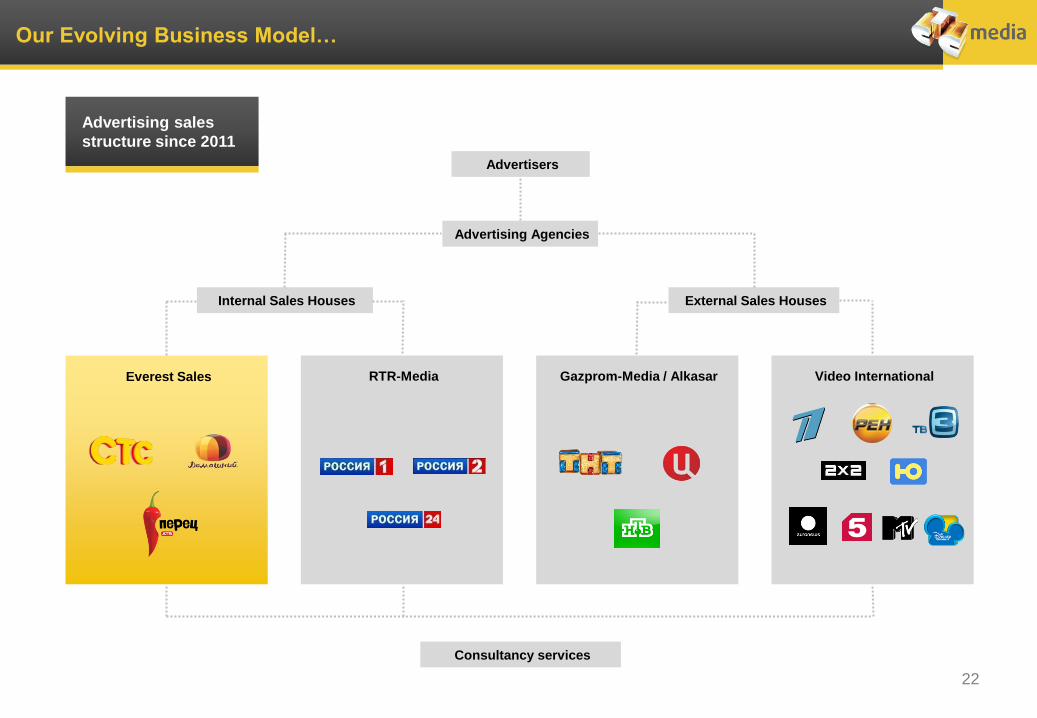
Our Evolving Business Model…
22
Advertising sales
structure since 2011
Advertisers
Advertising Agencies
Internal Sales Houses External Sales Houses
Everest Sales RTR-Media Gazprom-Media / Alkasar Video International
Consultancy services
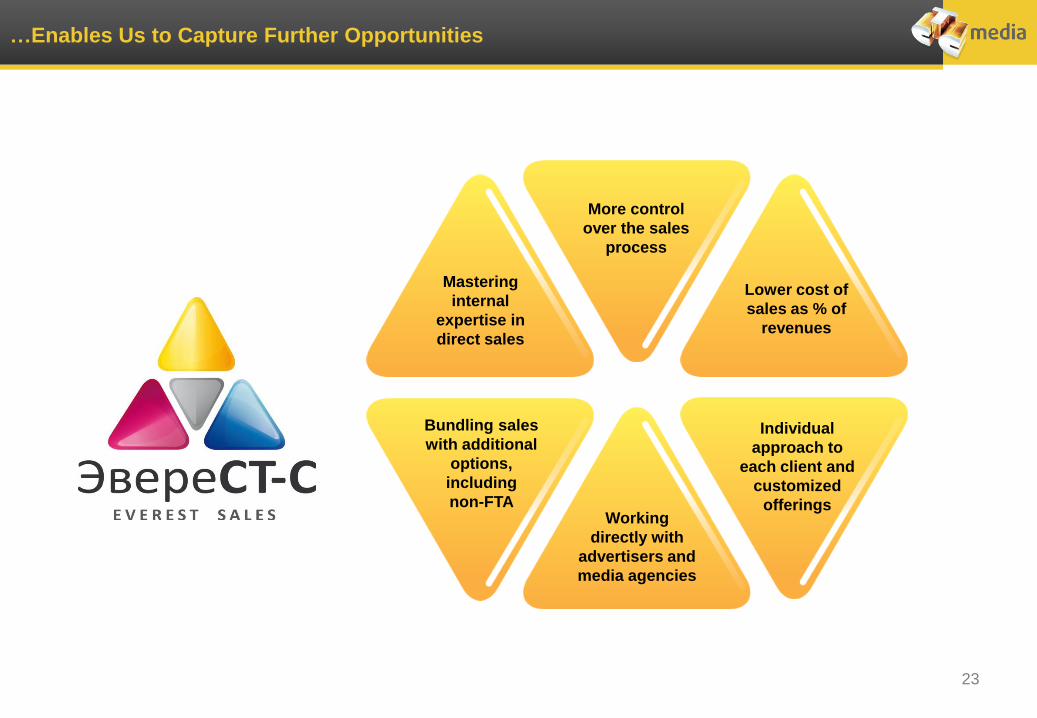
…Enables Us to Capture Further Opportunities
23
More control
over the sales
process
Lower cost of
sales as % of
revenues
Mastering
internal
expertise in
direct sales
Bundling sales
with additional
options,
including
non-FTA
Individual
approach to
each client and
customized
offerings Working
directly with
advertisers and
media agencies
24
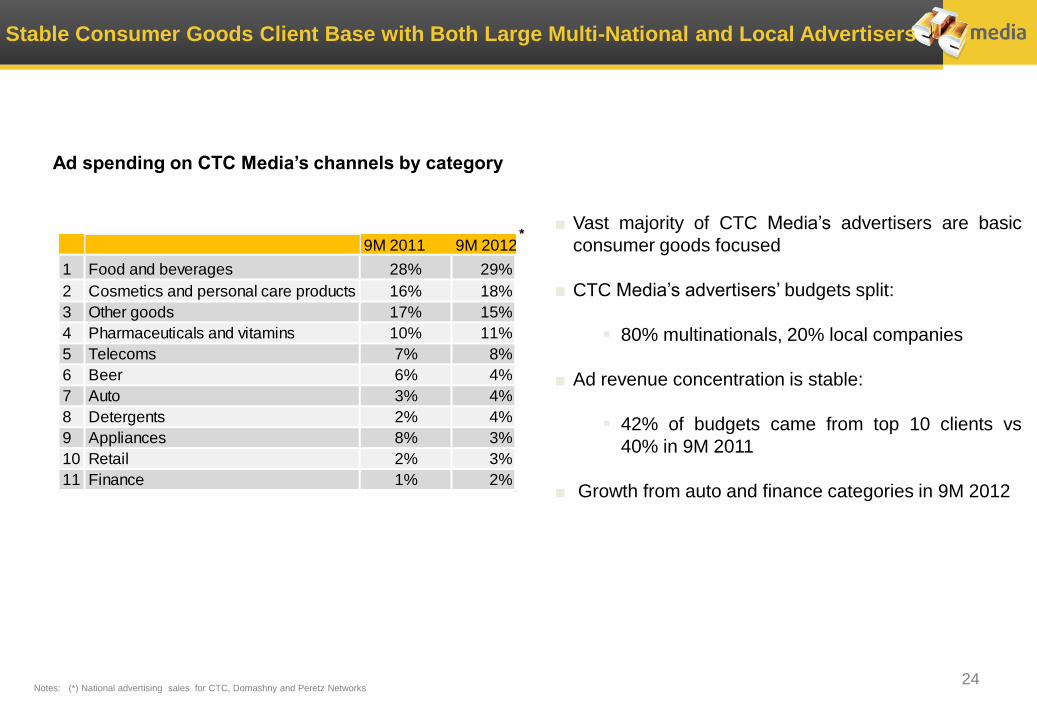
Stable Consumer Goods Client Base with Both Large Multi-National and Local Advertisers
Ad spending on CTC Media’s channels by category
* ■ Vast majority of CTC Media’s advertisers are basic
consumer goods focused
■ CTC Media’s advertisers’ budgets split:
80% multinationals, 20% local companies
■ Ad revenue concentration is stable:
42% of budgets came from top 10 clients vs
40% in 9M 2011
■ Growth from auto and finance categories in 9M 2012
Notes: (*) National advertising sales for CTC, Domashny and Peretz Networks
9M 2011 9M 2012
1 Food and beverages 28% 29%
2 Cosmetics and personal care products 16% 18%
3 Other goods 17% 15%
4 Pharmaceuticals and vitamins 10% 11%
5 Telecoms 7% 8%
6 Beer 6% 4%
7 Auto 3% 4%
8 Detergents 2% 4%
9 Appliances 8% 3%
10 Retail 2% 3%
11 Finance 1% 2%
Developing in Attractive CIS, International and New Media Markets
25
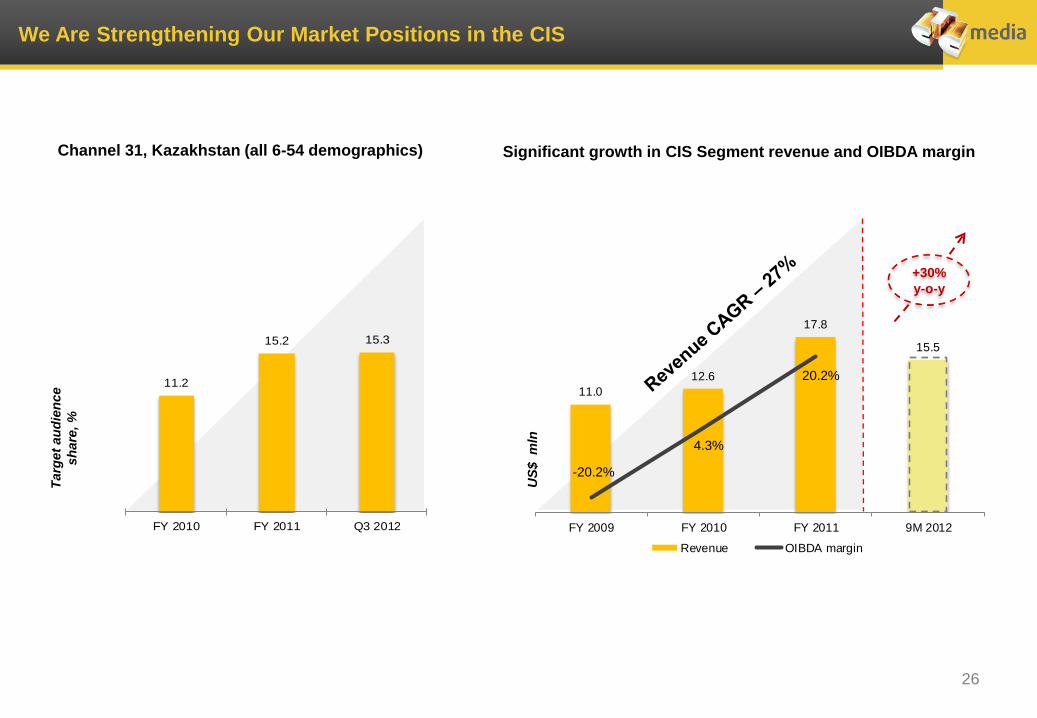
11.0
12.6
17.8
15.5
FY 2009 FY 2010 FY 2011 9M 2012
Revenue OIBDA margin
26
We Are Strengthening Our Market Positions in the CIS
Channel 31, Kazakhstan (all 6-54 demographics) Significant growth in CIS Segment revenue and OIBDA margin
US
$ m
ln
Targ
et
au
die
nce
sh
are
, %
-20.2%
4.3%
20.2%
+30%
y-o-y
11.2
15.2 15.3
FY 2010 FY 2011 Q3 2012
27
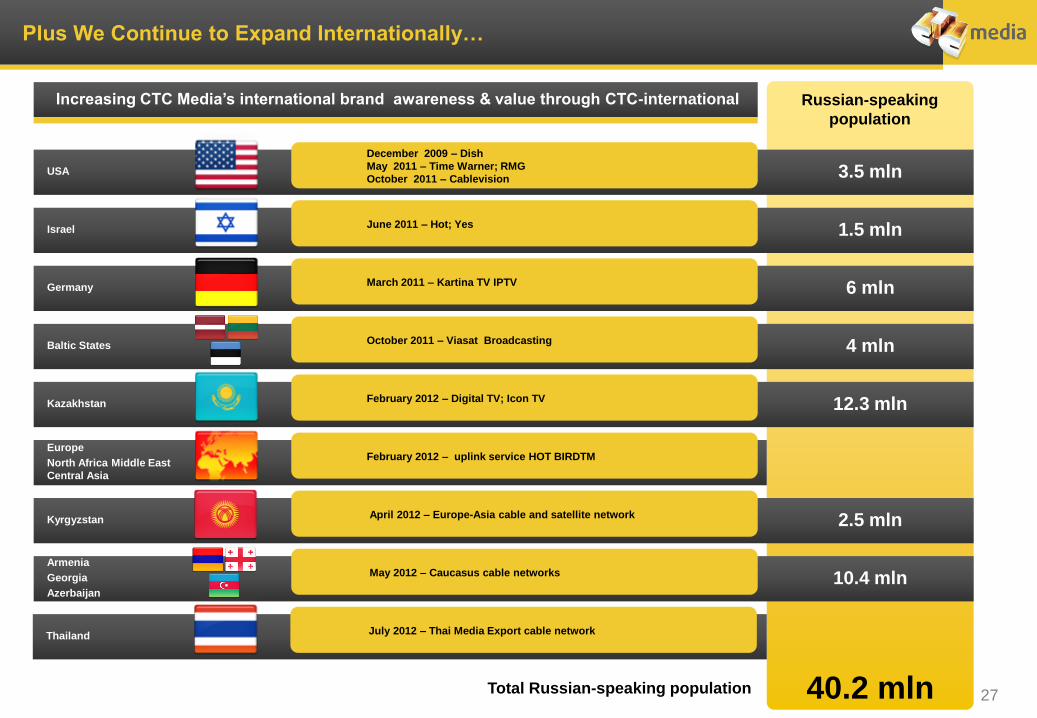
Plus We Continue to Expand Internationally…
Thailand July 2012 – Thai Media Export cable network
Armenia
Georgia
Azerbaijan
May 2012 – Caucasus cable networks 10.4 mln
Kyrgyzstan April 2012 – Europe-Asia cable and satellite network 2.5 mln
Europe
North Africa Middle East
Central Asia
February 2012 – uplink service HOT BIRDTM
Kazakhstan February 2012 – Digital TV; Icon TV 12.3 mln
Baltic States October 2011 – Viasat Broadcasting 4 mln
Germany March 2011 – Kartina TV IPTV 6 mln
Israel June 2011 – Hot; Yes 1.5 mln
USA
December 2009 – Dish
May 2011 – Time Warner; RMG
October 2011 – Cablevision 3.5 mln
Increasing CTC Media’s international brand awareness & value through CTC-international
Total Russian-speaking population 40.2 mln
Russian-speaking
population

28
…and Enter New Platforms to Be Wherever Our Viewers Are
29
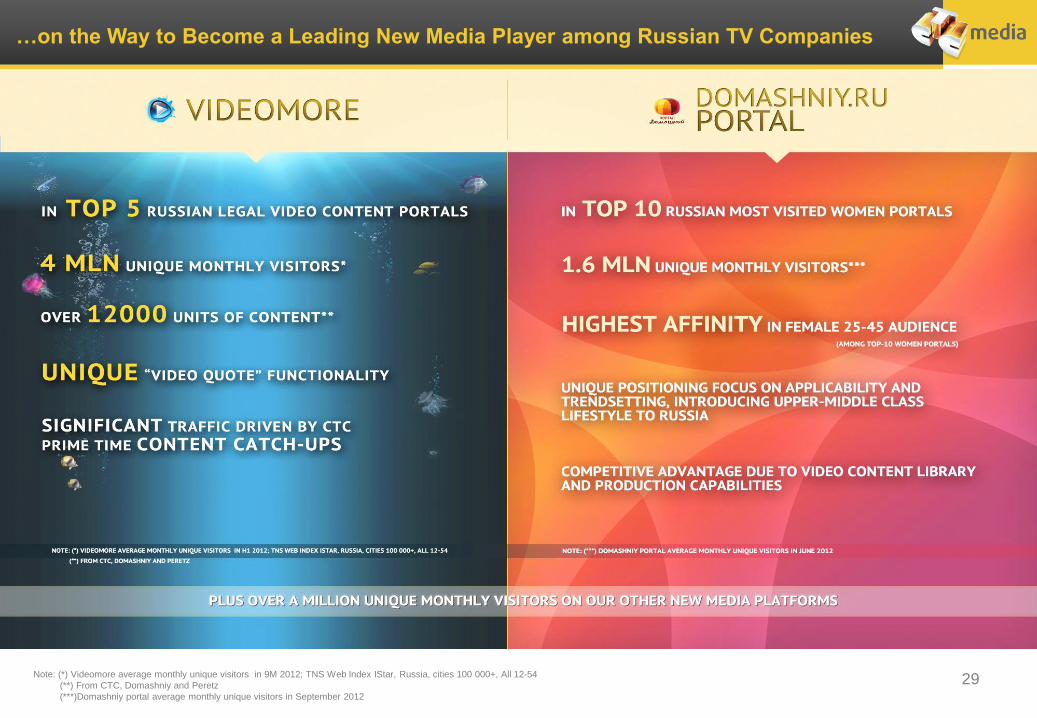
…on the Way to Become a Leading New Media Player among Russian TV Companies
Note: (*) Videomore average monthly unique visitors in 9M 2012; TNS Web Index IStar, Russia, cities 100 000+, All 12-54
(**) From CTC, Domashniy and Peretz
(***)Domashniy portal average monthly unique visitors in September 2012

30
Strong and Flexible Financial Position
31
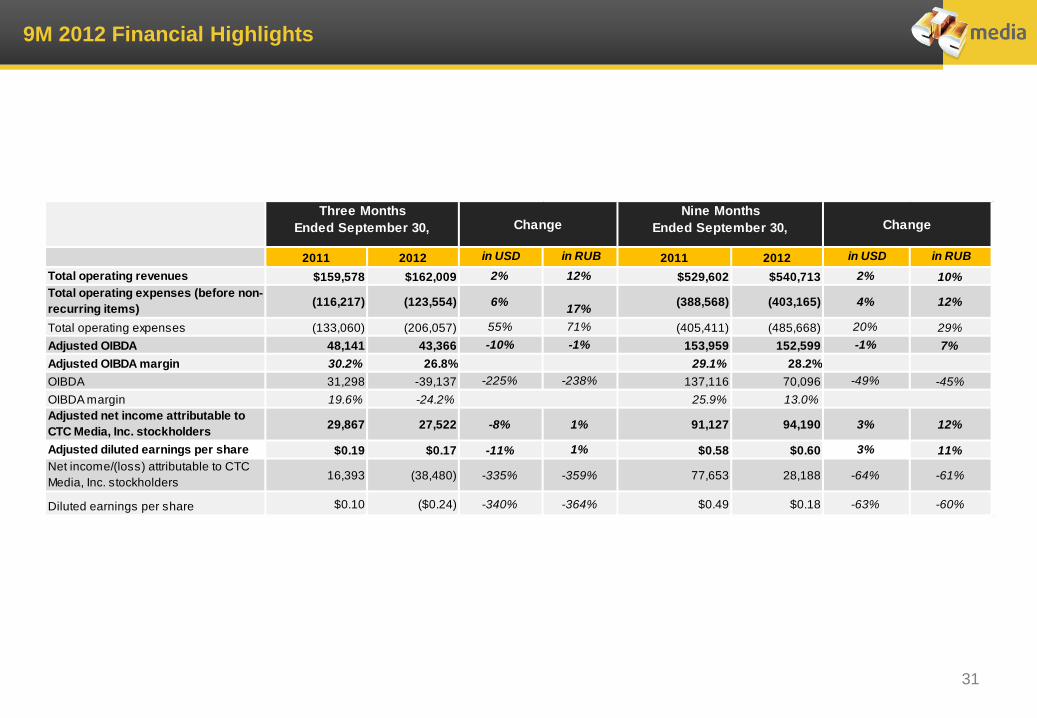
9M 2012 Financial Highlights
2011 2012 in USD in RUB 2011 2012 in USD in RUB
Total operating revenues $159,578 $162,009 2% 12% $529,602 $540,713 2% 10%
Total operating expenses (before non-
recurring items)(116,217) (123,554) 6%
17%(388,568) (403,165) 4% 12%
Total operating expenses (133,060) (206,057) 55% 71% (405,411) (485,668) 20% 29%
Adjusted OIBDA 48,141 43,366 -10% -1% 153,959 152,599 -1% 7%
Adjusted OIBDA margin 30.2% 26.8% 29.1% 28.2%
OIBDA 31,298 -39,137 -225% -238% 137,116 70,096 -49% -45%
OIBDA margin 19.6% -24.2% 25.9% 13.0%
Adjusted net income attributable to
CTC Media, Inc. stockholders29,867 27,522 -8% 1% 91,127 94,190 3% 12%
Adjusted diluted earnings per share $0.19 $0.17 -11% 1% $0.58 $0.60 3% 11%
Net income/(loss) attributable to CTC
Media, Inc. stockholders16,393 (38,480) -335% -359% 77,653 28,188 -64% -61%
Diluted earnings per share $0.10 ($0.24) -340% -364% $0.49 $0.18 -63% -60%
Nine Months
Ended September 30, ChangeThree Months
Ended September 30, Change
32
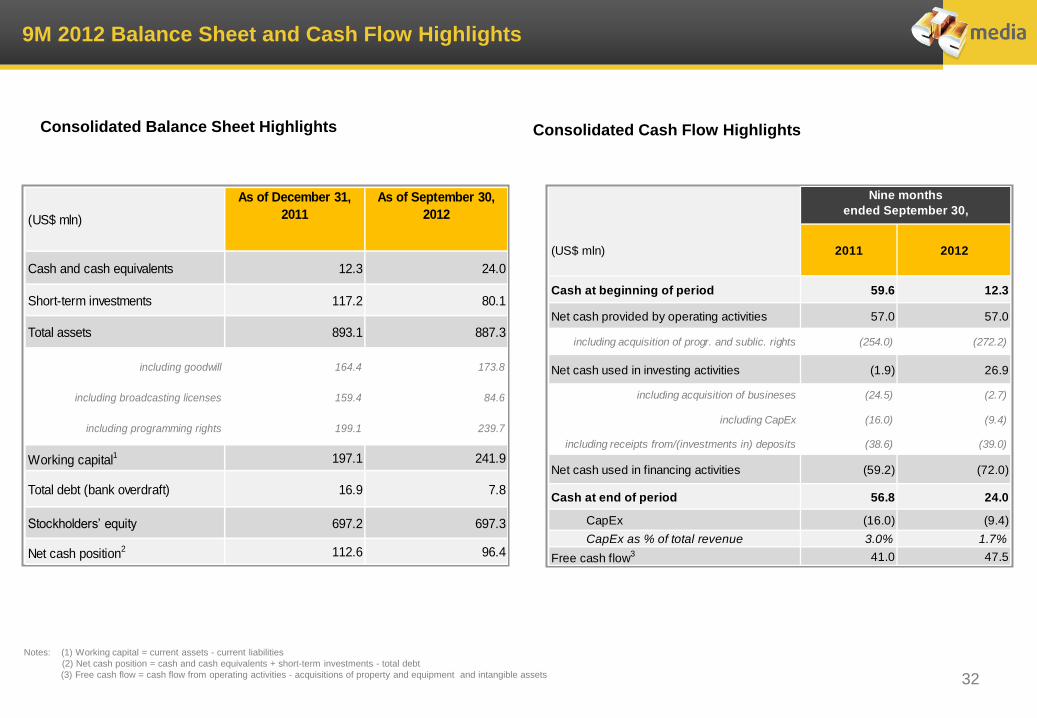
9M 2012 Balance Sheet and Cash Flow Highlights
32
Consolidated Balance Sheet Highlights Consolidated Cash Flow Highlights
(US$ mln)
As of December 31,
2011
As of September 30,
2012
Cash and cash equivalents 12.3 24.0
Short-term investments 117.2 80.1
Total assets 893.1 887.3
including goodwill 164.4 173.8
including broadcasting licenses 159.4 84.6
including programming rights 199.1 239.7
Working capital1 197.1 241.9
Total debt (bank overdraft) 16.9 7.8
Stockholders’ equity 697.2 697.3
Net cash position2 112.6 96.4
Notes: (1) Working capital = current assets - current liabilities
(2) Net cash position = cash and cash equivalents + short-term investments - total debt
(3) Free cash flow = cash flow from operating activities - acquisitions of property and equipment and intangible assets
(US$ mln) 2011 2012
Cash at beginning of period 59.6 12.3
Net cash provided by operating activities 57.0 57.0
including acquisition of progr. and sublic. rights (254.0) (272.2)
Net cash used in investing activities (1.9) 26.9
including acquisition of busineses (24.5) (2.7)
including CapEx (16.0) (9.4)
including receipts from/(investments in) deposits (38.6) (39.0)
Net cash used in financing activities (59.2) (72.0)
Cash at end of period 56.8 24.0
CapEx (16.0) (9.4)
CapEx as % of total revenue 3.0% 1.7%
Free cash flow3 41.0 47.5
Nine months
ended September 30,
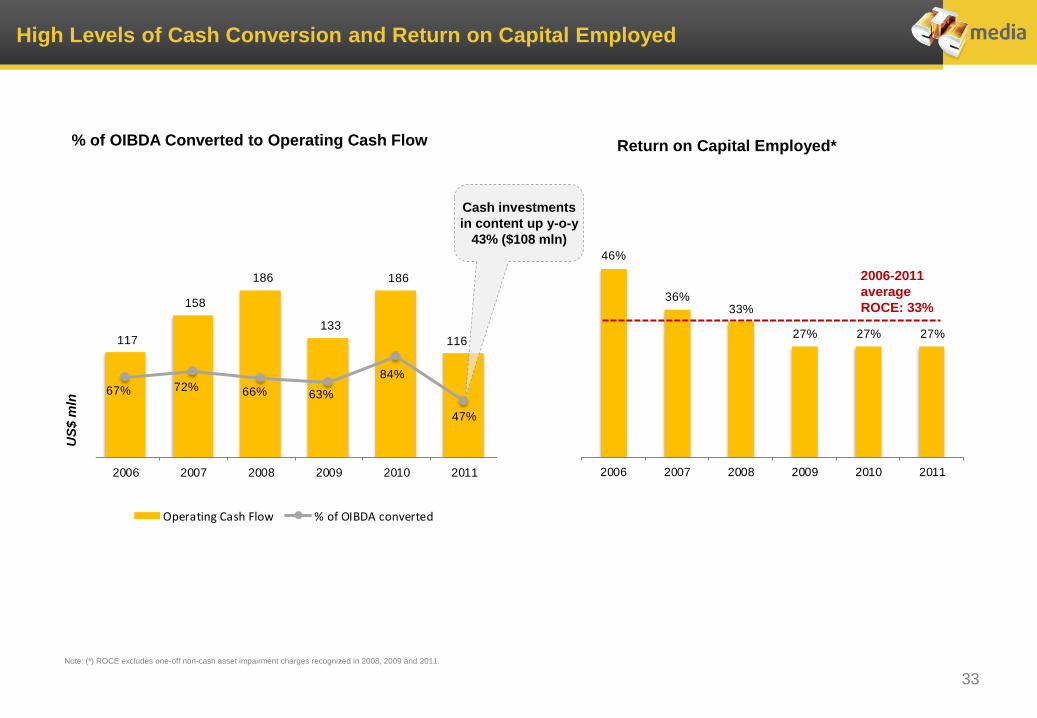
117
158
186
133
186
116
67% 72% 66% 63%
84%
47%
0
20
40
60
80
100
120
140
160
180
200
2006 2007 2008 2009 2010 2011
Operating Cash Flow % of OIBDA converted
Cash investments
in content up y-o-y
43% ($108 mln)
46%
36%33%
27% 27% 27%
2006 2007 2008 2009 2010 2011
33
High Levels of Cash Conversion and Return on Capital Employed
2006-2011
average
ROCE: 33%
% of OIBDA Converted to Operating Cash Flow Return on Capital Employed*
Note: (*) ROCE excludes one-off non-cash asset impairment charges recognized in 2008, 2009 and 2011.
US
$ m
ln
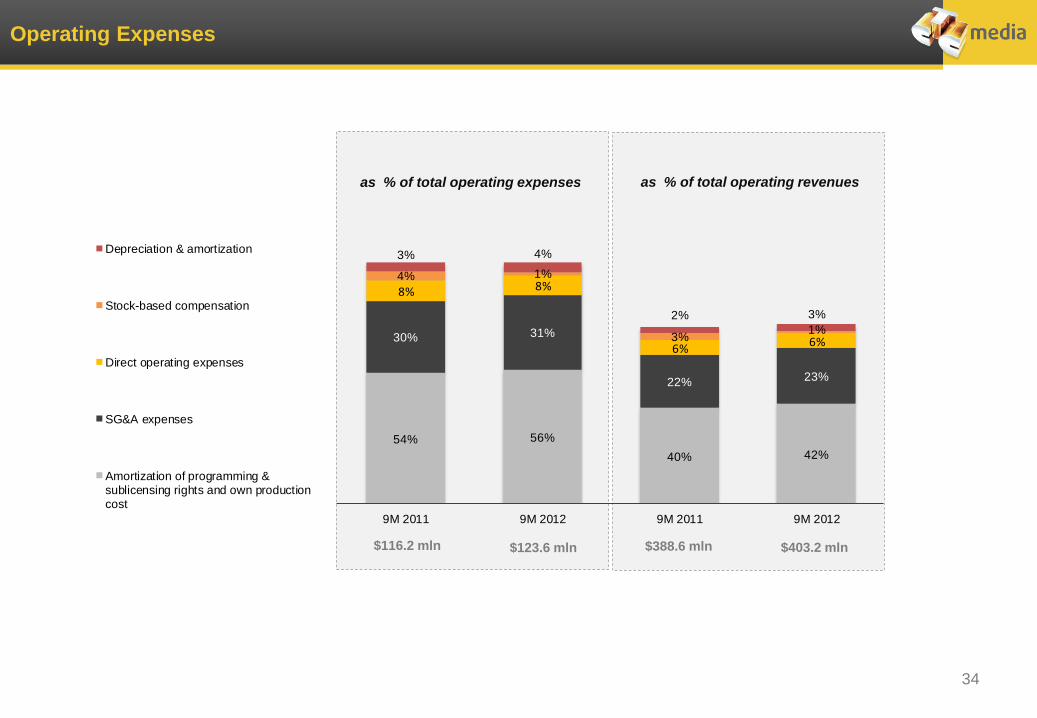
54% 56%
40% 42%
30% 31%
22% 23%
8% 8%
6%6%
4% 1%
3%1%
3% 4%
2% 3%
9M 2011 9M 2012 9M 2011 9M 2012
Depreciation & amortization
Stock-based compensation
Direct operating expenses
SG&A expenses
Amortization of programming &sublicensing rights and own productioncost
34
Operating Expenses
as % of total operating expenses as % of total operating revenues
$116.2 mln $123.6 mln $403.2 mln $388.6 mln

To Conclude…
35

36
Appendix
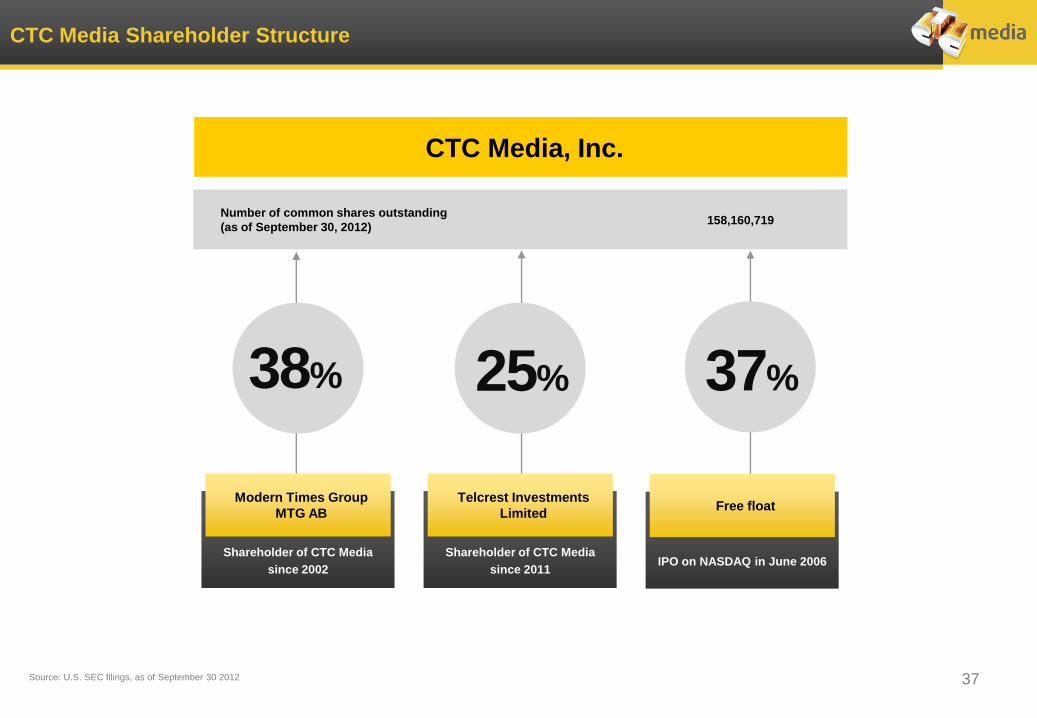
CTC Media Shareholder Structure
37
CTC Media, Inc.
Shareholder of CTC Media
since 2002
Modern Times Group
MTG AB
38%
Number of common shares outstanding
(as of September 30, 2012)
Shareholder of CTC Media
since 2011
Telcrest Investments
Limited
25%
IPO on NASDAQ in June 2006
Free float
37%
Source: U.S. SEC filings, as of September 30 2012
158,160,719
12.6
15.5
12.1
11.2
10.4
4.5
1.91.4
2.41.9 1.9
2.21.9 2.1
1.51.3 1.2
0.9 0.9
0.1
15.8
13.2
11.811.1
10.6
9.0
5.2
3.73.3
2.8 2.72.2 2.3
1.8 1.6 1.5 1.41.2 0.8
0.7
0.1
15.8
TNT ChannelOne
CTC NTV Rossiya 1 Ren-TV Channel 5 Disney* TV-3 Peretz Domashny Rossiya 2 U** TV Center 2x2 MTV Zvezda Rossiya K Rossiya24
Euronews Other
9M 2011
9M 2012
38
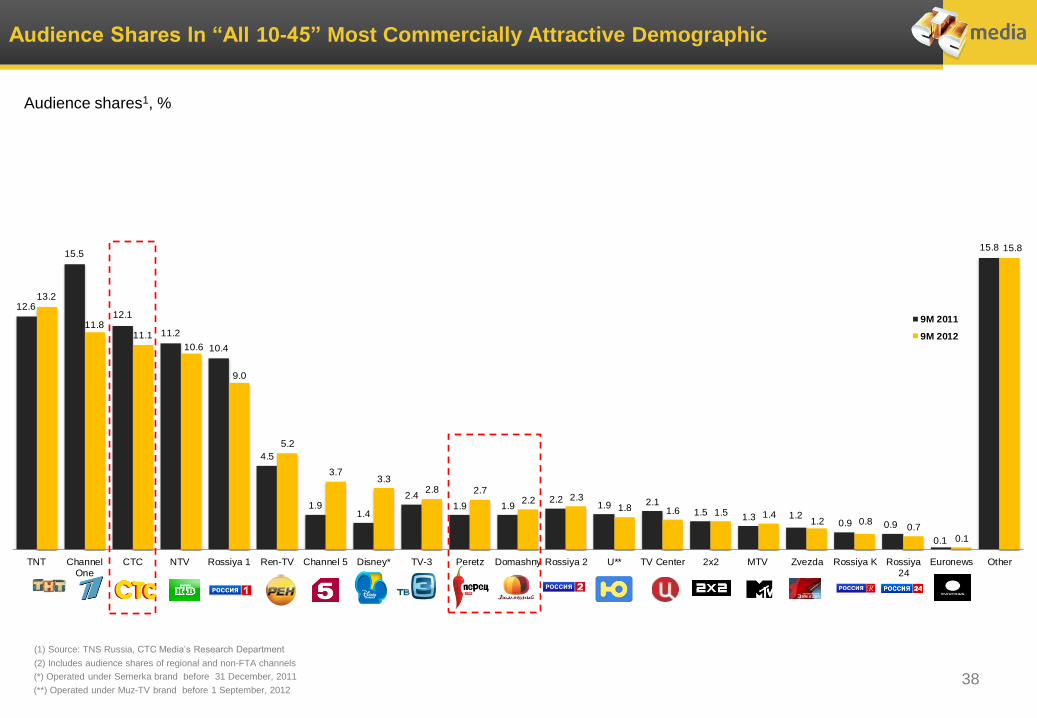
Audience Shares In “All 10-45” Most Commercially Attractive Demographic
Audience shares1, %
(1) Source: TNS Russia, CTC Media’s Research Department
(2) Includes audience shares of regional and non-FTA channels
(*) Operated under Semerka brand before 31 December, 2011
(**) Operated under Muz-TV brand before 1 September, 2012
39
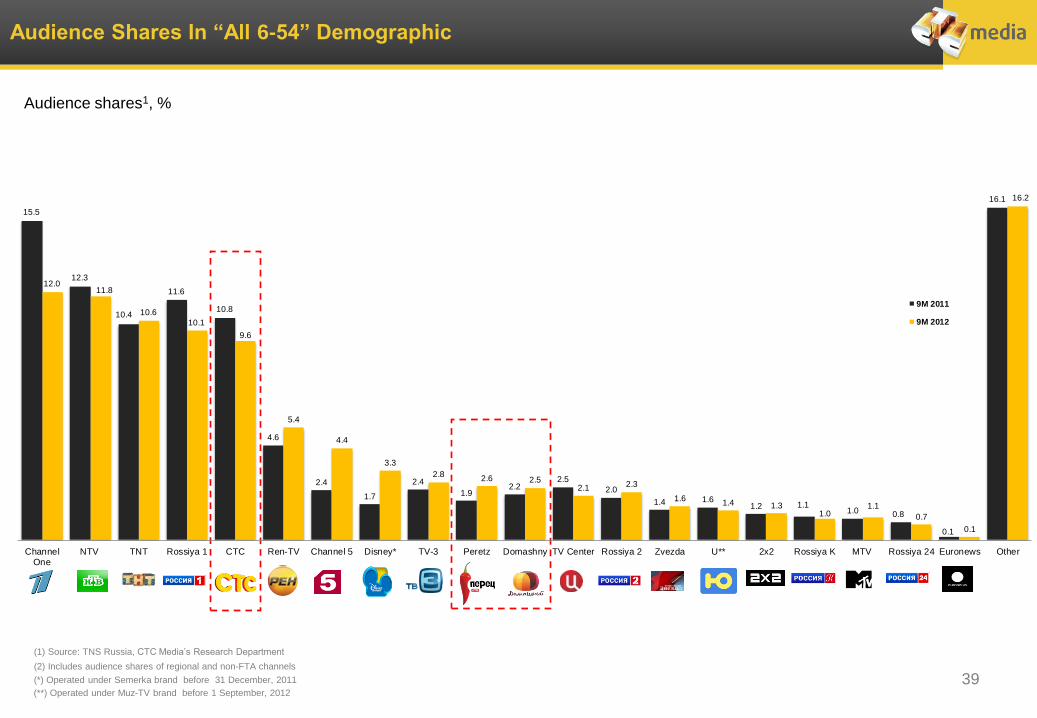
Audience Shares In “All 6-54” Demographic
(1) Source: TNS Russia, CTC Media’s Research Department
(2) Includes audience shares of regional and non-FTA channels
Audience shares1, %
(*) Operated under Semerka brand before 31 December, 2011
(**) Operated under Muz-TV brand before 1 September, 2012
15.5
12.3
10.4
11.6
10.8
4.6
2.4
1.7
2.4
1.92.2
2.5
2.0
1.4 1.61.2 1.1
1.0 0.8
0.1
16.1
12.011.8
10.6
10.1
9.6
5.4
4.4
3.3
2.82.6 2.5
2.1 2.3
1.61.4 1.3
1.01.1
0.7
0.1
16.2
ChannelOne
NTV TNT Rossiya 1 CTC Ren-TV Channel 5 Disney* TV-3 Peretz Domashny TV Center Rossiya 2 Zvezda U** 2x2 Rossiya K MTV Rossiya 24 Euronews Other
9M 2011
9M 2012
14.4
17.1
15.7
7.6 7.7
4.4
2.72.3
2.9
2.01.7
2.01.7 1.6 1.7
1.10.9 0.8 0.7
0.2
14.314.3
13.8
13.3
7.8
6.9
5.25.0
2.7 2.6 2.5 2.4 2.42.1
1.8 1.7
1.0 0.9 0.8 0.7
0.1
15.2
NTV ChannelOne
Rossiya 1 TNT CTC Ren-Tv Channel 5 Domashny TV Center TV-3 Disney* Rossiya 2 Peretz Zvezda Rossiya K U** Rossiya 24 2x2 MTV Euronews Other
40
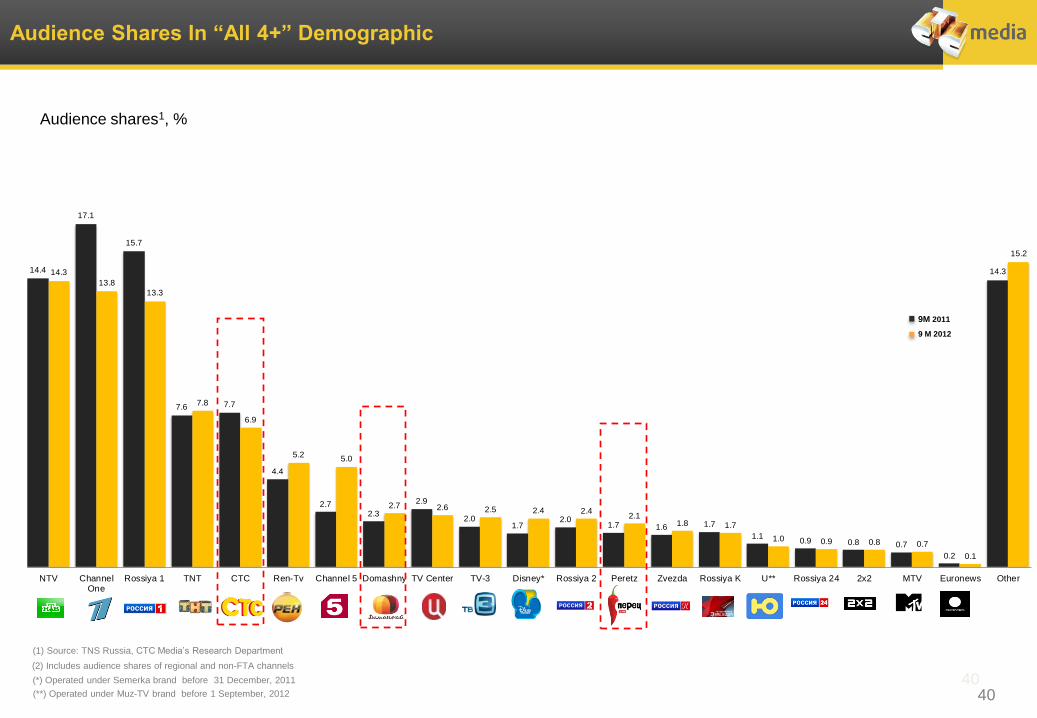
Audience Shares In “All 4+” Demographic
(1) Source: TNS Russia, CTC Media’s Research Department
(2) Includes audience shares of regional and non-FTA channels
Audience shares1, %
(*) Operated under Semerka brand before 31 December, 2011
9M 2011
9 M 2012
40 (**) Operated under Muz-TV brand before 1 September, 2012
87%
65%
54%
88%
71%
61%
91%
76%
68%
94%
82%
73%
95%
85%80%
41
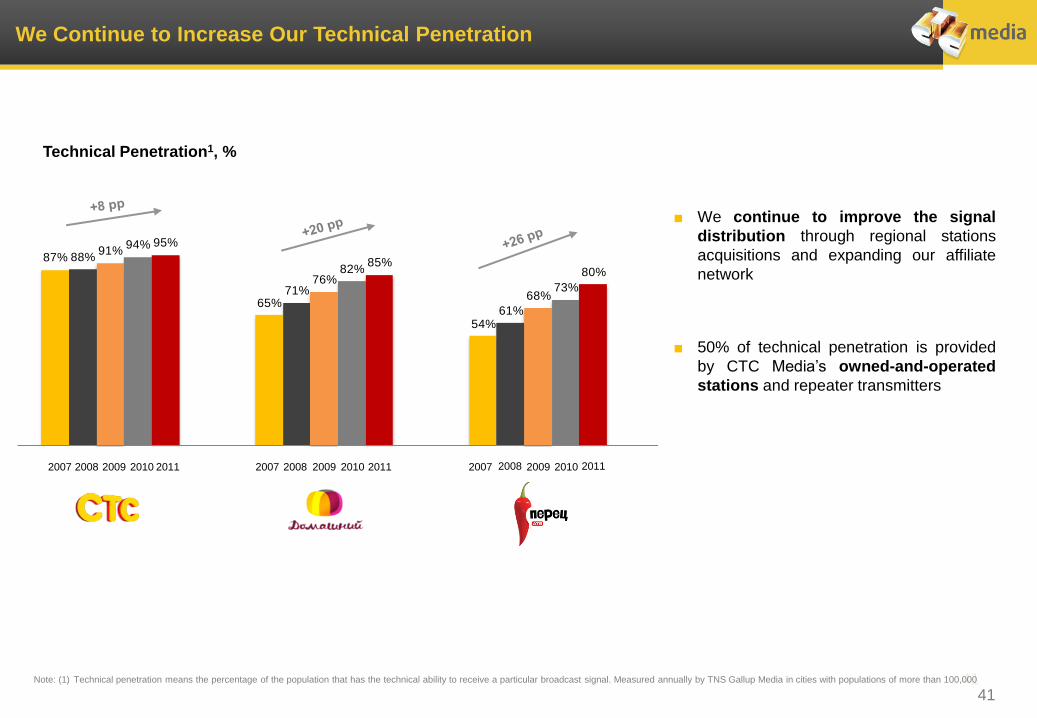
We Continue to Increase Our Technical Penetration
Note: (1) Technical penetration means the percentage of the population that has the technical ability to receive a particular broadcast signal. Measured annually by TNS Gallup Media in cities with populations of more than 100,000
Technical Penetration1, %
■ We continue to improve the signal
distribution through regional stations
acquisitions and expanding our affiliate
network
■ 50% of technical penetration is provided
by CTC Media’s owned-and-operated
stations and repeater transmitters
2007 2008 2009 2010 2011 2007 2008 2009 2010 2011 2007 2008 2009 2010 2011
41
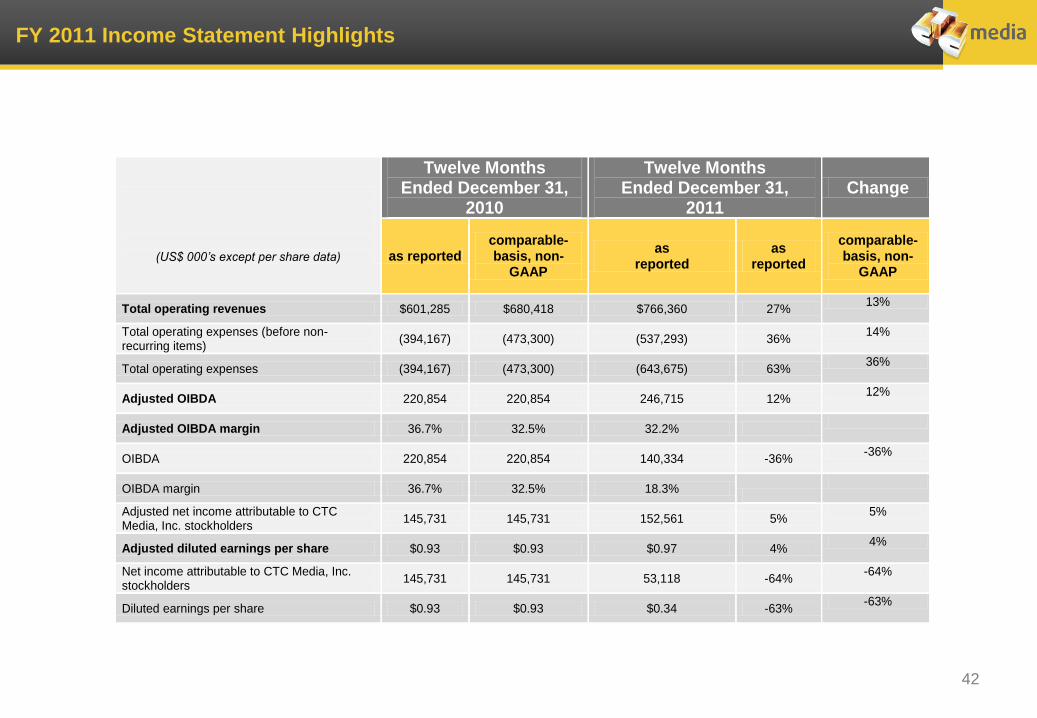
FY 2011 Income Statement Highlights
42
(US$ 000’s except per share data)
Twelve Months Ended December 31,
2010
Twelve Months Ended December 31,
2011 Change
as reported comparable-basis, non-
GAAP
as reported
as reported
comparable-basis, non-
GAAP
Total operating revenues $601,285 $680,418 $766,360 27% 13%
Total operating expenses (before non-recurring items)
(394,167) (473,300) (537,293) 36% 14%
Total operating expenses (394,167) (473,300) (643,675) 63% 36%
Adjusted OIBDA 220,854 220,854 246,715 12% 12%
Adjusted OIBDA margin 36.7% 32.5% 32.2%
OIBDA 220,854 220,854 140,334 -36% -36%
OIBDA margin 36.7% 32.5% 18.3%
Adjusted net income attributable to CTC Media, Inc. stockholders
145,731 145,731 152,561 5% 5%
Adjusted diluted earnings per share $0.93 $0.93 $0.97 4% 4%
Net income attributable to CTC Media, Inc. stockholders
145,731 145,731 53,118 -64% -64%
Diluted earnings per share $0.93 $0.93 $0.34 -63% -63%
43
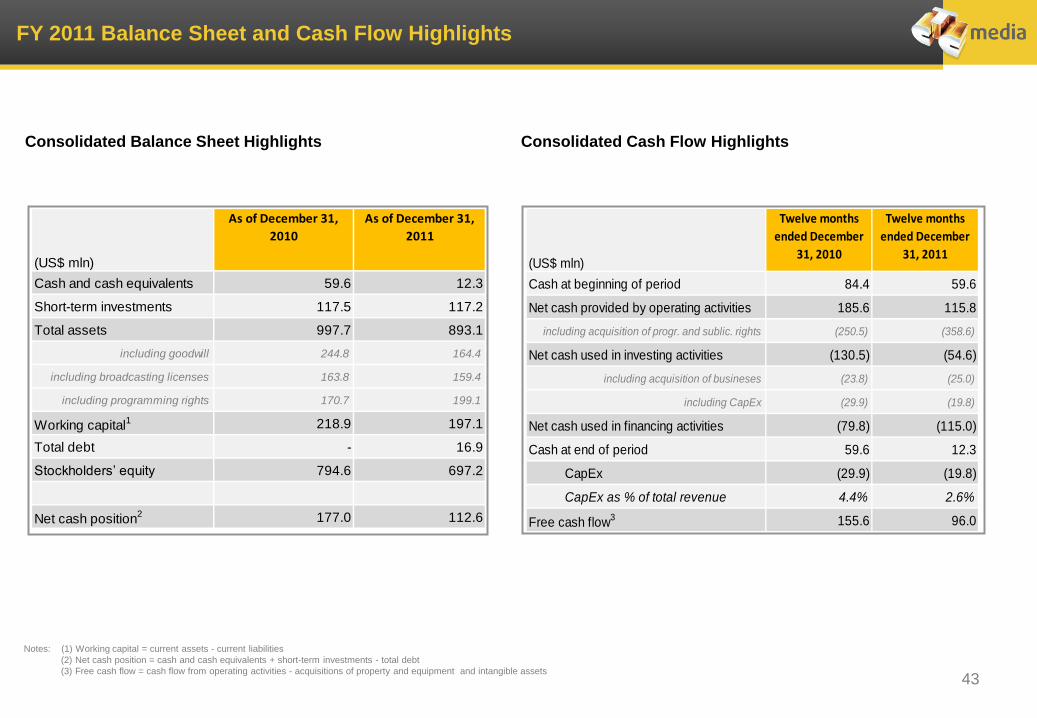
FY 2011 Balance Sheet and Cash Flow Highlights
Consolidated Balance Sheet Highlights Consolidated Cash Flow Highlights
Notes: (1) Working capital = current assets - current liabilities
(2) Net cash position = cash and cash equivalents + short-term investments - total debt
(3) Free cash flow = cash flow from operating activities - acquisitions of property and equipment and intangible assets
(US$ mln)
As of December 31,
2010
As of December 31,
2011
Cash and cash equivalents 59.6 12.3
Short-term investments 117.5 117.2
Total assets 997.7 893.1
including goodwill 244.8 164.4
including broadcasting licenses 163.8 159.4
including programming rights 170.7 199.1
Working capital1 218.9 197.1
Total debt - 16.9
Stockholders’ equity 794.6 697.2
Net cash position2 177.0 112.6
(US$ mln)
Twelve months
ended December
31, 2010
Twelve months
ended December
31, 2011
Cash at beginning of period 84.4 59.6
Net cash provided by operating activities 185.6 115.8
including acquisition of progr. and sublic. rights (250.5) (358.6)
Net cash used in investing activities (130.5) (54.6)
including acquisition of busineses (23.8) (25.0)
including CapEx (29.9) (19.8)
Net cash used in financing activities (79.8) (115.0)
Cash at end of period 59.6 12.3
CapEx (29.9) (19.8)
CapEx as % of total revenue 4.4% 2.6%
Free cash flow3 155.6 96.0
44
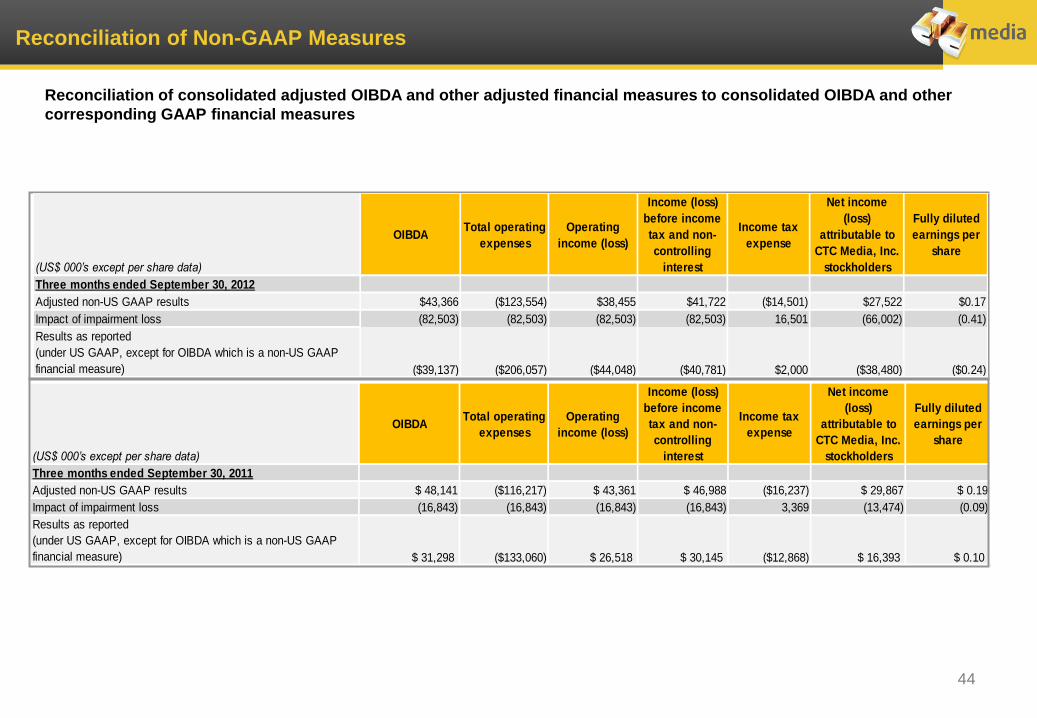
Reconciliation of Non-GAAP Measures
Reconciliation of consolidated adjusted OIBDA and other adjusted financial measures to consolidated OIBDA and other
corresponding GAAP financial measures
(US$ 000’s except per share data)
OIBDATotal operating
expenses
Operating
income (loss)
Income (loss)
before income
tax and non-
controlling
interest
Income tax
expense
Net income
(loss)
attributable to
CTC Media, Inc.
stockholders
Fully diluted
earnings per
share
Three months ended September 30, 2012
Adjusted non-US GAAP results $43,366 ($123,554) $38,455 $41,722 ($14,501) $27,522 $0.17
Impact of impairment loss (82,503) (82,503) (82,503) (82,503) 16,501 (66,002) (0.41)
Results as reported
(under US GAAP, except for OIBDA which is a non-US GAAP
financial measure) ($39,137) ($206,057) ($44,048) ($40,781) $2,000 ($38,480) ($0.24)
(US$ 000’s except per share data)
OIBDATotal operating
expenses
Operating
income (loss)
Income (loss)
before income
tax and non-
controlling
interest
Income tax
expense
Net income
(loss)
attributable to
CTC Media, Inc.
stockholders
Fully diluted
earnings per
share
Three months ended September 30, 2011
Adjusted non-US GAAP results $ 48,141 ($116,217) $ 43,361 $ 46,988 ($16,237) $ 29,867 $ 0.19
Impact of impairment loss (16,843) (16,843) (16,843) (16,843) 3,369 (13,474) (0.09)
Results as reported
(under US GAAP, except for OIBDA which is a non-US GAAP
financial measure) $ 0.10 $ 31,298 ($133,060) $ 26,518 $ 30,145 ($12,868) $ 16,393
45
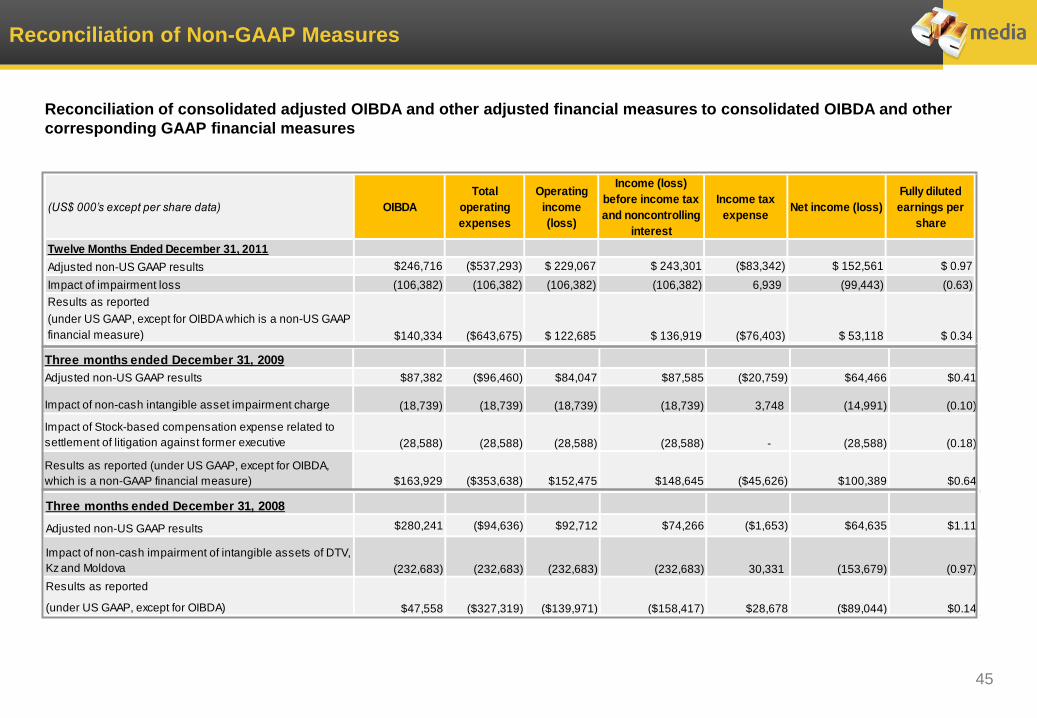
Reconciliation of Non-GAAP Measures
Reconciliation of consolidated adjusted OIBDA and other adjusted financial measures to consolidated OIBDA and other
corresponding GAAP financial measures
(US$ 000’s except per share data) OIBDA
Total
operating
expenses
Operating
income
(loss)
Income (loss)
before income tax
and noncontrolling
interest
Income tax
expenseNet income (loss)
Fully diluted
earnings per
share
Twelve Months Ended December 31, 2011
Adjusted non-US GAAP results $246,716 ($537,293) $ 229,067 $ 243,301 ($83,342) $ 152,561 $ 0.97
Impact of impairment loss (106,382) (106,382) (106,382) (106,382) 6,939 (99,443) (0.63)
Results as reported
(under US GAAP, except for OIBDA which is a non-US GAAP
financial measure) $ 0.34 $140,334 ($643,675) $ 122,685 $ 136,919 ($76,403) $ 53,118
Three months ended December 31, 2009
Adjusted non-US GAAP results $87,382 ($96,460) $84,047 $87,585 ($20,759) $64,466 $0.41
Impact of non-cash intangible asset impairment charge (18,739) (18,739) (18,739) (18,739) 3,748 (14,991) (0.10)
Impact of Stock-based compensation expense related to
settlement of litigation against former executive (28,588) (28,588) (28,588) (28,588) - (28,588) (0.18)
Results as reported (under US GAAP, except for OIBDA,
which is a non-GAAP financial measure) $163,929 ($353,638) $152,475 $148,645 ($45,626) $100,389 $0.64
Three months ended December 31, 2008
Adjusted non-US GAAP results $280,241 ($94,636) $92,712 $74,266 ($1,653) $64,635 $1.11
Impact of non-cash impairment of intangible assets of DTV,
Kz and Moldova (232,683) (232,683) (232,683) (232,683) 30,331 (153,679) (0.97)
Results as reported
(under US GAAP, except for OIBDA) $28,678 ($89,044) $0.14 $47,558 ($327,319) ($139,971) ($158,417)
46
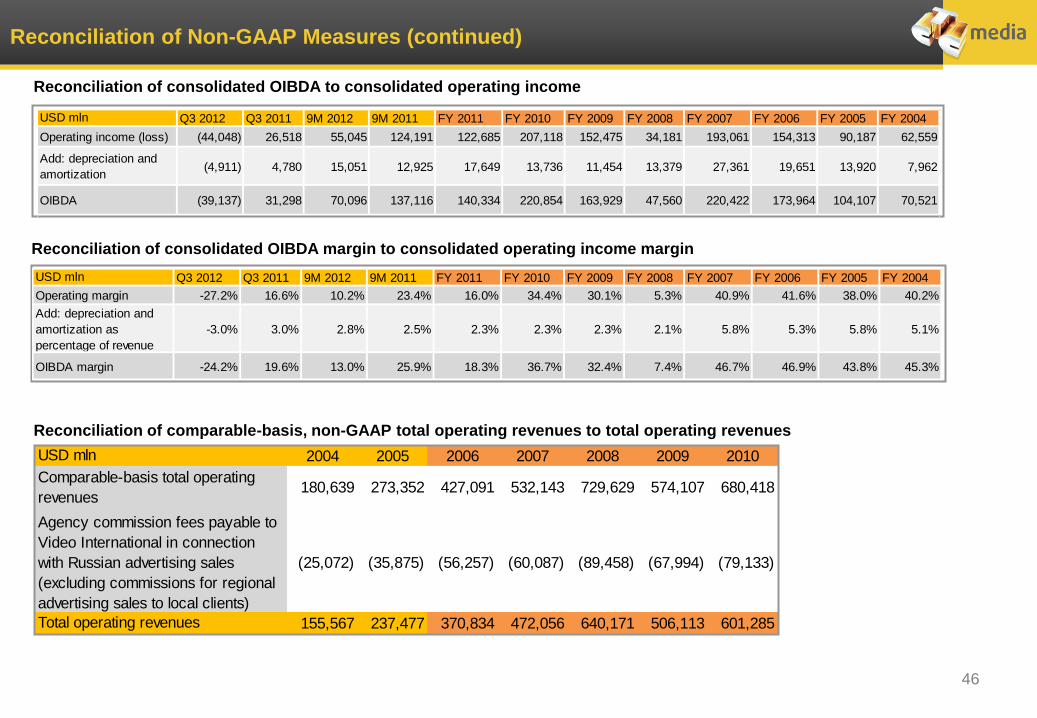
Reconciliation of Non-GAAP Measures (continued)
Reconciliation of consolidated OIBDA margin to consolidated operating income margin
USD mln 2004 2005 2006 2007 2008 2009 2010
Comparable-basis total operating
revenues180,639 273,352 427,091 532,143 729,629 574,107 680,418
Agency commission fees payable to
Video International in connection
with Russian advertising sales
(excluding commissions for regional
advertising sales to local clients)
(25,072) (35,875) (56,257) (60,087) (89,458) (67,994) (79,133)
Total operating revenues 155,567 237,477 370,834 472,056 640,171 506,113 601,285
USD mln Q3 2012 Q3 2011 9M 2012 9M 2011 FY 2011 FY 2010 FY 2009 FY 2008 FY 2007 FY 2006 FY 2005 FY 2004
Operating income (loss) (44,048) 26,518 55,045 124,191 122,685 207,118 152,475 34,181 193,061 154,313 90,187 62,559
Add: depreciation and
amortization(4,911) 4,780 15,051 12,925 17,649 13,736 11,454 13,379 27,361 19,651 13,920 7,962
OIBDA (39,137) 31,298 70,096 137,116 140,334 220,854 163,929 47,560 220,422 173,964 104,107 70,521
USD mln Q3 2012 Q3 2011 9M 2012 9M 2011 FY 2011 FY 2010 FY 2009 FY 2008 FY 2007 FY 2006 FY 2005 FY 2004
Operating margin -27.2% 16.6% 10.2% 23.4% 16.0% 34.4% 30.1% 5.3% 40.9% 41.6% 38.0% 40.2%
Add: depreciation and
amortization as
percentage of revenue
-3.0% 3.0% 2.8% 2.5% 2.3% 2.3% 2.3% 2.1% 5.8% 5.3% 5.8% 5.1%
OIBDA margin -24.2% 19.6% 13.0% 25.9% 18.3% 36.7% 32.4% 7.4% 46.7% 46.9% 43.8% 45.3%
Reconciliation of consolidated OIBDA to consolidated operating income
Reconciliation of comparable-basis, non-GAAP total operating revenues to total operating revenues
47
Contact Information and Disclaimer
For further information please visit www.ctcmedia.ru or contact:
Ekaterina Ostrova
Director, Corporate Communications and Investor Relations
Tel: +7 (495) 783 3650
Irina Klimova
Senior Manager, Investor Relations E-mail: [email protected]
Tel: +7 (495) 981 0740
DISCLAIMER
The information contained in this presentation, including market data that are attributed to specific sources and have not been independently verified. No representation,
warranty or undertaking, express or implied, is made as to, and no reliance should be placed on, the fairness, accuracy, completeness or correctness of the information or
the opinions contained herein. None of the Company or any of its affiliates, advisors or representatives shall have any liability whatsoever (in negligence or otherwise) for
any loss howsoever arising from any use of this presentation or its contents or otherwise arising in connection with the presentation.
The presentation is not an offer of securities for sale in the United States. Neither the presentation nor any copy of it may be taken or transmitted into or distributed in the
United States of America or to any U.S. person within the meaning of Regulation S under the United States Securities Act of 1933, as amended (the “Securities Act”).
This presentation is not a public offer or advertisement of securities in the Russian Federation, and is not an offer, or an invitation to make offers, to purchase any
securities in the Russian Federation.
Certain statements in this presentation that are not based on historical information are "forward-looking statements" within the meaning of the Private Securities Litigation
Reform Act of 1995. Such forward-looking statements include, among others, statement regarding Russian advertising market growth; advertising expenditures in different
segments in Russia, increase of time spent online in Russia, availability of Company’s content on new platforms and others. These statements reflect the Company's
current expectations concerning future results and events. These forward-looking statements involve known and unknown risks, uncertainties and other factors which may
cause the actual results, performance or achievements of CTC Media to be materially different from any future results, performance or achievements expressed or implied
by such forward-looking statements. The potential risks and uncertainties that could cause actual future results to differ from those expressed by forward-looking statements
include, among others, changes in the size of the Russian television advertising market; the continued successful operation of the Company’s own internal sales house
structure; depreciation of the value of the Russian ruble compared to the US dollar; the Company’s ability to deliver audience share, particularly in primetime, to its
advertisers; free-to-air television remaining a significant advertising forum in Russia; and restrictions on foreign involvement in the Russian television business. These and
other risks are described in the "Risk Factors" section of CTC Media's annual report on Form 10-K filed with the SEC on February 28, 2012 and our recently report on Form
10-Q filed with the SEC on August 7, 2012. Other unknown or unpredictable factors could have material adverse effects on CTC Media's future results, performance or
achievements. In light of these risks, uncertainties, assumptions and factors, the forward-looking events discussed herein may not occur. You are cautioned not to place
undue reliance on these forward-looking statements. CTC Media does not undertake any obligation to publicly update or revise any forward-looking statements because of
new information, future events or otherwise.
Recommended