CULTURE AS A
COMPLEX SYSTEM
NTU July, 2015
GRAHAM SACK
COLUMBIA UNIVERSITY
PHD CANDIDATE, DIGITAL HUMANITIES
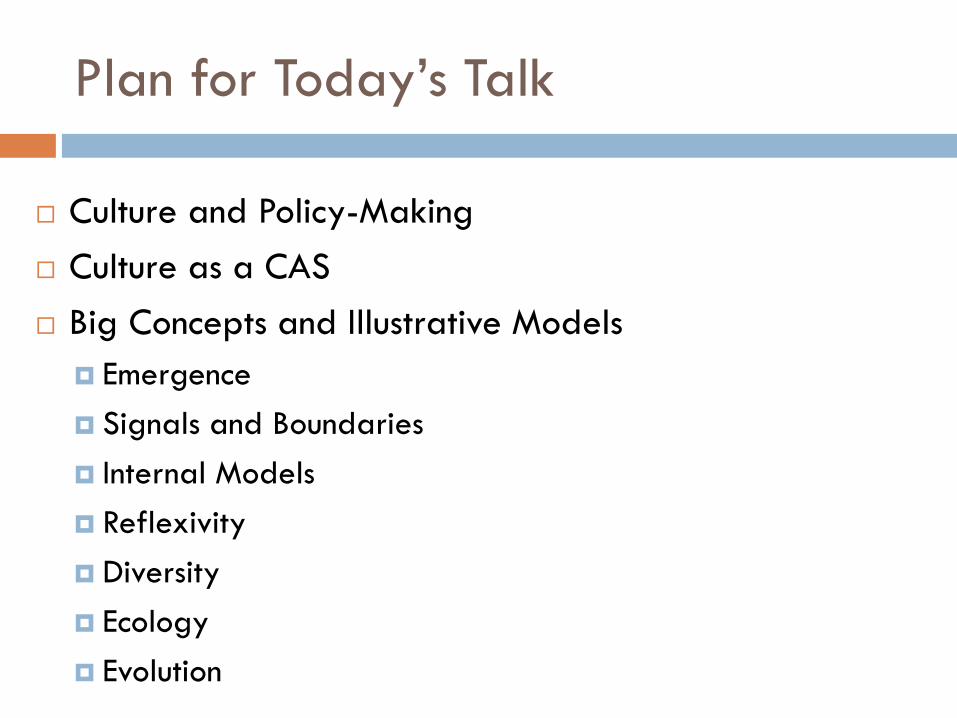
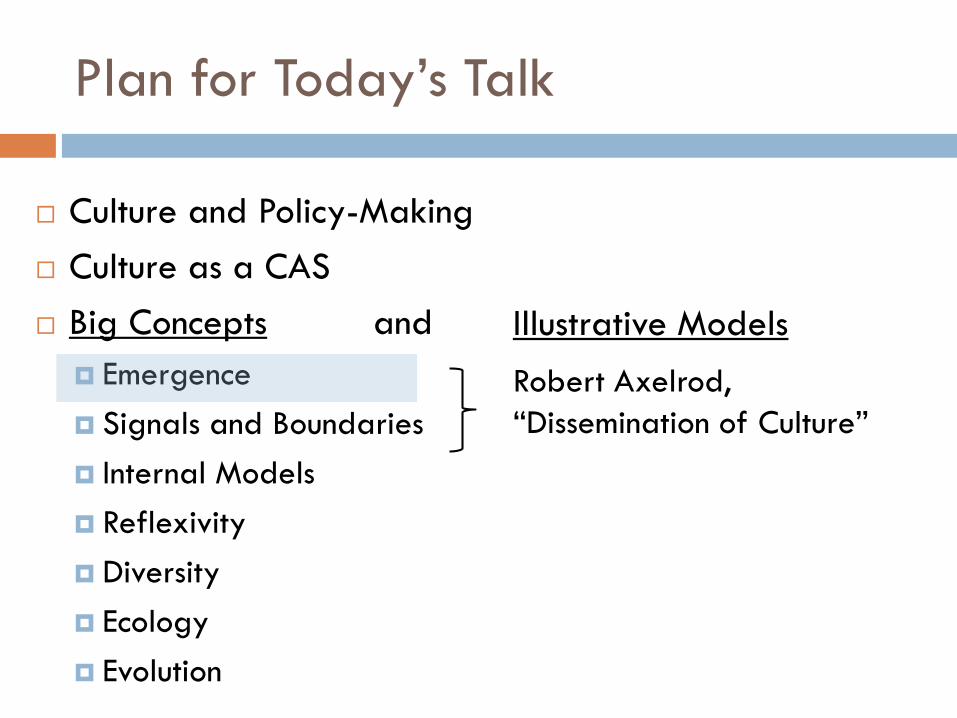
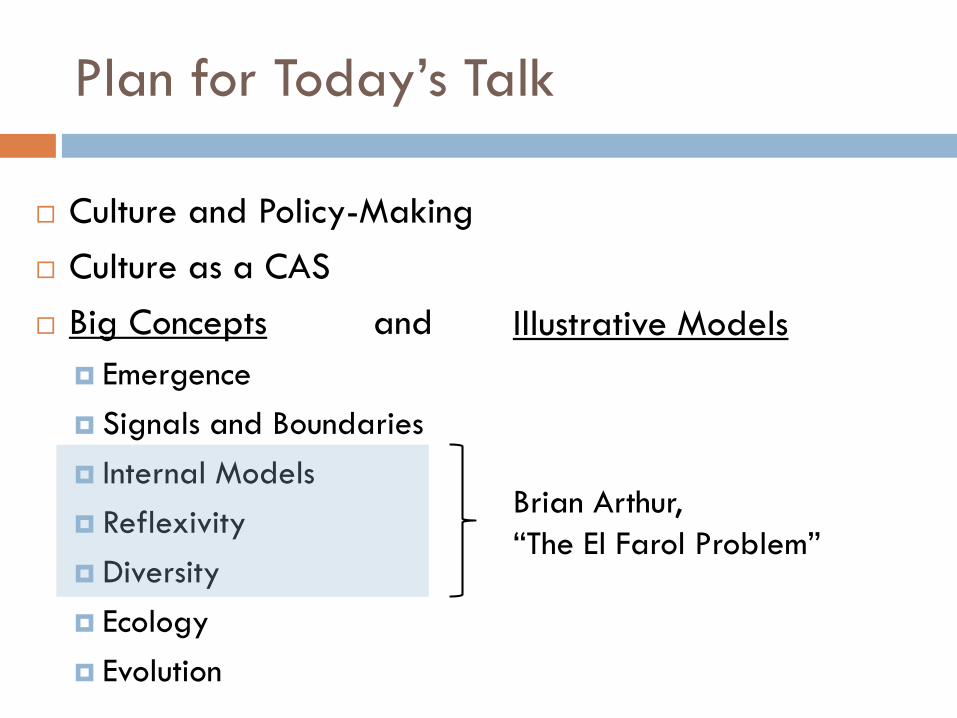
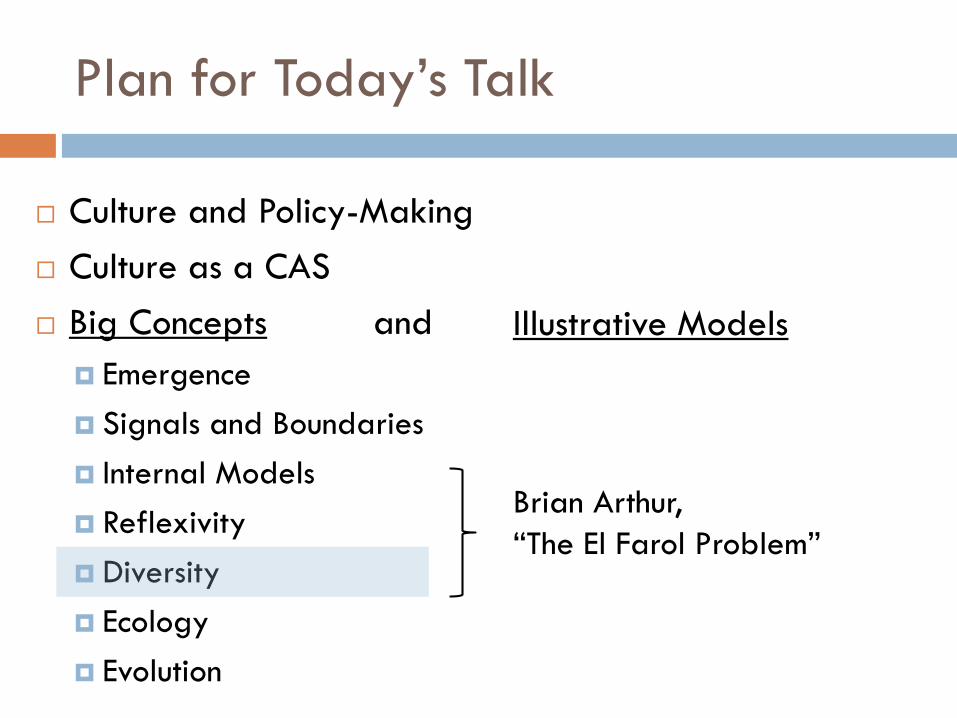
Plan for Today’s Talk
Culture and Policy-Making
Culture as a CAS
Big Concepts and Illustrative Models
Emergence
Signals and Boundaries
Internal Models
Reflexivity
Diversity
Ecology
Evolution
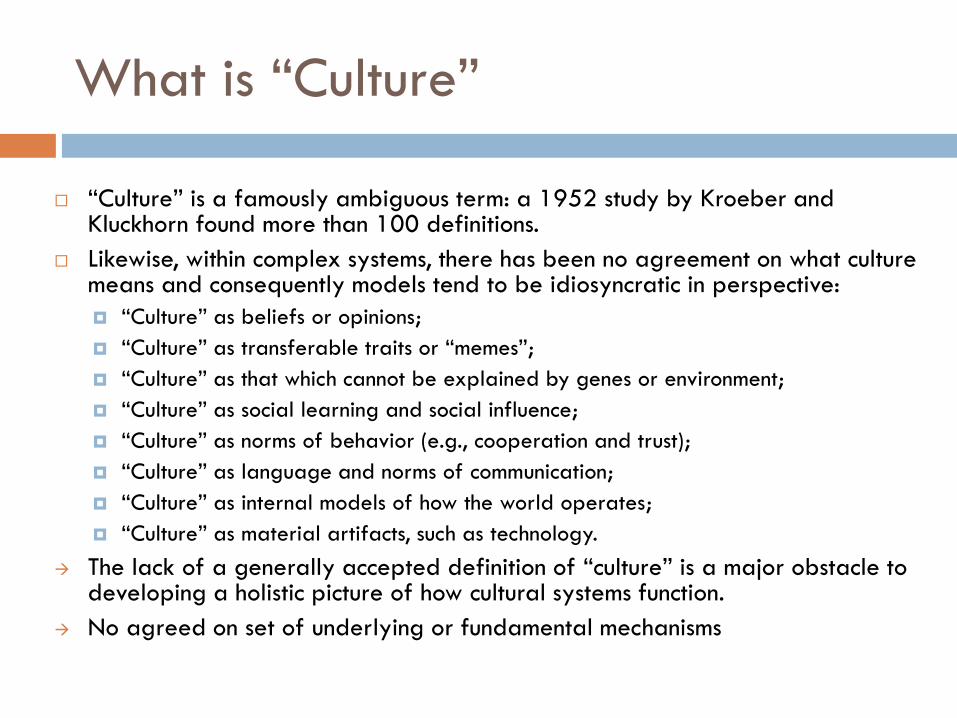
What is “Culture”
“Culture” is a famously ambiguous term: a 1952 study by Kroeber and Kluckhorn found more than 100 definitions.
Likewise, within complex systems, there has been no agreement on what culture means and consequently models tend to be idiosyncratic in perspective:
“Culture” as beliefs or opinions;
“Culture” as transferable traits or “memes”;
“Culture” as that which cannot be explained by genes or environment;
“Culture” as social learning and social influence;
“Culture” as norms of behavior (e.g., cooperation and trust);
“Culture” as language and norms of communication;
“Culture” as internal models of how the world operates;
“Culture” as material artifacts, such as technology.
The lack of a generally accepted definition of “culture” is a major obstacle to developing a holistic picture of how cultural systems function.
No agreed on set of underlying or fundamental mechanisms
Explanandum: World Values Survey
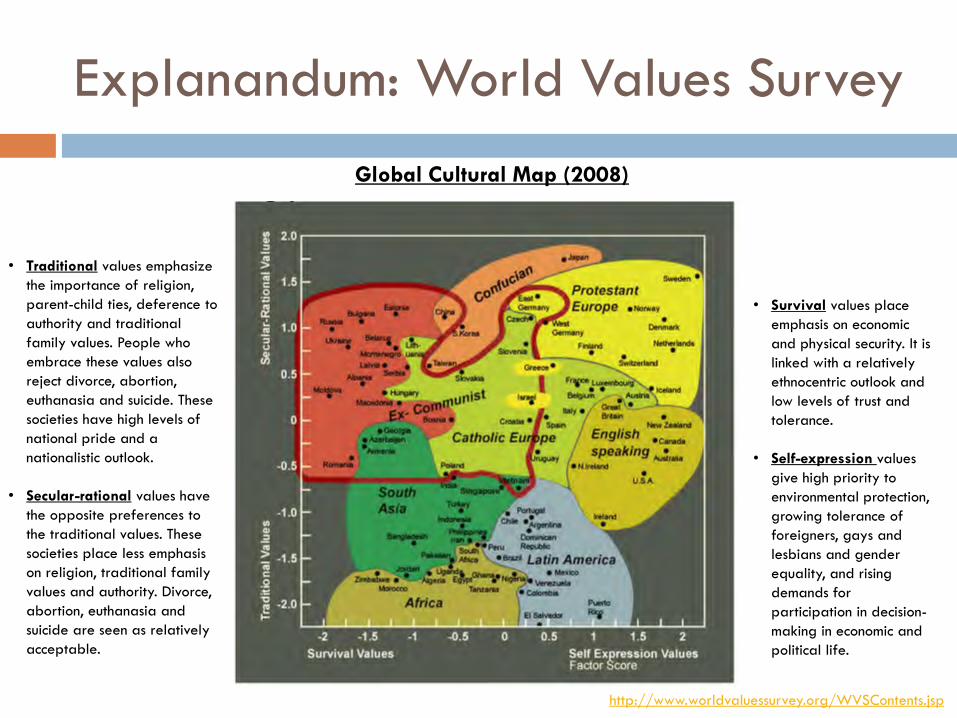
Global Cultural Map (2008)
• Survival values place
emphasis on economic
and physical security. It is
linked with a relatively
ethnocentric outlook and
low levels of trust and
tolerance.
• Self-expression values
give high priority to
environmental protection,
growing tolerance of
foreigners, gays and
lesbians and gender
equality, and rising
demands for
participation in decision-
making in economic and
political life.
http://www.worldvaluessurvey.org/WVSContents.jsp
• Traditional values emphasize
the importance of religion,
parent-child ties, deference to
authority and traditional
family values. People who
embrace these values also
reject divorce, abortion,
euthanasia and suicide. These
societies have high levels of
national pride and a
nationalistic outlook.
• Secular-rational values have
the opposite preferences to
the traditional values. These
societies place less emphasis
on religion, traditional family
values and authority. Divorce,
abortion, euthanasia and
suicide are seen as relatively
acceptable.
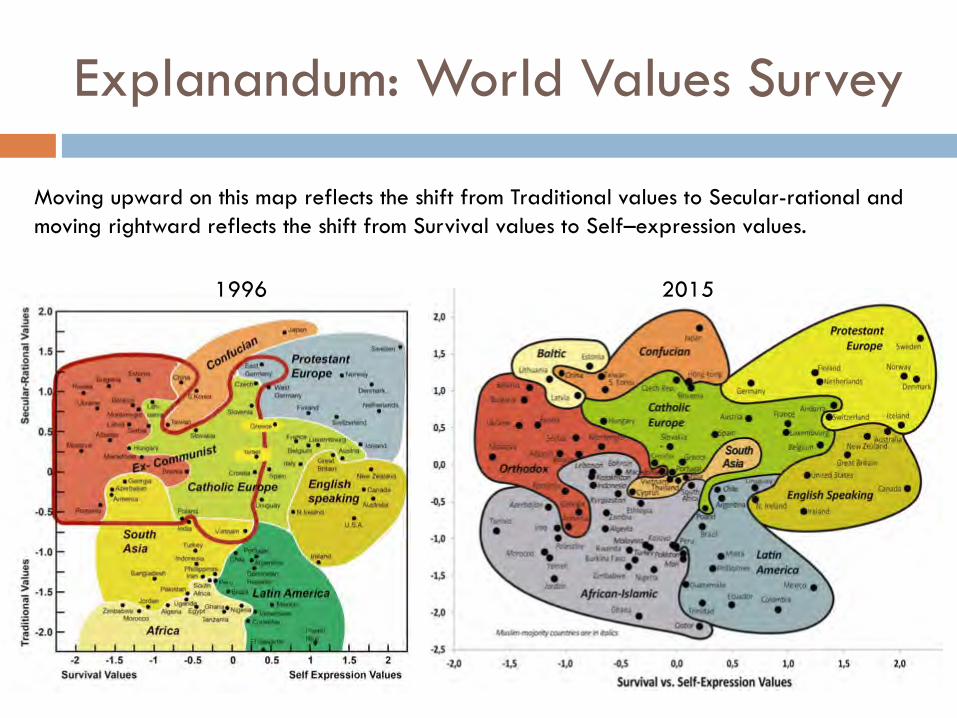
Explanandum: World Values Survey
1996 2015
Moving upward on this map reflects the shift from Traditional values to Secular-rational and
moving rightward reflects the shift from Survival values to Self–expression values.
World Values Survey
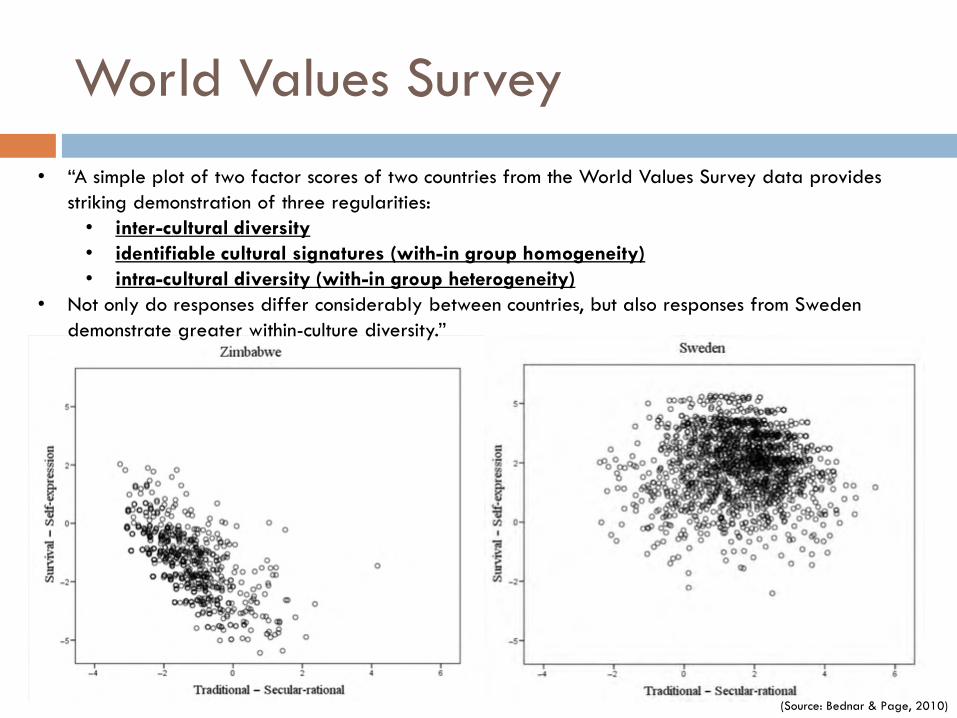
• “A simple plot of two factor scores of two countries from the World Values Survey data provides
striking demonstration of three regularities:
• inter-cultural diversity
• identifiable cultural signatures (with-in group homogeneity)
• intra-cultural diversity (with-in group heterogeneity)
• Not only do responses differ considerably between countries, but also responses from Sweden
demonstrate greater within-culture diversity.”
(Source: Bednar & Page, 2010)
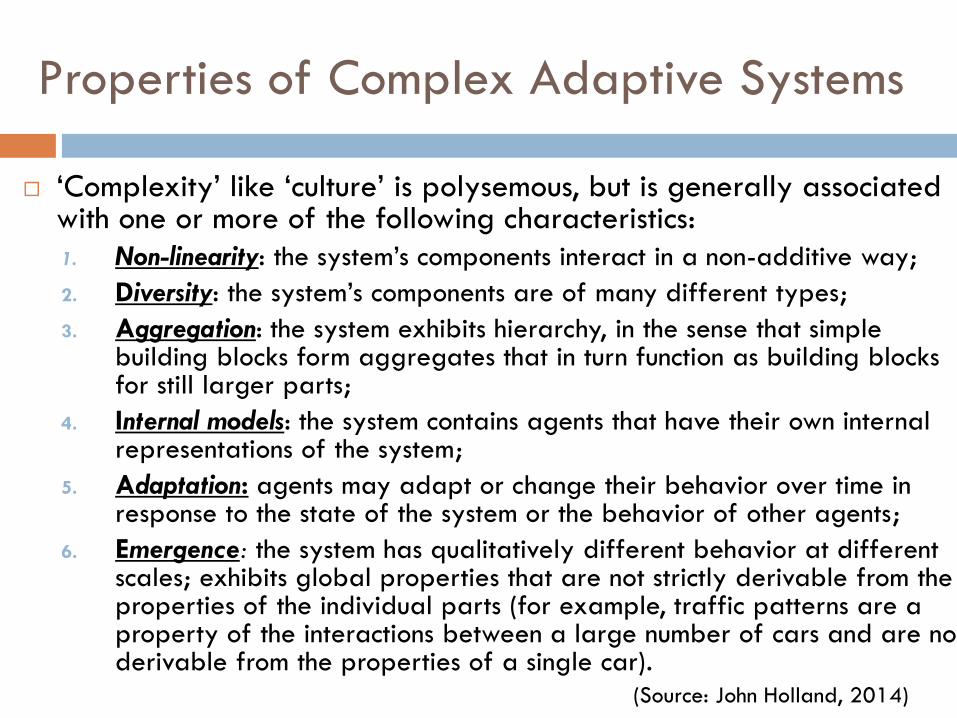
Properties of Complex Adaptive Systems
‘Complexity’ like ‘culture’ is polysemous, but is generally associated with one or more of the following characteristics:
1. Non-linearity: the system’s components interact in a non-additive way;
2. Diversity: the system’s components are of many different types;
3. Aggregation: the system exhibits hierarchy, in the sense that simple building blocks form aggregates that in turn function as building blocks for still larger parts;
4. Internal models: the system contains agents that have their own internal representations of the system;
5. Adaptation: agents may adapt or change their behavior over time in response to the state of the system or the behavior of other agents;
6. Emergence: the system has qualitatively different behavior at different scales; exhibits global properties that are not strictly derivable from the properties of the individual parts (for example, traffic patterns are a property of the interactions between a large number of cars and are not derivable from the properties of a single car).
(Source: John Holland, 2014)
The interaction between culture and policy-making is poorly understood
“Culture’s future influence on world politics will be in a way that has longbeen shunned as a basis for analyzing policy—values. Most Westernpolicymakers have thus far presumed that certain universal human traitsgovern international affairs. Culture was seen only as anincomprehensible wildcard, of little relevance to the game ofinternational relations… Culture influences what goals are consideredworth striving for, what tools of statecraft are used, what national imageis sought, and how concepts of war, peace, freedom, equality, livelihood,and development are valued. It often exercises influence subconsciouslyin the minds of leaders and the public.”
- Brookings, “Western Policymakers Need More Culture” (Apr 2015)
Complex Interactions between Culture
and Policy
Culture and Policy-Making interact in numerous ways, creating a complex feedback loop
1. Culture is an object of policy-making:
Arts and Culture Funding
Education Policy
Propaganda and Social Engineering (e.g., Mao’s Cultural Revolution)
2. Culture is a constraint on policy-making:
To achieve policy objectives, policy-makers need to work around and within the beliefs and cultural practices of the population
Ex: Health care efforts to eradicate Ebola in West Africa had to factor in the public’s belief in traditional burial rites that involve washing the body of the deceased
3. Culture is an ideological lens for policy-making
The values, beliefs, and assumptions of a culture affect how policy-makers conceptualize how the world works, what problems matter and ought to be taken up by policy-makers, and how to address them
Ex: Confucianism, Marxism-Leninism, Liberalism, Islam
4. Policy-making is a sub-culture:
All professions, including policy-making, have their own norms, behavior, dress, specialized language for interacting with one another and with members of the laity.
E.g., hierarchical vs. entrepreneurial, acceptance of corruption, etc.
Complex Interactions between Culture
and Policy
Plan for Today’s Talk
Culture and Policy-Making
Culture as a CAS
Big Concepts and
Emergence
Signals and Boundaries
Internal Models
Reflexivity
Diversity
Ecology
Evolution
Illustrative Models
Robert Axelrod,
“Dissemination of Culture”
Overview
Robert Axelrod’s “The Dissemination of Culture: A Model with Local Convergence and Global Polarization.” (1996)
Culture “is” (can be) emergent:
Local, bottom-up rules for socio-cultural interaction are adequate to generate global patterns of cultural similarity and difference
Provides insight into:
In-group / out-group formation
Factors impacting level of cultural homogeneity vs. diversity
“Culture” as Memes
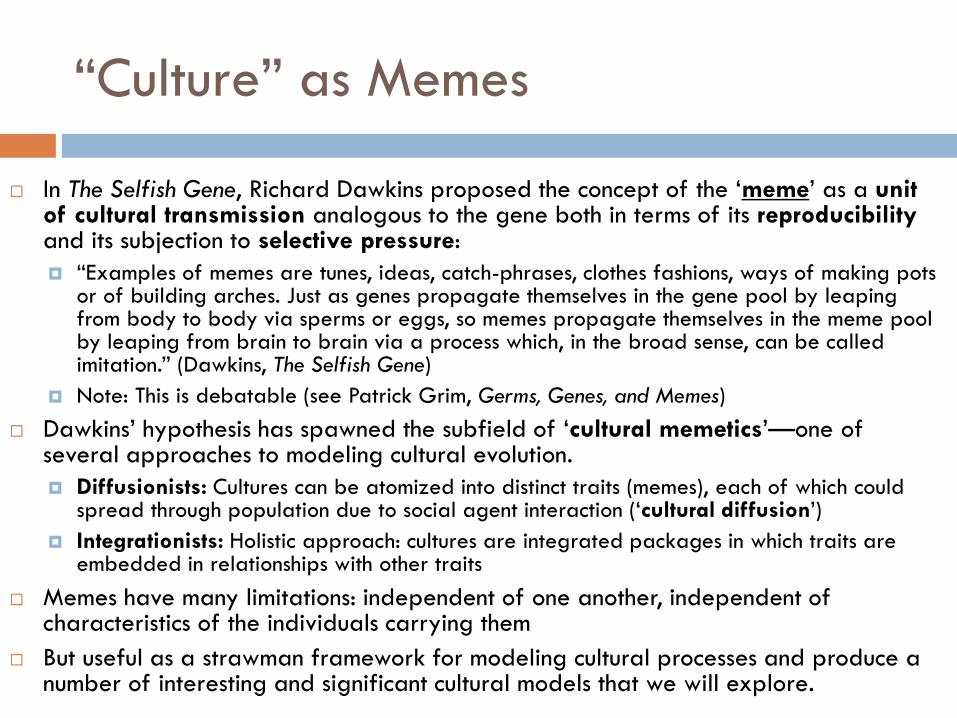
In The Selfish Gene, Richard Dawkins proposed the concept of the ‘meme’ as a unit of cultural transmission analogous to the gene both in terms of its reproducibilityand its subjection to selective pressure:
“Examples of memes are tunes, ideas, catch-phrases, clothes fashions, ways of making pots or of building arches. Just as genes propagate themselves in the gene pool by leaping from body to body via sperms or eggs, so memes propagate themselves in the meme pool by leaping from brain to brain via a process which, in the broad sense, can be called imitation.” (Dawkins, The Selfish Gene)
Note: This is debatable (see Patrick Grim, Germs, Genes, and Memes)
Dawkins’ hypothesis has spawned the subfield of ‘cultural memetics’—one of several approaches to modeling cultural evolution.
Diffusionists: Cultures can be atomized into distinct traits (memes), each of which could spread through population due to social agent interaction (‘cultural diffusion’)
Integrationists: Holistic approach: cultures are integrated packages in which traits are embedded in relationships with other traits
Memes have many limitations: independent of one another, independent of characteristics of the individuals carrying them
But useful as a strawman framework for modeling cultural processes and produce a number of interesting and significant cultural models that we will explore.
Axelrod: Dissemination of Culture
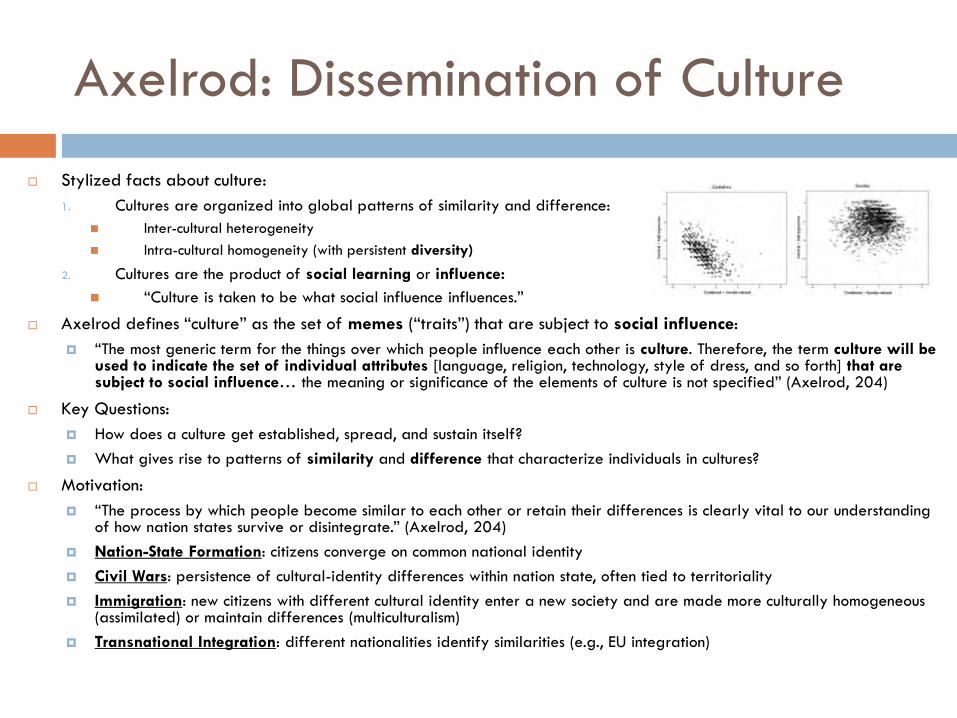
Stylized facts about culture:
1. Cultures are organized into global patterns of similarity and difference:
Inter-cultural heterogeneity
Intra-cultural homogeneity (with persistent diversity)
2. Cultures are the product of social learning or influence:
“Culture is taken to be what social influence influences.”
Axelrod defines “culture” as the set of memes (“traits”) that are subject to social influence:
“The most generic term for the things over which people influence each other is culture. Therefore, the term culture will be used to indicate the set of individual attributes [language, religion, technology, style of dress, and so forth] that are subject to social influence… the meaning or significance of the elements of culture is not specified” (Axelrod, 204)
Key Questions:
How does a culture get established, spread, and sustain itself?
What gives rise to patterns of similarity and difference that characterize individuals in cultures?
Motivation:
“The process by which people become similar to each other or retain their differences is clearly vital to our understanding of how nation states survive or disintegrate.” (Axelrod, 204)
Nation-State Formation: citizens converge on common national identity
Civil Wars: persistence of cultural-identity differences within nation state, often tied to territoriality
Immigration: new citizens with different cultural identity enter a new society and are made more culturally homogeneous (assimilated) or maintain differences (multiculturalism)
Transnational Integration: different nationalities identify similarities (e.g., EU integration)
Modeling Cultural Mechanisms
Step 1: Identify candidate mechanisms capable of generating cultural similarity and difference:
Fads and fashions: early adopters, cultural leaders and followers
Preference for extreme views
Cultural drift: random mutations in cultural traits leading to differentiation
Geographic isolation
Specialization
Rapid environmental or technological change
Psycho-social processes on which Axelrod Focuses:
1. Homophily: people who agree about beliefs tend to interact more
2. Conformity / Social Influence: people’s beliefs tend to adjust so as to conform with those with whom they interact (e.g., contact hypothesis)
Step 2: Instantiate mechanisms in a computational agent-based model to determine dynamics and implications:
No central authority: bottom-up local interactions leading to emergent behavior
Adaptive rather than rational agents
Axelrod: Dissemination of Culture Model
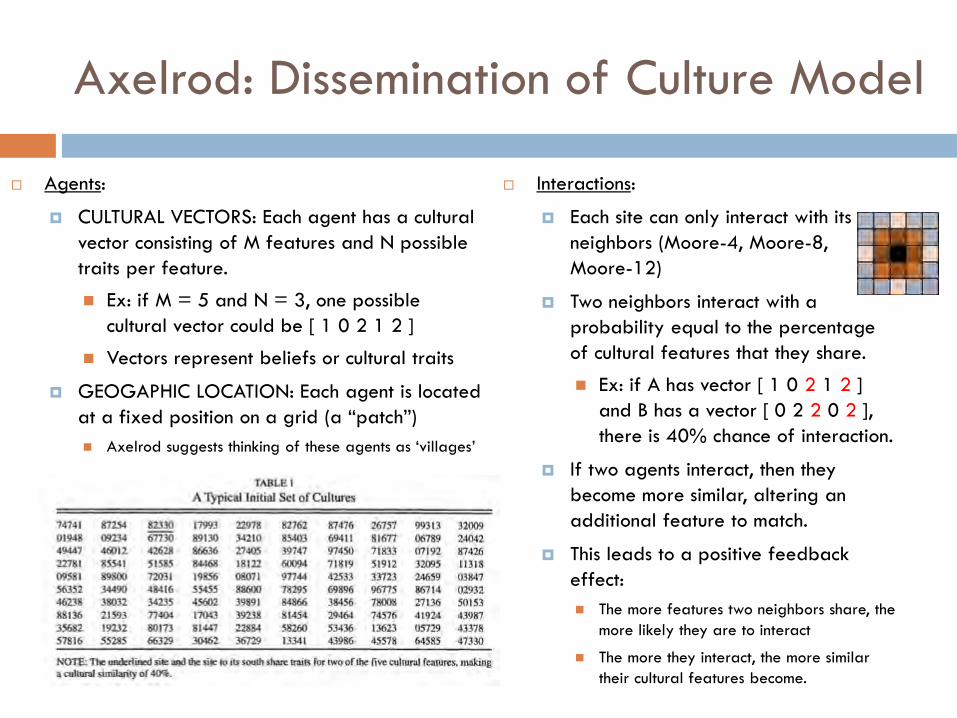
Agents:
CULTURAL VECTORS: Each agent has a cultural
vector consisting of M features and N possible
traits per feature.
Ex: if M = 5 and N = 3, one possible
cultural vector could be [ 1 0 2 1 2 ]
Vectors represent beliefs or cultural traits
GEOGAPHIC LOCATION: Each agent is located
at a fixed position on a grid (a “patch”)
Axelrod suggests thinking of these agents as ‘villages’
Interactions:
Each site can only interact with its
neighbors (Moore-4, Moore-8,
Moore-12)
Two neighbors interact with a
probability equal to the percentage
of cultural features that they share.
Ex: if A has vector [ 1 0 2 1 2 ]
and B has a vector [ 0 2 2 0 2 ],
there is 40% chance of interaction.
If two agents interact, then they
become more similar, altering an
additional feature to match.
This leads to a positive feedback
effect:
The more features two neighbors share, the
more likely they are to interact
The more they interact, the more similar
their cultural features become.
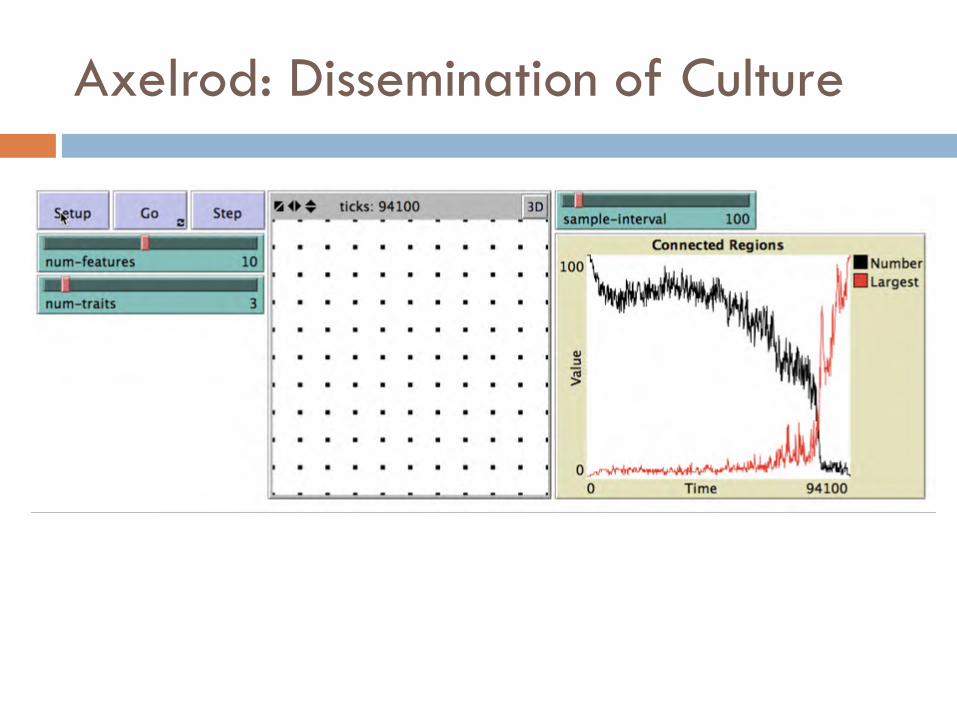
Axelrod: Dissemination of Culture
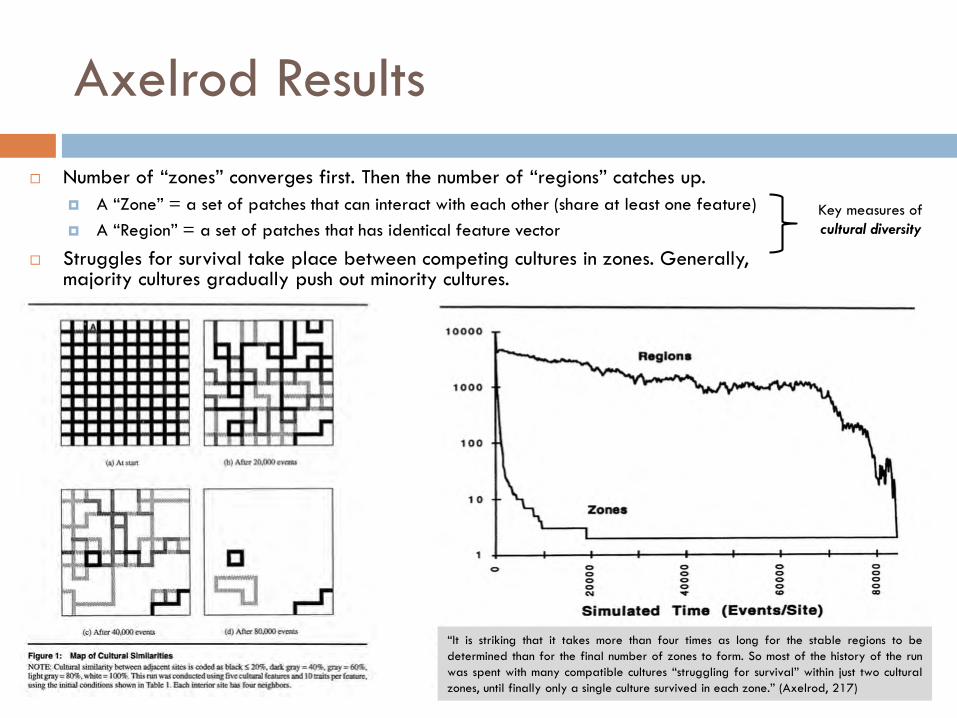
Axelrod Results
Number of “zones” converges first. Then the number of “regions” catches up.
A “Zone” = a set of patches that can interact with each other (share at least one feature)
A “Region” = a set of patches that has identical feature vector
Struggles for survival take place between competing cultures in zones. Generally, majority cultures gradually push out minority cultures.
“It is striking that it takes more than four times as long for the stable regions to be
determined than for the final number of zones to form. So most of the history of the run
was spent with many compatible cultures “struggling for survival” within just two cultural
zones, until finally only a single culture survived in each zone.” (Axelrod, 217)
Key measures of
cultural diversity
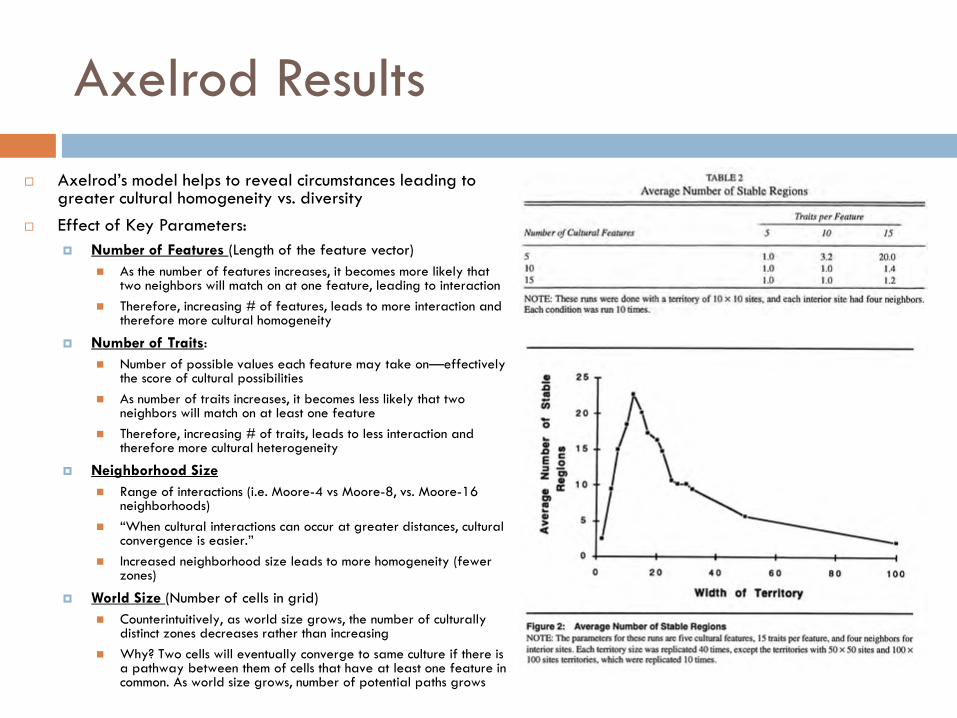
Axelrod Results
Axelrod’s model helps to reveal circumstances leading to greater cultural homogeneity vs. diversity
Effect of Key Parameters:
Number of Features (Length of the feature vector)
As the number of features increases, it becomes more likely that two neighbors will match on at one feature, leading to interaction
Therefore, increasing # of features, leads to more interaction and therefore more cultural homogeneity
Number of Traits:
Number of possible values each feature may take on—effectively the score of cultural possibilities
As number of traits increases, it becomes less likely that two neighbors will match on at least one feature
Therefore, increasing # of traits, leads to less interaction and therefore more cultural heterogeneity
Neighborhood Size
Range of interactions (i.e. Moore-4 vs Moore-8, vs. Moore-16 neighborhoods)
“When cultural interactions can occur at greater distances, cultural convergence is easier.”
Increased neighborhood size leads to more homogeneity (fewer zones)
World Size (Number of cells in grid)
Counterintuitively, as world size grows, the number of culturally distinct zones decreases rather than increasing
Why? Two cells will eventually converge to same culture if there is a pathway between them of cells that have at least one feature in common. As world size grows, number of potential paths grows
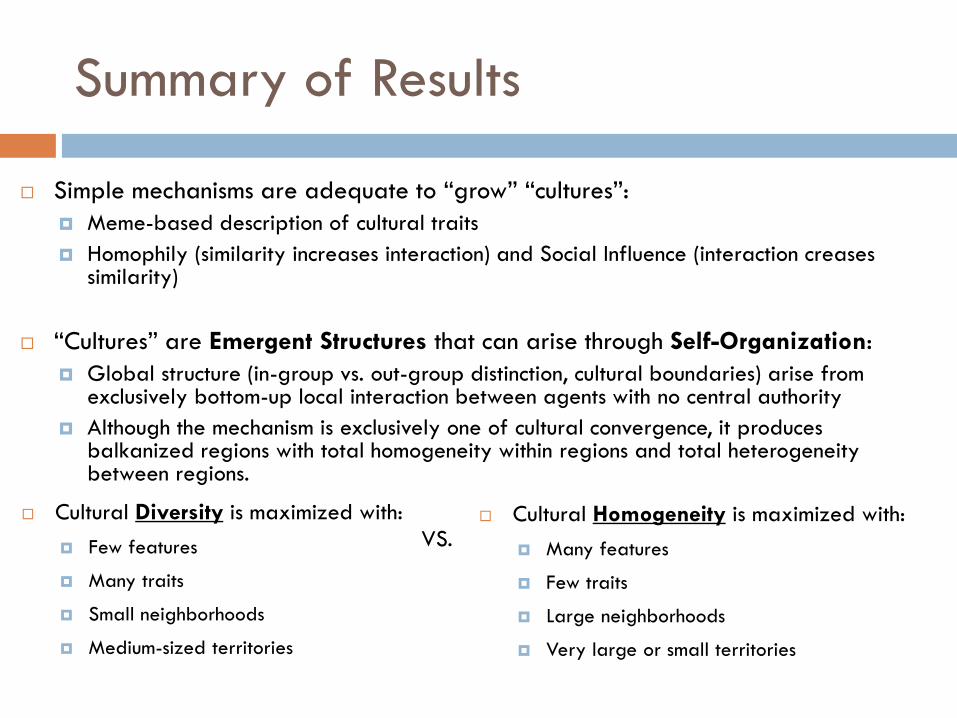
Summary of Results
Simple mechanisms are adequate to “grow” “cultures”:
Meme-based description of cultural traits
Homophily (similarity increases interaction) and Social Influence (interaction creases similarity)
“Cultures” are Emergent Structures that can arise through Self-Organization:
Global structure (in-group vs. out-group distinction, cultural boundaries) arise from exclusively bottom-up local interaction between agents with no central authority
Although the mechanism is exclusively one of cultural convergence, it produces balkanized regions with total homogeneity within regions and total heterogeneity between regions.
Cultural Diversity is maximized with:
Few features
Many traits
Small neighborhoods
Medium-sized territories
Cultural Homogeneity is maximized with:
Many features
Few traits
Large neighborhoods
Very large or small territories
VS.
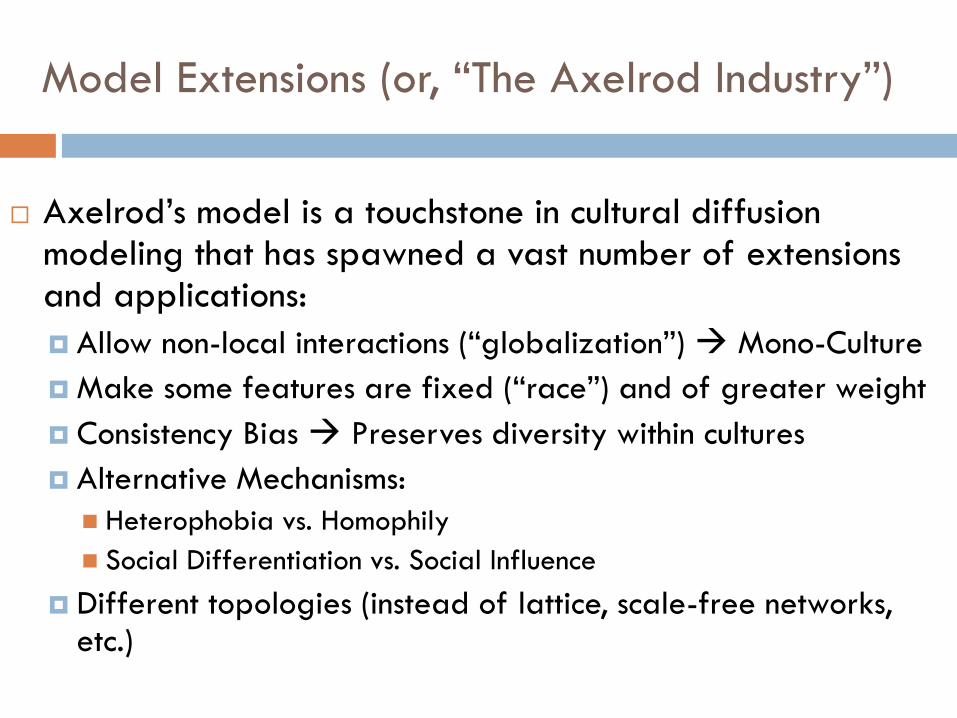
Model Extensions (or, “The Axelrod Industry”)
Axelrod’s model is a touchstone in cultural diffusion modeling that has spawned a vast number of extensions and applications:
Allow non-local interactions (“globalization”) Mono-Culture
Make some features are fixed (“race”) and of greater weight
Consistency Bias Preserves diversity within cultures
Alternative Mechanisms:
Heterophobia vs. Homophily
Social Differentiation vs. Social Influence
Different topologies (instead of lattice, scale-free networks, etc.)
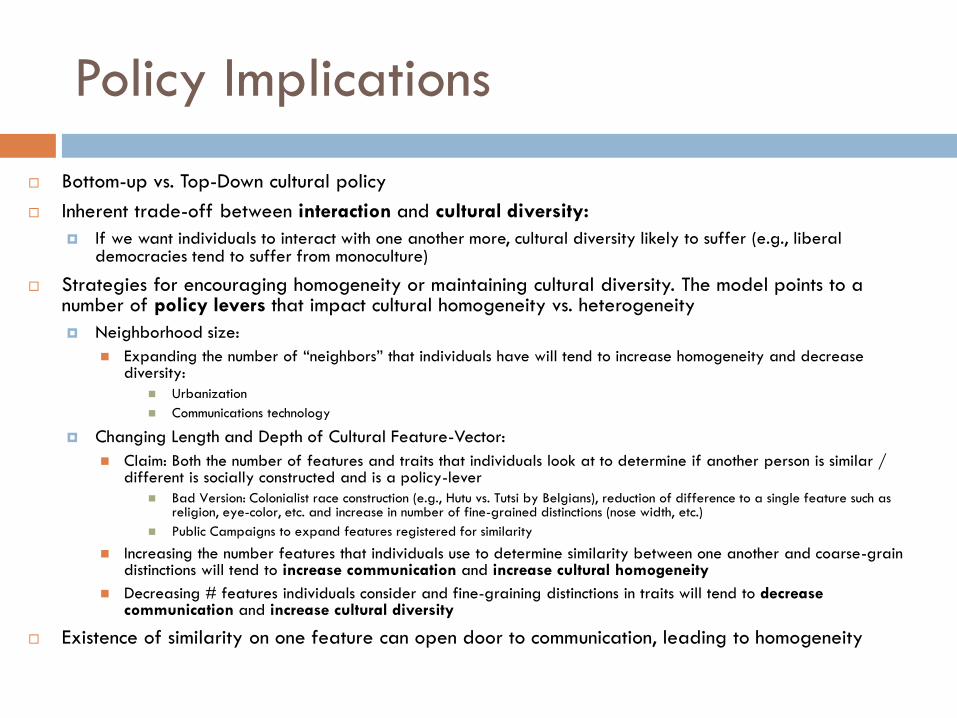
Policy Implications
Bottom-up vs. Top-Down cultural policy
Inherent trade-off between interaction and cultural diversity:
If we want individuals to interact with one another more, cultural diversity likely to suffer (e.g., liberal democracies tend to suffer from monoculture)
Strategies for encouraging homogeneity or maintaining cultural diversity. The model points to a number of policy levers that impact cultural homogeneity vs. heterogeneity
Neighborhood size:
Expanding the number of “neighbors” that individuals have will tend to increase homogeneity and decrease diversity:
Urbanization
Communications technology
Changing Length and Depth of Cultural Feature-Vector:
Claim: Both the number of features and traits that individuals look at to determine if another person is similar / different is socially constructed and is a policy-lever
Bad Version: Colonialist race construction (e.g., Hutu vs. Tutsi by Belgians), reduction of difference to a single feature such as religion, eye-color, etc. and increase in number of fine-grained distinctions (nose width, etc.)
Public Campaigns to expand features registered for similarity
Increasing the number features that individuals use to determine similarity between one another and coarse-grain distinctions will tend to increase communication and increase cultural homogeneity
Decreasing # features individuals consider and fine-graining distinctions in traits will tend to decrease communication and increase cultural diversity
Existence of similarity on one feature can open door to communication, leading to homogeneity
Plan for Today’s Talk
Culture and Policy-Making
Culture as a CAS
Big Concepts and
Emergence
Signals and Boundaries
Internal Models
Reflexivity
Diversity
Ecology
Evolution
Illustrative Models
Robert Axelrod,
“Dissemination of Culture”

Key Objectives:
• “to examine mechanisms that underpin the development of
hierarchies of signals and boundaries in complex adaptive
systems…”
• “to tie these mechanisms into a single overarching
framework that suggests ways to steer complex adaptive
systems by modifying signal/boundary hierarchies” (pg. 1-
2).
• CAS can be modeled using a framework based on the concepts of “signals” and
“boundaries”
• Using this framework is particularly useful for illuminating features of CAS such
as: (1) hierarchy (2) specialization (3) diversity (4) niches (5) recirculation
Sack & Flocken (NTU Presentation,
2015)
• Founder of Santa Fe Institute
• Professor at Univ. of Michigan
• Inventor of:
- Genetic Algorithms,
- Classifier Systems
- Echo Models
John H. Holland
Signals and Boundaries in CAS
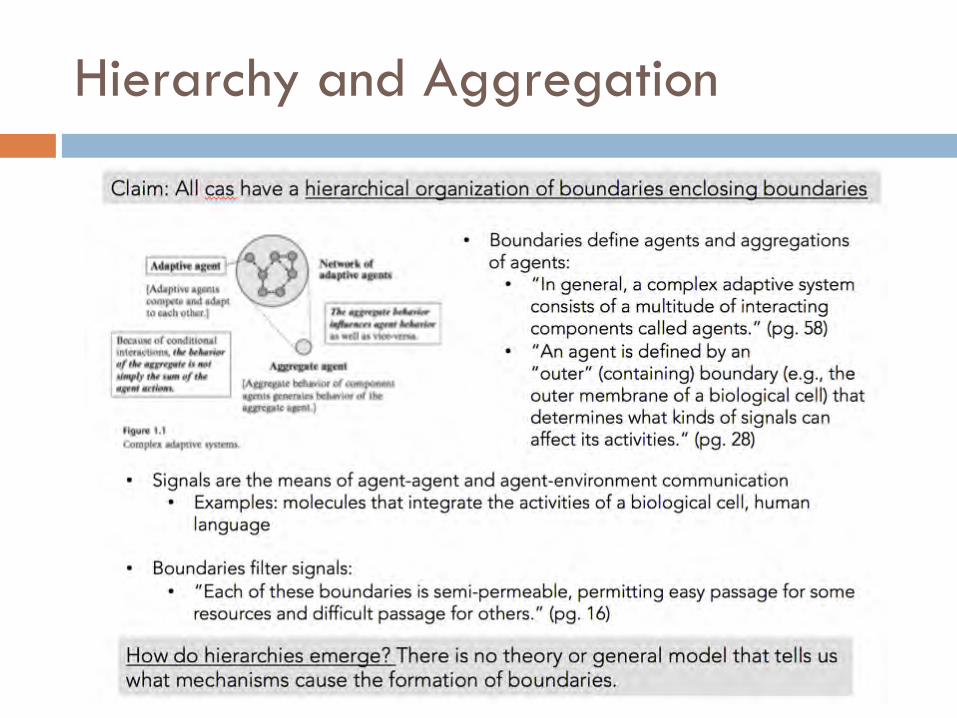
Hierarchy and Aggregation
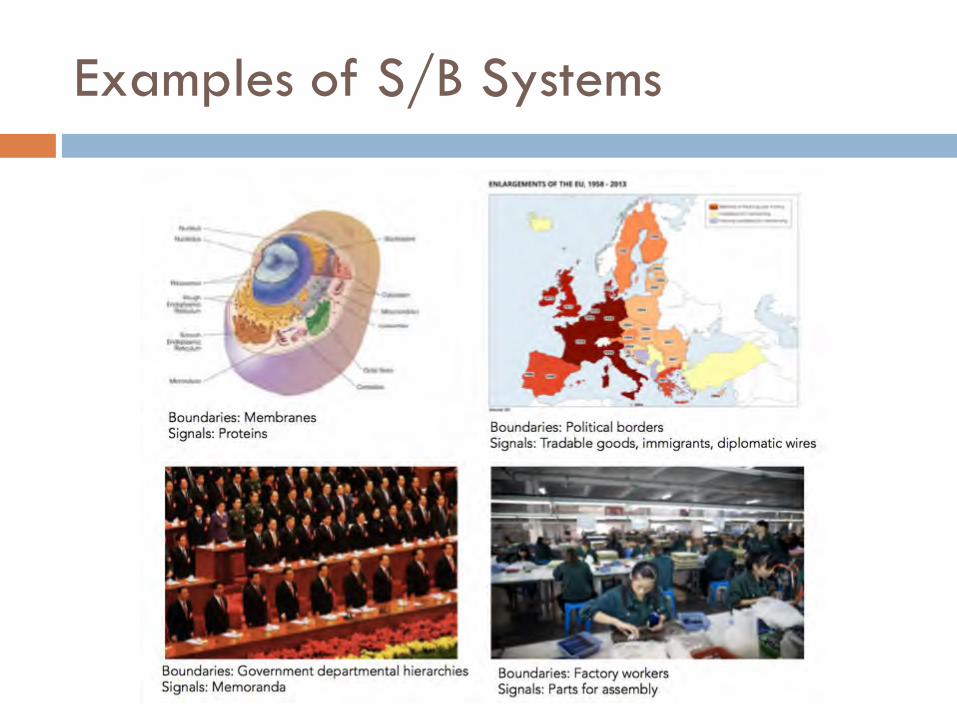
Examples of S/B Systems
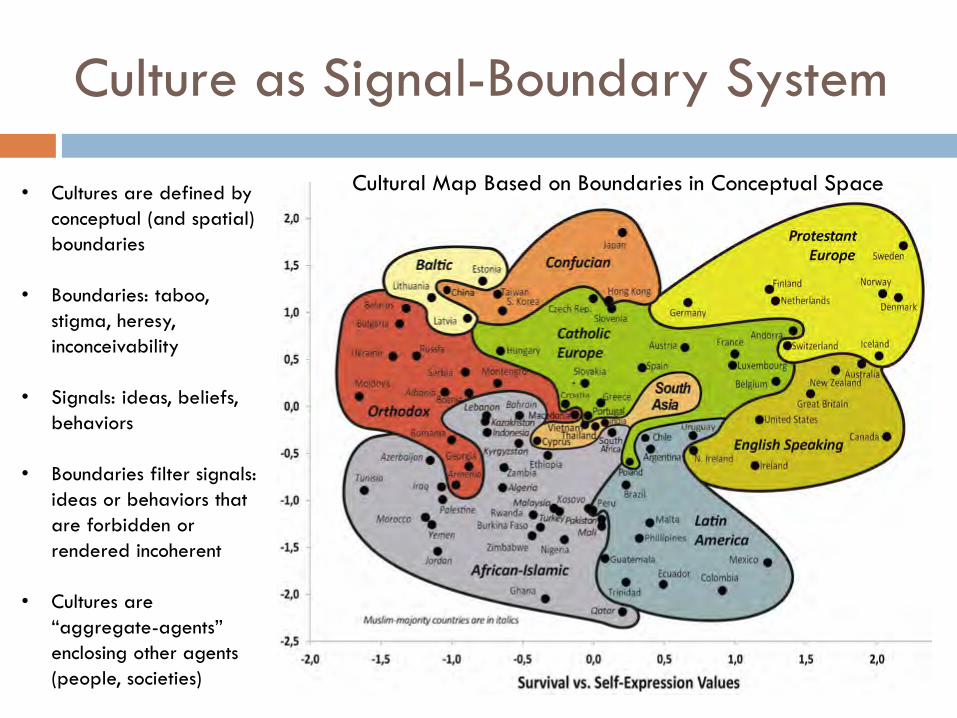
Culture as Signal-Boundary System
• Cultures are defined by
conceptual (and spatial)
boundaries
• Boundaries: taboo,
stigma, heresy,
inconceivability
• Signals: ideas, beliefs,
behaviors
• Boundaries filter signals:
ideas or behaviors that
are forbidden or
rendered incoherent
• Cultures are
“aggregate-agents”
enclosing other agents
(people, societies)
Cultural Map Based on Boundaries in Conceptual Space
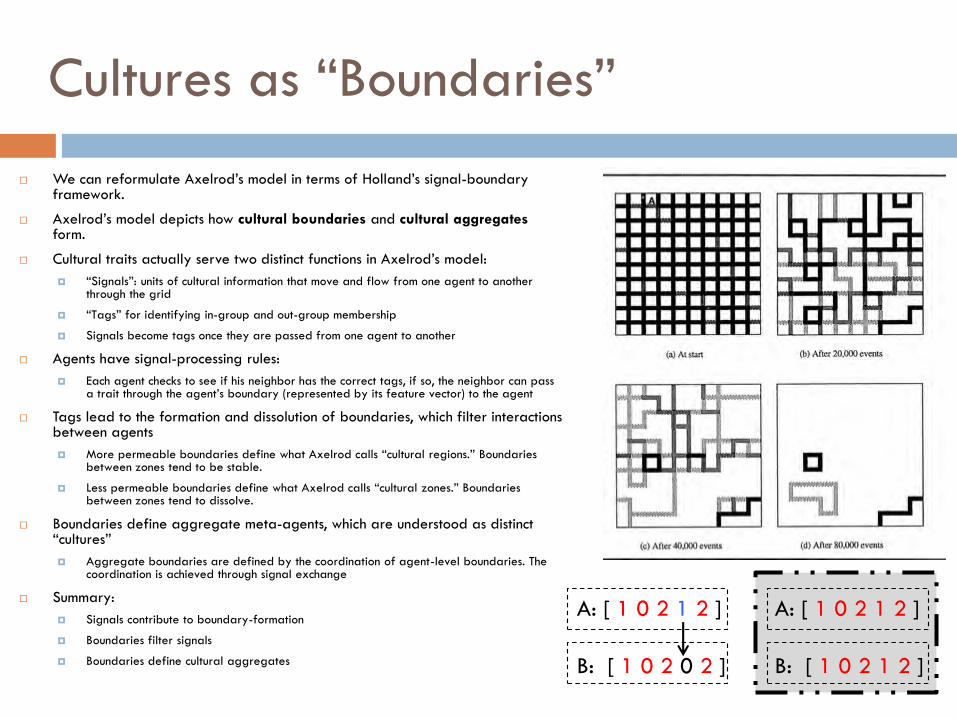
Cultures as “Boundaries”
We can reformulate Axelrod’s model in terms of Holland’s signal-boundary framework.
Axelrod’s model depicts how cultural boundaries and cultural aggregates form.
Cultural traits actually serve two distinct functions in Axelrod’s model:
“Signals”: units of cultural information that move and flow from one agent to another through the grid
“Tags” for identifying in-group and out-group membership
Signals become tags once they are passed from one agent to another
Agents have signal-processing rules:
Each agent checks to see if his neighbor has the correct tags, if so, the neighbor can pass a trait through the agent’s boundary (represented by its feature vector) to the agent
Tags lead to the formation and dissolution of boundaries, which filter interactions between agents
More permeable boundaries define what Axelrod calls “cultural regions.” Boundaries between zones tend to be stable.
Less permeable boundaries define what Axelrod calls “cultural zones.” Boundaries between zones tend to dissolve.
Boundaries define aggregate meta-agents, which are understood as distinct “cultures”
Aggregate boundaries are defined by the coordination of agent-level boundaries. The coordination is achieved through signal exchange
Summary:
Signals contribute to boundary-formation
Boundaries filter signals
Boundaries define cultural aggregates
A: [ 1 0 2 1 2 ]
B: [ 1 0 2 0 2 ]
A: [ 1 0 2 1 2 ]
B: [ 1 0 2 1 2 ]
Plan for Today’s Talk
Culture and Policy-Making
Culture as a CAS
Big Concepts and
Emergence
Signals and Boundaries
Internal Models
Reflexivity
Diversity
Ecology
Evolution
Illustrative Models
Brian Arthur,
“The El Farol Problem”
“Culture” as Internal Model
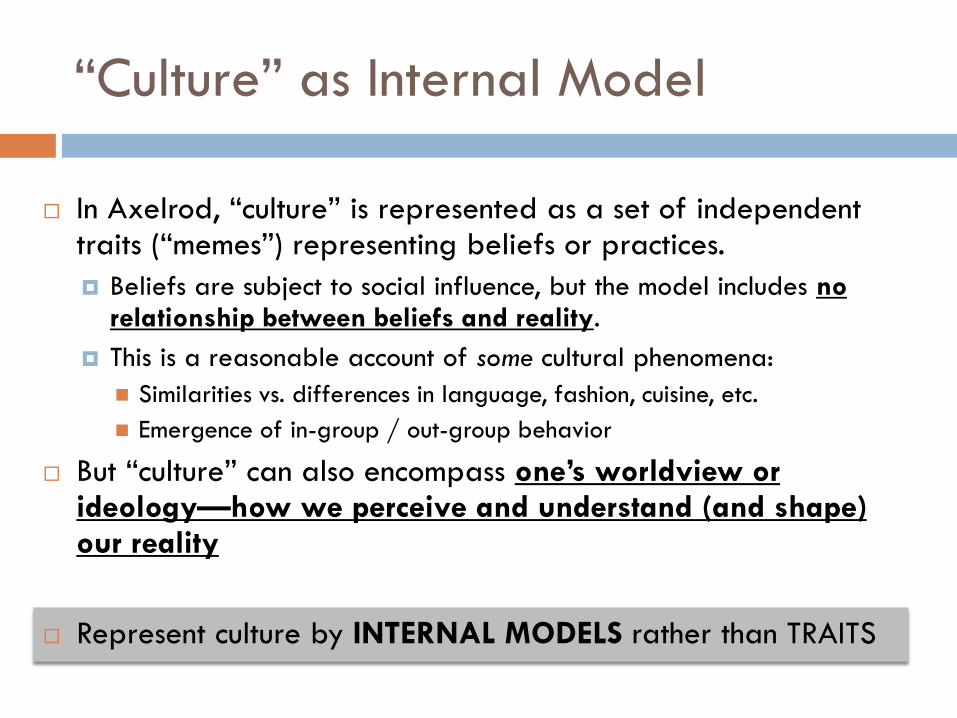
In Axelrod, “culture” is represented as a set of independent traits (“memes”) representing beliefs or practices.
Beliefs are subject to social influence, but the model includes no relationship between beliefs and reality.
This is a reasonable account of some cultural phenomena:
Similarities vs. differences in language, fashion, cuisine, etc.
Emergence of in-group / out-group behavior
But “culture” can also encompass one’s worldview or ideology—how we perceive and understand (and shape) our reality
Represent culture by INTERNAL MODELS rather than TRAITS
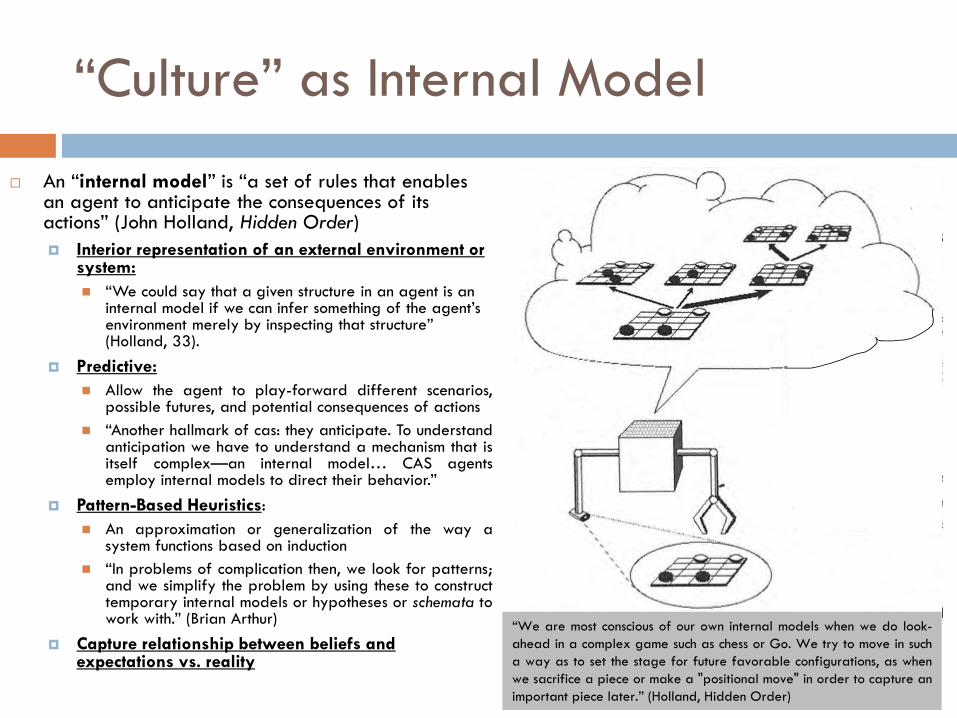
An “internal model” is “a set of rules that enables an agent to anticipate the consequences of its actions” (John Holland, Hidden Order)
Interior representation of an external environment or system:
“We could say that a given structure in an agent is an internal model if we can infer something of the agent’s environment merely by inspecting that structure” (Holland, 33).
Predictive:
Allow the agent to play-forward different scenarios,possible futures, and potential consequences of actions
“Another hallmark of cas: they anticipate. To understandanticipation we have to understand a mechanism that isitself complex—an internal model… CAS agentsemploy internal models to direct their behavior.”
Pattern-Based Heuristics:
An approximation or generalization of the way asystem functions based on induction
“In problems of complication then, we look for patterns;and we simplify the problem by using these to constructtemporary internal models or hypotheses or schemata towork with.” (Brian Arthur)
Capture relationship between beliefs and expectations vs. reality
“Culture” as Internal Model
“We are most conscious of our own internal models when we do look-
ahead in a complex game such as chess or Go. We try to move in such
a way as to set the stage for future favorable configurations, as when
we sacrifice a piece or make a "positional move" in order to capture an
important piece later.” (Holland, Hidden Order)
El Farol: Set-Up
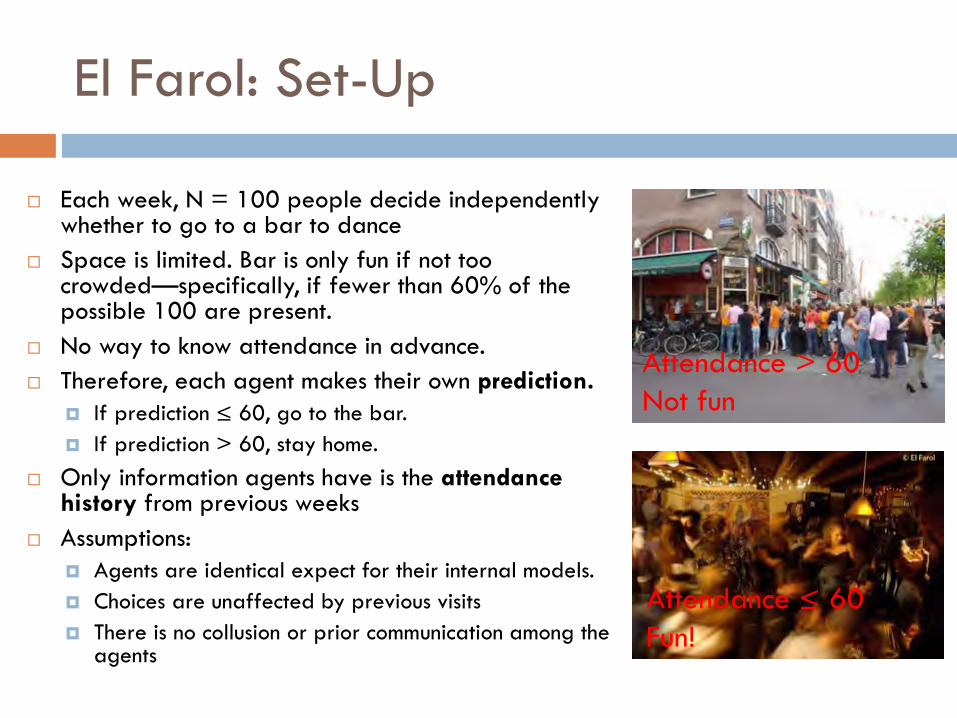
Each week, N = 100 people decide independently whether to go to a bar to dance
Space is limited. Bar is only fun if not too crowded—specifically, if fewer than 60% of the possible 100 are present.
No way to know attendance in advance.
Therefore, each agent makes their own prediction.
If prediction ≤ 60, go to the bar.
If prediction > 60, stay home.
Only information agents have is the attendancehistory from previous weeks
Assumptions:
Agents are identical expect for their internal models.
Choices are unaffected by previous visits
There is no collusion or prior communication among the agents
Attendance > 60
Not fun
Attendance ≤ 60
Fun!
El Farol: Set-up
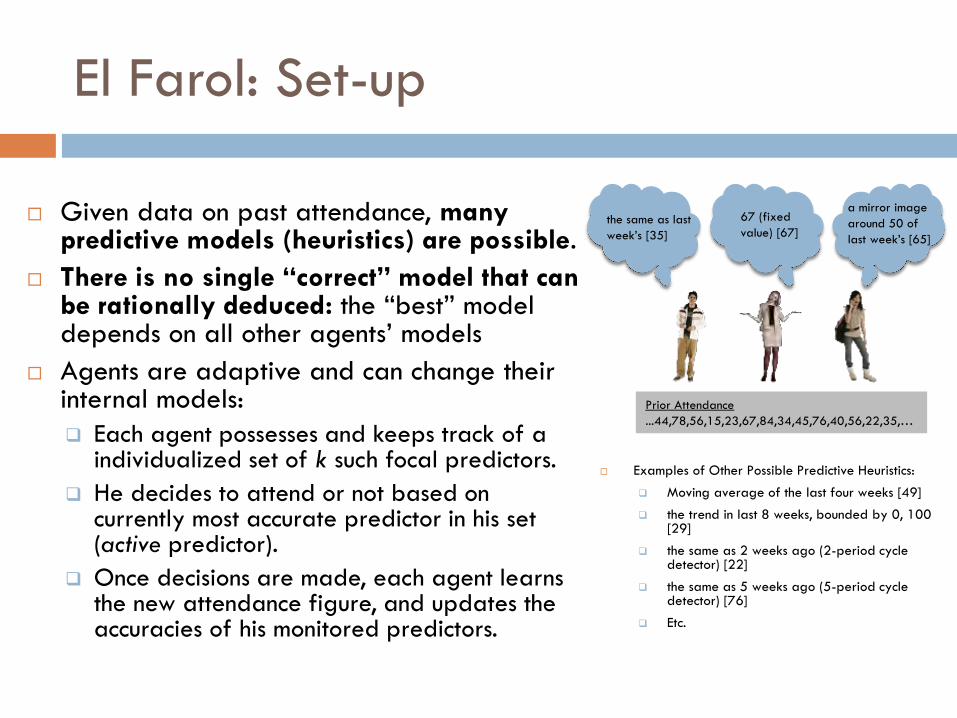
Given data on past attendance, many predictive models (heuristics) are possible.
There is no single “correct” model that can be rationally deduced: the “best” model depends on all other agents’ models
Agents are adaptive and can change their internal models:
Each agent possesses and keeps track of a individualized set of k such focal predictors.
He decides to attend or not based on currently most accurate predictor in his set (active predictor).
Once decisions are made, each agent learns the new attendance figure, and updates the accuracies of his monitored predictors.
the same as last
week’s [35]
a mirror image
around 50 of
last week’s [65]
Prior Attendance
...44,78,56,15,23,67,84,34,45,76,40,56,22,35,…
67 (fixed
value) [67]
Examples of Other Possible Predictive Heuristics:
Moving average of the last four weeks [49]
the trend in last 8 weeks, bounded by 0, 100 [29]
the same as 2 weeks ago (2-period cycle detector) [22]
the same as 5 weeks ago (5-period cycle detector) [76]
Etc.
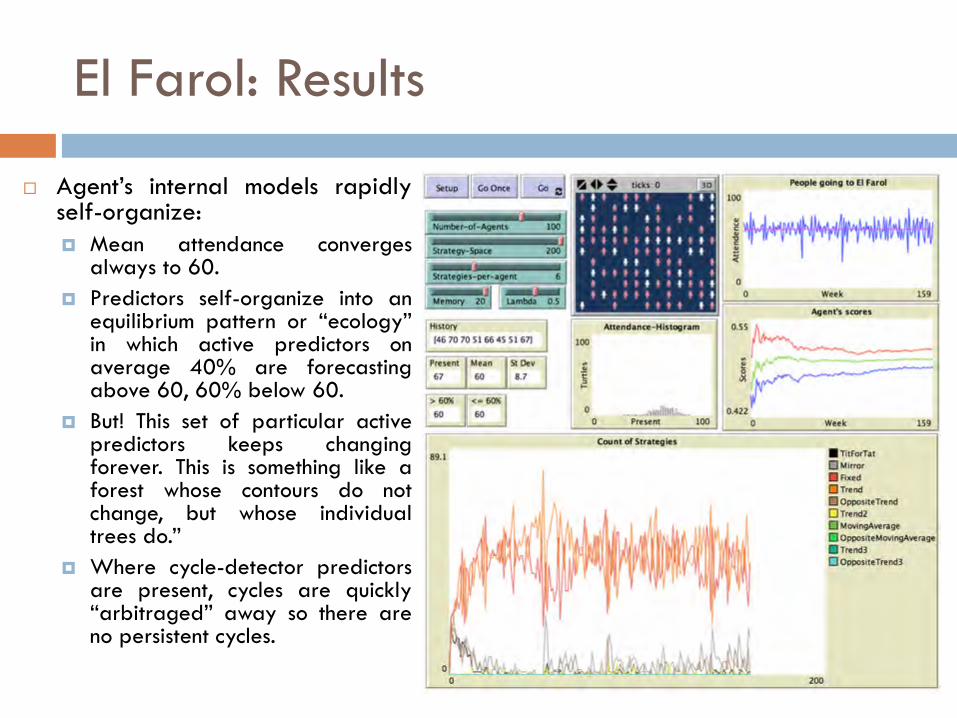
El Farol: Results
Agent’s internal models rapidlyself-organize:
Mean attendance convergesalways to 60.
Predictors self-organize into anequilibrium pattern or “ecology”in which active predictors onaverage 40% are forecastingabove 60, 60% below 60.
But! This set of particular activepredictors keeps changingforever. This is something like aforest whose contours do notchange, but whose individualtrees do.”
Where cycle-detector predictorsare present, cycles are quickly“arbitraged” away so there areno persistent cycles.
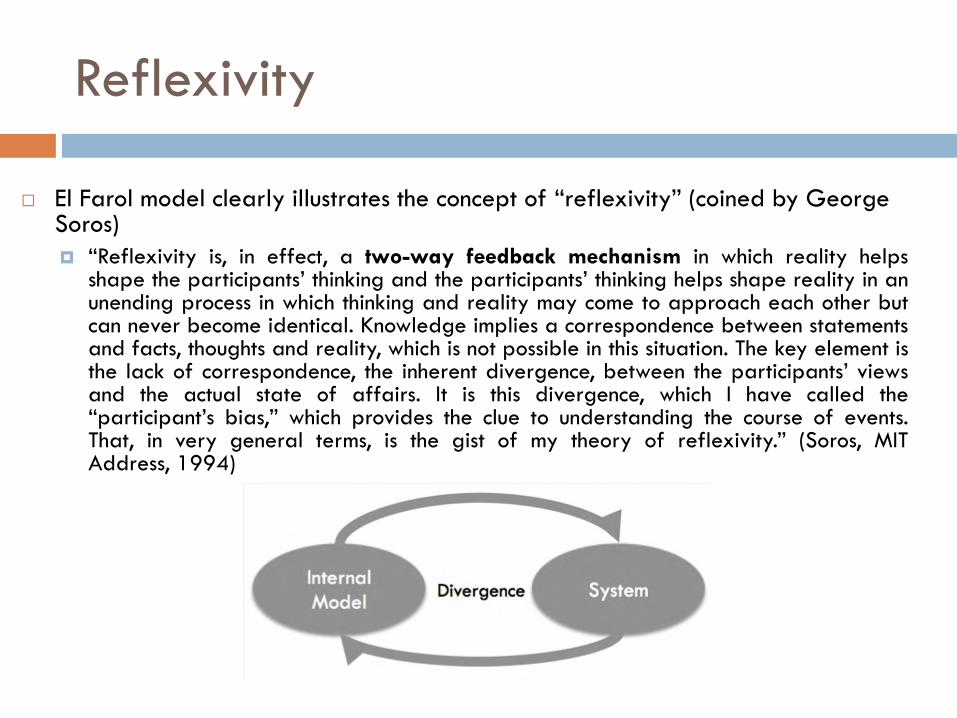
Reflexivity
El Farol model clearly illustrates the concept of “reflexivity” (coined by George Soros)
“Reflexivity is, in effect, a two-way feedback mechanism in which reality helpsshape the participants’ thinking and the participants’ thinking helps shape reality in anunending process in which thinking and reality may come to approach each other butcan never become identical. Knowledge implies a correspondence between statementsand facts, thoughts and reality, which is not possible in this situation. The key element isthe lack of correspondence, the inherent divergence, between the participants’ viewsand the actual state of affairs. It is this divergence, which I have called the“participant’s bias,” which provides the clue to understanding the course of events.That, in very general terms, is the gist of my theory of reflexivity.” (Soros, MITAddress, 1994)
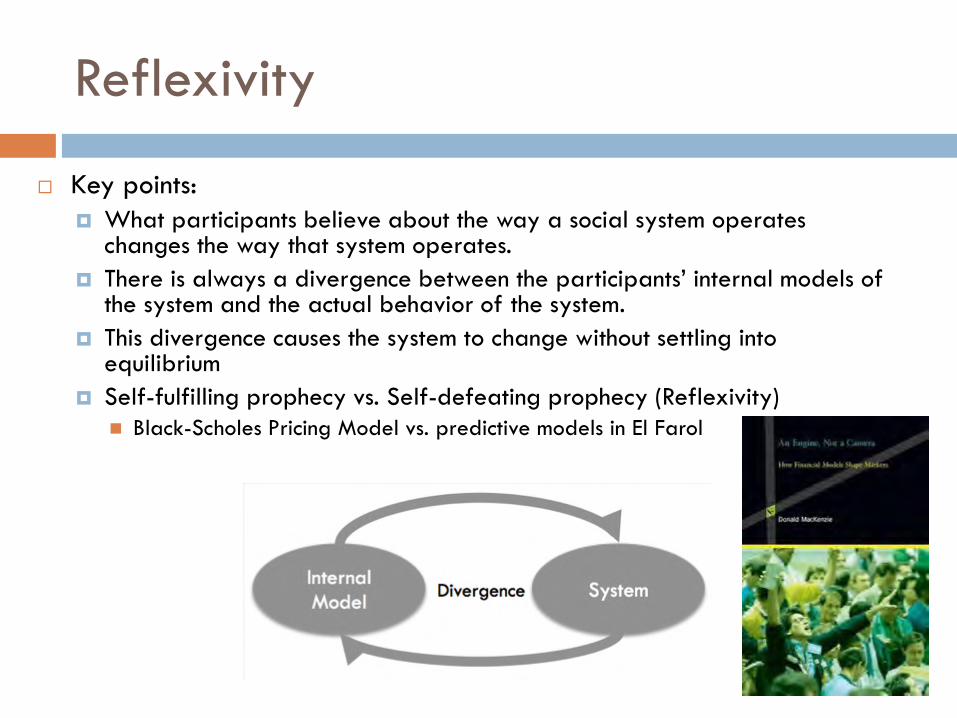
Reflexivity
Key points:
What participants believe about the way a social system operates changes the way that system operates.
There is always a divergence between the participants’ internal models of the system and the actual behavior of the system.
This divergence causes the system to change without settling into equilibrium
Self-fulfilling prophecy vs. Self-defeating prophecy (Reflexivity)
Black-Scholes Pricing Model vs. predictive models in El Farol
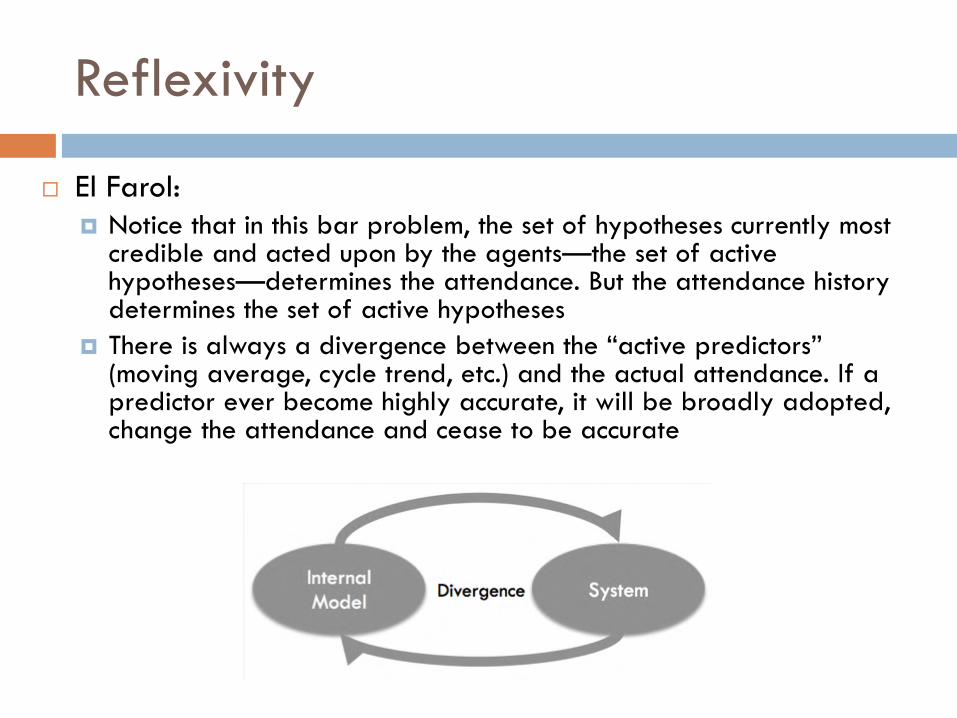
Reflexivity
El Farol:
Notice that in this bar problem, the set of hypotheses currently most credible and acted upon by the agents—the set of active hypotheses—determines the attendance. But the attendance history determines the set of active hypotheses
There is always a divergence between the “active predictors” (moving average, cycle trend, etc.) and the actual attendance. If a predictor ever become highly accurate, it will be broadly adopted, change the attendance and cease to be accurate
Internal Models as Cultural Metaphors
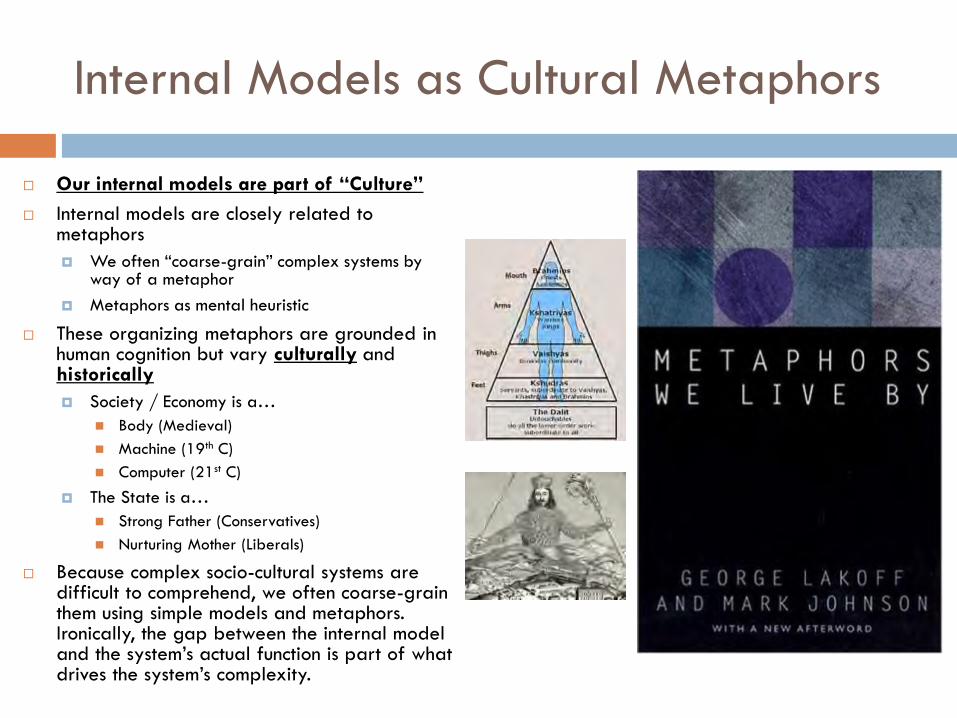
Our internal models are part of “Culture”
Internal models are closely related to metaphors
We often “coarse-grain” complex systems by way of a metaphor
Metaphors as mental heuristic
These organizing metaphors are grounded in human cognition but vary culturally and historically
Society / Economy is a…
Body (Medieval)
Machine (19th C)
Computer (21st C)
The State is a…
Strong Father (Conservatives)
Nurturing Mother (Liberals)
Because complex socio-cultural systems are difficult to comprehend, we often coarse-grain them using simple models and metaphors. Ironically, the gap between the internal model and the system’s actual function is part of what drives the system’s complexity.
Relevance to Policy-Making
1. Changing participants’ internal models of socio-cultural
systems changes those system—this is a powerful (and
dangerous) policy-lever,
2. Policy-makers are themselves participants in the system
and their internal models will change the system,
3. Because policy-makers are participants, there will always
be a gap between their model and reality because their
model change reality, so full knowledge is not possible. In
this case, overconfidence about one’s knowledge of how
the social system operates can be dangerous, best
position is “epistemic humility”
El Farol captures the argument for CULTURAL DIVERSITY
Specifically, the dynamics force cognitive diversity
It isn’t possible for all agents to converge on the same internal model. Diabolically, any commonalty of expectations gets broken up:
Any internal model will become invalid if is too broadly adopted
If all believe few will go, all will go. But this would invalidate that belief.
Similarly, if all believe most will go, nobody will go, invalidating that belief.
Internal models will be forced to differ
The system malfunctions if there is too little cognitive diversity.
Not one, but a set of internal models will have to develop.
Cultural (i.e., Cognitive) Diversity is Necessary
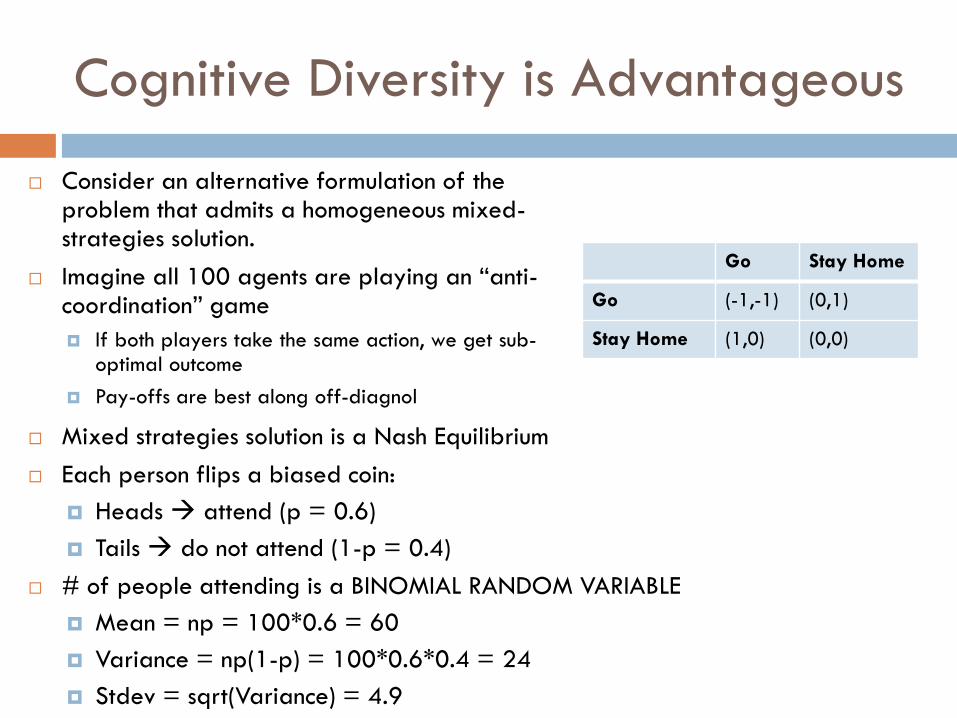
Mixed strategies solution is a Nash Equilibrium
Each person flips a biased coin:
Heads attend (p = 0.6)
Tails do not attend (1-p = 0.4)
# of people attending is a BINOMIAL RANDOM VARIABLE
Mean = np = 100*0.6 = 60
Variance = np(1-p) = 100*0.6*0.4 = 24
Stdev = sqrt(Variance) = 4.9
Go Stay Home
Go (-1,-1) (0,1)
Stay Home (1,0) (0,0)
Consider an alternative formulation of the problem that admits a homogeneous mixed-strategies solution.
Imagine all 100 agents are playing an “anti-coordination” game
If both players take the same action, we get sub-optimal outcome
Pay-offs are best along off-diagnol
Cognitive Diversity is Advantageous
-
10.0
20.0
30.0
40.0
50.0
60.0
70.0
80.0
1 2 3 4 5 6 7 8 9 10
mean
stdev
-
10.0
20.0
30.0
40.0
50.0
60.0
70.0
80.0
1 2 3 4 5 6 7
mean
stdev
Attendance vs. Number of Strategies Per Agent
(Memory = 5)
Attendance vs. Memory
(Strategies = 5)
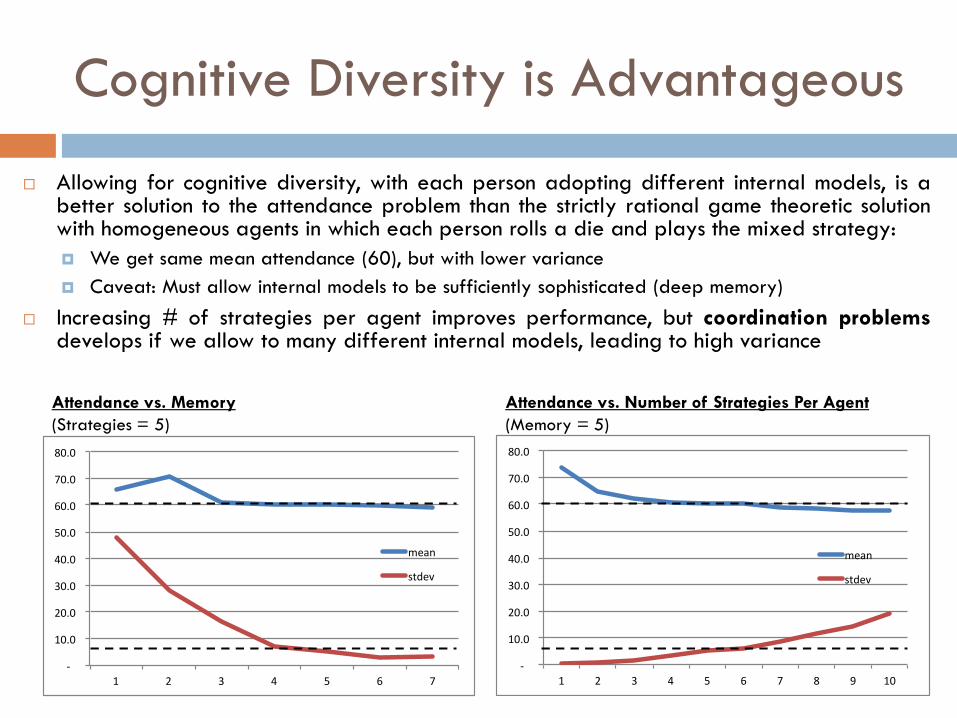
Allowing for cognitive diversity, with each person adopting different internal models, is abetter solution to the attendance problem than the strictly rational game theoretic solutionwith homogeneous agents in which each person rolls a die and plays the mixed strategy:
We get same mean attendance (60), but with lower variance
Caveat: Must allow internal models to be sufficiently sophisticated (deep memory)
Increasing # of strategies per agent improves performance, but coordination problemsdevelops if we allow to many different internal models, leading to high variance
Cognitive Diversity is Advantageous
Plan for Today’s Talk
Culture and Policy-Making
Culture as a CAS
Big Concepts and
Emergence
Signals and Boundaries
Internal Models
Reflexivity
Diversity
Ecology
Evolution
Illustrative Models
Lindgren, “Evolutionary
Phenomena in Simple Dynamics”
Cultural Ecologies
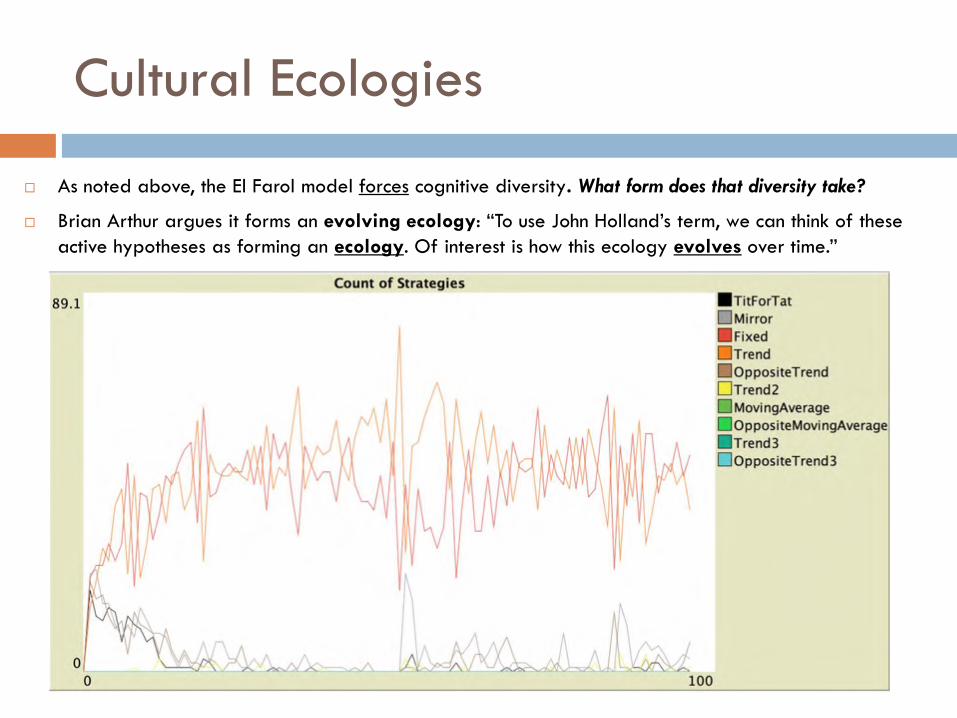
As noted above, the El Farol model forces cognitive diversity. What form does that diversity take?
Brian Arthur argues it forms an evolving ecology: “To use John Holland’s term, we can think of these
active hypotheses as forming an ecology. Of interest is how this ecology evolves over time.”
Cultural Ecologies
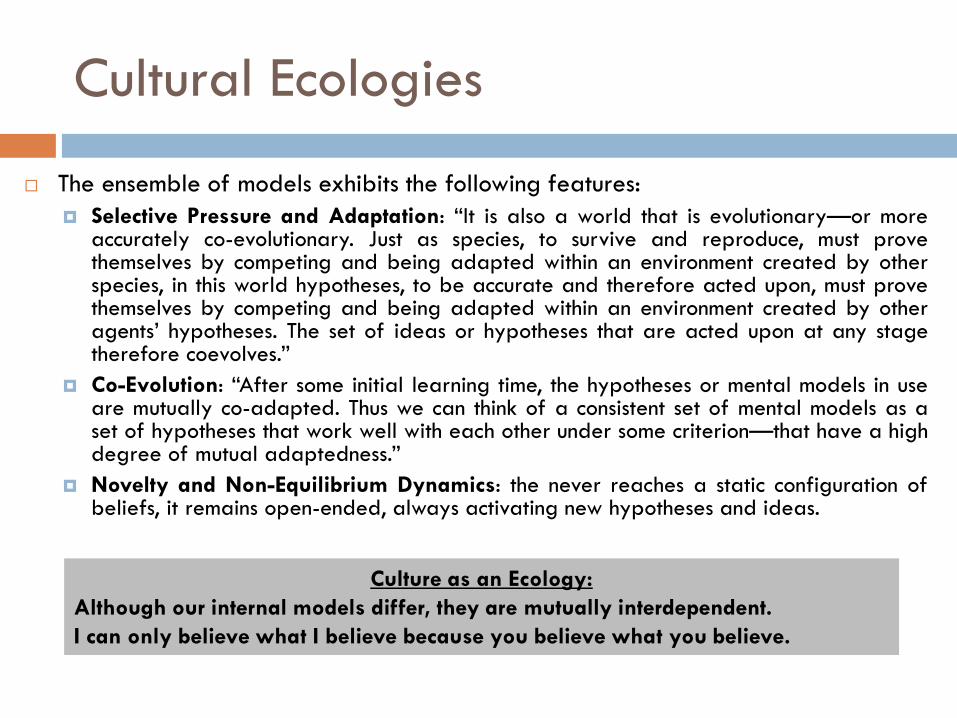
The ensemble of models exhibits the following features:
Selective Pressure and Adaptation: “It is also a world that is evolutionary—or moreaccurately co-evolutionary. Just as species, to survive and reproduce, must provethemselves by competing and being adapted within an environment created by otherspecies, in this world hypotheses, to be accurate and therefore acted upon, must provethemselves by competing and being adapted within an environment created by otheragents’ hypotheses. The set of ideas or hypotheses that are acted upon at any stagetherefore coevolves.”
Co-Evolution: “After some initial learning time, the hypotheses or mental models in useare mutually co-adapted. Thus we can think of a consistent set of mental models as aset of hypotheses that work well with each other under some criterion—that have a highdegree of mutual adaptedness.”
Novelty and Non-Equilibrium Dynamics: the never reaches a static configuration ofbeliefs, it remains open-ended, always activating new hypotheses and ideas.
Culture as an Ecology:
Although our internal models differ, they are mutually interdependent.
I can only believe what I believe because you believe what you believe.
Lindgren: Strategy Ecologies
Coop Defect
Coop (3,3) (0,5)
Defect (5,0) (1,1)
Prisoner’s Dilemma Payoff Matrix
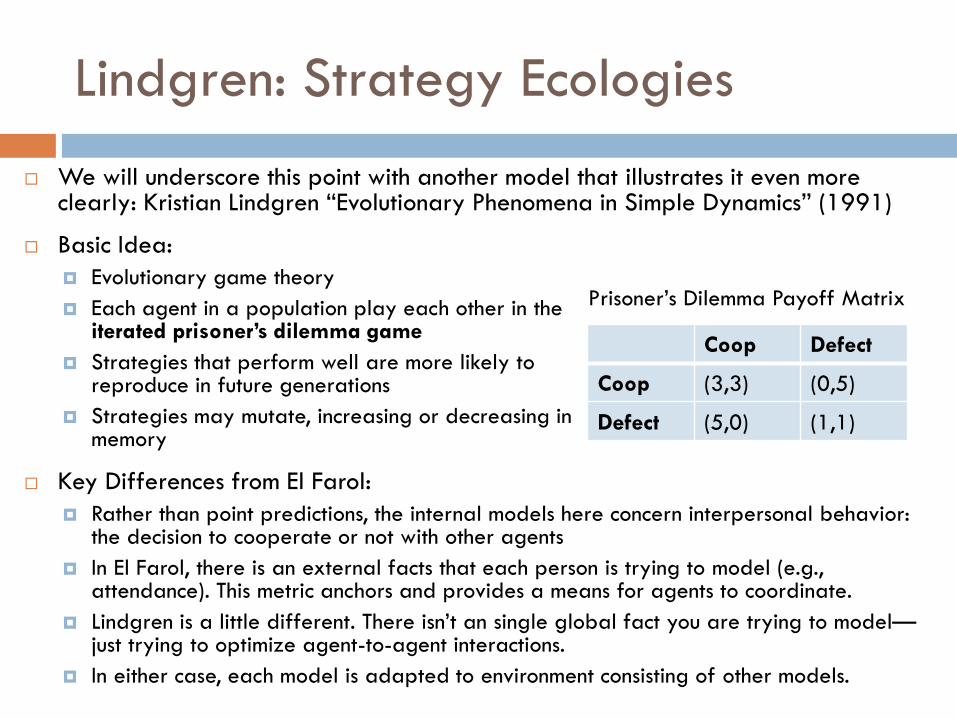
We will underscore this point with another model that illustrates it even more clearly: Kristian Lindgren “Evolutionary Phenomena in Simple Dynamics” (1991)
Key Differences from El Farol:
Rather than point predictions, the internal models here concern interpersonal behavior: the decision to cooperate or not with other agents
In El Farol, there is an external facts that each person is trying to model (e.g., attendance). This metric anchors and provides a means for agents to coordinate.
Lindgren is a little different. There isn’t an single global fact you are trying to model—just trying to optimize agent-to-agent interactions.
In either case, each model is adapted to environment consisting of other models.
Basic Idea:
Evolutionary game theory
Each agent in a population play each other in the iterated prisoner’s dilemma game
Strategies that perform well are more likely to reproduce in future generations
Strategies may mutate, increasing or decreasing in memory
Lindgren – Key Assumptions
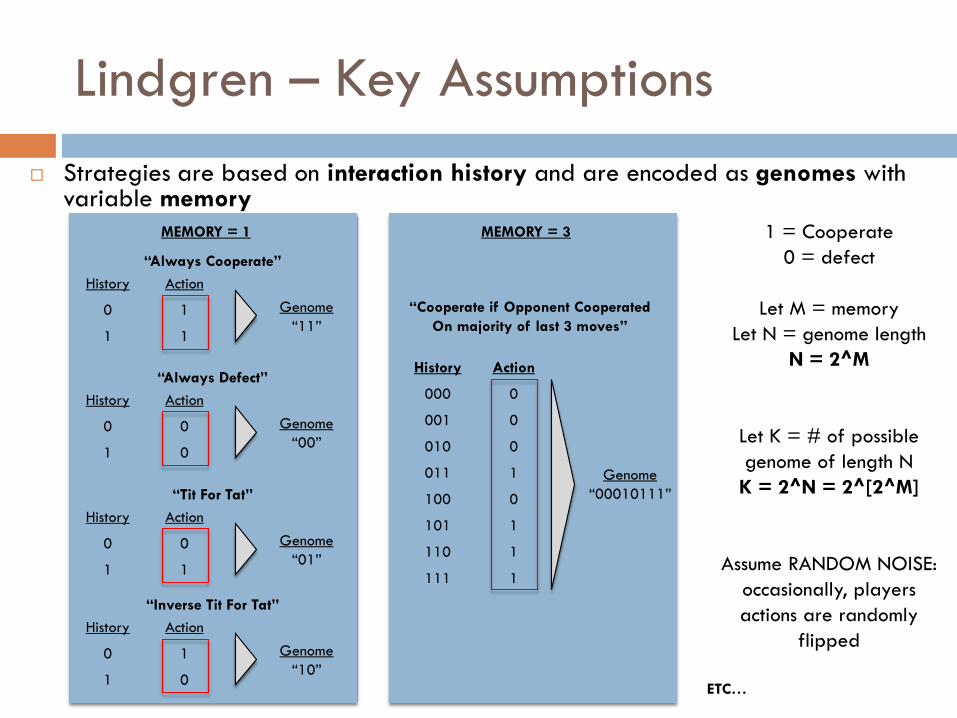
Strategies are based on interaction history and are encoded as genomes with variable memory
History Action
0 1
1 1
“Always Cooperate”
Genome
“11”
History Action
0 0
1 0
“Always Defect”
Genome
“00”
History Action
0 0
1 1
“Tit For Tat”
Genome
“01”
History Action
0 1
1 0
“Inverse Tit For Tat”
Genome
“10”
MEMORY = 1 MEMORY = 3
ETC…
“Cooperate if Opponent Cooperated
On majority of last 3 moves”
History Action
000 0
001 0
010 0
011 1
100 0
101 1
110 1
111 1
Genome
“00010111”
1 = Cooperate
0 = defect
Let M = memory
Let N = genome length
N = 2^M
Let K = # of possible
genome of length N
K = 2^N = 2^[2^M]
Assume RANDOM NOISE:
occasionally, players
actions are randomly
flipped
Lindgren – Key Assumptions
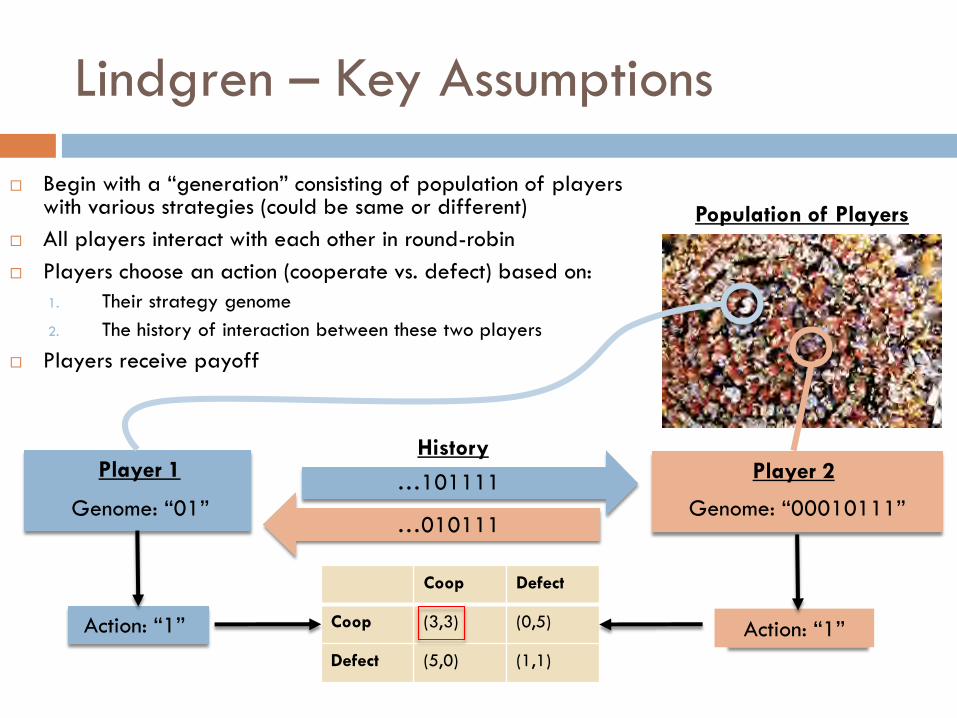
Begin with a “generation” consisting of population of players with various strategies (could be same or different)
All players interact with each other in round-robin
Players choose an action (cooperate vs. defect) based on:
1. Their strategy genome
2. The history of interaction between these two players
Players receive payoff
Player 1 Player 2
Genome: “01” Genome: “00010111”…101111
…010111
History
Coop Defect
Coop (3,3) (0,5)
Defect (5,0) (1,1)
Action: “1” Action: “1”
Population of Players
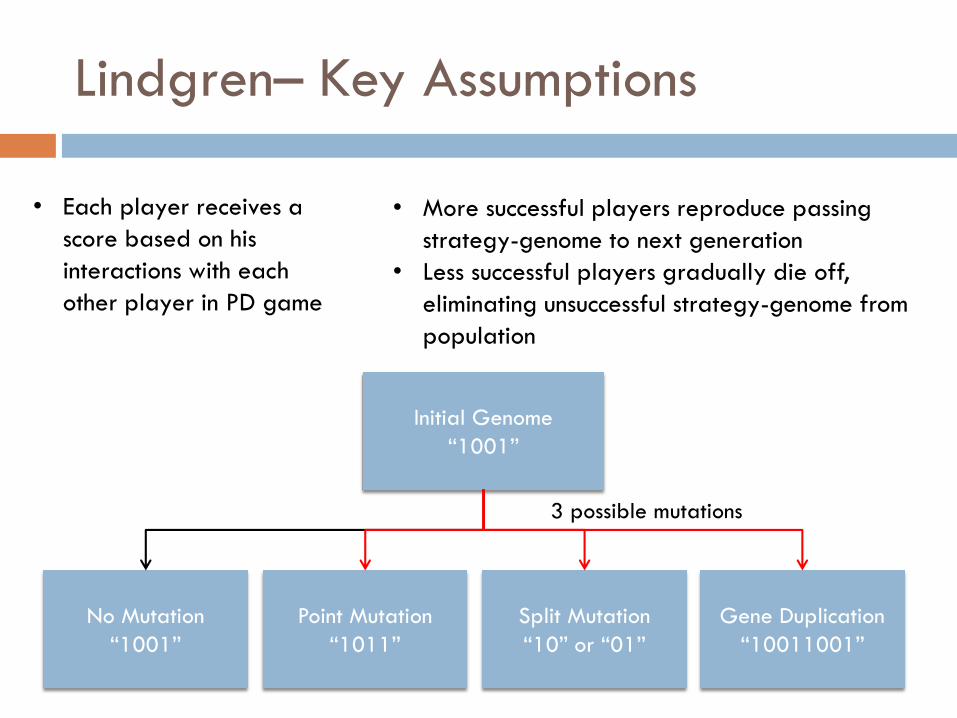
Lindgren– Key Assumptions
Initial Genome
“1001”
Point Mutation
“1011”
Split Mutation
“10” or “01”
Gene Duplication
“10011001”
No Mutation
“1001”
3 possible mutations
• Each player receives a
score based on his
interactions with each
other player in PD game
• More successful players reproduce passing
strategy-genome to next generation
• Less successful players gradually die off,
eliminating unsuccessful strategy-genome from
population
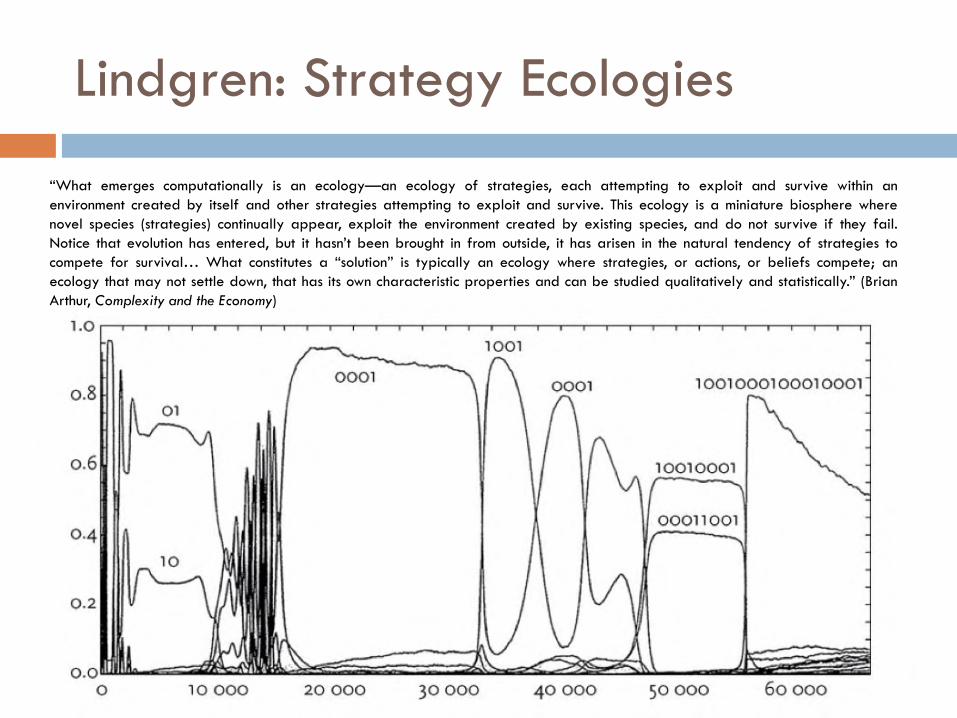
Lindgren: Strategy Ecologies
“What emerges computationally is an ecology—an ecology of strategies, each attempting to exploit and survive within an
environment created by itself and other strategies attempting to exploit and survive. This ecology is a miniature biosphere where
novel species (strategies) continually appear, exploit the environment created by existing species, and do not survive if they fail.
Notice that evolution has entered, but it hasn’t been brought in from outside, it has arisen in the natural tendency of strategies to
compete for survival… What constitutes a “solution” is typically an ecology where strategies, or actions, or beliefs compete; an
ecology that may not settle down, that has its own characteristic properties and can be studied qualitatively and statistically.” (Brian
Arthur, Complexity and the Economy)
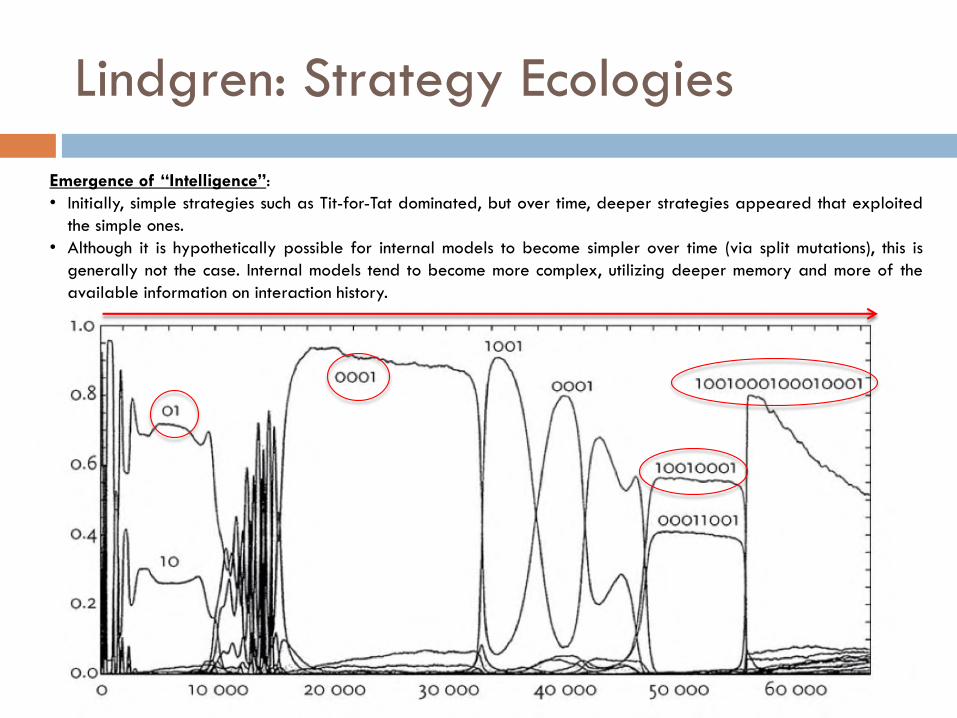
Lindgren: Strategy Ecologies
Emergence of “Intelligence”:
• Initially, simple strategies such as Tit-for-Tat dominated, but over time, deeper strategies appeared that exploited
the simple ones.
• Although it is hypothetically possible for internal models to become simpler over time (via split mutations), this is
generally not the case. Internal models tend to become more complex, utilizing deeper memory and more of the
available information on interaction history.
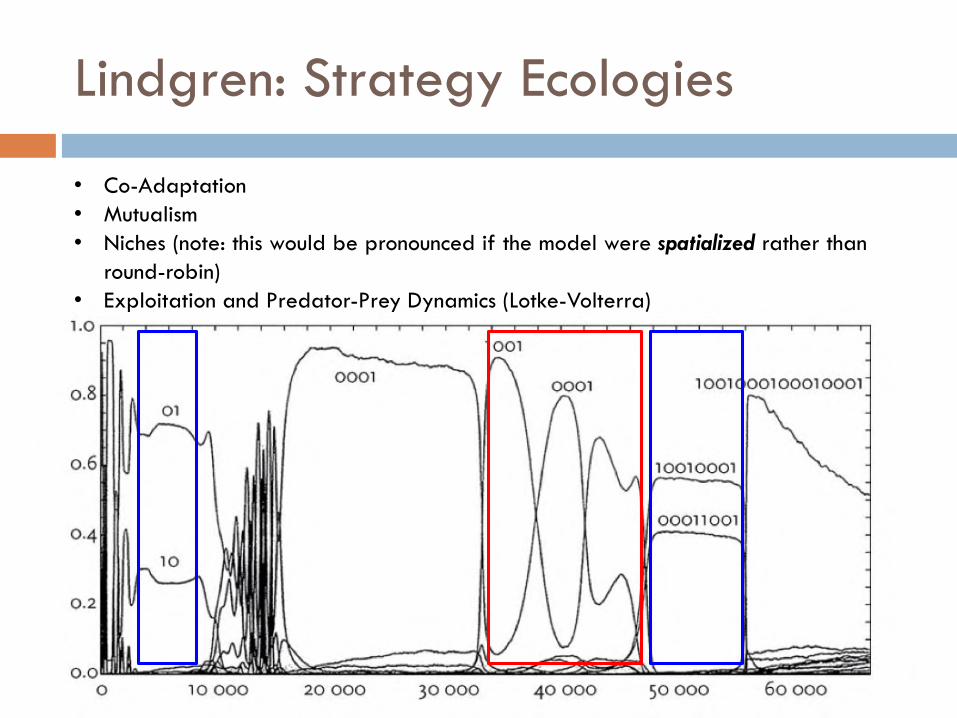
Lindgren: Strategy Ecologies
• Co-Adaptation
• Mutualism
• Niches (note: this would be pronounced if the model were spatialized rather than
round-robin)
• Exploitation and Predator-Prey Dynamics (Lotke-Volterra)
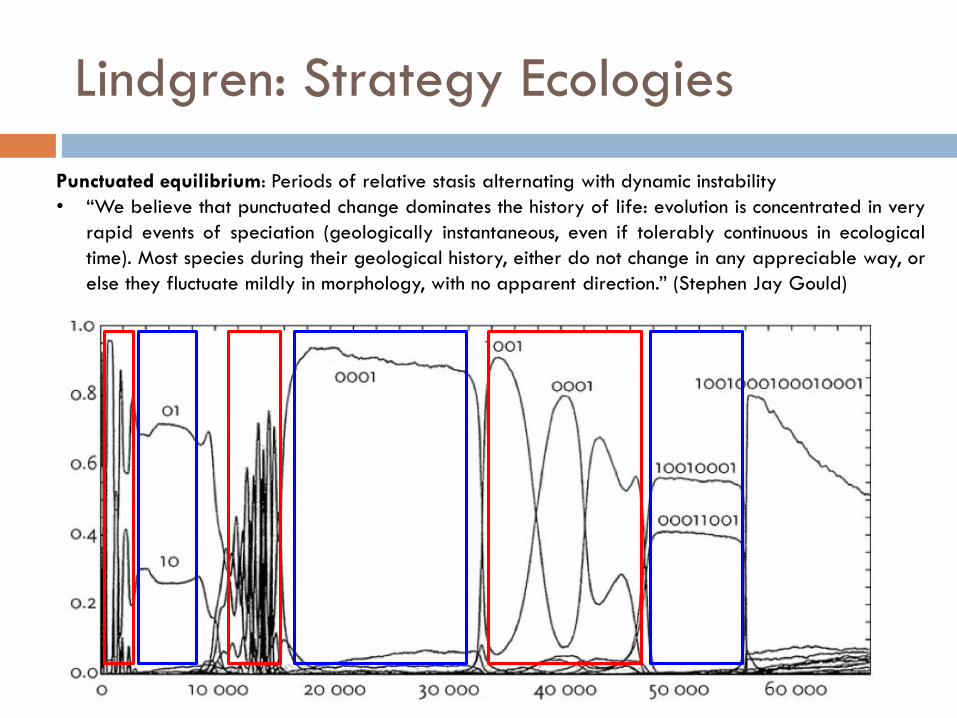
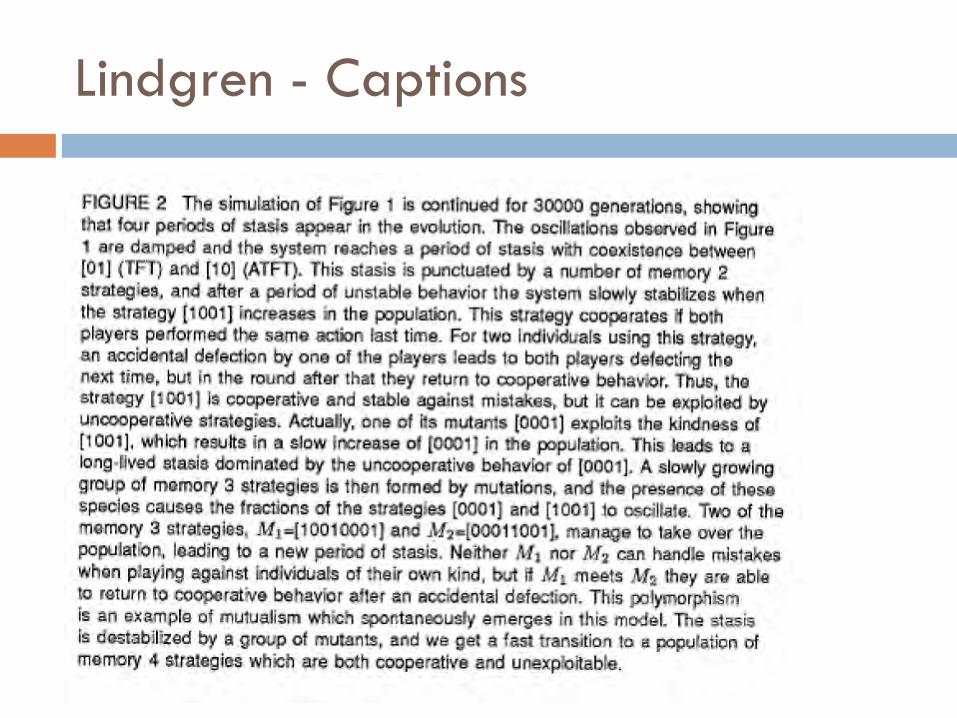
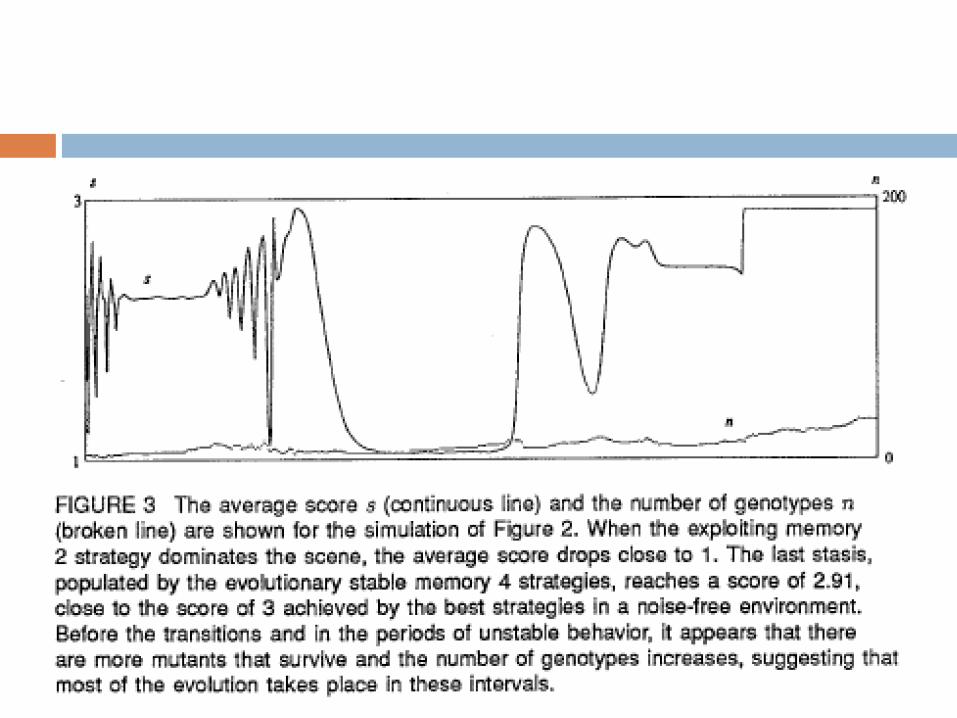
Lindgren: Strategy Ecologies
Punctuated equilibrium: Periods of relative stasis alternating with dynamic instability
• “We believe that punctuated change dominates the history of life: evolution is concentrated in very
rapid events of speciation (geologically instantaneous, even if tolerably continuous in ecological
time). Most species during their geological history, either do not change in any appreciable way, or
else they fluctuate mildly in morphology, with no apparent direction.” (Stephen Jay Gould)
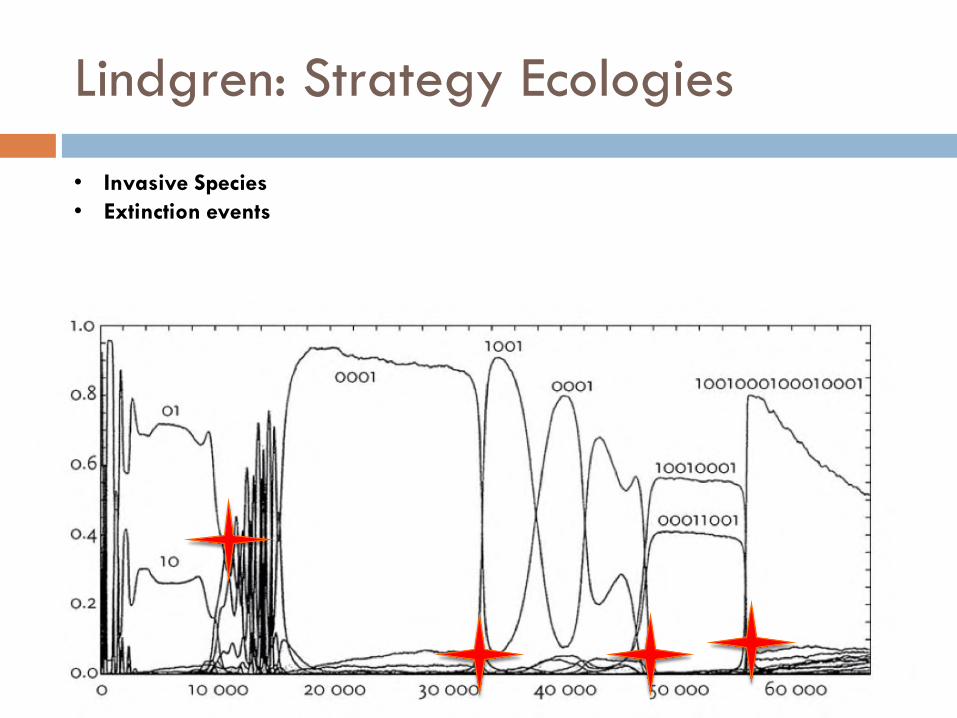
Lindgren: Strategy Ecologies
• Invasive Species
• Extinction events
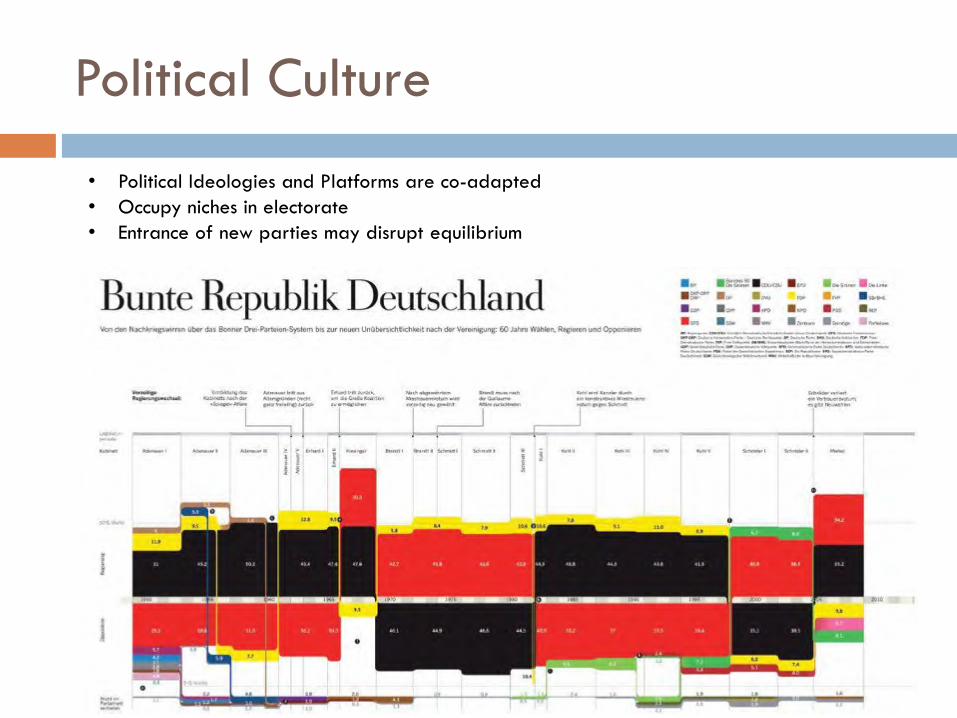
Political Culture
• Political Ideologies and Platforms are co-adapted
• Occupy niches in electorate
• Entrance of new parties may disrupt equilibrium
Summary & Conclusion
The Big Concepts:
Emergence
Signals and Boundaries
Internal Models and Reflexivity
Diversity
Ecology and Evolution
Highly relevant to understanding the complex nature of culture Policy-Implications
Small modifications to bottom-up behavior can be far more effective for changing system dynamics than top-down approaches
What we believe about the way
Topics
Appendix
Quick Example: School Integration
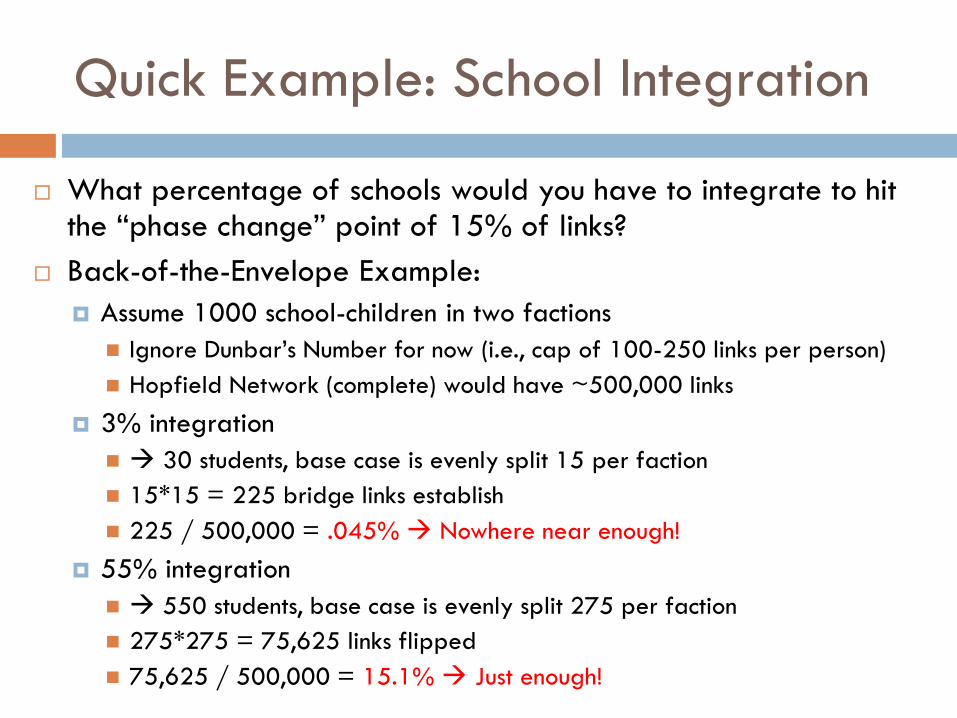
What percentage of schools would you have to integrate to hit the “phase change” point of 15% of links?
Back-of-the-Envelope Example:
Assume 1000 school-children in two factions
Ignore Dunbar’s Number for now (i.e., cap of 100-250 links per person)
Hopfield Network (complete) would have ~500,000 links
3% integration
30 students, base case is evenly split 15 per faction
15*15 = 225 bridge links establish
225 / 500,000 = .045% Nowhere near enough!
55% integration
550 students, base case is evenly split 275 per faction
275*275 = 75,625 links flipped
75,625 / 500,000 = 15.1% Just enough!
Appendix – Northern Ireland
“Contact Hypothesis” (Amir, 1969): establish direct contact between individuals realization of similarity enmity becomes amity
School integration programs in Northern Ireland:
“In Northern Ireland, therefore, policies based on the contact hypothesis have been implemented mainly through government-initiated educational interventions… Under [Education for Mutual Understanding], Protestant and Catholic schools are encouraged (by government-provided financial and logistical support) but not required to establish contacts between their pupils. As noted earlier, people in Northern Ireland already coexist on an interpersonal level; the con- flict exists at an intergroup level. One criticism leveled at many of these contact schemes, therefore, is that they have encouraged contact on an inter-individual basis rather than on an intergroup basis as suggested by SIT. A more radical strategy has involved the develop- ment of planned integrated schools, the aim of which is to have approximately equal numbers of Catholic and Protestant pupils, teachers, and school governors (Dunn, 1989). Based on charitable and parental support, the first of these schools was established in the early 1980s. Today, they number almost 40 but still account for less than 3% of the school population. Since 1989, integrated schools have received government funding. These initiatives, of course, are planned to make long-term changes to Northern Irish society. It will there- fore be some years before the impact of the programs can be properly evaluated.” (Cairns, 1998)
How effective is this likely to be? Is 3% integration enough? What percentage of schools would you need to integrate or enroll in EMU to establish new non-polarized stable states?”
Mozambique (Bartoli, 2010)
The Mozambique peace process is a rare and significant case of intervention that transformed a protracted, intractable conflict into a system of sustainable peace (Morozzo Della Rocca, 2003). After 16 years of an extremely violent civil war, a series of local and international interventions led to a successful transition to peace in 1992 (Mazula, 2002). Although the conflict had remained resistant to a number of peace initiatives and costly military actions for years, the activities of local leaders and the community of Sant’Egidio, an Italian Catholic nongovernmental organization (NGO), ultimately brought democracy and peace to the country (Bartoli, 2005; Morozzo Della Rocca, 2003). Since then, Mozambique has become a stable, democratic nation with free elections and spectacular economic growth. What is remarkable about this case is that the transformation led to durable peace (Weimer, 2004).
“Probably the most important of these catalysts was Jamie Pedro Goncalves, Catholic Archbishop of Beira. One day he accepted a highly dangerous invitation to meet with Alfonso Dhlakama, the Renamo leader, who was at the time isolated from other key figures in the conflict. Although the archbishop was never a Renamosupporter, and stayed in direct contact with the Frelimo government, he managed to establish a stable platform for communication outside the enmity system, as the two men happened to speak Ndau, the same ethnic language. Later, Archbishop Gonclalves became one of the four mediators in the formal negotiations that ended the civil war.
“Our hypothesis is that three factors were critical for his success as a mediator. First, he internalized both sides of the conflict, as he shared con- tradictorycharacteristics with the two opponents in the conflict. Whereas most bishops in Mozambique at that time were White, he was one of the first native, Black bishops, nominated after the Catholic church had intro- duced a very consistent policy of having Indigenous bishops appointed after Vatican Council II. Despite being a Catholic (which the Frelimo govern- ment associated with the colonialist Portuguese), he worked assiduously to have good working relationships with the Communist Frelimo party, also helping to ease tensions between religious communities and the government. Educated both in Mozambique and abroad, he had been exposed to a variety of cultural and social settings. However, he always maintained a strong sense of his local roots. He spoke many ethnic languages, and was able to easily communicate with diverse communities of Beira, the second largest city in Mozambique.
“Goncalves played a central role in the local society: Many people shared with him their experiences of the conflict, which made him a focal point or, in network terms, a connector (Barabasi, 2002). This, in turn, incrementally developed his desire for a solution: The more people he talked to, the more he felt obliged to act proactively to find peace. Instead of becoming an advocate for an a priori solution, he started explor- ing the possibilities for peace emerging from the parties themselves. He welcomed new ideas and transmitted them, facilitating communication between the two parties. His own search was the basis for the conciliatory perspective shared first with other Catholic bishops in Mozambique and then within a growing network of supporters.
“The social network of an enmity system consists of strong, positive links among members within each party and strong, negative links with members of the opposing party. Both types of links pressure each individual to have opinions that are the same within each group and opposing those of the other group. The distribution of opinions is the same as the structure of social ties when the system is fully coherent. Any changes in one’s opinions are ful ly counteracted by the joint pressure of one’s own group and the tend- ency to have opinions opposite to the other group. On the other hand, a catalyst is connected by positive links to each of the groups. Internalizing both sides of the conflict, a catalyst is able to connect to each of them. The existence of an individual linked by positive links to opposing sides destroys the system’s coherence. In essence, the role of a catalyst is to decrease the strength of the forces that freeze the system by disrupting the coherence inside each group. Moreover, the catalyst provides a channel of communication. This opens up the system to both internal and external influences, which can pave the way for defreezing the enmity system and restoration of its adaptive functions.
Consequently, endogenous actors can potentially be much more effective than mediators coming from the out- side, which may explain why outside interventions often fail in their attempts to resolve more intractable conflicts (Kriesberg, 2005).
Weak mediators, not perceived as a threat or a source of pressure, get attached to their social network more easily as they form positive connec- tions with both sides of the conflict. As a consequence, they significantly disrupt the coherence of the enmity system, defreezing it (Hopfield, 1982; Kunda & Thagard, 1996; Thagard, 1989). As a result, the system can begin to move again and relax internal pressures. The main difference is that the catalyst comes from within the system. For a mediator who is outside of the system initially, the establishment of social ties with both parties in conflict is of critical importance for this mechanism to work.
Appendix – Goncalves in Mozambique
Appendix - Bercovitch
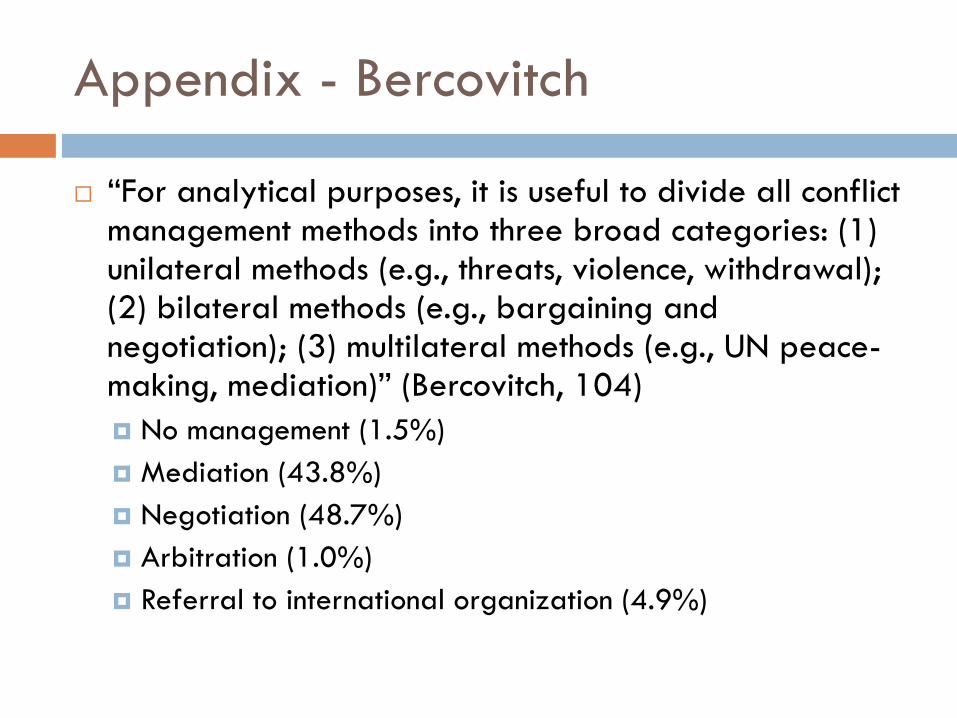
“For analytical purposes, it is useful to divide all conflict management methods into three broad categories: (1) unilateral methods (e.g., threats, violence, withdrawal); (2) bilateral methods (e.g., bargaining and negotiation); (3) multilateral methods (e.g., UN peace-making, mediation)” (Bercovitch, 104)
No management (1.5%)
Mediation (43.8%)
Negotiation (48.7%)
Arbitration (1.0%)
Referral to international organization (4.9%)
Immunity
Immunization strategies
Network resilience knock-out strategies (e.g., power
grid or computer airport attacks)
Internal Weld vs. External Ambassador
Compare using existing node as weld (e.g.,
Goncalves) vs. introducing a new node (external
intervention, e.g., UN) – are the dynamics different?
Using Genetic Algorithms to Search the
Rest of the Strategy Space
Example of GA results for the 8-node network
Try to interpret by looking at what links it has chosen to flip
How the GA strategy compares to (1) bridge links and
(2) ambassador / weld strategy have them
compete, as Axelrod did with Tit-for-Tat (or start with
ambassador strategy and then mutate / cross-breed it)
Phase Change Behavior
The phase change behavior predicted by the
Hopfield model may have empirical analogues
Example: Mozambique
There was an extended period of low level mediation
(link-flipping below threshold), with seemingly no impact
on the level polarization
Then, the threshold is hit for phase change and suddenly
the stable states are changed
Takeaway: if the link-switchings occur gradually, it may
appear as though they are having no effect, then the
conflict is “suddenly” resolved
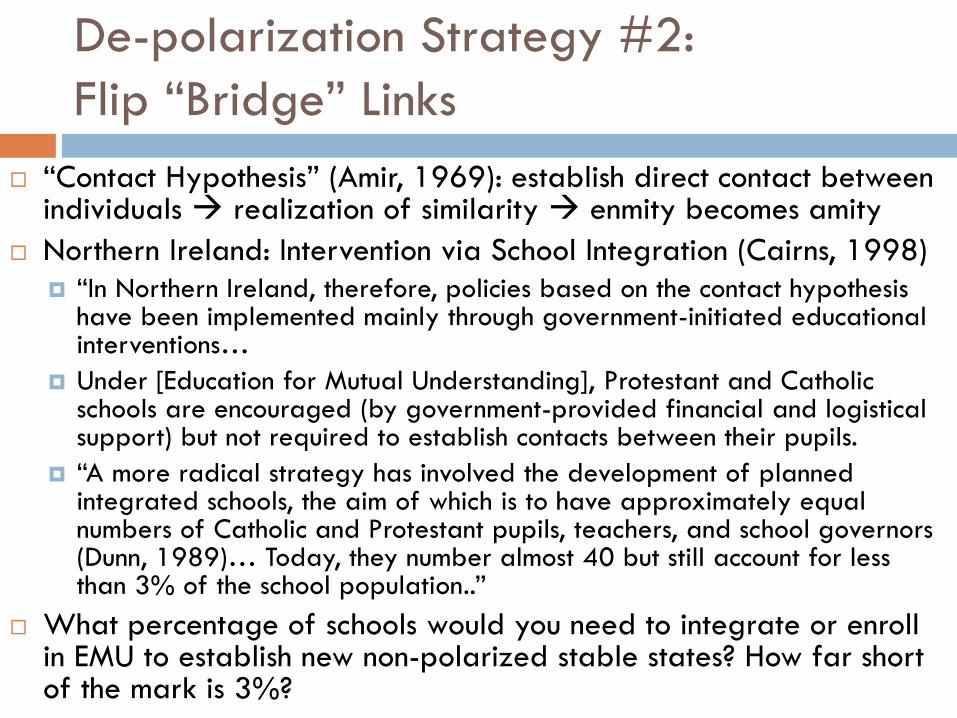
De-polarization Strategy #2:
Flip “Bridge” Links
“Contact Hypothesis” (Amir, 1969): establish direct contact between individuals realization of similarity enmity becomes amity
Northern Ireland: Intervention via School Integration (Cairns, 1998)
“In Northern Ireland, therefore, policies based on the contact hypothesis have been implemented mainly through government-initiated educational interventions…
Under [Education for Mutual Understanding], Protestant and Catholic schools are encouraged (by government-provided financial and logistical support) but not required to establish contacts between their pupils.
“A more radical strategy has involved the development of planned integrated schools, the aim of which is to have approximately equal numbers of Catholic and Protestant pupils, teachers, and school governors (Dunn, 1989)… Today, they number almost 40 but still account for less than 3% of the school population..”
What percentage of schools would you need to integrate or enroll in EMU to establish new non-polarized stable states? How far short of the mark is 3%?
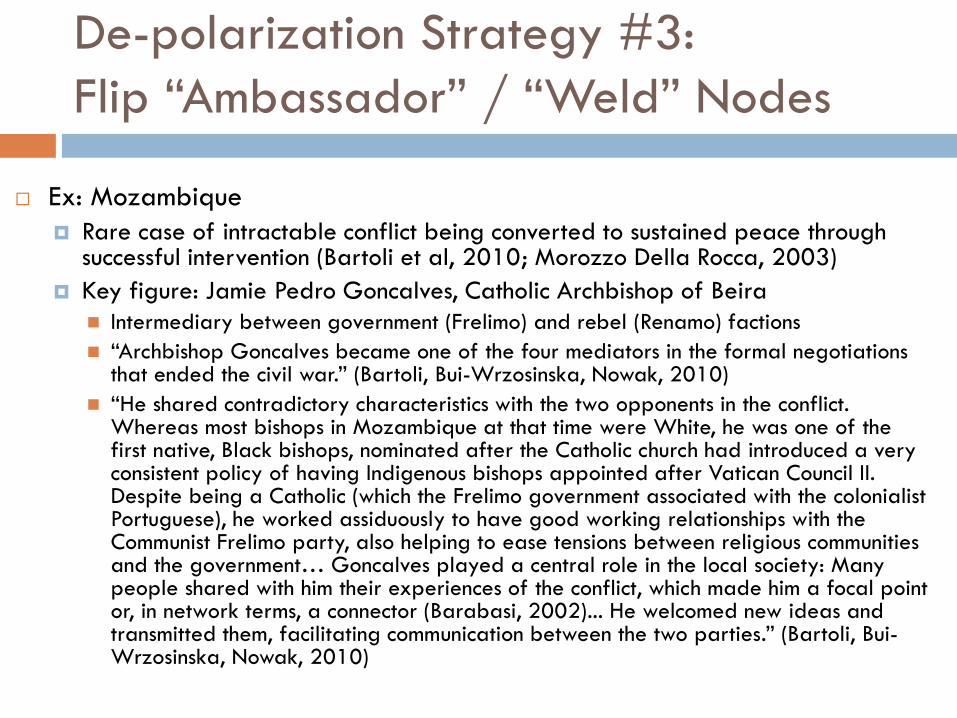
Ex: Mozambique
Rare case of intractable conflict being converted to sustained peace through successful intervention (Bartoli et al, 2010; Morozzo Della Rocca, 2003)
Key figure: Jamie Pedro Goncalves, Catholic Archbishop of Beira
Intermediary between government (Frelimo) and rebel (Renamo) factions
“Archbishop Goncalves became one of the four mediators in the formal negotiations that ended the civil war.” (Bartoli, Bui-Wrzosinska, Nowak, 2010)
“He shared contradictory characteristics with the two opponents in the conflict. Whereas most bishops in Mozambique at that time were White, he was one of the first native, Black bishops, nominated after the Catholic church had introduced a very consistent policy of having Indigenous bishops appointed after Vatican Council II. Despite being a Catholic (which the Frelimo government associated with the colonialist Portuguese), he worked assiduously to have good working relationships with the Communist Frelimo party, also helping to ease tensions between religious communities and the government… Goncalves played a central role in the local society: Many people shared with him their experiences of the conflict, which made him a focal point or, in network terms, a connector (Barabasi, 2002)... He welcomed new ideas and transmitted them, facilitating communication between the two parties.” (Bartoli, Bui-Wrzosinska, Nowak, 2010)
De-polarization Strategy #3:
Flip “Ambassador” / “Weld” Nodes
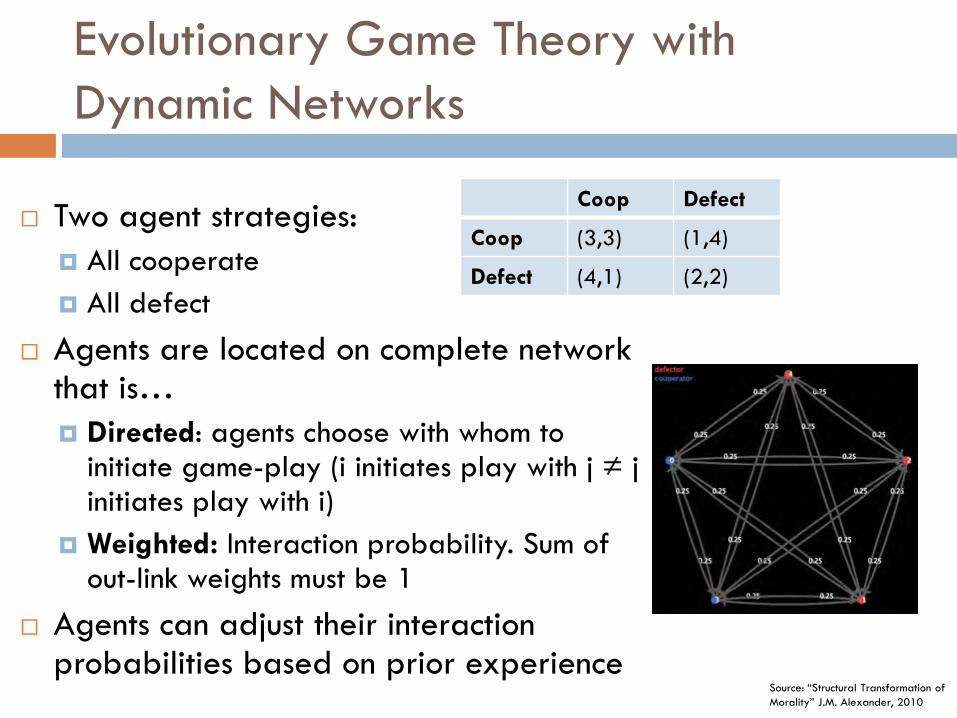
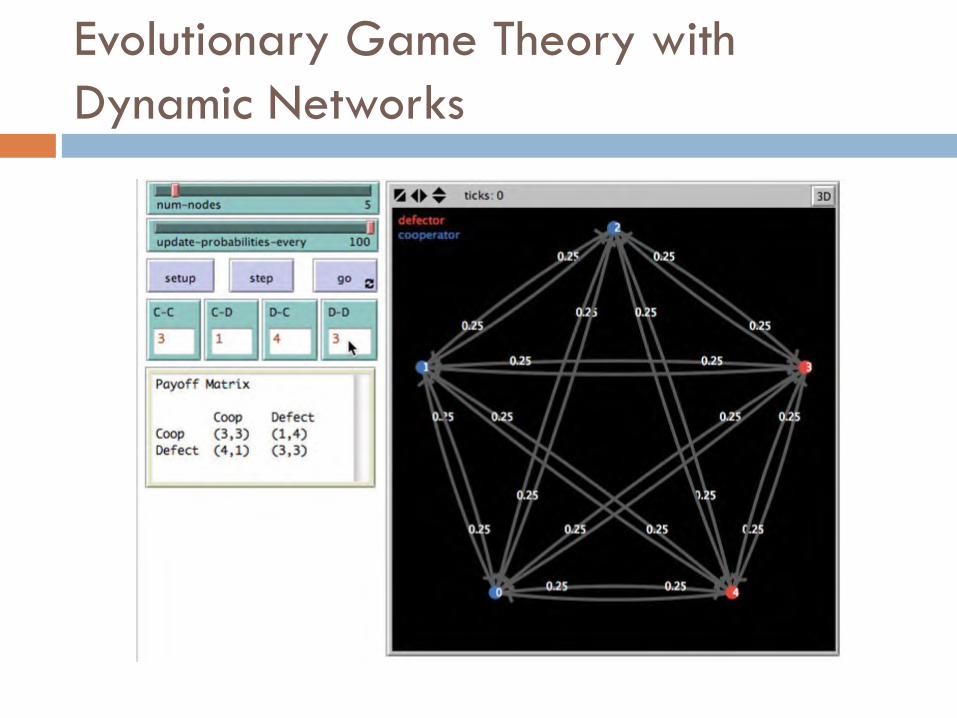
Evolutionary Game Theory with
Dynamic Networks
Two agent strategies:
All cooperate
All defect
Agents are located on complete network that is…
Directed: agents choose with whom to initiate game-play (i initiates play with j ≠ j initiates play with i)
Weighted: Interaction probability. Sum of out-link weights must be 1
Agents can adjust their interaction probabilities based on prior experience
Coop Defect
Coop (3,3) (1,4)
Defect (4,1) (2,2)
Source: “Structural Transformation of
Morality” J.M. Alexander, 2010
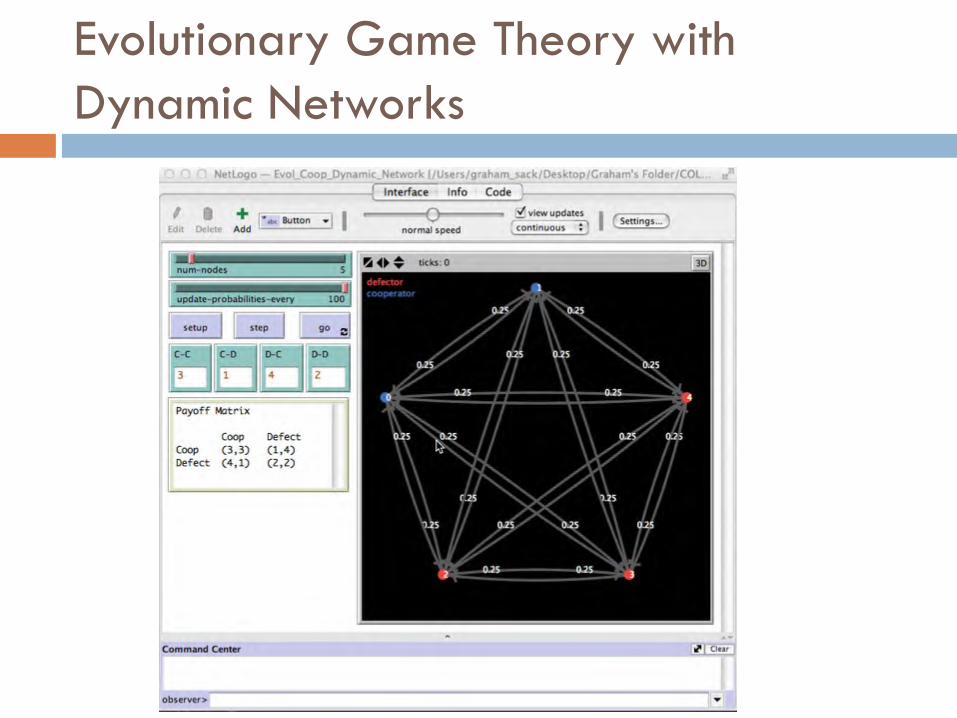
Evolutionary Game Theory with
Dynamic Networks
Evolutionary Game Theory with
Dynamic Networks
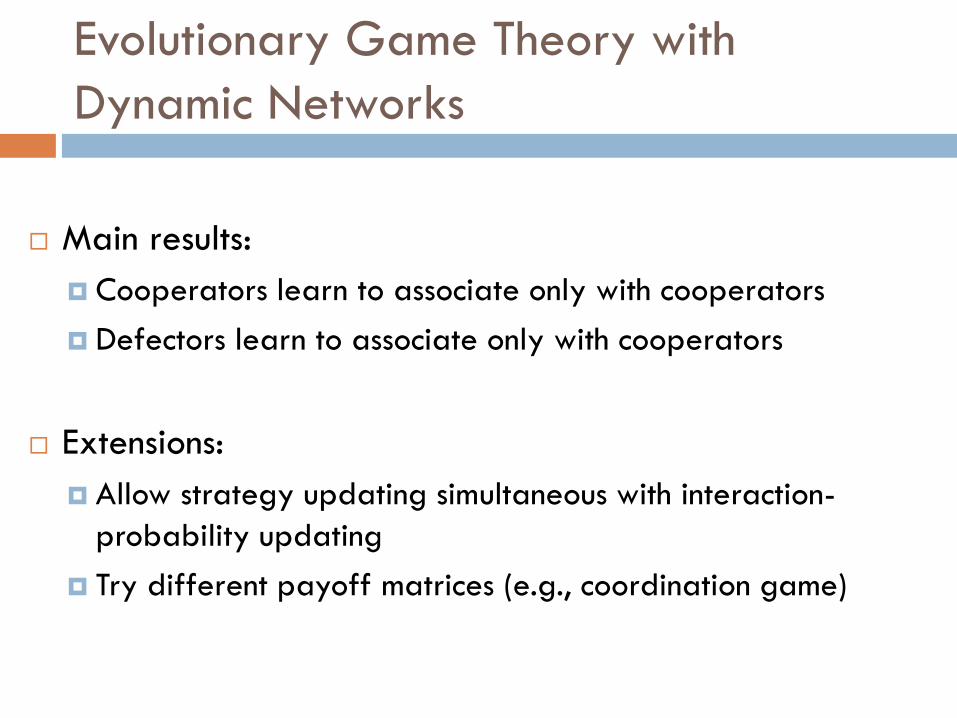
Main results:
Cooperators learn to associate only with cooperators
Defectors learn to associate only with cooperators
Extensions:
Allow strategy updating simultaneous with interaction-
probability updating
Try different payoff matrices (e.g., coordination game)
Evolutionary Game Theory with
Dynamic Networks
SUGARSCAPE
Lindgren - Captions
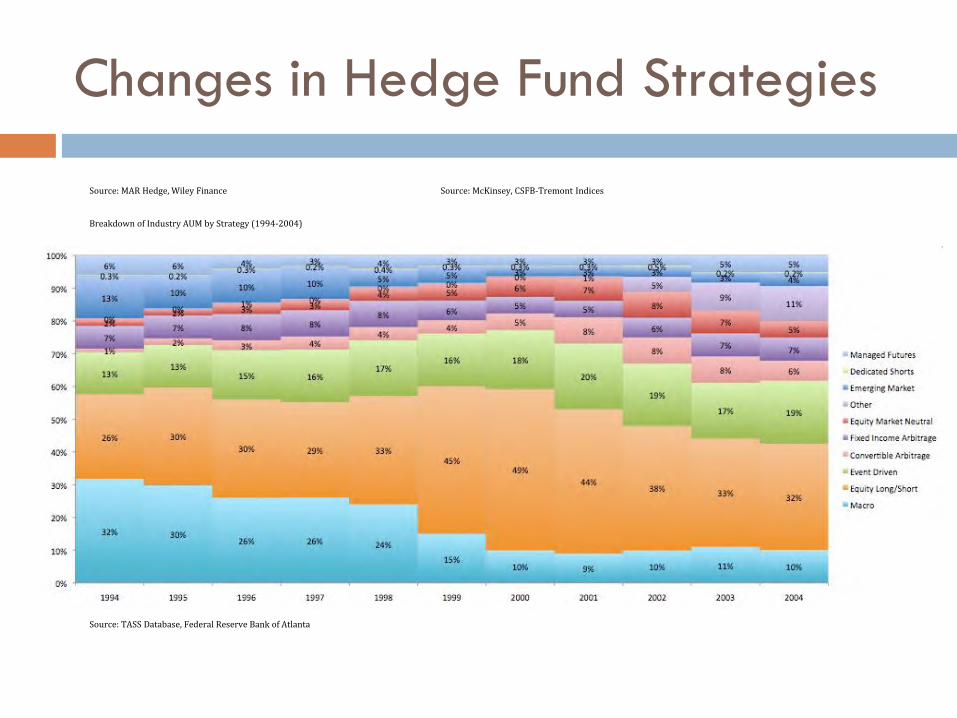
Changes in Hedge Fund Strategies
Breakdown of Industry AUM by Strategy (1994-2004)
Source: MAR Hedge, Wiley Finance Source: McKinsey, CSFB-Tremont Indices
Source: TASS Database, Federal Reserve Bank of Atlanta
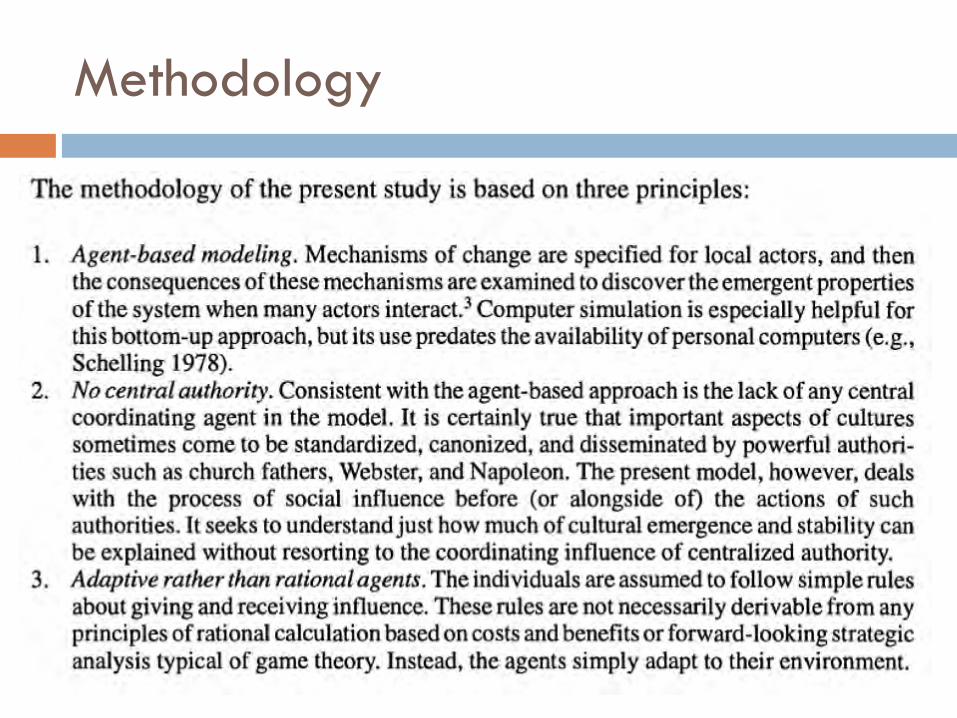
Methodology
HOPFIELD & BASINS
OF ATTRACTION OF
BELIEF
Topics
Hopfield Networks: Background
Belief Polarization
Belief De-Polarization
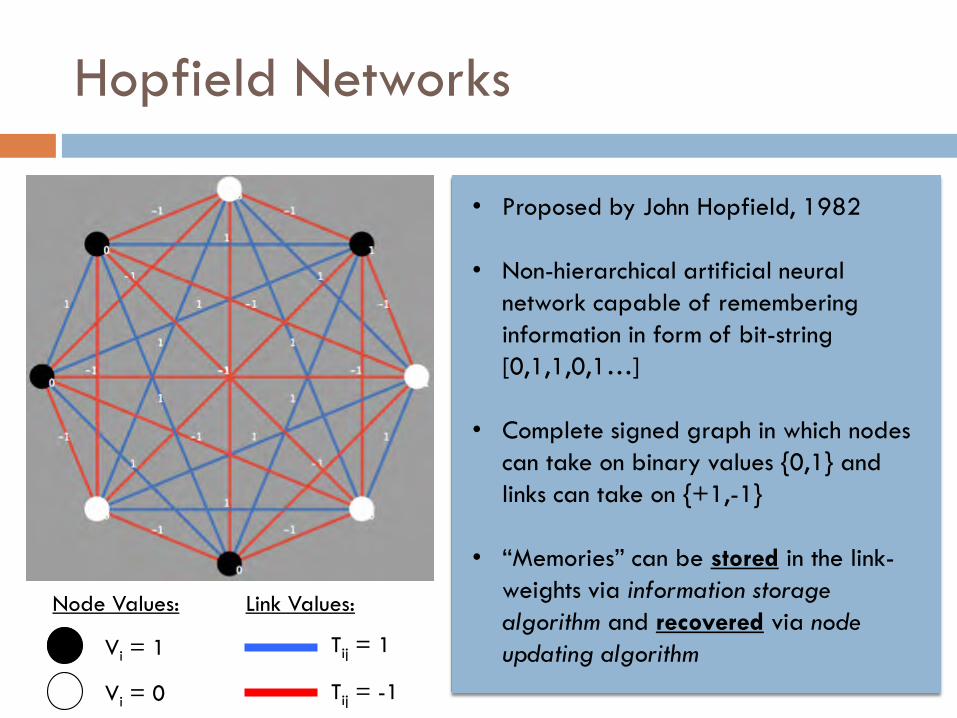
Hopfield Networks
Vi = 1
Vi = 0
Tij = 1
Tij = -1
Node Values: Link Values:
• Proposed by John Hopfield, 1982
• Non-hierarchical artificial neural
network capable of remembering
information in form of bit-string
[0,1,1,0,1…]
• Complete signed graph in which nodes
can take on binary values {0,1} and
links can take on {+1,-1}
• “Memories” can be stored in the link-
weights via information storage
algorithm and recovered via node
updating algorithm
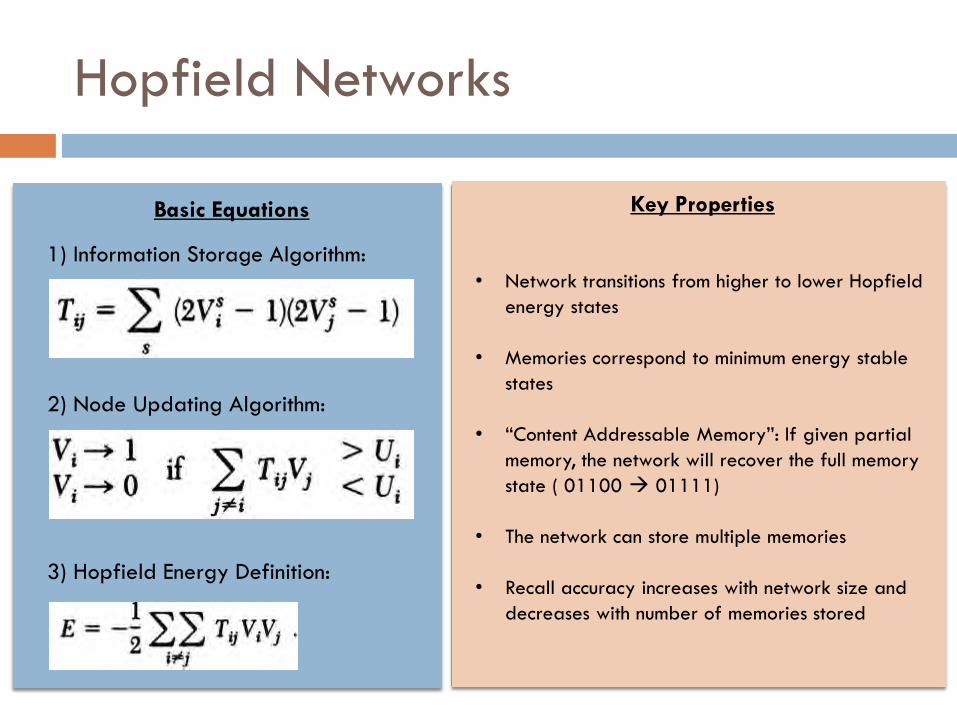
Hopfield Networks
Key Properties
• Network transitions from higher to lower Hopfield
energy states
• Memories correspond to minimum energy stable
states
• “Content Addressable Memory”: If given partial
memory, the network will recover the full memory
state ( 01100 01111)
• The network can store multiple memories
• Recall accuracy increases with network size and
decreases with number of memories stored
1) Information Storage Algorithm:
3) Hopfield Energy Definition:
2) Node Updating Algorithm:
Basic Equations
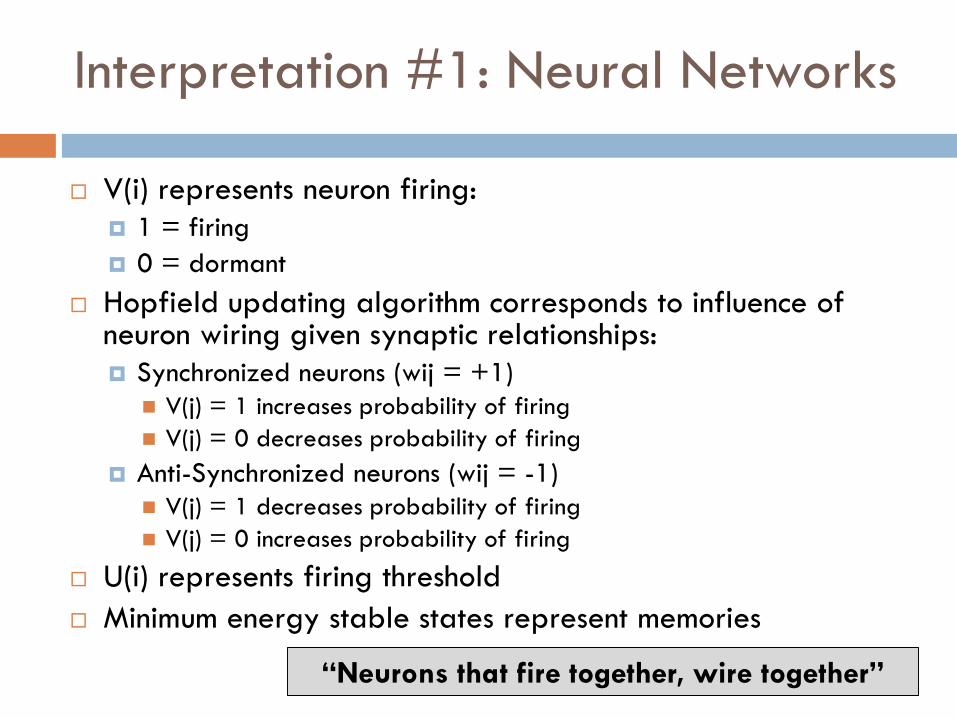
Interpretation #1: Neural Networks
V(i) represents neuron firing:
1 = firing
0 = dormant
Hopfield updating algorithm corresponds to influence of neuron wiring given synaptic relationships:
Synchronized neurons (wij = +1)
V(j) = 1 increases probability of firing
V(j) = 0 decreases probability of firing
Anti-Synchronized neurons (wij = -1)
V(j) = 1 decreases probability of firing
V(j) = 0 increases probability of firing
U(i) represents firing threshold
Minimum energy stable states represent memories
“Neurons that fire together, wire together”
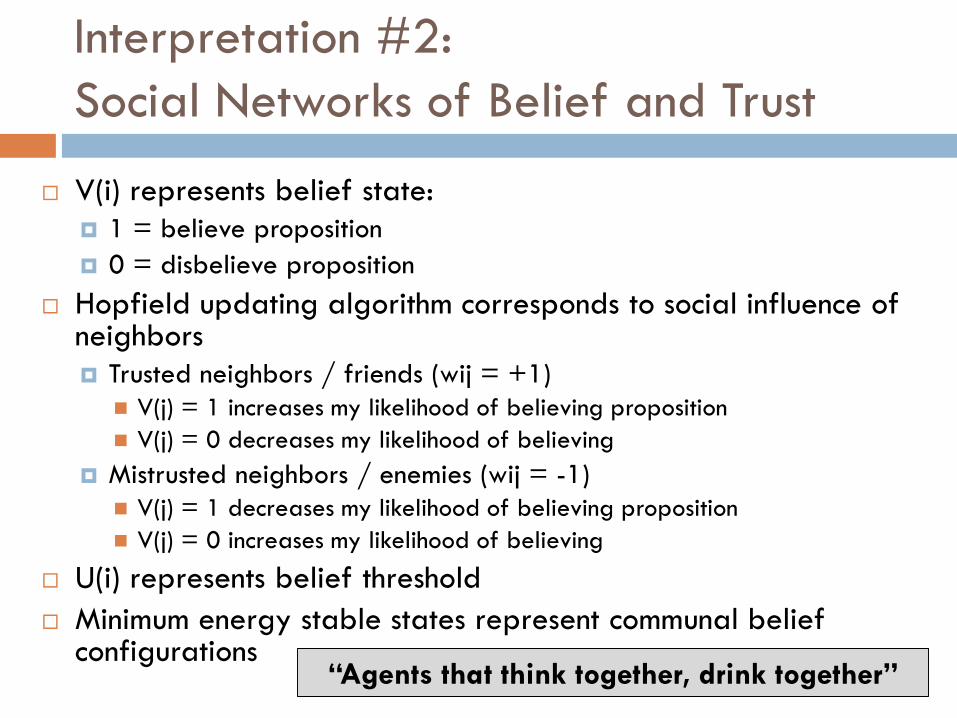
V(i) represents belief state:
1 = believe proposition
0 = disbelieve proposition
Hopfield updating algorithm corresponds to social influence of neighbors
Trusted neighbors / friends (wij = +1)
V(j) = 1 increases my likelihood of believing proposition
V(j) = 0 decreases my likelihood of believing
Mistrusted neighbors / enemies (wij = -1)
V(j) = 1 decreases my likelihood of believing proposition
V(j) = 0 increases my likelihood of believing
U(i) represents belief threshold
Minimum energy stable states represent communal belief configurations
Interpretation #2:
Social Networks of Belief and Trust
“Agents that think together, drink together”
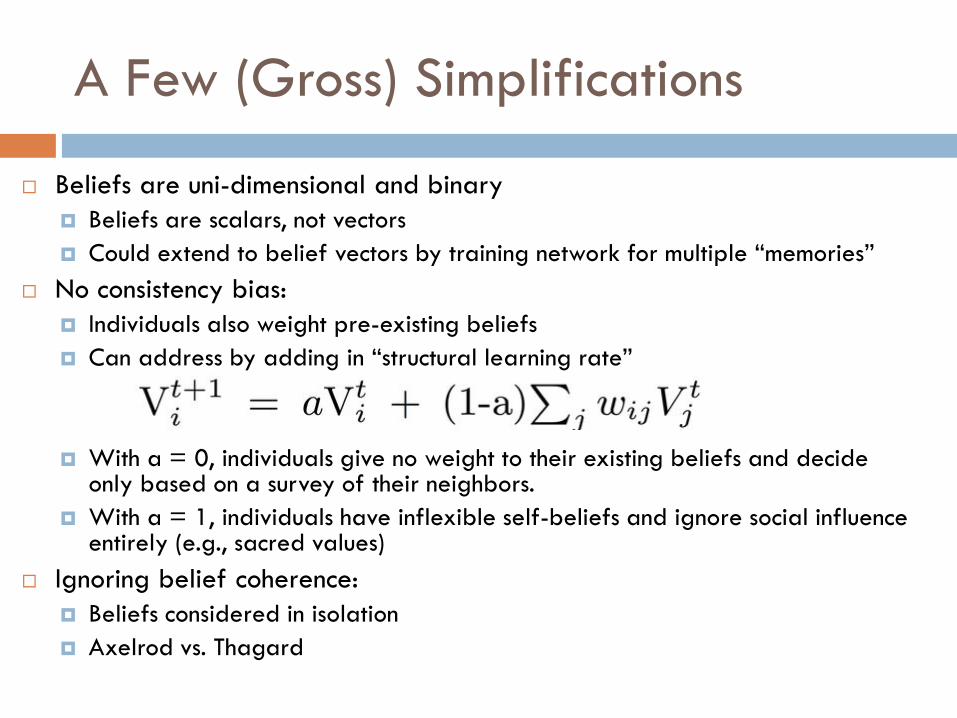
A Few (Gross) Simplifications
Beliefs are uni-dimensional and binary
Beliefs are scalars, not vectors
Could extend to belief vectors by training network for multiple “memories”
No consistency bias:
Individuals also weight pre-existing beliefs
Can address by adding in “structural learning rate”
With a = 0, individuals give no weight to their existing beliefs and decide only based on a survey of their neighbors.
With a = 1, individuals have inflexible self-beliefs and ignore social influence entirely (e.g., sacred values)
Ignoring belief coherence:
Beliefs considered in isolation
Axelrod vs. Thagard
Topics
Hopfield Networks: Background
Belief Polarization
Belief De-Polarization
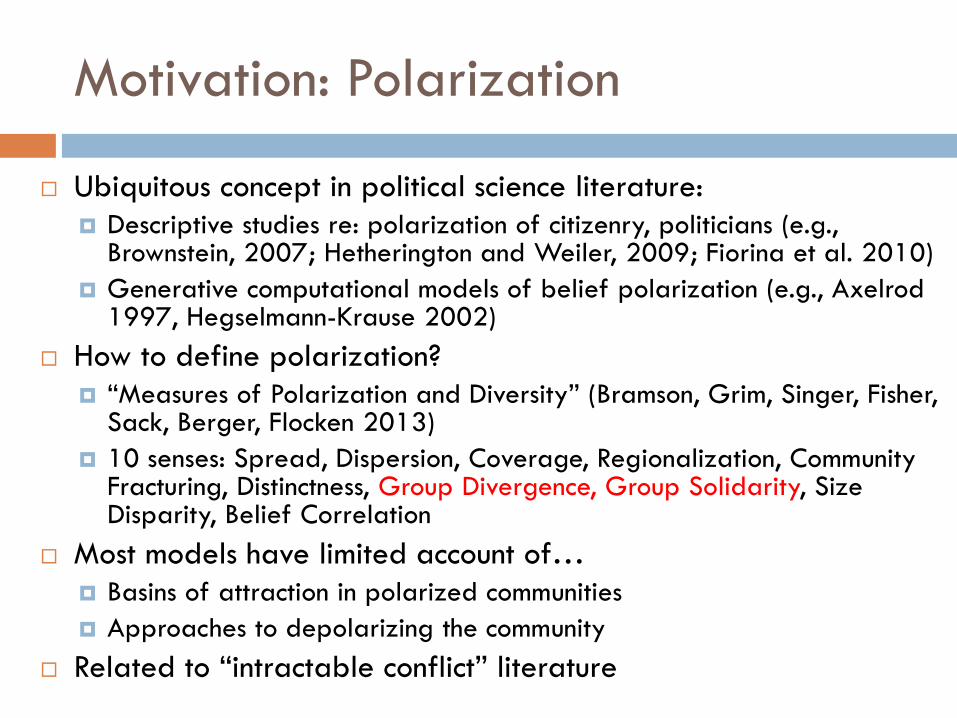
Motivation: Polarization
Ubiquitous concept in political science literature:
Descriptive studies re: polarization of citizenry, politicians (e.g., Brownstein, 2007; Hetherington and Weiler, 2009; Fiorina et al. 2010)
Generative computational models of belief polarization (e.g., Axelrod 1997, Hegselmann-Krause 2002)
How to define polarization?
“Measures of Polarization and Diversity” (Bramson, Grim, Singer, Fisher, Sack, Berger, Flocken 2013)
10 senses: Spread, Dispersion, Coverage, Regionalization, Community Fracturing, Distinctness, Group Divergence, Group Solidarity, Size Disparity, Belief Correlation
Most models have limited account of…
Basins of attraction in polarized communities
Approaches to depolarizing the community
Related to “intractable conflict” literature
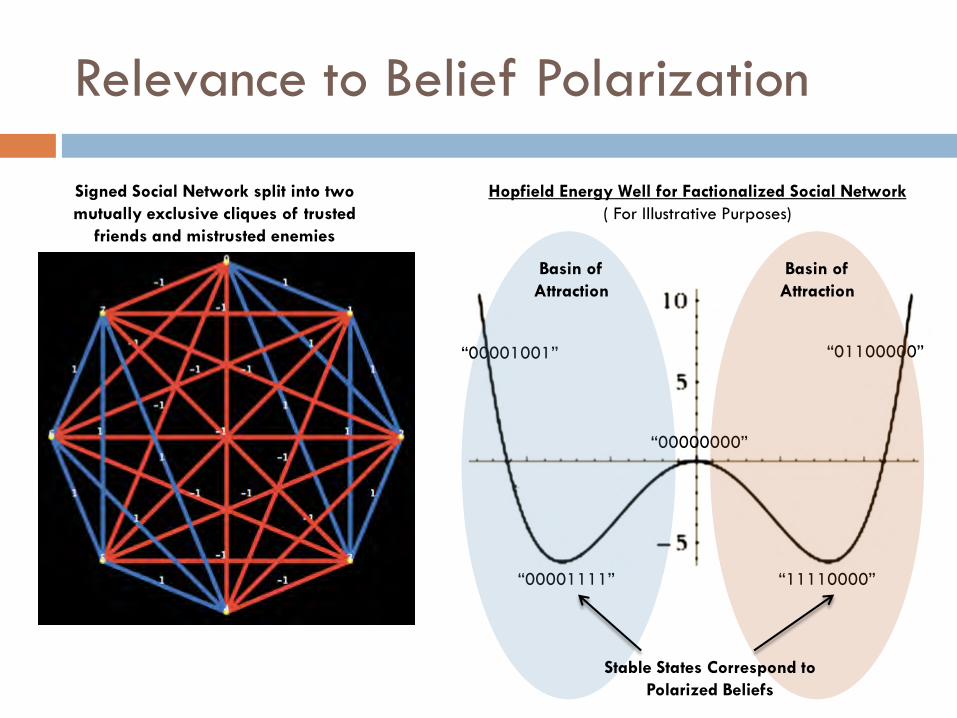
Relevance to Belief Polarization
“00001111” “11110000”
“00000000”
“00001001” “01100000”
Basin of
Attraction
Basin of
Attraction
Stable States Correspond to
Polarized Beliefs
Hopfield Energy Well for Factionalized Social Network
( For Illustrative Purposes)
Signed Social Network split into two
mutually exclusive cliques of trusted
friends and mistrusted enemies
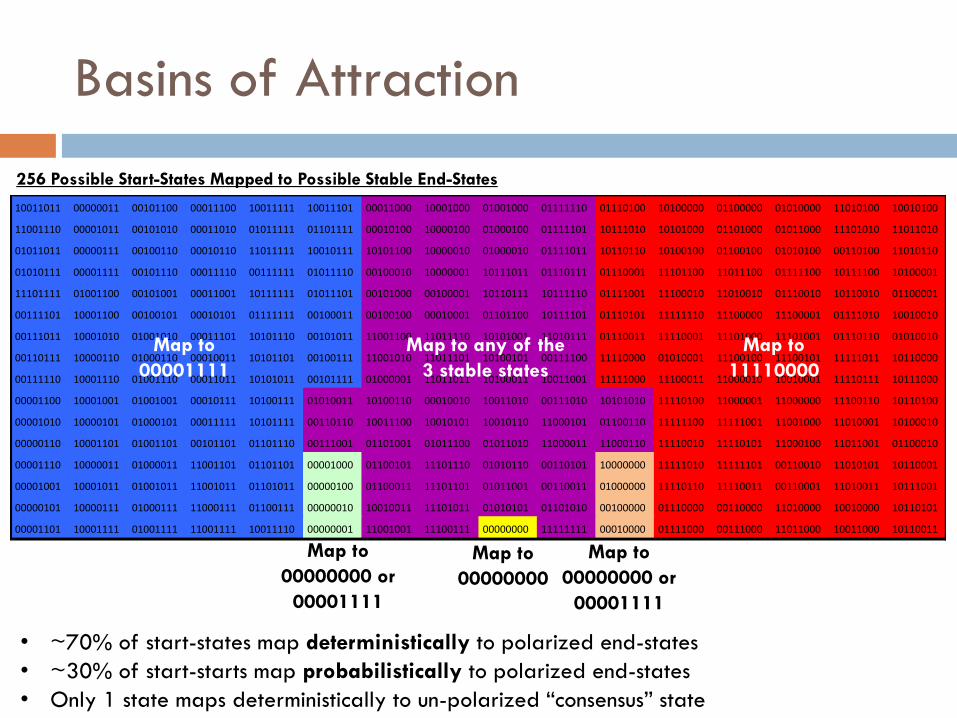
Basins of Attraction
10011011 00000011 00101100 00011100 10011111 10011101 00011000 10001000 01001000 01111110 01110100 10100000 01100000 01010000 11010100 10010100
11001110 00001011 00101010 00011010 01011111 01101111 00010100 10000100 01000100 01111101 10111010 10101000 01101000 01011000 11101010 11011010
01011011 00000111 00100110 00010110 11011111 10010111 10101100 10000010 01000010 01111011 10110110 10100100 01100100 01010100 00110100 11010110
01010111 00001111 00101110 00011110 00111111 01011110 00100010 10000001 10111011 01110111 01110001 11101100 11011100 01111100 10111100 10100001
11101111 01001100 00101001 00011001 10111111 01011101 00101000 00100001 10110111 10111110 01111001 11100010 11010010 01110010 10110010 01100001
00111101 10001100 00100101 00010101 01111111 00100011 00100100 00010001 01101100 10111101 01110101 11111110 11100000 11100001 01111010 10010010
00111011 10001010 01001010 00011101 10101110 00101011 11001100 11011110 10101001 11010111 01110011 11110001 11101000 11101001 01110110 01010010
00110111 10000110 01000110 00010011 10101101 00100111 11001010 11011101 10100101 00111100 11110000 01010001 11100100 11100101 11111011 10110000
00111110 10001110 01001110 00011011 10101011 00101111 01000001 11011011 10100011 10011001 11111000 11100011 11000010 10010001 11110111 10111000
00001100 10001001 01001001 00010111 10100111 01010011 10100110 00010010 10011010 00111010 10101010 11110100 11000001 11000000 11100110 10110100
00001010 10000101 01000101 00011111 10101111 00110110 10011100 10010101 10010110 11000101 01100110 11111100 11111001 11001000 11010001 10100010
00000110 10001101 01001101 00101101 01101110 00111001 01101001 01011100 01011010 11000011 11000110 11110010 11110101 11000100 11011001 01100010
00001110 10000011 01000011 11001101 01101101 00001000 01100101 11101110 01010110 00110101 10000000 11111010 11111101 00110010 11010101 10110001
00001001 10001011 01001011 11001011 01101011 00000100 01100011 11101101 01011001 00110011 01000000 11110110 11110011 00110001 11010011 10111001
00000101 10000111 01000111 11000111 01100111 00000010 10010011 11101011 01010101 01101010 00100000 01110000 00110000 11010000 10010000 10110101
00001101 10001111 01001111 11001111 10011110 00000001 11001001 11100111 00000000 11111111 00010000 01111000 00111000 11011000 10011000 10110011
BasinsofAttractionconvergingtostablestate: 00001111 11110000 00000000 Both11110000or00000000 11110000,00001111,or00000000Both00001111or00000000
Map to
00001111
Map to
00000000
Map to
00000000 or
00001111
Map to
00000000 or
00001111
Map to
11110000
Map to any of the
3 stable states
• ~70% of start-states map deterministically to polarized end-states
• ~30% of start-starts map probabilistically to polarized end-states
• Only 1 state maps deterministically to un-polarized “consensus” state
256 Possible Start-States Mapped to Possible Stable End-States
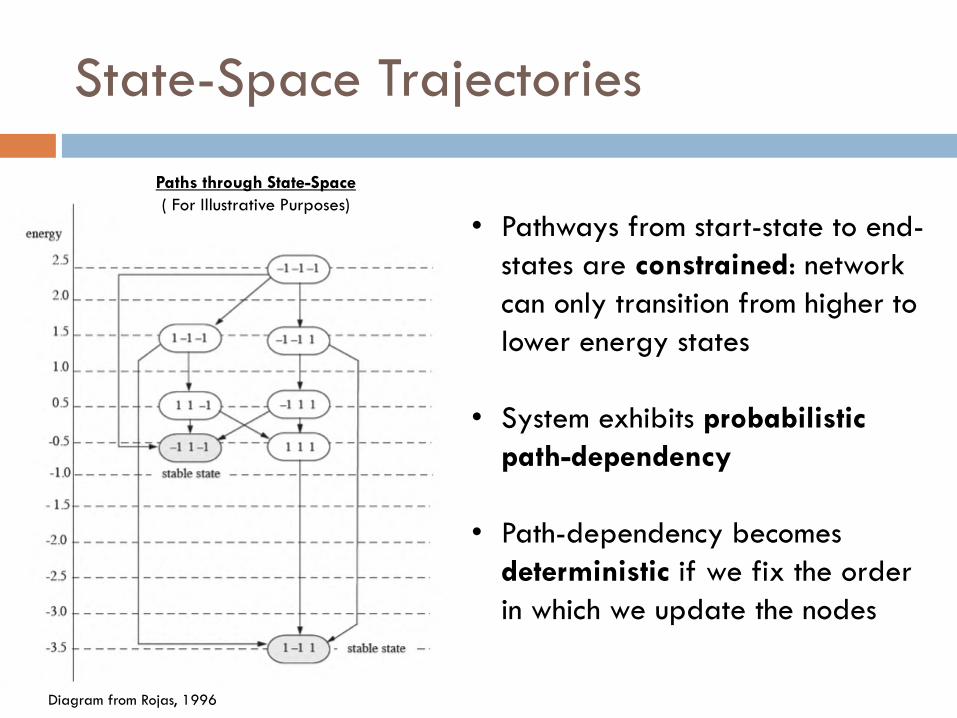
State-Space Trajectories
Diagram from Rojas, 1996
• Pathways from start-state to end-
states are constrained: network
can only transition from higher to
lower energy states
• System exhibits probabilistic
path-dependency
• Path-dependency becomes
deterministic if we fix the order
in which we update the nodes
Paths through State-Space
( For Illustrative Purposes)
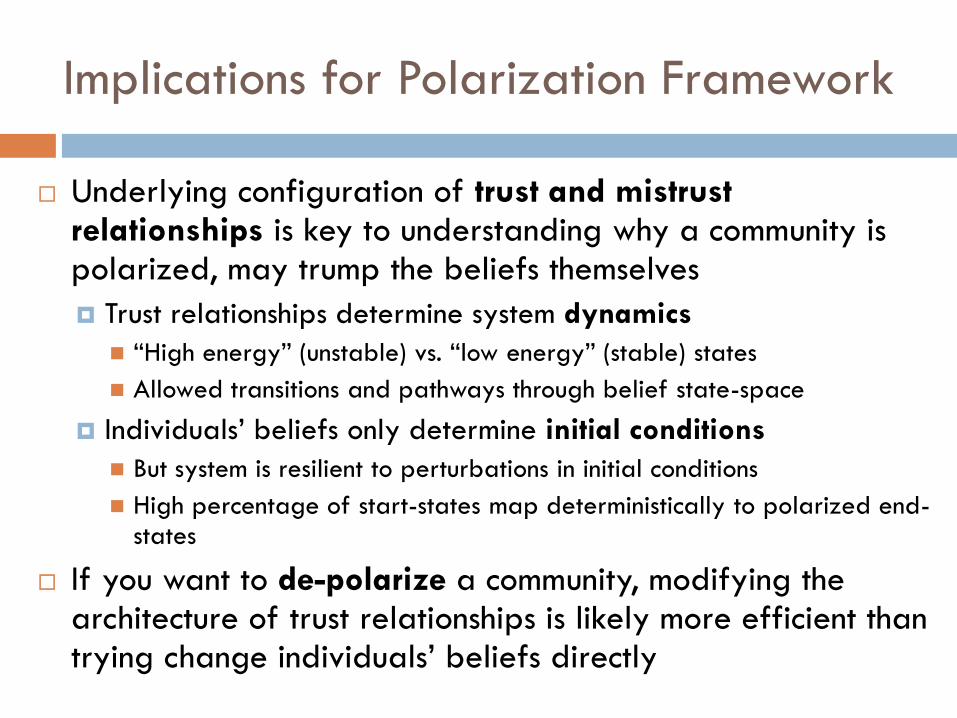
Implications for Polarization Framework
Underlying configuration of trust and mistrust relationships is key to understanding why a community is polarized, may trump the beliefs themselves
Trust relationships determine system dynamics
“High energy” (unstable) vs. “low energy” (stable) states
Allowed transitions and pathways through belief state-space
Individuals’ beliefs only determine initial conditions
But system is resilient to perturbations in initial conditions
High percentage of start-states map deterministically to polarized end-states
If you want to de-polarize a community, modifying the architecture of trust relationships is likely more efficient than trying change individuals’ beliefs directly
Topics
Hopfield Networks: Background
Belief Polarization
Belief De-Polarization
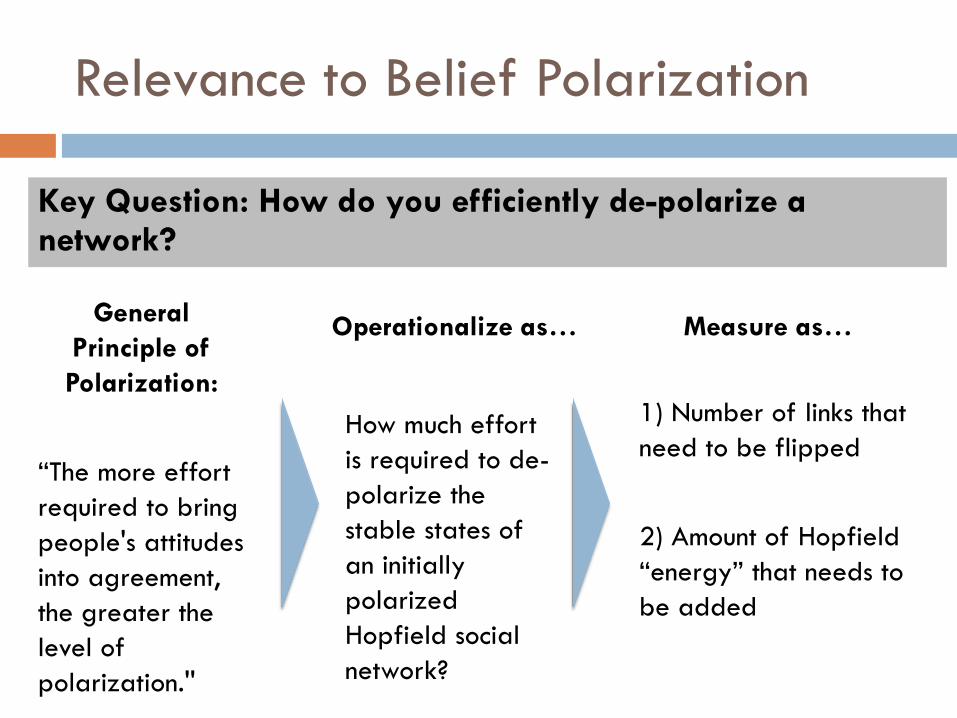
General
Principle of
Polarization:
“The more effort
required to bring
people's attitudes
into agreement,
the greater the
level of
polarization.''
Relevance to Belief Polarization
Operationalize as… Measure as…
How much effort
is required to de-
polarize the
stable states of
an initially
polarized
Hopfield social
network?
1) Number of links that
need to be flipped
2) Amount of Hopfield
“energy” that needs to
be added
Key Question: How do you efficiently de-polarize a network?
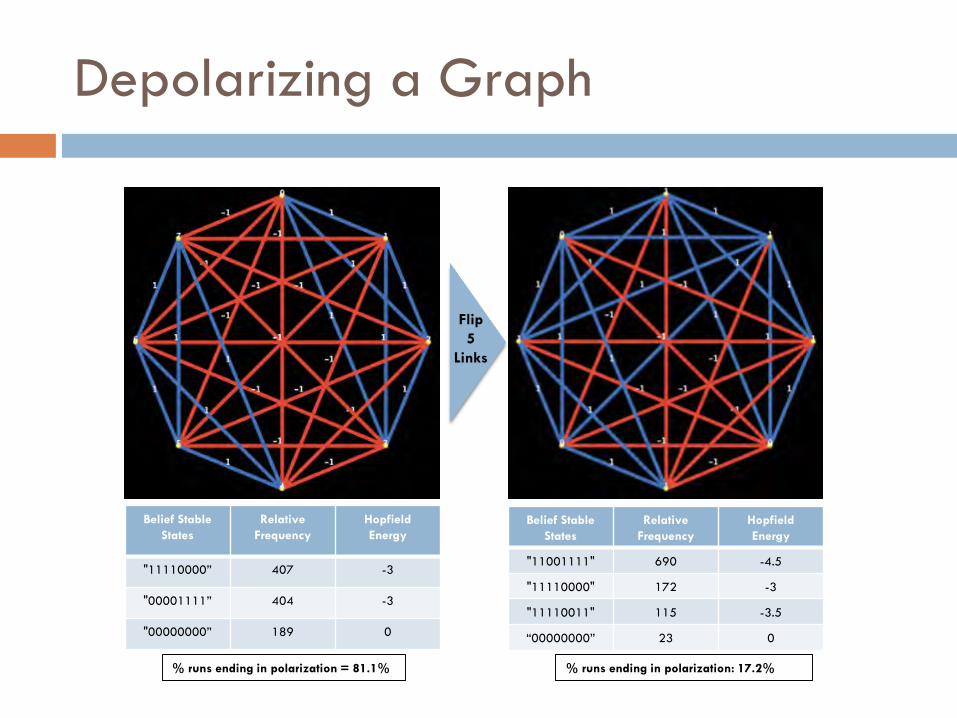
Depolarizing a Graph
Belief Stable
States
Relative
Frequency
Hopfield
Energy
"11110000” 407 -3
"00001111” 404 -3
"00000000” 189 0
Belief Stable
States
Relative
Frequency
Hopfield
Energy
"11001111" 690 -4.5
"11110000" 172 -3
"11110011" 115 -3.5
“00000000” 23 0
Flip
5
Links
% runs ending in polarization = 81.1% % runs ending in polarization: 17.2%
% of Links Flipped
% o
f Sim
ula
tion R
uns
Endin
g in P
ola
riza
tion
-
10
20
30
40
50
60
70
80
90
100
0% 5% 10% 15% 20% 25% 30% 35% 40% 45% 50%
8nodes(28links)
12nodes(66links)
16nodes(120links)
20nodes(190links)
24nodes(276links)
28nodes(378links)
32nodes(496links)
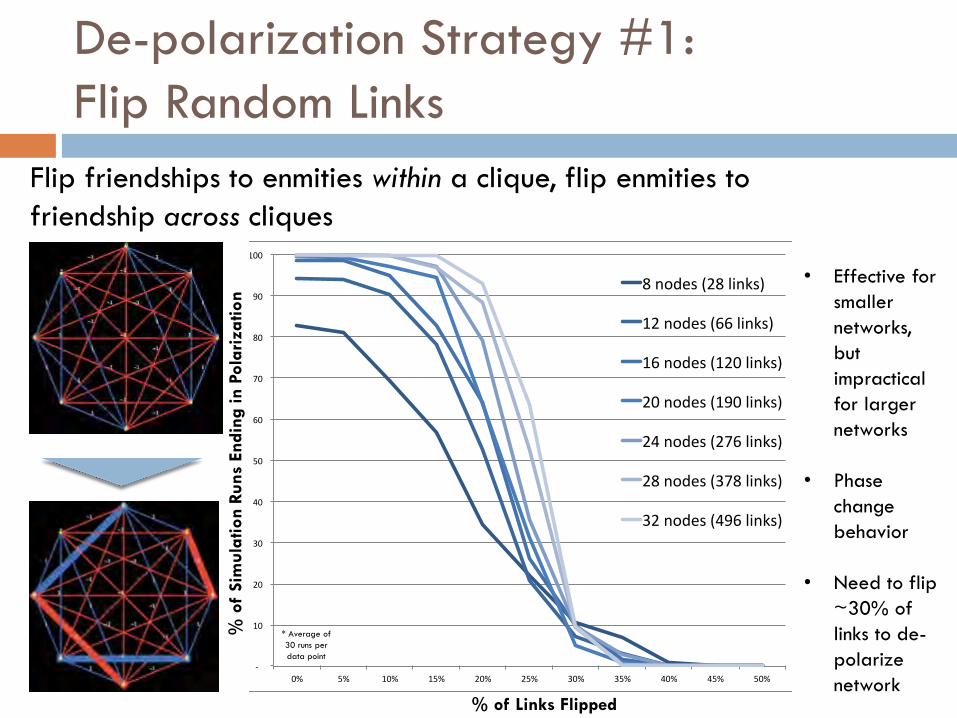
De-polarization Strategy #1:
Flip Random Links
Flip friendships to enmities within a clique, flip enmities to
friendship across cliques
• Effective for
smaller
networks,
but
impractical
for larger
networks
• Phase
change
behavior
• Need to flip
~30% of
links to de-
polarize
network
* Average of
30 runs per
data point
-
10
20
30
40
50
60
70
80
90
100
0% 5% 10% 15% 20% 25% 30% 35% 40% 45% 50%
8nodes(28links)
12nodes(66links)
16nodes(120links)
20nodes(190links)
24nodes(276links)
28nodes(378links)
32nodes(496links)
* Average of
30 runs per
data point
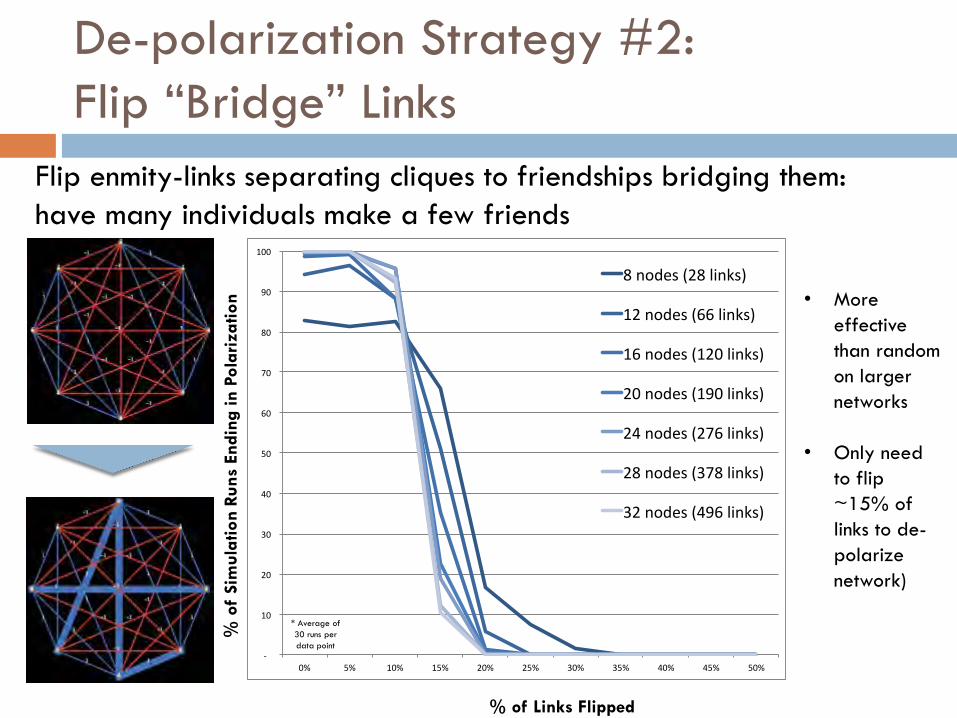
De-polarization Strategy #2:
Flip “Bridge” Links
Flip enmity-links separating cliques to friendships bridging them:
have many individuals make a few friends
% of Links Flipped
% o
f Sim
ula
tion R
uns
Endin
g in P
ola
riza
tion • More
effective
than random
on larger
networks
• Only need
to flip
~15% of
links to de-
polarize
network)
-
10
20
30
40
50
60
70
80
90
100
0% 5% 10% 15% 20% 25% 30% 35% 40% 45% 50%
8nodes(28links)
12nodes(66links)
16nodes(120links)
20nodes(190links)
24nodes(276links)
28nodes(378links)
32nodes(496links)
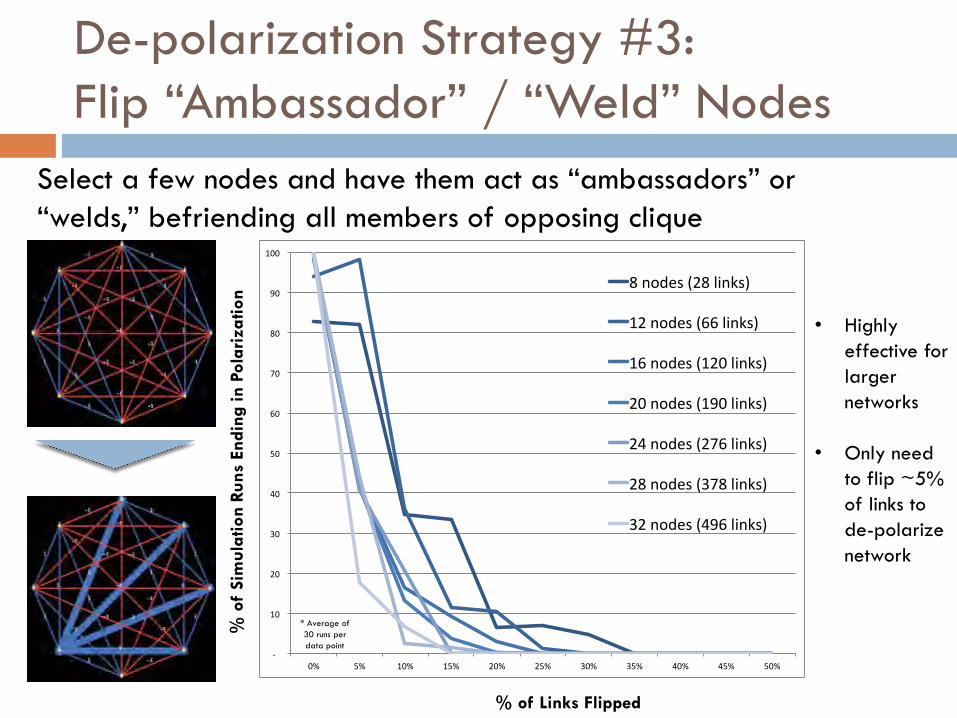
De-polarization Strategy #3:
Flip “Ambassador” / “Weld” Nodes
Select a few nodes and have them act as “ambassadors” or
“welds,” befriending all members of opposing clique
% of Links Flipped
% o
f Sim
ula
tion R
uns
Endin
g in P
ola
riza
tion
• Highly
effective for
larger
networks
• Only need
to flip ~5%
of links to
de-polarize
network
* Average of
30 runs per
data point
Anecdotal Policy Examples:
Conflict Resolution
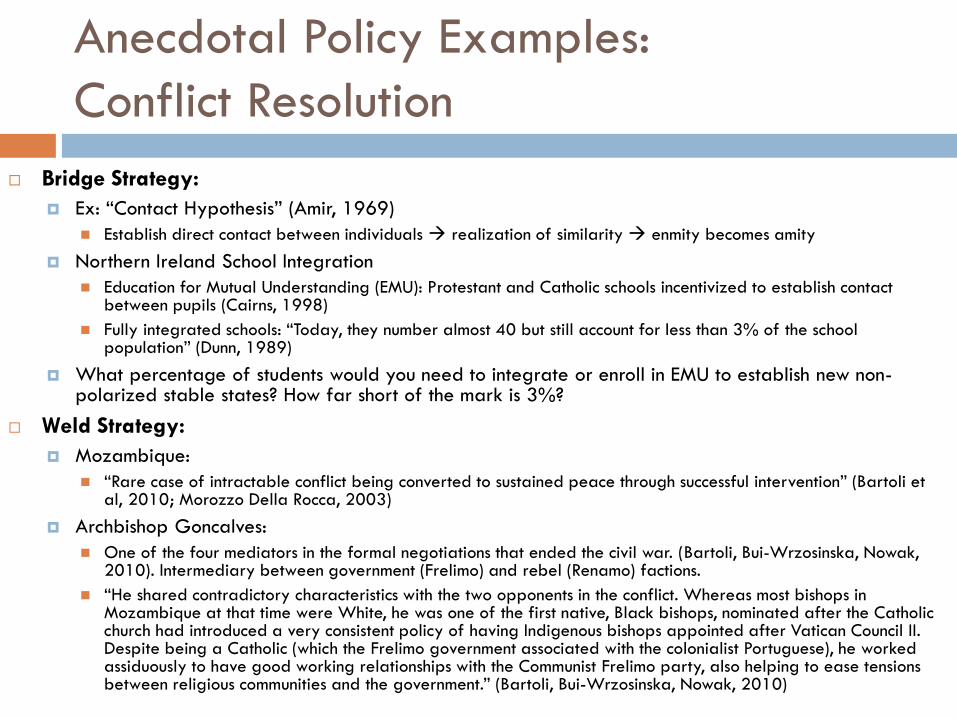
Bridge Strategy:
Ex: “Contact Hypothesis” (Amir, 1969)
Establish direct contact between individuals realization of similarity enmity becomes amity
Northern Ireland School Integration
Education for Mutual Understanding (EMU): Protestant and Catholic schools incentivized to establish contact between pupils (Cairns, 1998)
Fully integrated schools: “Today, they number almost 40 but still account for less than 3% of the school population” (Dunn, 1989)
What percentage of students would you need to integrate or enroll in EMU to establish new non-polarized stable states? How far short of the mark is 3%?
Weld Strategy:
Mozambique:
“Rare case of intractable conflict being converted to sustained peace through successful intervention” (Bartoli et al, 2010; Morozzo Della Rocca, 2003)
Archbishop Goncalves:
One of the four mediators in the formal negotiations that ended the civil war. (Bartoli, Bui-Wrzosinska, Nowak, 2010). Intermediary between government (Frelimo) and rebel (Renamo) factions.
“He shared contradictory characteristics with the two opponents in the conflict. Whereas most bishops in Mozambique at that time were White, he was one of the first native, Black bishops, nominated after the Catholic church had introduced a very consistent policy of having Indigenous bishops appointed after Vatican Council II. Despite being a Catholic (which the Frelimo government associated with the colonialist Portuguese), he worked assiduously to have good working relationships with the Communist Frelimo party, also helping to ease tensions between religious communities and the government.” (Bartoli, Bui-Wrzosinska, Nowak, 2010)
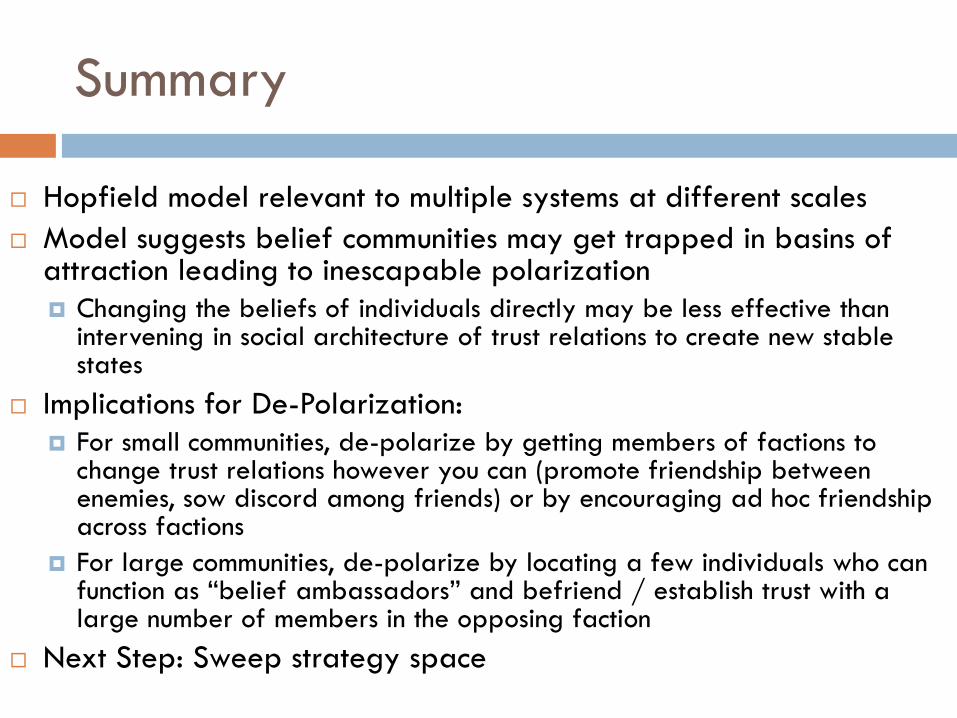
Summary
Hopfield model relevant to multiple systems at different scales
Model suggests belief communities may get trapped in basins of attraction leading to inescapable polarization
Changing the beliefs of individuals directly may be less effective than intervening in social architecture of trust relations to create new stable states
Implications for De-Polarization:
For small communities, de-polarize by getting members of factions to change trust relations however you can (promote friendship between enemies, sow discord among friends) or by encouraging ad hoc friendship across factions
For large communities, de-polarize by locating a few individuals who can function as “belief ambassadors” and befriend / establish trust with a large number of members in the opposing faction
Next Step: Sweep strategy space
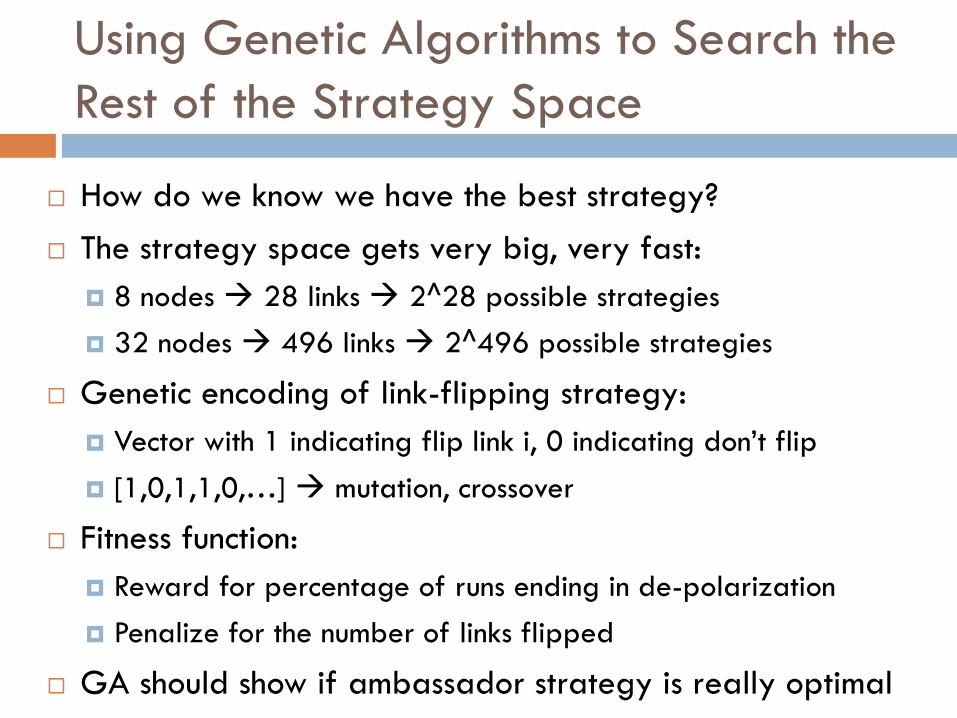
Using Genetic Algorithms to Search the
Rest of the Strategy Space
How do we know we have the best strategy?
The strategy space gets very big, very fast:
8 nodes 28 links 2^28 possible strategies
32 nodes 496 links 2^496 possible strategies
Genetic encoding of link-flipping strategy:
Vector with 1 indicating flip link i, 0 indicating don’t flip
[1,0,1,1,0,…] mutation, crossover
Fitness function:
Reward for percentage of runs ending in de-polarization
Penalize for the number of links flipped
GA should show if ambassador strategy is really optimal
CULTURAL
EVOLUTION
How Cultural Evolution is different from
Biological Evolution
Germs, Genes, Memes
Divergence, Convergence, Combination
Brian Arthur… Combinations of Circuits model
Other Models?
Schelling Segregation Model
Germs, Genes, and Memes
Bourdieu
Signals:• Agent-to-agent messages or environmental stimuli
• Represented as a string of {0,1}
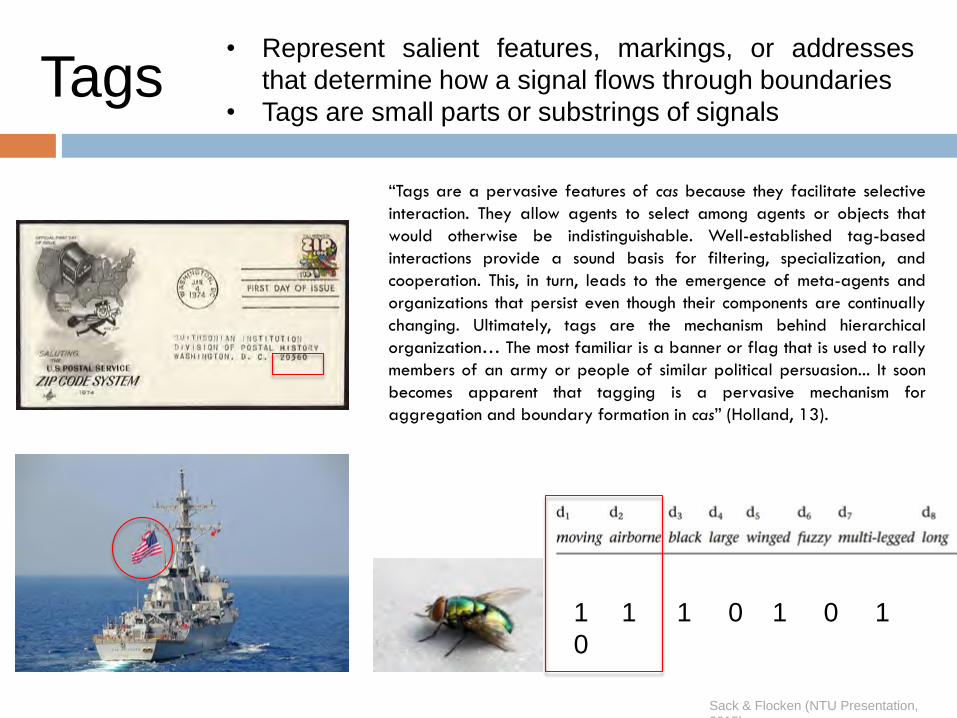
Tags:• Represent salient features, markings, or addresses that determine how a signal
flows through boundaries
• Tags are small parts or substrings of signals
Conditions:• Conditions specify required tags
• A condition is a string of {0,1,#}, where # is a “don’t care” symbol
• Agents:
• A cas agent can be defined as a set of signal-processing rules
• Each rule accepts certain signals as inputs (specified by the condition part of the rule) and thenprocesses the signals to produce outgoing signals (the action part of the rule).” (pg. 28)
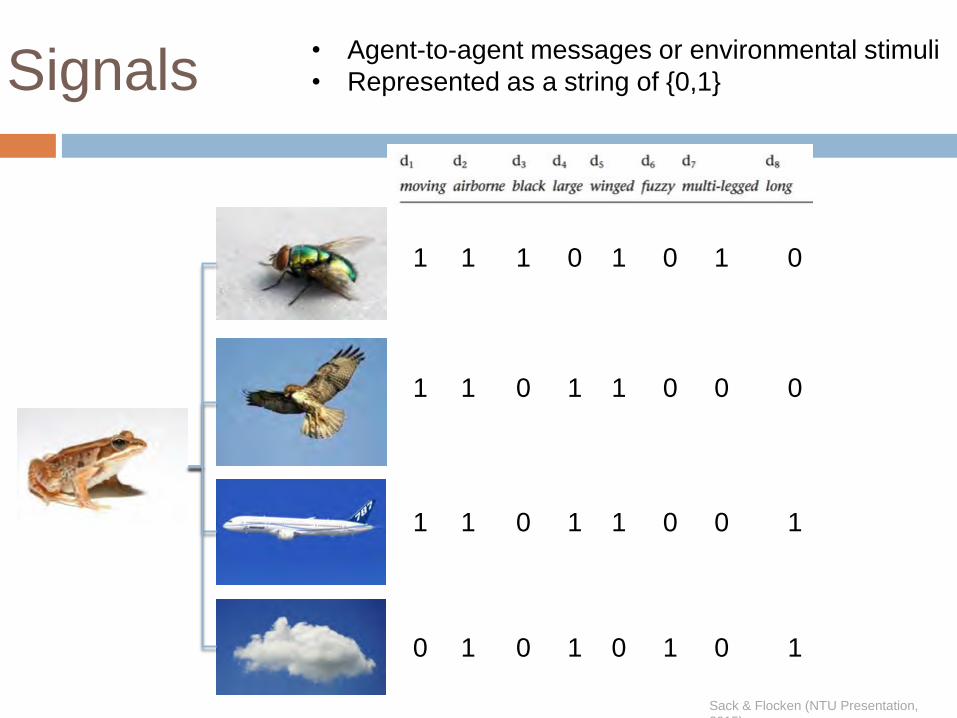
Signals
1 1 1 0 1 0 1 0
1 1 0 1 1 0 0 0
1 1 0 1 1 0 0 1
• Agent-to-agent messages or environmental stimuli
• Represented as a string of {0,1}
0 1 0 1 0 1 0 1
Sack & Flocken (NTU Presentation,
2015)
Tags• Represent salient features, markings, or addresses
that determine how a signal flows through boundaries
• Tags are small parts or substrings of signals
1 1 1 0 1 0 1
0
Sack & Flocken (NTU Presentation,
2015)
“Tags are a pervasive features of cas because they facilitate selective
interaction. They allow agents to select among agents or objects that
would otherwise be indistinguishable. Well-established tag-based
interactions provide a sound basis for filtering, specialization, and
cooperation. This, in turn, leads to the emergence of meta-agents and
organizations that persist even though their components are continually
changing. Ultimately, tags are the mechanism behind hierarchical
organization… The most familiar is a banner or flag that is used to rally
members of an army or people of similar political persuasion... It soon
becomes apparent that tagging is a pervasive mechanism for
aggregation and boundary formation in cas” (Holland, 13).
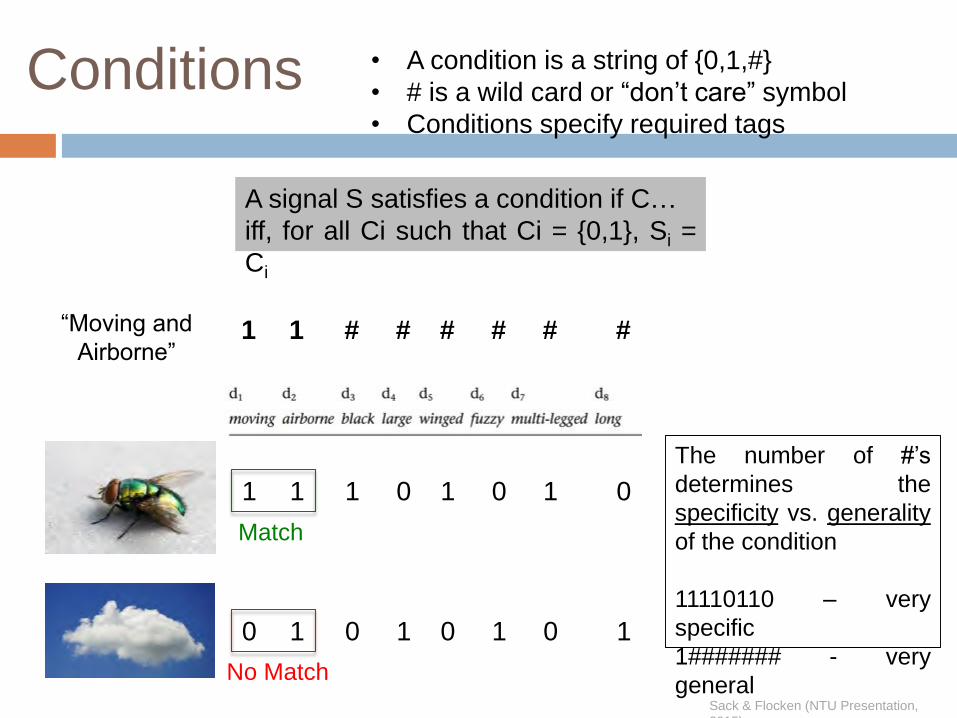
Conditions • A condition is a string of {0,1,#}
• # is a wild card or “don’t care” symbol
• Conditions specify required tags
1 1 1 0 1 0 1 0
0 1 0 1 0 1 0 1
“Moving and
Airborne”1 1 # # # # # #
Match
No Match
A signal S satisfies a condition if C…
iff, for all Ci such that Ci = {0,1}, Si =
Ci
The number of #’s
determines the
specificity vs. generality
of the condition
11110110 – very
specific
1####### - very
generalSack & Flocken (NTU Presentation,
2015)
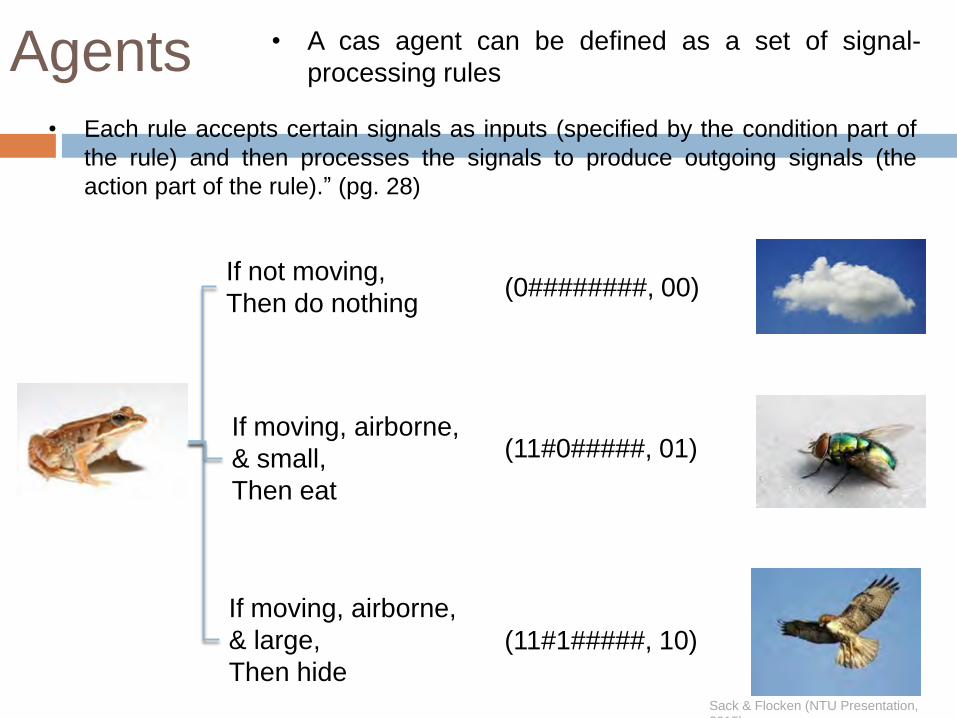
Agents • A cas agent can be defined as a set of signal-
processing rules
• Each rule accepts certain signals as inputs (specified by the condition part of
the rule) and then processes the signals to produce outgoing signals (the
action part of the rule).” (pg. 28)
If moving, airborne,
& small,
Then eat
If not moving,
Then do nothing
If moving, airborne,
& large,
Then hide
(0########, 00)
(11#0#####, 01)
(11#1#####, 10)
Sack & Flocken (NTU Presentation,
2015)
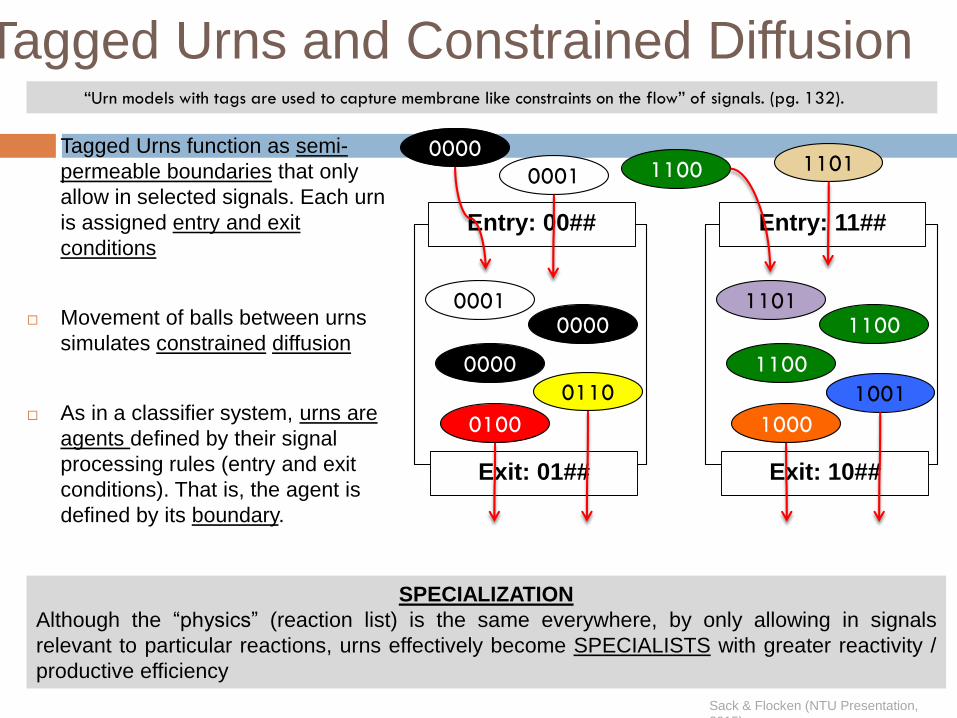
Tagged Urns function as semi-
permeable boundaries that only
allow in selected signals. Each urn
is assigned entry and exit
conditions
Movement of balls between urns
simulates constrained diffusion
As in a classifier system, urns are
agents defined by their signal
processing rules (entry and exit
conditions). That is, the agent is
defined by its boundary.
Tagged Urns and Constrained Diffusion“Urn models with tags are used to capture membrane like constraints on the flow” of signals. (pg. 132).
0001
Exit: 01##
0000
Entry: 00##
0001
0000
0000
0100
SPECIALIZATION
Although the “physics” (reaction list) is the same everywhere, by only allowing in signals
relevant to particular reactions, urns effectively become SPECIALISTS with greater reactivity /
productive efficiency
0110
1101
Exit: 10##
1100
Entry: 11##
1101
1100
1100
1000
1001
Sack & Flocken (NTU Presentation,
2015)
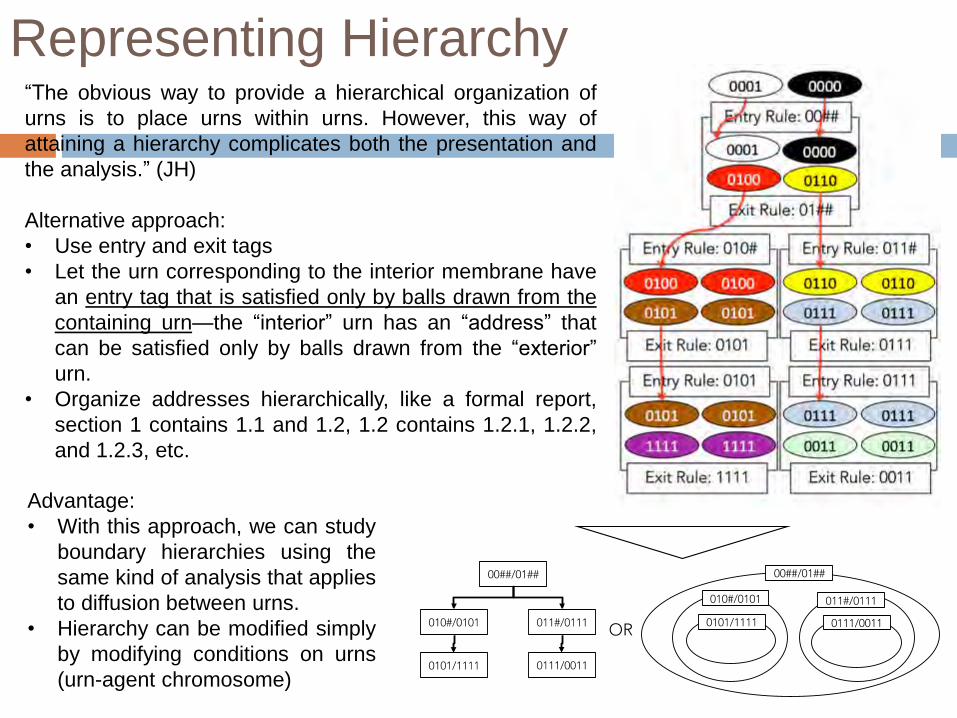
Representing Hierarchy“The obvious way to provide a hierarchical organization of
urns is to place urns within urns. However, this way of
attaining a hierarchy complicates both the presentation and
the analysis.” (JH)
Alternative approach:
• Use entry and exit tags
• Let the urn corresponding to the interior membrane have
an entry tag that is satisfied only by balls drawn from the
containing urn—the “interior” urn has an “address” that
can be satisfied only by balls drawn from the “exterior”
urn.
• Organize addresses hierarchically, like a formal report,
section 1 contains 1.1 and 1.2, 1.2 contains 1.2.1, 1.2.2,
and 1.2.3, etc.
Advantage:
• With this approach, we can study
boundary hierarchies using the
same kind of analysis that applies
to diffusion between urns.
• Hierarchy can be modified simply
by modifying conditions on urns
(urn-agent chromosome)
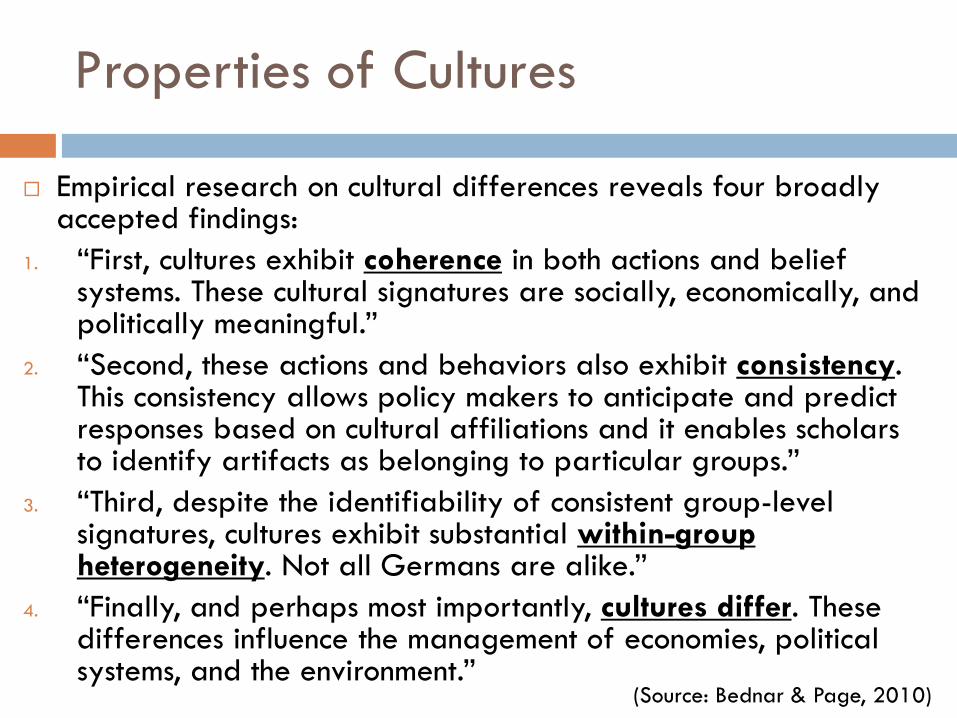
Properties of Cultures
Empirical research on cultural differences reveals four broadly accepted findings:
1. “First, cultures exhibit coherence in both actions and belief systems. These cultural signatures are socially, economically, and politically meaningful.”
2. “Second, these actions and behaviors also exhibit consistency. This consistency allows policy makers to anticipate and predict responses based on cultural affiliations and it enables scholars to identify artifacts as belonging to particular groups.”
3. “Third, despite the identifiability of consistent group-level signatures, cultures exhibit substantial within-group heterogeneity. Not all Germans are alike.”
4. “Finally, and perhaps most importantly, cultures differ. These differences influence the management of economies, political systems, and the environment.”
(Source: Bednar & Page, 2010)
The Pros and Cons of Cultural Diversity
The Axelrod model provides insight about factors
affecting cultural homogeneity vs. diversity. But, we’ve
been bracketing the question of when is cultural
diversity is desirable vs. undesirable?
See Scott Page’s Diversity for extensive treatment
Advantage: Better problem solving
Disadvantage: Coordination problems
Plan for Today’s Talk
Culture and Policy-Making
Culture as a CAS
Big Concepts and
Emergence
Signals and Boundaries
Internal Models
Reflexivity
Diversity
Ecology
Evolution
Illustrative Models
Brian Arthur,
“The El Farol Problem”
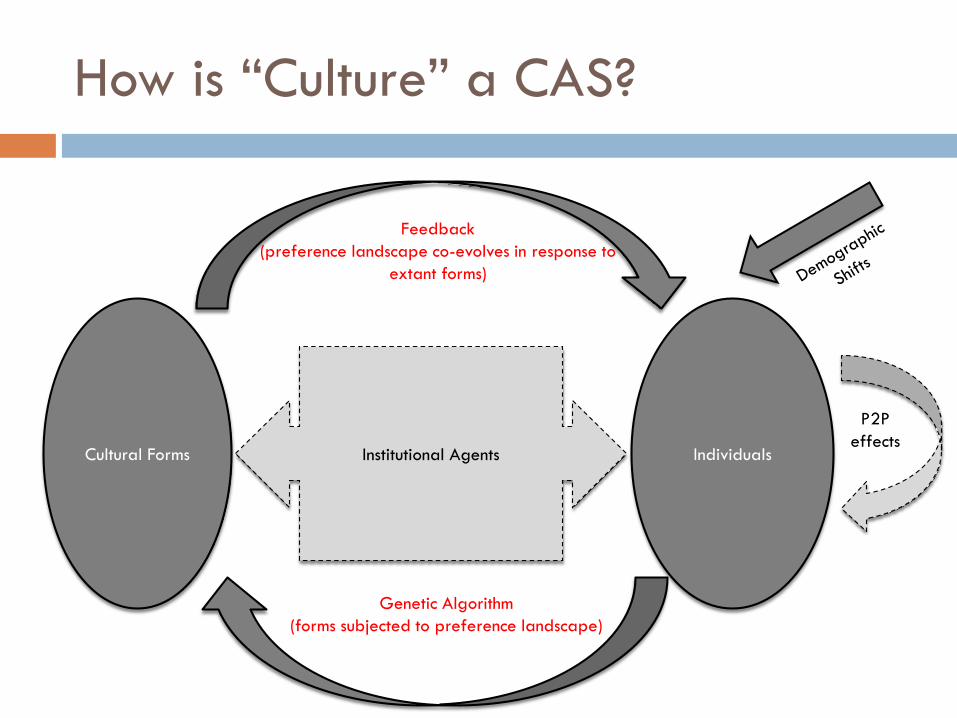
How is “Culture” a CAS?
Cultural Forms IndividualsInstitutional Agents
Genetic Algorithm
(forms subjected to preference landscape)
Feedback
(preference landscape co-evolves in response to
extant forms)
P2P
effects
Why a complexity lens on culture?
Narrative studies
Cultural histories in isolation
Cultural studies has generally rejected positivist approaches,
Data collection, but not model-building
Multi-disciplinary: humanities, social sciences, computational sciences
NO GENERAL THEORY OF HOW THE MECHANISMS GOVERNING HOW CULTURES OPERATE
Policy Implications of “Culture as
Ecology”
Cities:
Urban Ecologies
Stock Market:
Trading strategies: high frequency trading exploiting
long term traders
Strategies function as an ecology:
• Niches
• Mutualism
• Predator-Prey Dynamics
• Co-Evolution
• Punctuated Equilibrium
• Adaptation
• Increasing Complexity
• Extinction Events
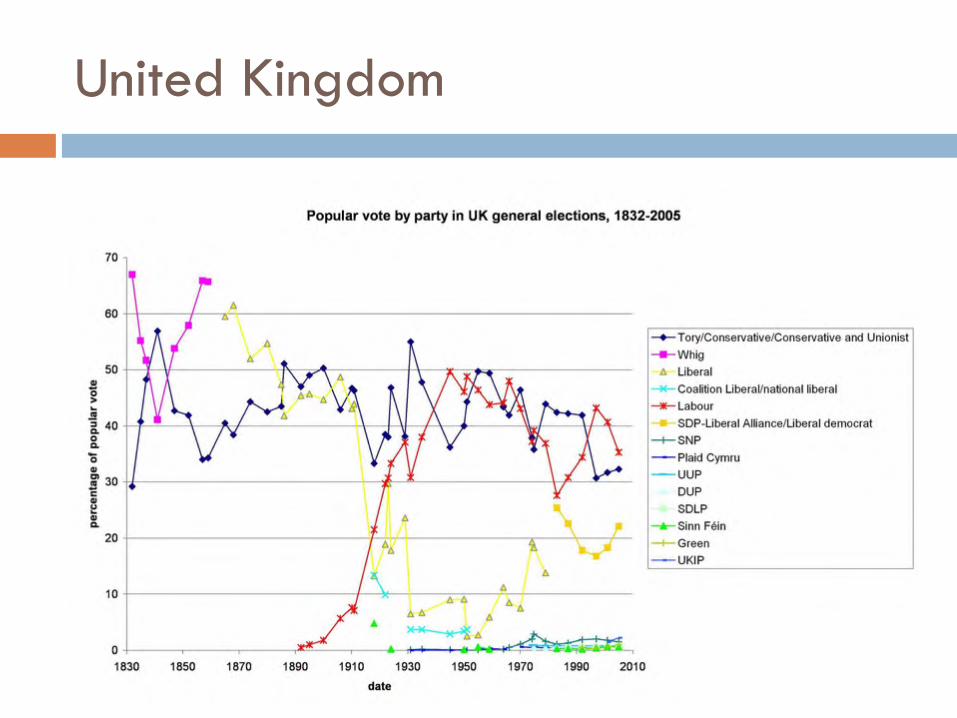
United Kingdom
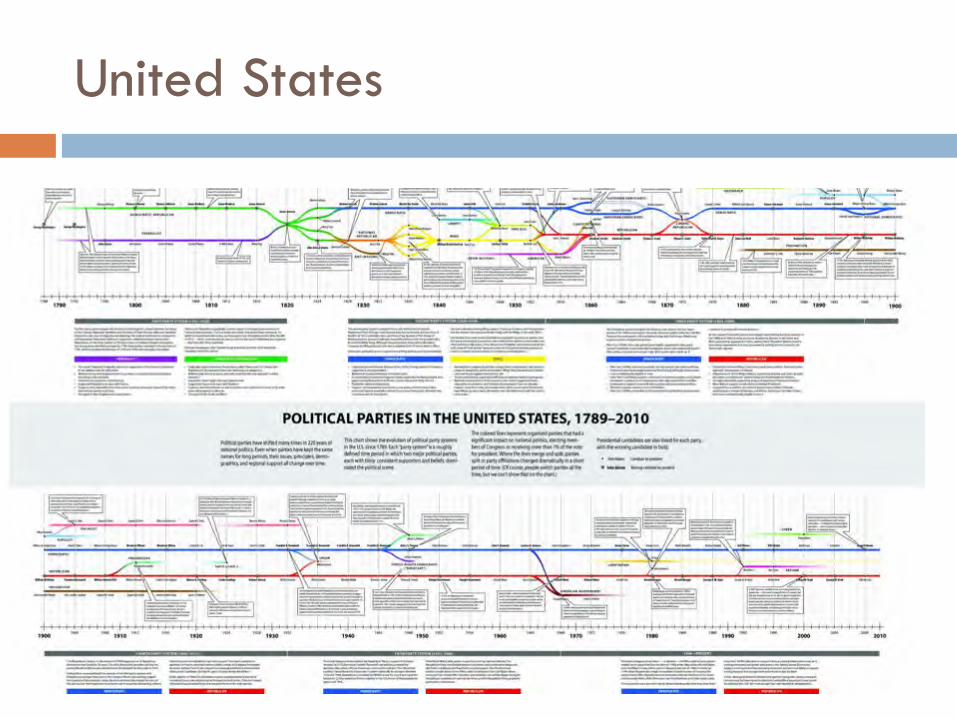
United States
Recommended