The Land Registry Customer Service Survey 2010
- Report -
Customer Services and Administration Section
August 2010
TABLE OF CONTENTS
EXECUTIVE SUMMARY ..................................................................................... 2
1. BACKGROUND AND OBJECTIVES ........................................................... 5
1.1 BACKGROUND ................................................................................................................. 5 1.2 OBJECTIVES ..................................................................................................................... 5
2. METHODOLOGY............................................................................................ 6
3. SURVEY RESPONSE RATE .......................................................................... 7
3.1 COUNTER SURVEY ........................................................................................................... 7 3.2 POSTAL SURVEY............................................................................................................... 7
4. SURVEY FINDINGS AND ANALYSIS.......................................................... 9
4.1 CUSTOMER CENTRE / NEW TERRITORIES SEARCH OFFICES ............................................ 9 4.1.1 Lodgement of Deeds............................................................................................... 9
4.1.2 Counter Search...................................................................................................... 12
4.1.3 Self-service Search ............................................................................................... 18
4.1.4 Information Counter ............................................................................................. 24
4.1.5 Office Environment .............................................................................................. 26
4.2 IRIS ONLINE SERVICES.................................................................................................. 30 4.3 MOST FREQUENTLY USED SEARCH MODE ..................................................................... 33
4.3.1 IRIS Online Services ............................................................................................ 33
4.3.2 Counter Search...................................................................................................... 35
4.3.3 Self-service Search ............................................................................................... 36
4.4 CUSTOMER SERVICE HOTLINE ...................................................................................... 37 4.4.1 Interactive Voice Response System (IVRS) ......................................................... 37 4.4.2 Performance of Hotline Staff ................................................................................ 39
4.5 OVERALL SATISFACTION ON THE SERVICES PROVIDED BY THE LAND REGISTRY........... 41 4.6 THE E-MEMORIAL FORM................................................................................................ 42
4.6.1 Internet Access...................................................................................................... 42
4.6.2 Use of the e-Memorial Form for Preparing Memorials........................................ 42 4.7 TITLE REGISTRATION SYSTEM ....................................................................................... 44 4.8 PROFILE AND USAGE PATTERN OF SURVEY RESPONDENTS............................................. 47
4.8.1 Profile of Survey Respondents ............................................................................. 47 4.8.2 Usage Pattern of Survey Respondents .................................................................. 49
4.9 RESPONDENTS’ SUGGESTIONS FOR IMPROVEMENT ........................................................ 53
5. CONCLUSION................................................................................................ 55
APPENDIX QUESTIONNAIRE
- 1 -
Service
Overall Satisfaction Rate (%) Provision of Service Staff Performance
Lodgement of Deeds 89.0 90.0 Counter Search 94.1 95.0 Self-service Search 76.7 84.7 Information Counter - 86.1
EXECUTIVE SUMMARY
Scope of Survey A small-scale customer service survey was conducted in March/April 2010 to gauge the customer satisfaction level of the Land Registry’s services including lodgement of deeds, search and customer service hotline, to understand the usage pattern of e-Memorial Form and collect customers’ views on future enhancements, to collect customers’ views on title registration and to identify areas for improvement to ensure delivery of quality services to meet customers’ needs and expectation.
Methodology and Response Rate Self-completed questionnaires were distributed at counters and by post as follows:
(1) Counter Survey: customers using the services at the Customer Centre / New Territories Search Offices; and
(2) Postal Survey: lodging solicitors firms, IRIS Online Services subscribers and government users
For counter survey, 247 completed questionnaires were received out of 585 questionnaires distributed with a response rate of 42.2%. For postal survey, 204 completed questionnaires were received among 1,048 questionnaires sent with a response rate of 19.5%. The overall response rate is 27.6% (451 completed out of 1,633).
Major Findings (1) CUSTOMER CENTRE / NEW TERRITORIES SEARCH OFFICES
(I) Provision of Service and Staff Performance
(II) Office Environment Overall Satisfaction Rate: 93.1% Satisfied Aspects: y Cleanliness (93.3%) y Illumination (92.9%) Dissatisfied Aspects: y Room temperature (3.6%) y Ventilation (2.0%)
- 2 -
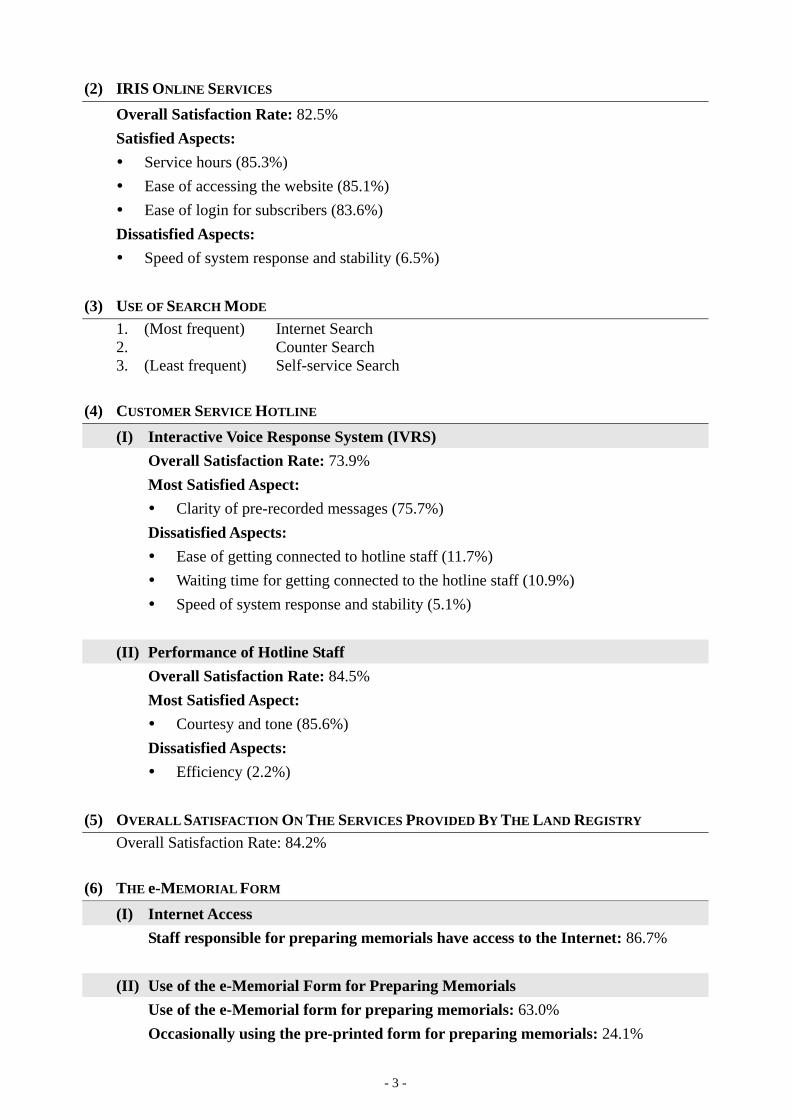
(2) IRIS ONLINE SERVICES
Overall Satisfaction Rate: 82.5% Satisfied Aspects:
y Service hours (85.3%) y Ease of accessing the website (85.1%) y Ease of login for subscribers (83.6%)
Dissatisfied Aspects: y Speed of system response and stability (6.5%)
(3) USE OF SEARCH MODE
1. (Most frequent) Internet Search 2. Counter Search 3. (Least frequent) Self-service Search
(4) CUSTOMER SERVICE HOTLINE
(I) Interactive Voice Response System (IVRS) Overall Satisfaction Rate: 73.9%
Most Satisfied Aspect: y Clarity of pre-recorded messages (75.7%)
Dissatisfied Aspects: y Ease of getting connected to hotline staff (11.7%) y Waiting time for getting connected to the hotline staff (10.9%) y Speed of system response and stability (5.1%)
(II) Performance of Hotline Staff Overall Satisfaction Rate: 84.5%
Most Satisfied Aspect:
y Courtesy and tone (85.6%) Dissatisfied Aspects:
y Efficiency (2.2%)
(5) OVERALL SATISFACTION ON THE SERVICES PROVIDED BY THE LAND REGISTRY
Overall Satisfaction Rate: 84.2%
(6) THE e-MEMORIAL FORM
(I) Internet Access Staff responsible for preparing memorials have access to the Internet: 86.7%
(II) Use of the e-Memorial Form for Preparing Memorials Use of the e-Memorial form for preparing memorials: 63.0% Occasionally using the pre-printed form for preparing memorials: 24.1%
- 3 -
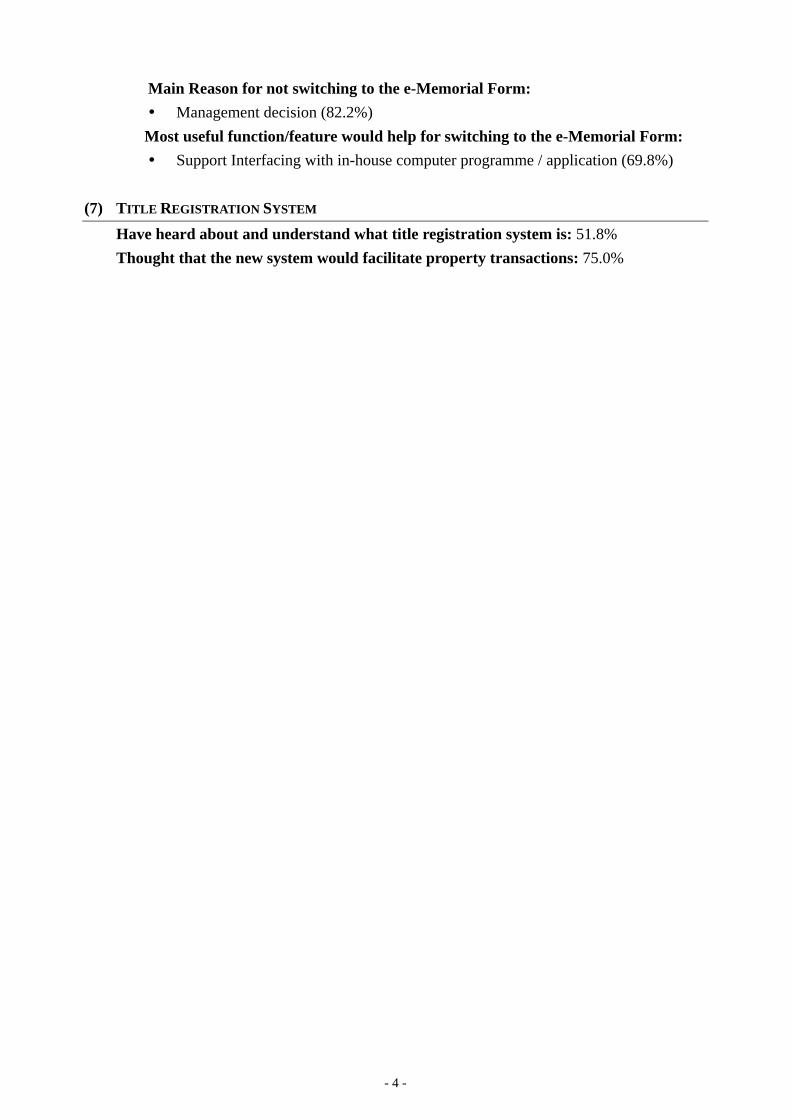
Main Reason for not switching to the e-Memorial Form: y Management decision (82.2%) Most useful function/feature would help for switching to the e-Memorial Form: y Support Interfacing with in-house computer programme / application (69.8%)
(7) TITLE REGISTRATION SYSTEM
Have heard about and understand what title registration system is: 51.8% Thought that the new system would facilitate property transactions: 75.0%
- 4 -
1. BACKGROUND AND OBJECTIVES
1.1 BACKGROUND
Quality is at the core of Land Registry’s services. An essential ingredient of quality service is listening to those we serve. Following the comprehensive customer service survey conducted by an independent consultant in 2008, various service improvements were made in response to the received feedback and comments. In anticipation that the community we serve will continue to challenge and support us as we strive to deliver the best quality service, a small scale customer service survey was conducted in house in March/April 2010. For the first time, the survey included designated sections on e-Memorial Form and title registration to collect views on these new initiatives. The aims of the survey are to benchmark progress since the last survey as well as to identify priorities for improvement in existing services and expectation for development of future services.
1.2 OBJECTIVES
The objectives of the survey are:
1. to gauge the customer satisfaction level of the Land Registry’s services including lodgement of deeds, search and customer service hotline;
2. to understand the usage pattern of e-Memorial Form and collect customers’ views on future enhancements;
3. to collect customers’ views on title registration; and
4. to identify areas for improvement to ensure delivery of quality services to meet customers’ needs and expectation.
- 5 -
2. METHODOLOGY
The survey was conducted by means of self-completed questionnaires which were distributed to customers at counters and by post during the period from 8 March to 16 April 2010 as follows:
Target Customers Mode of Distribution (1) Counter Survey Customers using the services at the Customer Centre / New Territories Search Offices
Questionnaires (Appendix) distributed at y information counter; y lodgement counters; and y search counters
(2) Postal Survey Lodging solicitors firms Questionnaires (Appendix) sent by post
IRIS Online Services subscribers
Government users
Target customers could return the completed questionnaires to the Land Registry by putting them into the collection box at the Customer Centre / New Territories Search Offices or by freepost or by fax.
- 6 -
3. SURVEY RESPONSE RATE
3.1 COUNTER SURVEY
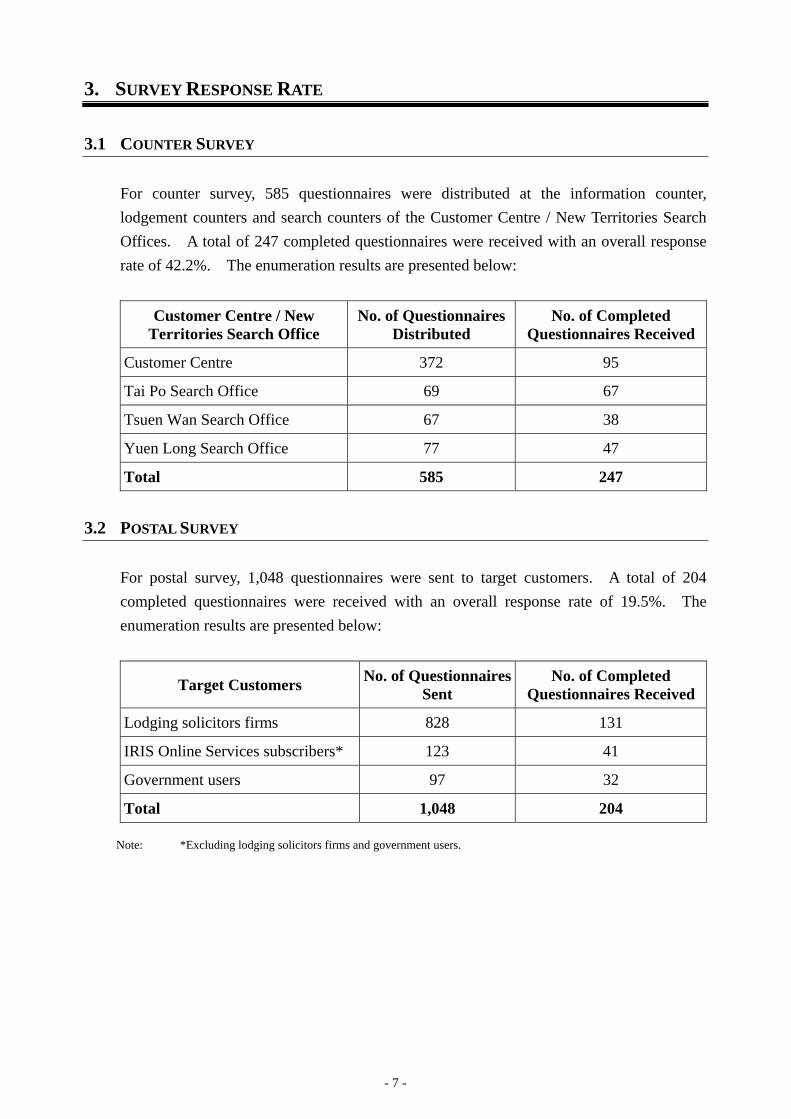
For counter survey, 585 questionnaires were distributed at the information counter, lodgement counters and search counters of the Customer Centre / New Territories Search Offices. A total of 247 completed questionnaires were received with an overall response rate of 42.2%. The enumeration results are presented below:
Customer Centre / New Territories Search Office
No. of Questionnaires Distributed
No. of Completed Questionnaires Received
Customer Centre 372 95
Tai Po Search Office 69 67
Tsuen Wan Search Office 67 38
Yuen Long Search Office 77 47
Total 585 247
3.2 POSTAL SURVEY
For postal survey, 1,048 questionnaires were sent to target customers. A total of 204 completed questionnaires were received with an overall response rate of 19.5%. The enumeration results are presented below:
Target Customers No. of Questionnaires Sent
No. of Completed Questionnaires Received
Lodging solicitors firms 828 131
IRIS Online Services subscribers* 123 41
Government users 97 32
Total 1,048 204
Note: *Excluding lodging solicitors firms and government users.
- 7 -
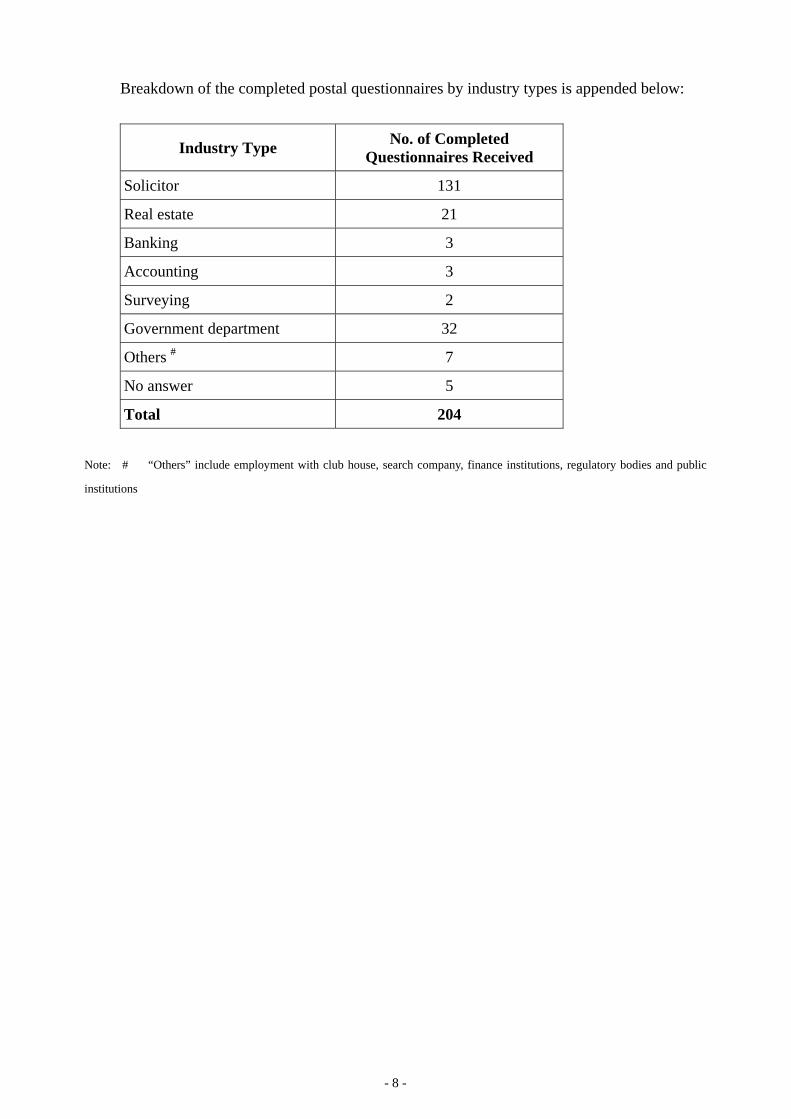
Breakdown of the completed postal questionnaires by industry types is appended below:
Industry Type No. of Completed Questionnaires Received
Solicitor 131
Real estate 21
Banking 3
Accounting 3
Surveying 2
Government department 32
Others # 7
No answer 5
Total 204
Note: # “Others” include employment with club house, search company, finance institutions, regulatory bodies and public
institutions
- 8 -
4. SURVEY FINDINGS AND ANALYSIS
4.1 CUSTOMER CENTRE / NEW TERRITORIES SEARCH OFFICES
4.1.1 Lodgement of Deeds
4.1.1.1 Satisfaction on Deeds Lodgement Service
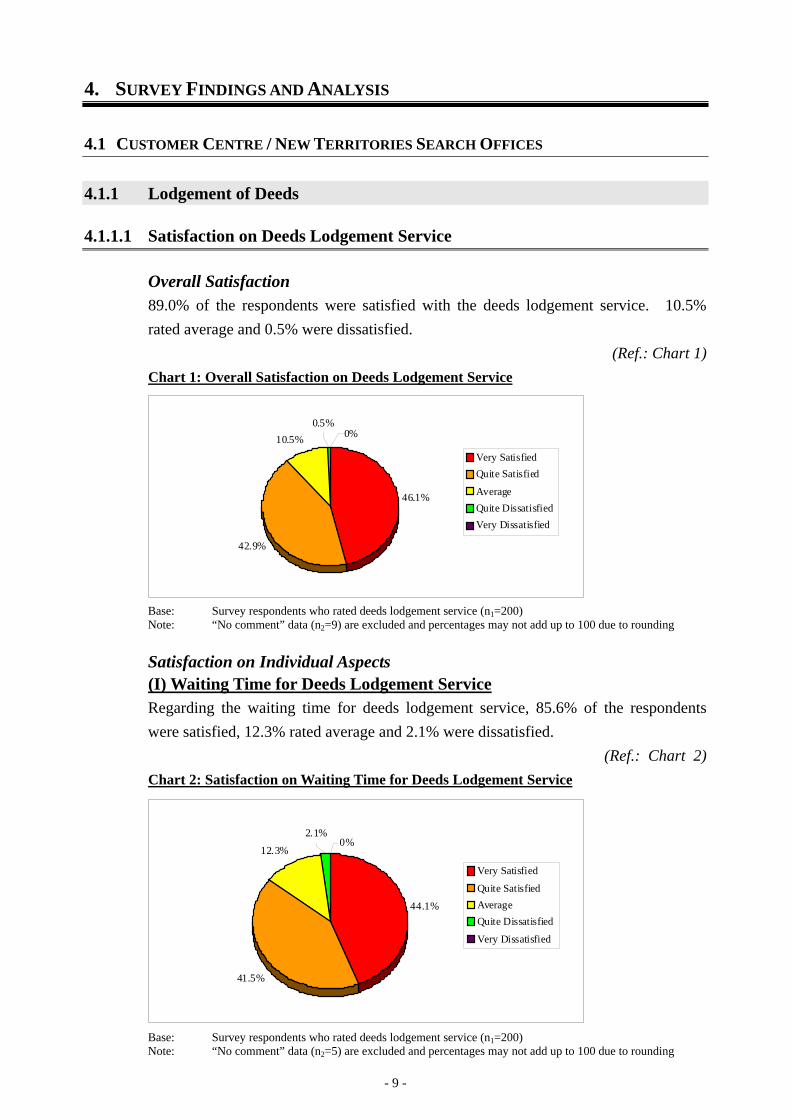
Overall Satisfaction 89.0% of the respondents were satisfied with the deeds lodgement service. 10.5% rated average and 0.5% were dissatisfied.
(Ref.: Chart 1) Chart 1: Overall Satisfaction on Deeds Lodgement Service
46.1%
42.9%
10.5% 0.5%
0%
Very Satisfied Quite Satisfied
Average Quite Dissatisfied Very Dissatisfied
Base: Survey respondents who rated deeds lodgement service (n1=200) Note: “No comment” data (n2=9) are excluded and percentages may not add up to 100 due to rounding
Satisfaction on Individual Aspects (I) Waiting Time for Deeds Lodgement Service Regarding the waiting time for deeds lodgement service, 85.6% of the respondents were satisfied, 12.3% rated average and 2.1% were dissatisfied.
(Ref.: Chart 2) Chart 2: Satisfaction on Waiting Time for Deeds Lodgement Service
44.1%
41.5%
12.3%
2.1% 0%
Very Satisfied
Quite Satisfied Average Quite Dissatisfied
Very Dissatisfied
Base: Survey respondents who rated deeds lodgement service (n1=200) Note: “No comment” data (n2=5) are excluded and percentages may not add up to 100 due to rounding
- 9 -
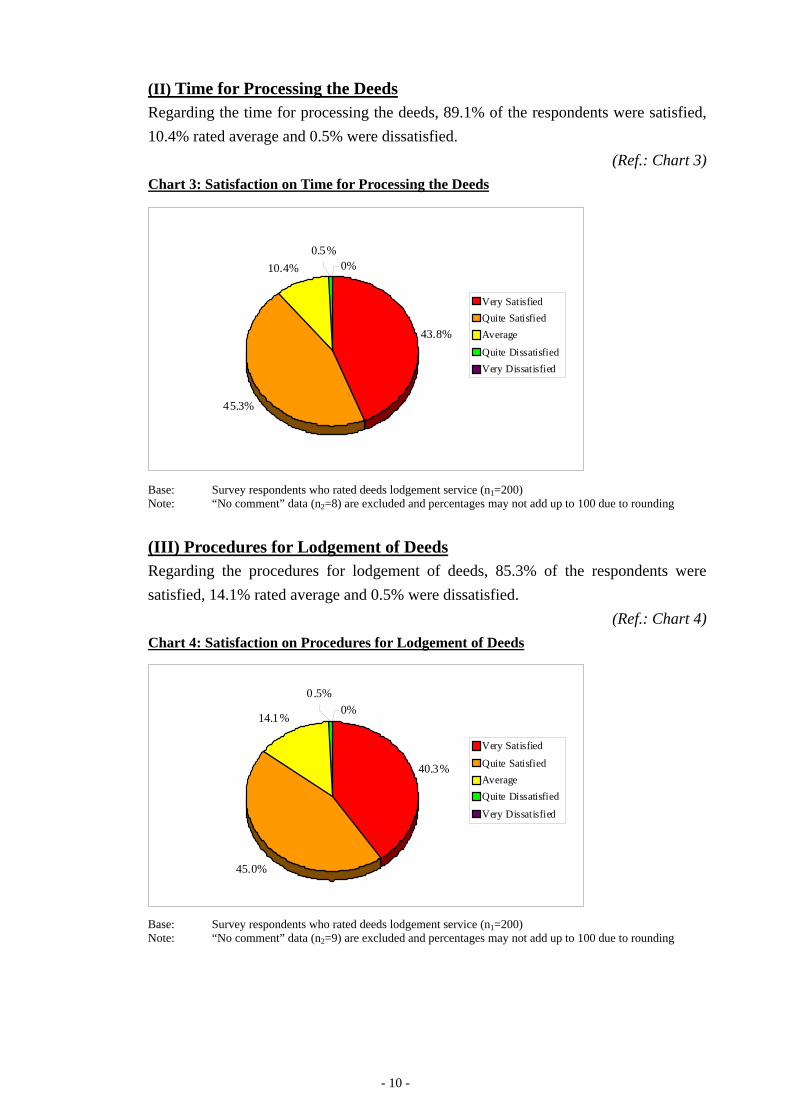
(II) Time for Processing the Deeds Regarding the time for processing the deeds, 89.1% of the respondents were satisfied, 10.4% rated average and 0.5% were dissatisfied.
(Ref.: Chart 3) Chart 3: Satisfaction on Time for Processing the Deeds
43.8%
45.3%
10.4% 0.5%
0%
Very Satisfied Quite Satisfied Average
Quite Dissatisfied Very Dissatisfied
Base: Survey respondents who rated deeds lodgement service (n1=200) Note: “No comment” data (n2=8) are excluded and percentages may not add up to 100 due to rounding
(III) Procedures for Lodgement of Deeds Regarding the procedures for lodgement of deeds, 85.3% of the respondents were satisfied, 14.1% rated average and 0.5% were dissatisfied.
(Ref.: Chart 4) Chart 4: Satisfaction on Procedures for Lodgement of Deeds
40.3%
45.0%
14.1%
0.5% 0%
Very Satisfied
Quite Satisfied Average Quite Dissatisfied
Very Dissatisfied
Base: Survey respondents who rated deeds lodgement service (n1=200) Note: “No comment” data (n2=9) are excluded and percentages may not add up to 100 due to rounding
- 10 -
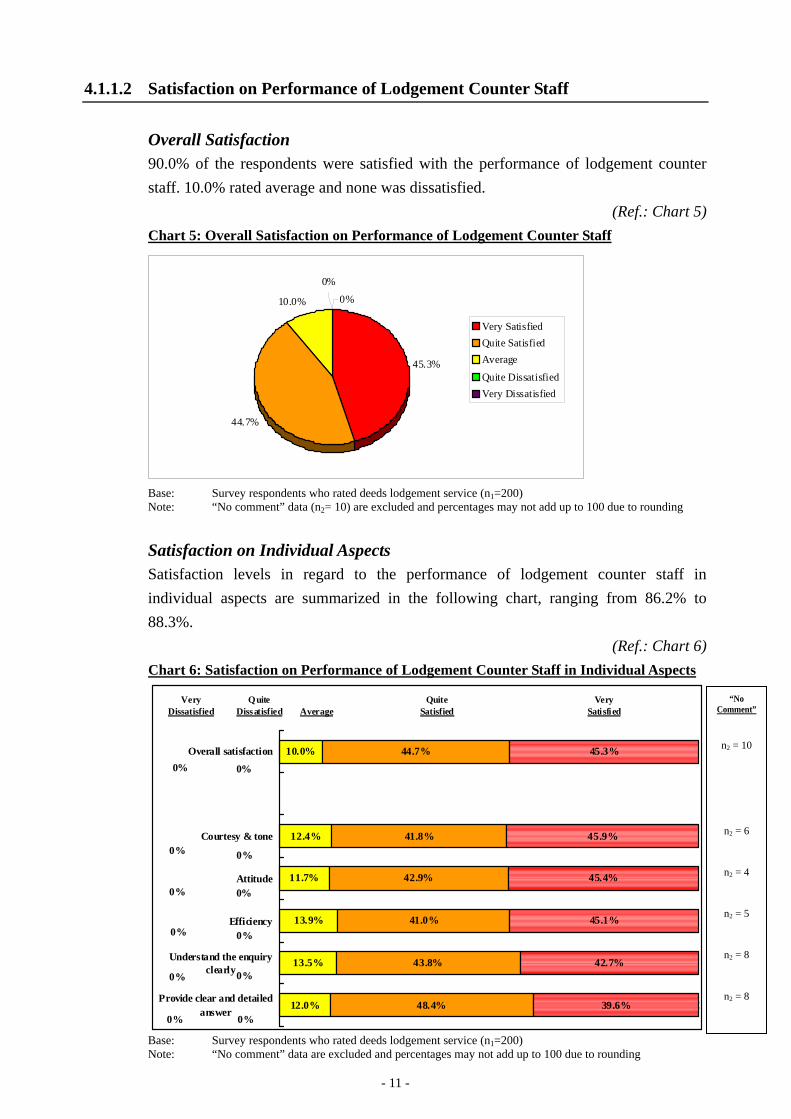
4.1.1.2 Satisfaction on Performance of Lodgement Counter Staff
Overall Satisfaction 90.0% of the respondents were satisfied with the performance of lodgement counter staff. 10.0% rated average and none was dissatisfied.
(Ref.: Chart 5) Chart 5: Overall Satisfaction on Performance of Lodgement Counter Staff
45.3%
44.7%
10.0%
0%
0%
Very Satisfied Quite Satisfied Average
Quite Dissatisfied Very Dissatisfied
Base: Survey respondents who rated deeds lodgement service (n1=200) Note: “No comment” data (n2= 10) are excluded and percentages may not add up to 100 due to rounding
Satisfaction on Individual Aspects Satisfaction levels in regard to the performance of lodgement counter staff in individual aspects are summarized in the following chart, ranging from 86.2% to 88.3%.
(Ref.: Chart 6) Chart 6: Satisfaction on Performance of Lodgement Counter Staff in Individual Aspects
12.0%
13.5%
13.9%
11.7%
12.4%
10.0%
48.4%
43.8%
41.0%
42.9%
41.8%
44.7%
39.6%
42.7%
45.1%
45.4%
45.9%
45.3%
0%
0%
0%
0%
0%
0%
0%
0%
0%
0%
0%
0%
Provide clear and detailed answer
Understand the enquiry clearly
Efficiency
Attitude
Courtesy & tone
Overall satisfaction
Very Dissatisfied
Quite Dissatisfied Average
Quite Satisfied
Very Satisfied
“No Comment”
n2 = 10
n2 = 6
n2 = 4
n2 = 5
n2 = 8
n2 = 8
Base: Survey respondents who rated deeds lodgement service (n1=200) Note: “No comment” data are excluded and percentages may not add up to 100 due to rounding
- 11 -
4.1.2 Counter Search
4.1.2.1 Satisfaction on Counter Search Service
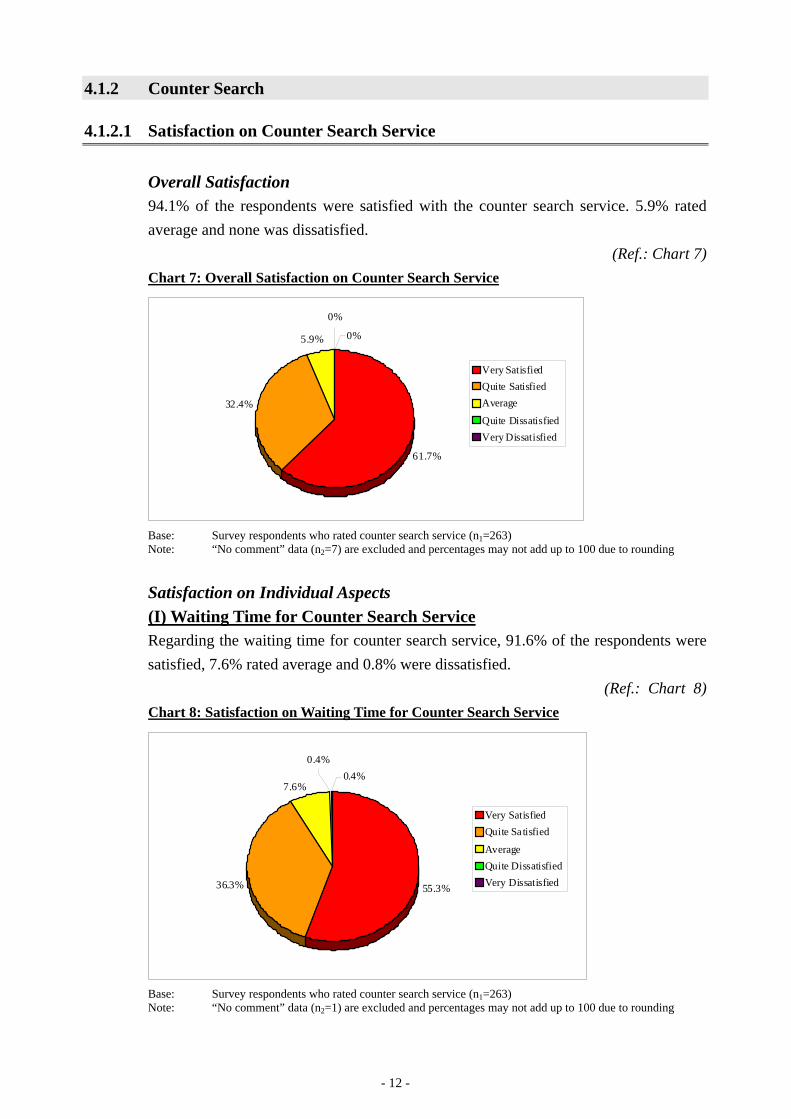
Overall Satisfaction 94.1% of the respondents were satisfied with the counter search service. 5.9% rated average and none was dissatisfied.
(Ref.: Chart 7) Chart 7: Overall Satisfaction on Counter Search Service
61.7%
32.4%
5.9% 0%
0%
Very Satisfied Quite Satisfied Average
Quite Dissatisfied Very Dissatisfied
Base: Survey respondents who rated counter search service (n1=263) Note: “No comment” data (n2=7) are excluded and percentages may not add up to 100 due to rounding
Satisfaction on Individual Aspects (I) Waiting Time for Counter Search Service Regarding the waiting time for counter search service, 91.6% of the respondents were satisfied, 7.6% rated average and 0.8% were dissatisfied.
(Ref.: Chart 8) Chart 8: Satisfaction on Waiting Time for Counter Search Service
55.3% 36.3%
0.4% 0.4%
7.6%
Very Satisfied Quite Sa tisfied
Average Quite Dissatisfied Very Dissatisfied
Base: Survey respondents who rated counter search service (n1=263) Note: “No comment” data (n2=1) are excluded and percentages may not add up to 100 due to rounding
- 12 -
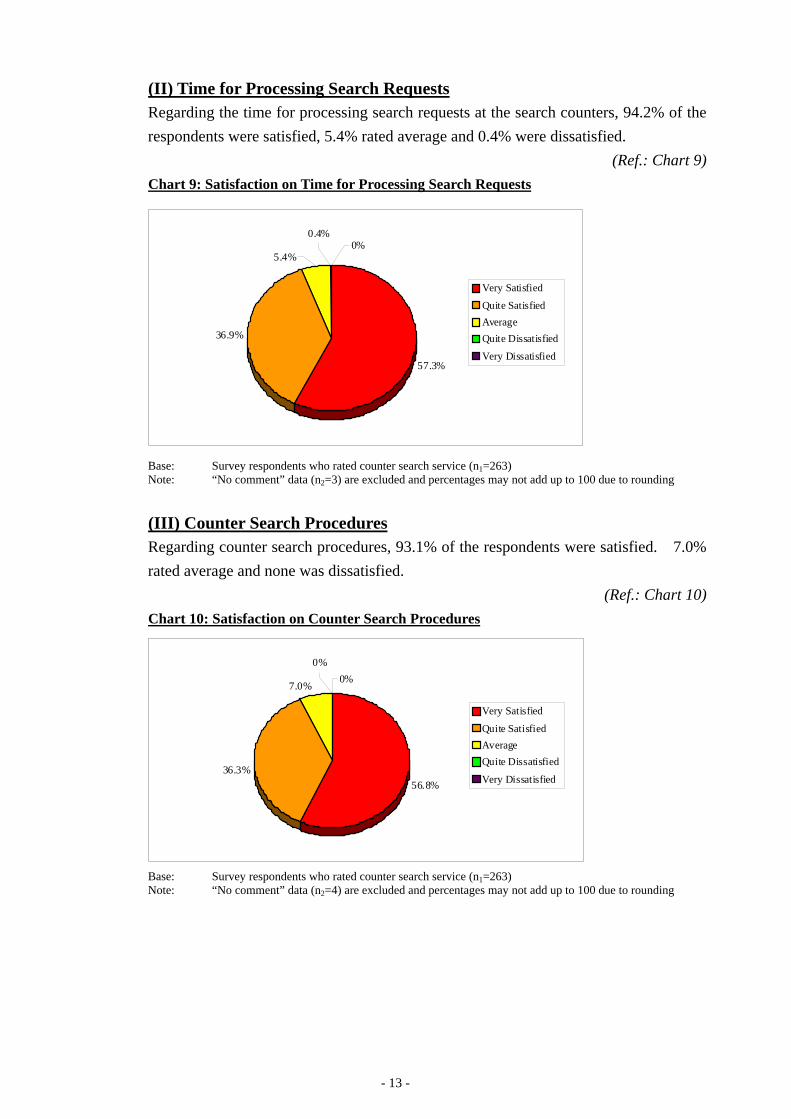
(II) Time for Processing Search Requests Regarding the time for processing search requests at the search counters, 94.2% of the respondents were satisfied, 5.4% rated average and 0.4% were dissatisfied.
(Ref.: Chart 9) Chart 9: Satisfaction on Time for Processing Search Requests
57.3%
36.9%
5.4%
0.4% 0%
Very Satisfied
Quite Satisfied Average Quite Dissatisfied
Very Dissatisfied
Base: Survey respondents who rated counter search service (n1=263) Note: “No comment” data (n2=3) are excluded and percentages may not add up to 100 due to rounding
(III) Counter Search Procedures Regarding counter search procedures, 93.1% of the respondents were satisfied. 7.0% rated average and none was dissatisfied.
(Ref.: Chart 10) Chart 10: Satisfaction on Counter Search Procedures
56.8% 36.3%
7.0%
0% 0%
Very Satisfied
Quite Satisfied Average Quite Dissatisfied
Very Dissatisfied
Base: Survey respondents who rated counter search service (n1=263) Note: “No comment” data (n2=4) are excluded and percentages may not add up to 100 due to rounding
- 13 -
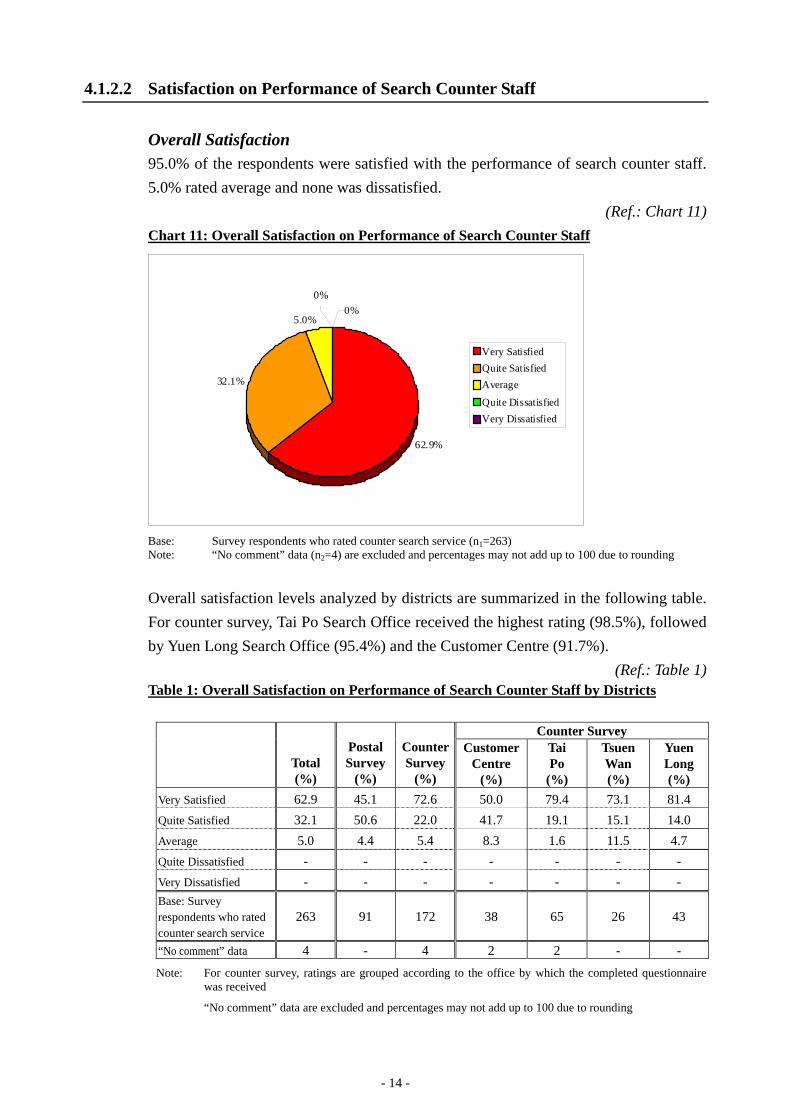
4.1.2.2 Satisfaction on Performance of Search Counter Staff
Overall Satisfaction 95.0% of the respondents were satisfied with the performance of search counter staff. 5.0% rated average and none was dissatisfied.
(Ref.: Chart 11) Chart 11: Overall Satisfaction on Performance of Search Counter Staff
62.9%
32.1%
5.0%
0% 0%
Very Satisfied Quite Satisfied Average
Quite Dissatisfied Very Dissatisfied
Base: Survey respondents who rated counter search service (n1=263) Note: “No comment” data (n2=4) are excluded and percentages may not add up to 100 due to rounding
Overall satisfaction levels analyzed by districts are summarized in the following table. For counter survey, Tai Po Search Office received the highest rating (98.5%), followed by Yuen Long Search Office (95.4%) and the Customer Centre (91.7%).
(Ref.: Table 1) Table 1: Overall Satisfaction on Performance of Search Counter Staff by Districts
Total (%)
Postal Survey
(%)
Counter Survey
(%)
Counter Survey Customer
Centre (%)
Tai Po
(%)
Tsuen Wan (%)
Yuen Long (%)
Very Satisfied 62.9 45.1 72.6 50.0 79.4 73.1 81.4 Quite Satisfied 32.1 50.6 22.0 41.7 19.1 15.1 14.0 Average 5.0 4.4 5.4 8.3 1.6 11.5 4.7 Quite Dissatisfied - - - - - - -Very Dissatisfied - - - - - - -Base: Survey respondents who rated counter search service
263 91 172 38 65 26 43
“No comment” data 4 - 4 2 2 - -
Note: For counter survey, ratings are grouped according to the office by which the completed questionnaire was received
“No comment” data are excluded and percentages may not add up to 100 due to rounding
- 14 -
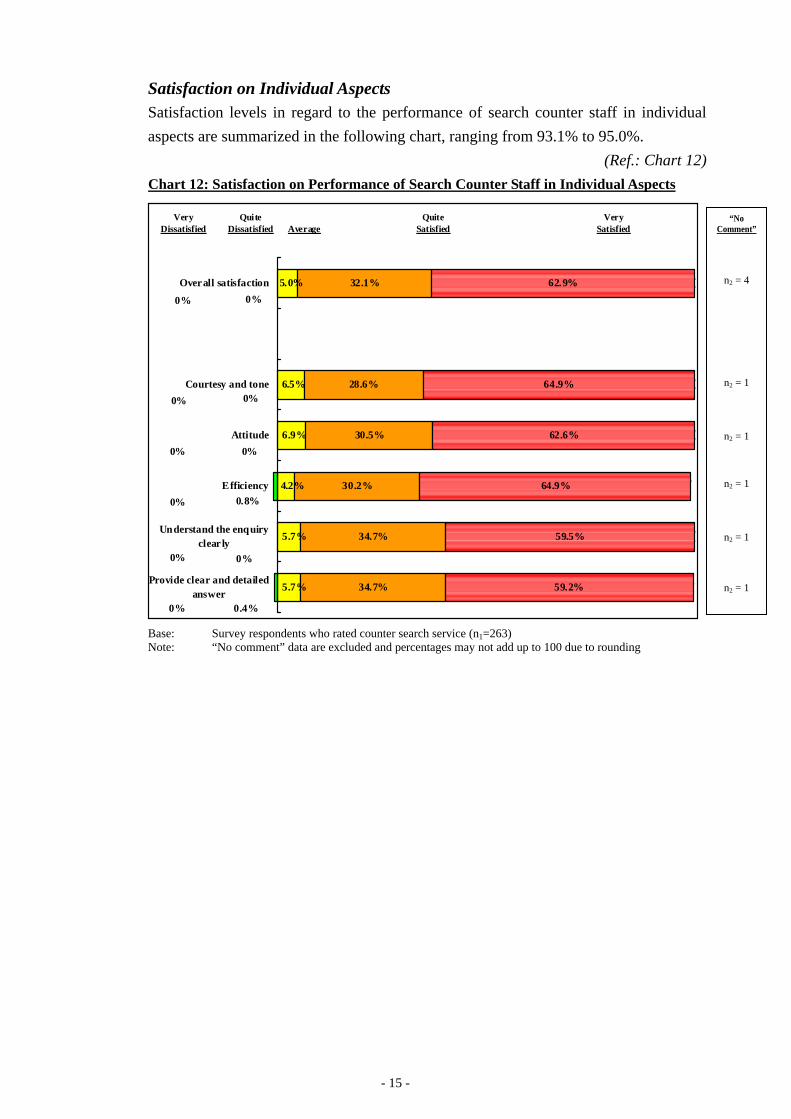
Satisfaction on Individual Aspects Satisfaction levels in regard to the performance of search counter staff in individual aspects are summarized in the following chart, ranging from 93.1% to 95.0%.
(Ref.: Chart 12) Chart 12: Satisfaction on Performance of Search Counter Staff in Individual Aspects
34.7%
34.7%
30.2%
30.5%
28.6%
32.1% 5.0%
6.5%
6.9%
5.7%
5.7%
4.2%
59.2%
59.5%
64.9%
62.6%
64.9%
62.9%
0%
0%
0.4%
0%
0.8%
0%
0%
0%
0%
0%
0%
0%
Provide clear and detailed answer
Understand the enquiry clear ly
Efficiency
Attitude
Courtesy and tone
Overall satisfaction
Very Dissatisfied
Qui te Dissatisfied Average
Quite Satisfied
Very Satisfied
“No Comment”
n2 = 4
n2 = 1
n2 = 1
n2 = 1
n2 = 1
n2 = 1
Base: Survey respondents who rated counter search service (n1=263) Note: “No comment” data are excluded and percentages may not add up to 100 due to rounding
- 15 -
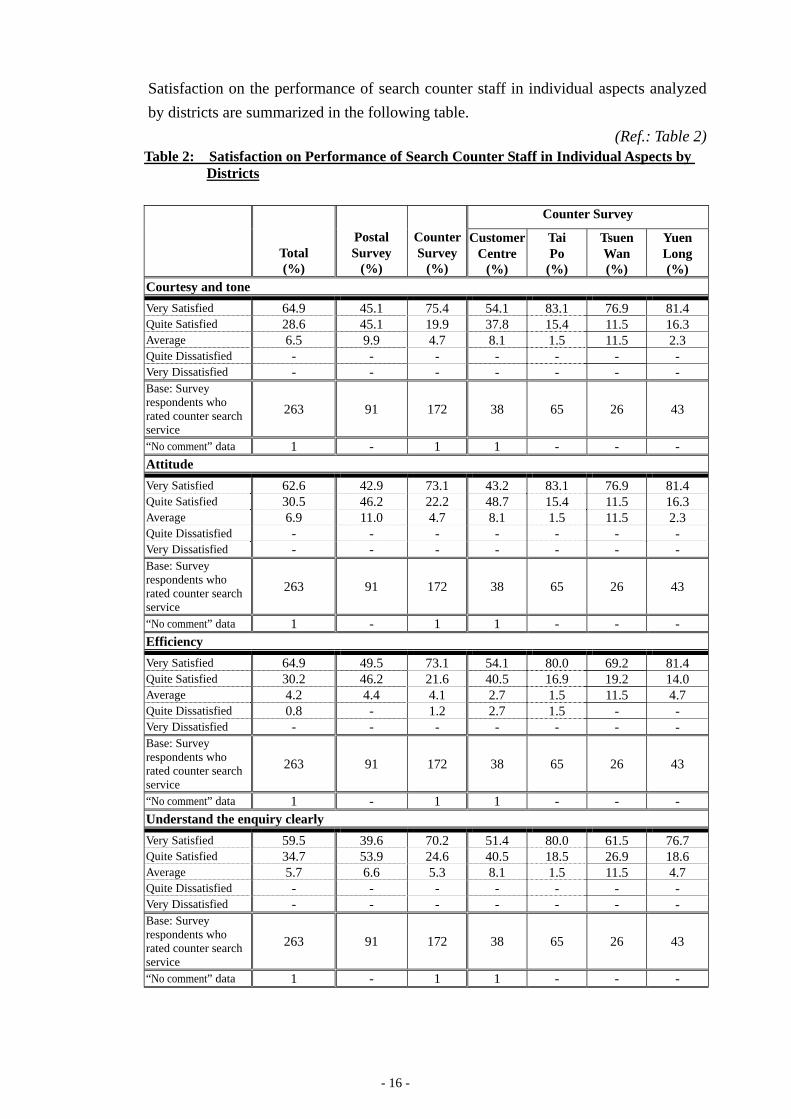
Satisfaction on the performance of search counter staff in individual aspects analyzed by districts are summarized in the following table.
(Ref.: Table 2) Table 2: Satisfaction on Performance of Search Counter Staff in Individual Aspects by
Districts
Total (%)
Postal Survey
(%)
Counter Survey
(%)
Counter Survey
Customer Centre
(%)
Tai Po
(%)
Tsuen Wan (%)
Yuen Long (%)
Courtesy and tone Very Satisfied Quite Satisfied Average Quite Dissatisfied Very Dissatisfied
64.9 28.6 6.5 --
45.1 45.1 9.9 --
75.4 19.9 4.7 --
54.1 37.8 8.1 --
83.1 15.4 1.5 --
76.9 11.5 11.5
--
81.4 16.3 2.3 --
Base: Survey respondents who rated counter search service
263 91 172 38 65 26 43
“No comment” data 1 - 1 1 - - -Attitude Very Satisfied Quite Satisfied Average Quite Dissatisfied Very Dissatisfied
62.6 30.5 6.9 --
42.9 46.2 11.0
--
73.1 22.2 4.7 --
43.2 48.7 8.1 --
83.1 15.4 1.5 --
76.9 11.5 11.5
--
81.4 16.3 2.3 --
Base: Survey respondents who rated counter search service
263 91 172 38 65 26 43
“No comment” data 1 - 1 1 - - -Efficiency Very Satisfied Quite Satisfied Average Quite Dissatisfied Very Dissatisfied
64.9 30.2 4.2 0.8 -
49.5 46.2 4.4 --
73.1 21.6 4.1 1.2 -
54.1 40.5 2.7 2.7 -
80.0 16.9 1.5 1.5 -
69.2 19.2 11.5
--
81.4 14.0 4.7 --
Base: Survey respondents who rated counter search service
263 91 172 38 65 26 43
“No comment” data 1 - 1 1 - - -Understand the enquiry clearly Very Satisfied Quite Satisfied Average Quite Dissatisfied Very Dissatisfied
59.5 34.7 5.7 --
39.6 53.9 6.6 --
70.2 24.6 5.3 --
51.4 40.5 8.1 --
80.0 18.5 1.5 --
61.5 26.9 11.5
--
76.7 18.6 4.7 --
Base: Survey respondents who rated counter search service
263 91 172 38 65 26 43
“No comment” data 1 - 1 1 - - -
- 16 -
Total (%)
Postal Survey
(%)
Counter Survey
(%)
Counter Survey
Customer Centre
(%)
Tai Po
(%)
Tsuen Wan (%)
Yuen Long (%)
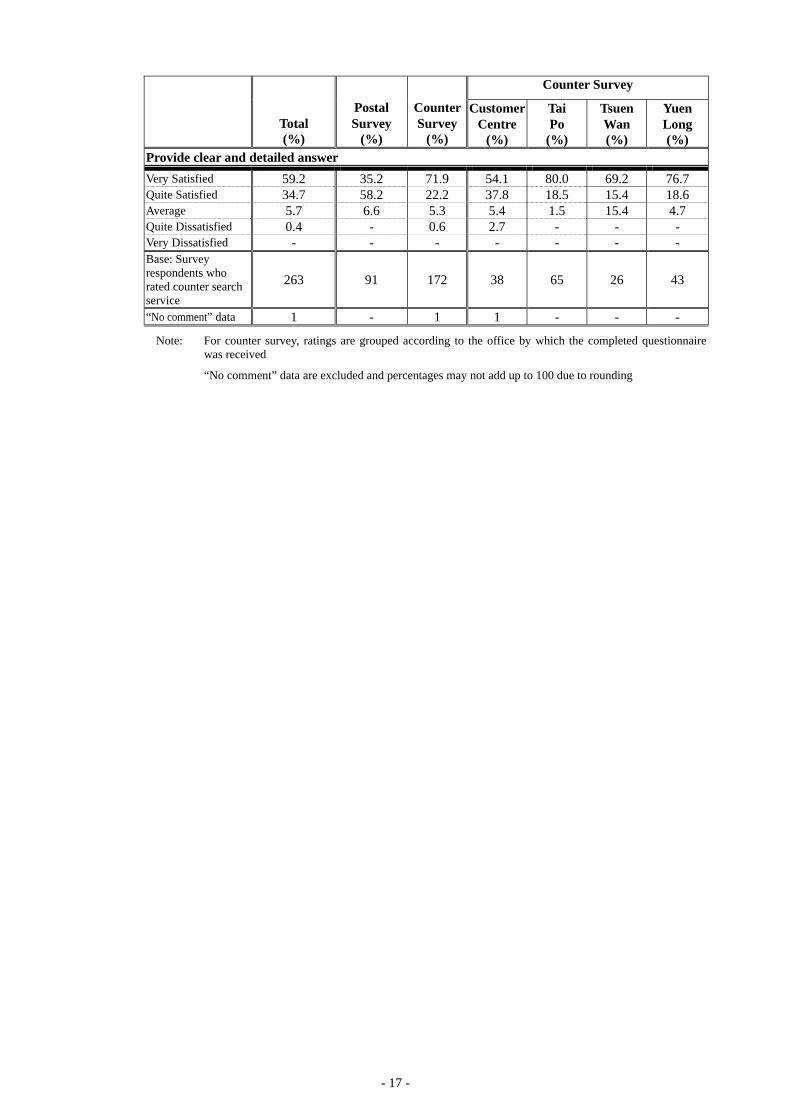
Provide clear and detailed answer Very Satisfied 59.2 35.2 71.9 54.1 80.0 69.2 76.7 Quite Satisfied 34.7 58.2 22.2 37.8 18.5 15.4 18.6 Average 5.7 6.6 5.3 5.4 1.5 15.4 4.7 Quite Dissatisfied 0.4 - 0.6 2.7 - - -Very Dissatisfied - - - - - - -Base: Survey respondents who rated counter search service
263 91 172 38 65 26 43
“No comment” data 1 - 1 1 - - -
Note: For counter survey, ratings are grouped according to the office by which the completed questionnaire was received
“No comment” data are excluded and percentages may not add up to 100 due to rounding
- 17 -
4.1.3 Self-service Search
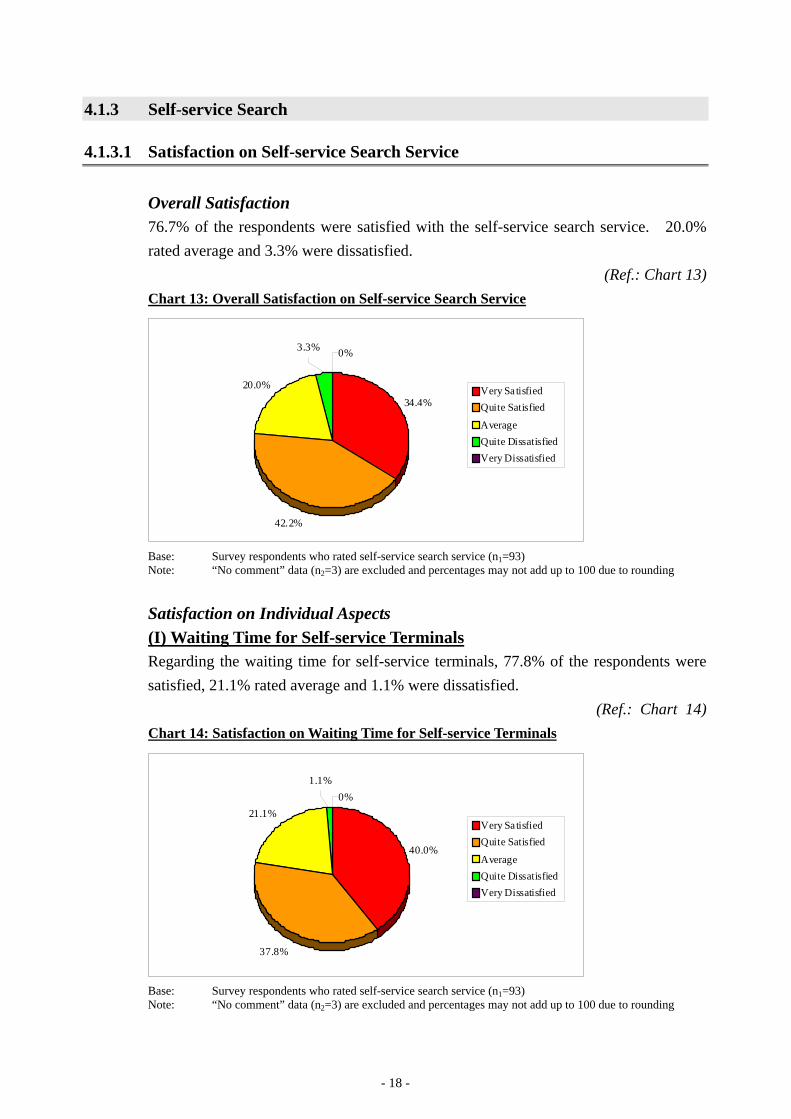
4.1.3.1 Satisfaction on Self-service Search Service
Overall Satisfaction 76.7% of the respondents were satisfied with the self-service search service. 20.0% rated average and 3.3% were dissatisfied.
(Ref.: Chart 13) Chart 13: Overall Satisfaction on Self-service Search Service
34.4%
42.2%
20.0%
3.3% 0%
Very Sa tisfied Quite Satisfied
Average Quite Dissatisfied Very Dissatisfied
Base: Survey respondents who rated self-service search service (n1=93) Note: “No comment” data (n2=3) are excluded and percentages may not add up to 100 due to rounding
Satisfaction on Individual Aspects (I) Waiting Time for Self-service Terminals Regarding the waiting time for self-service terminals, 77.8% of the respondents were satisfied, 21.1% rated average and 1.1% were dissatisfied.
(Ref.: Chart 14) Chart 14: Satisfaction on Waiting Time for Self-service Terminals
40.0%
37.8%
21.1%
1.1% 0%
Very Sa tisfied Quite Satisfied
Average Quite Dissatisfied Very Dissatisfied
Base: Survey respondents who rated self-service search service (n1=93) Note: “No comment” data (n2=3) are excluded and percentages may not add up to 100 due to rounding
- 18 -
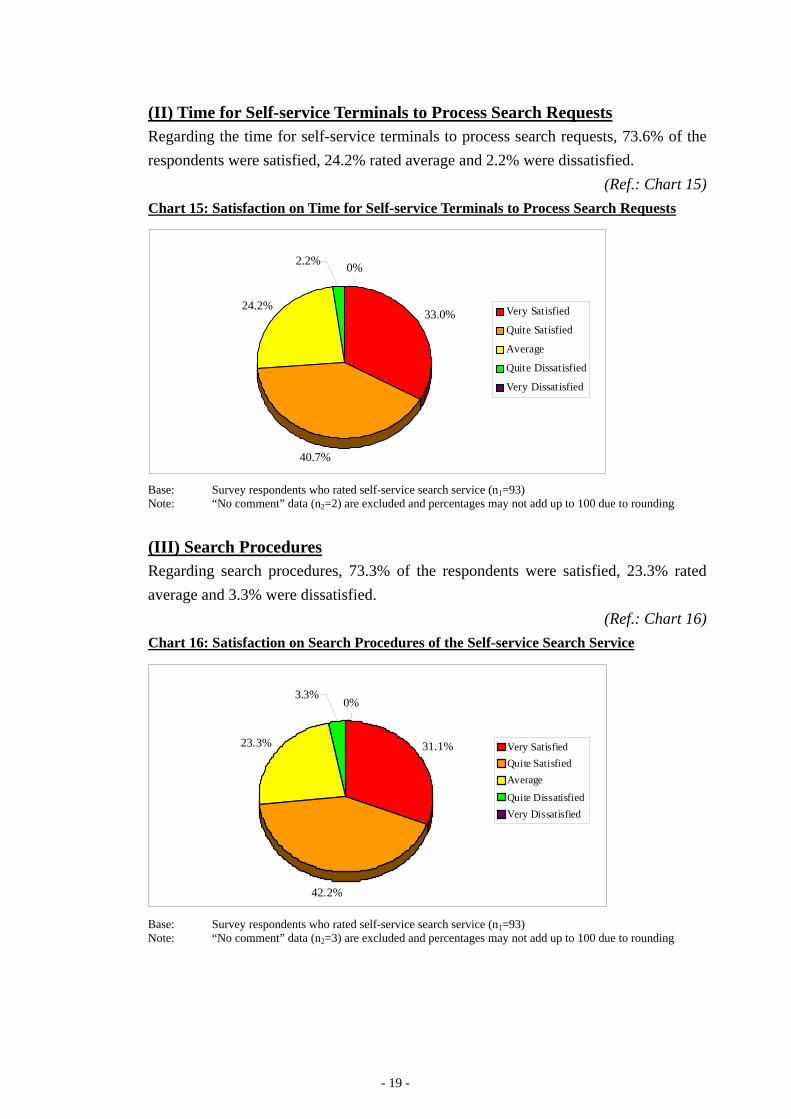
(II) Time for Self-service Terminals to Process Search Requests Regarding the time for self-service terminals to process search requests, 73.6% of the respondents were satisfied, 24.2% rated average and 2.2% were dissatisfied.
(Ref.: Chart 15) Chart 15: Satisfaction on Time for Self-service Terminals to Process Search Requests
33.0%
40.7%
24.2%
0%2.2%
Very Sat isfied
Quite Satisfied
Average
Quite Dissatisfied
Very Dissatisfied
Base: Survey respondents who rated self-service search service (n1=93) Note: “No comment” data (n2=2) are excluded and percentages may not add up to 100 due to rounding
(III) Search Procedures Regarding search procedures, 73.3% of the respondents were satisfied, 23.3% rated average and 3.3% were dissatisfied.
(Ref.: Chart 16) Chart 16: Satisfaction on Search Procedures of the Self-service Search Service
31.1%
42.2%
23.3%
0%3.3%
Very Satisfied Quite Satisfied Average
Quite Dissatisfied Very Dissatisfied
Base: Survey respondents who rated self-service search service (n1=93) Note: “No comment” data (n2=3) are excluded and percentages may not add up to 100 due to rounding
- 19 -
4.1.3.2 Satisfaction on Performance of Self-service Search Supporting Staff
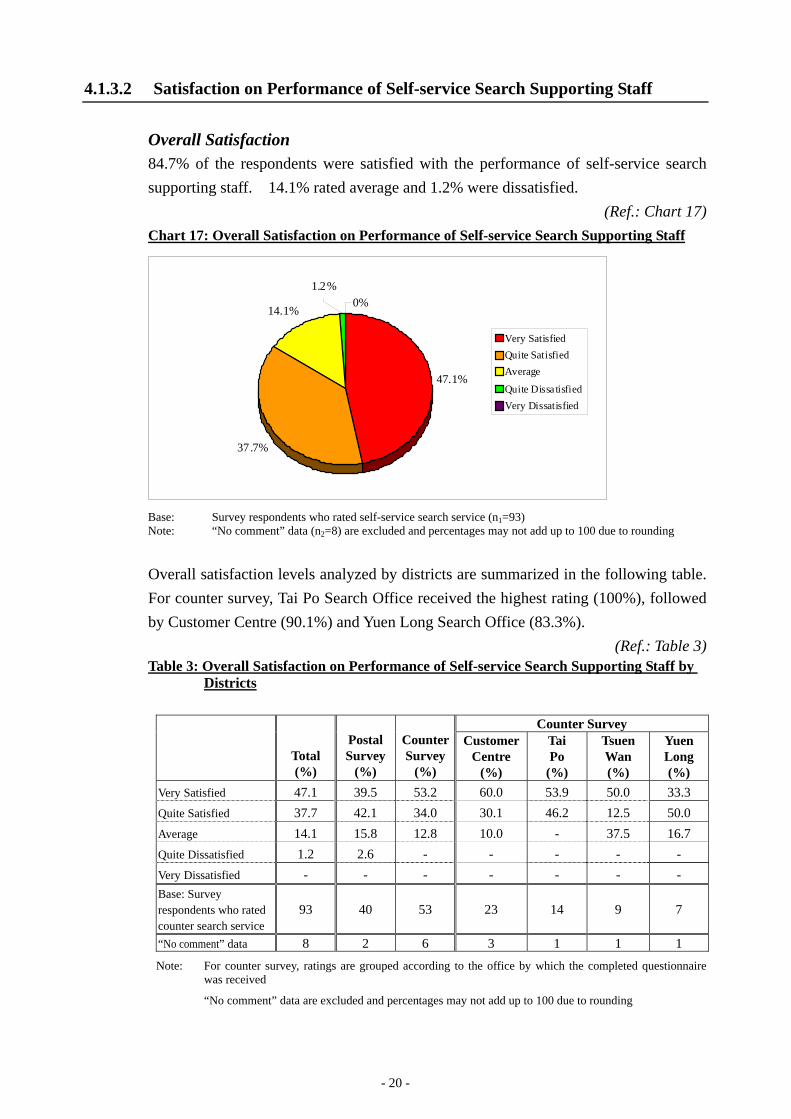
Overall Satisfaction 84.7% of the respondents were satisfied with the performance of self-service search supporting staff. 14.1% rated average and 1.2% were dissatisfied.
(Ref.: Chart 17) Chart 17: Overall Satisfaction on Performance of Self-service Search Supporting Staff
47.1%
37.7%
14.1%
1.2% 0%
Very Satisfied Quite Satisfied Average
Quite Dissa tisfied Very Dissatisfied
Base: Survey respondents who rated self-service search service (n1=93) Note: “No comment” data (n2=8) are excluded and percentages may not add up to 100 due to rounding
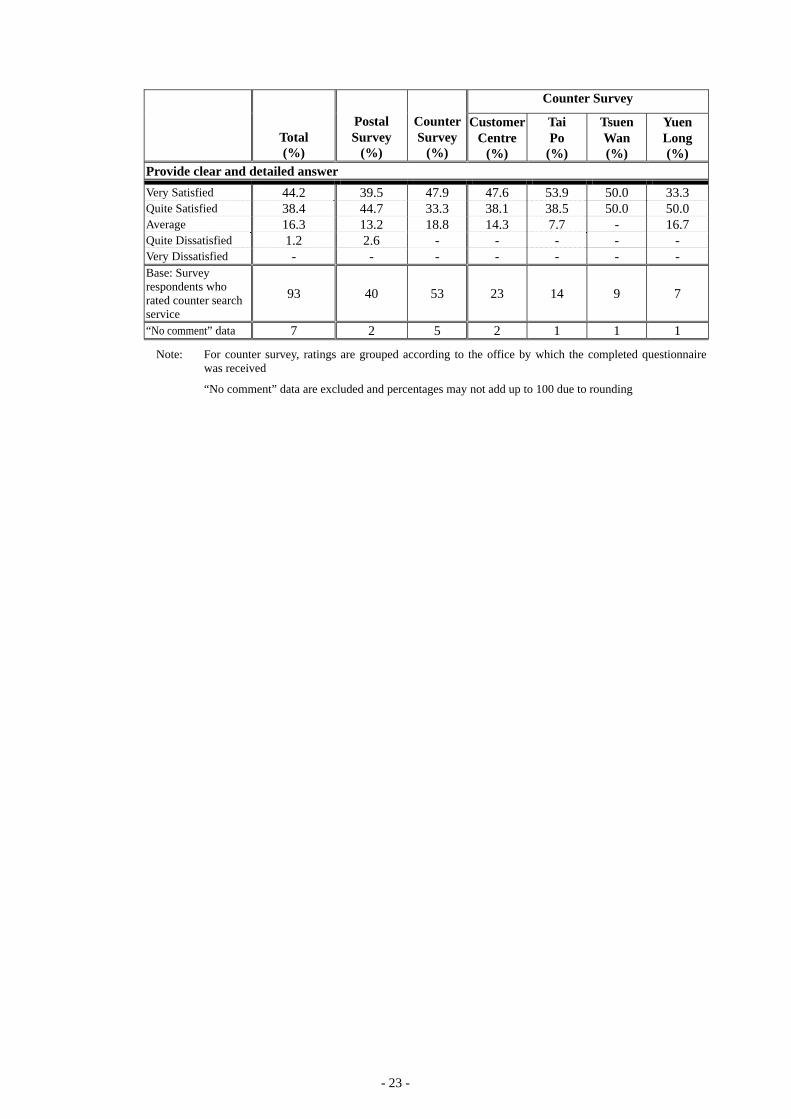
Overall satisfaction levels analyzed by districts are summarized in the following table. For counter survey, Tai Po Search Office received the highest rating (100%), followed by Customer Centre (90.1%) and Yuen Long Search Office (83.3%).
(Ref.: Table 3) Table 3: Overall Satisfaction on Performance of Self-service Search Supporting Staff by
Districts
Total (%)
Postal Survey
(%)
Counter Survey
(%)
Counter Survey Customer
Centre (%)
Tai Po
(%)
Tsuen Wan (%)
Yuen Long (%)
Very Satisfied 47.1 39.5 53.2 60.0 53.9 50.0 33.3 Quite Satisfied 37.7 42.1 34.0 30.1 46.2 12.5 50.0 Average 14.1 15.8 12.8 10.0 - 37.5 16.7 Quite Dissatisfied 1.2 2.6 - - - - -Very Dissatisfied - - - - - - -Base: Survey respondents who rated counter search service
93 40 53 23 14 9 7
“No comment” data 8 2 6 3 1 1 1
Note: For counter survey, ratings are grouped according to the office by which the completed questionnaire was received
“No comment” data are excluded and percentages may not add up to 100 due to rounding
- 20 -
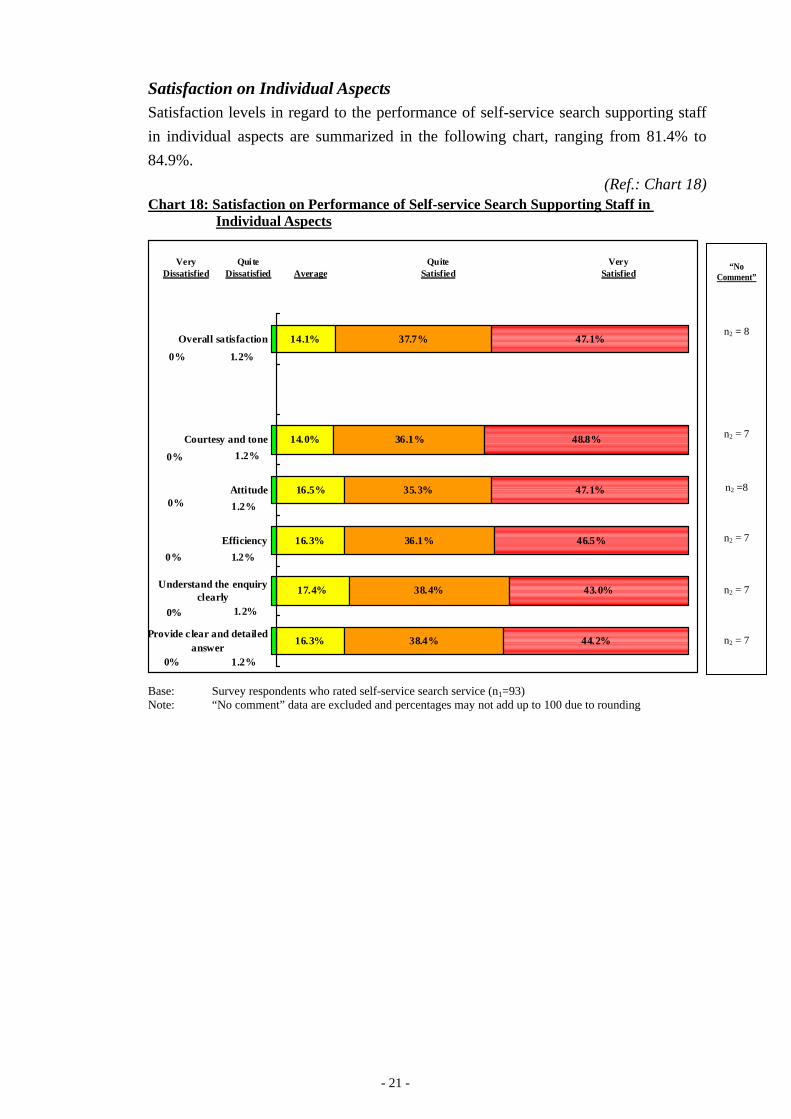
Satisfaction on Individual Aspects Satisfaction levels in regard to the performance of self-service search supporting staff in individual aspects are summarized in the following chart, ranging from 81.4% to 84.9%.
(Ref.: Chart 18) Chart 18: Satisfaction on Performance of Self-service Search Supporting Staff in
Individual Aspects
16.3%
17.4%
16.3%
16.5%
14.0%
14.1%
38.4%
38.4%
36.1%
35.3%
36.1%
37.7% 47.1%
48.8%
47.1%
46.5%
43.0%
44.2%
0%
1.2%
1.2%
1.2%
1.2% 0%
1.2%
1.2%
0%
0%
0%
0%
Provide c lear and detailed answer
Understand the enquiry clearly
Efficiency
Attitude
Courtesy and tone
Overall satisfaction
Very Dissatisfied
Qui te Dissatisfied Average
Quite Satisfied
Very Satisfied
“No Comment”
n2 = 8
n2 = 7
n2 =8
n2 = 7
n2 = 7
n2 = 7
Base: Survey respondents who rated self-service search service (n1=93) Note: “No comment” data are excluded and percentages may not add up to 100 due to rounding
- 21 -
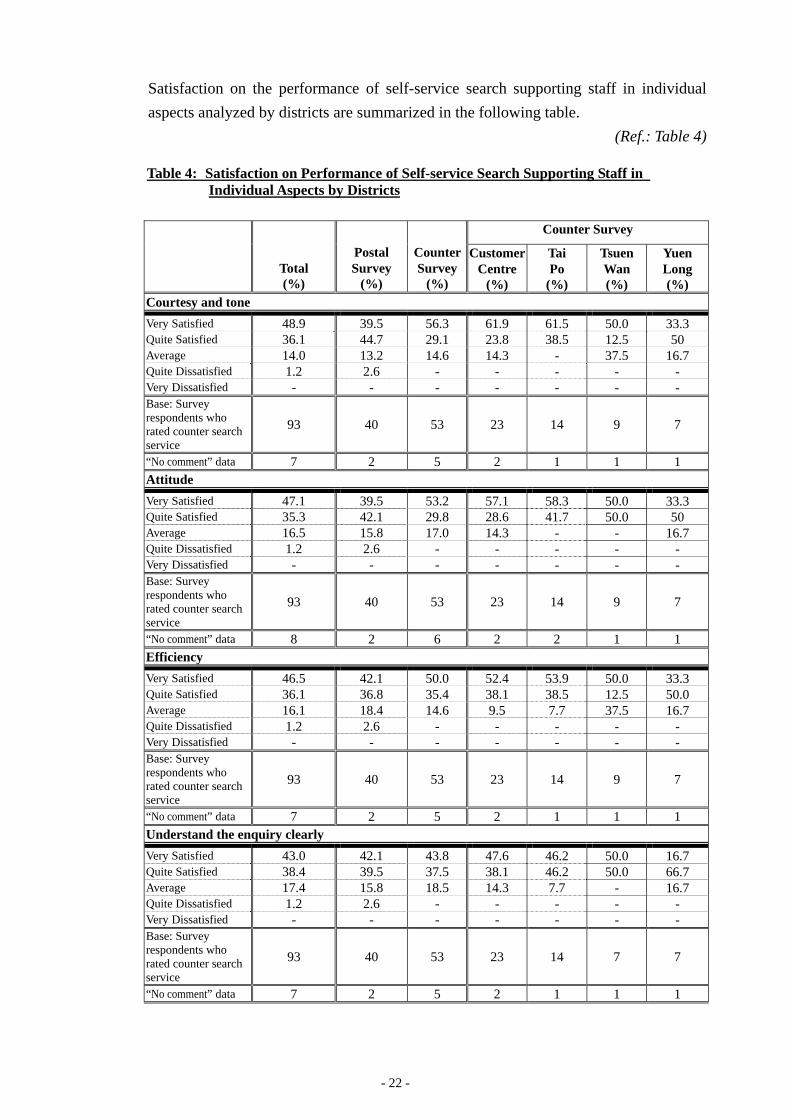
Satisfaction on the performance of self-service search supporting staff in individual aspects analyzed by districts are summarized in the following table.
(Ref.: Table 4)
Table 4: Satisfaction on Performance of Self-service Search Supporting Staff in Individual Aspects by Districts
Total (%)
Postal Survey
(%)
Counter Survey
(%)
Counter Survey
Customer Centre
(%)
Tai Po
(%)
Tsuen Wan (%)
Yuen Long (%)
Courtesy and tone Very Satisfied Quite Satisfied Average Quite Dissatisfied Very Dissatisfied
48.9 36.1 14.0 1.2 -
39.5 44.7 13.2 2.6 -
56.3 29.1 14.6
--
61.9 23.8 14.3
--
61.5 38.5
---
50.0 12.5 37.5
--
33.3 50
16.7 --
Base: Survey respondents who rated counter search service
93 40 53 23 14 9 7
“No comment” data 7 2 5 2 1 1 1 Attitude Very Satisfied Quite Satisfied Average Quite Dissatisfied Very Dissatisfied
47.1 35.3 16.5 1.2 -
39.5 42.1 15.8 2.6 -
53.2 29.8 17.0
--
57.1 28.6 14.3
--
58.3 41.7
---
50.0 50.0
---
33.3 50
16.7 --
Base: Survey respondents who rated counter search service
93 40 53 23 14 9 7
“No comment” data 8 2 6 2 2 1 1 Efficiency Very Satisfied Quite Satisfied Average Quite Dissatisfied Very Dissatisfied
46.5 36.1 16.1 1.2 -
42.1 36.8 18.4 2.6 -
50.0 35.4 14.6
--
52.4 38.1 9.5 --
53.9 38.5 7.7 --
50.0 12.5 37.5
--
33.3 50.0 16.7
--
Base: Survey respondents who rated counter search service
93 40 53 23 14 9 7
“No comment” data 7 2 5 2 1 1 1 Understand the enquiry clearly Very Satisfied Quite Satisfied Average Quite Dissatisfied Very Dissatisfied
43.0 38.4 17.4 1.2 -
42.1 39.5 15.8 2.6 -
43.8 37.5 18.5
--
47.6 38.1 14.3
--
46.2 46.2 7.7 --
50.0 50.0
---
16.7 66.7 16.7
--
Base: Survey respondents who rated counter search service
93 40 53 23 14 7 7
“No comment” data 7 2 5 2 1 1 1
- 22 -
Total (%)
Postal Survey
(%)
Counter Survey
(%)
Counter Survey
Customer Centre
(%)
Tai Po
(%)
Tsuen Wan (%)
Yuen Long (%)
Provide clear and detailed answer Very Satisfied 44.2 39.5 47.9 47.6 53.9 50.0 33.3 Quite Satisfied 38.4 44.7 33.3 38.1 38.5 50.0 50.0 Average 16.3 13.2 18.8 14.3 7.7 - 16.7 Quite Dissatisfied 1.2 2.6 - - - - -Very Dissatisfied - - - - - - -Base: Survey respondents who rated counter search service
93 40 53 23 14 9 7
“No comment” data 7 2 5 2 1 1 1
Note: For counter survey, ratings are grouped according to the office by which the completed questionnaire was received
“No comment” data are excluded and percentages may not add up to 100 due to rounding
- 23 -
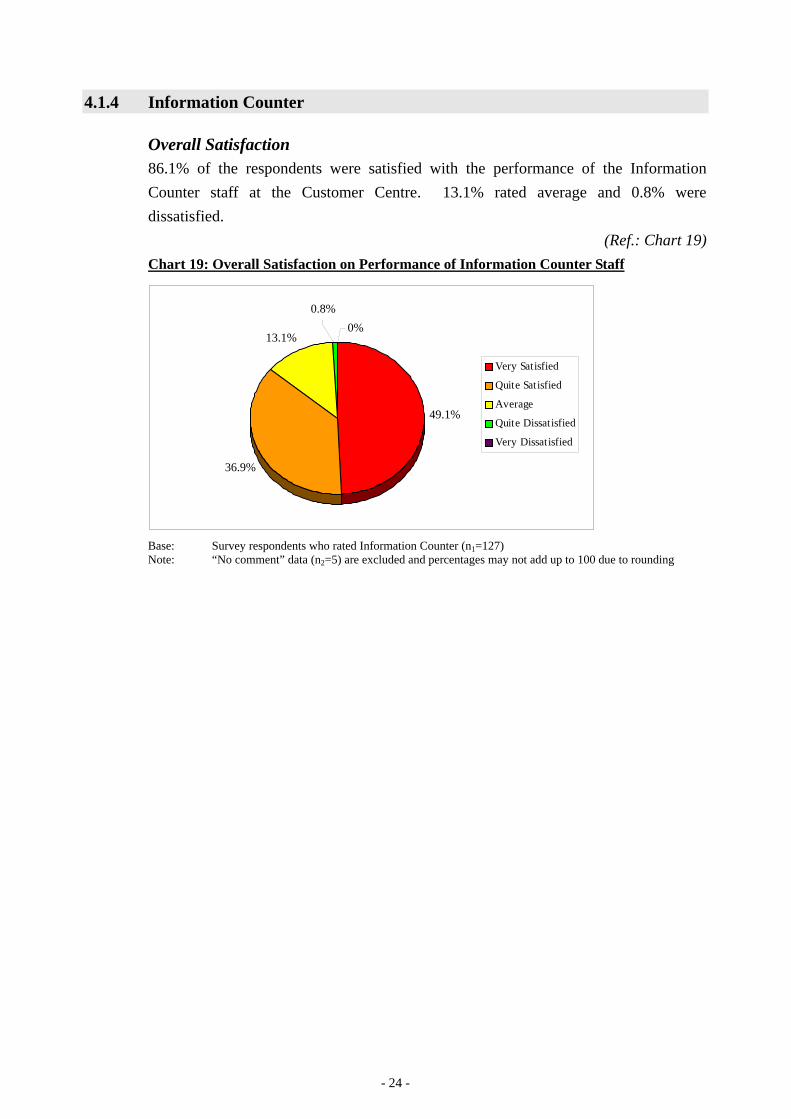
4.1.4 Information Counter
Overall Satisfaction 86.1% of the respondents were satisfied with the performance of the Information Counter staff at the Customer Centre. 13.1% rated average and 0.8% were dissatisfied.
(Ref.: Chart 19) Chart 19: Overall Satisfaction on Performance of Information Counter Staff
49.1%
36.9%
13.1%
0.8% 0%
Very Satisfied
Quite Satisfied
Average
Quite Dissatisfied
Very Dissatisfied
Base: Survey respondents who rated Information Counter (n1=127) Note: “No comment” data (n2=5) are excluded and percentages may not add up to 100 due to rounding
- 24 -
c
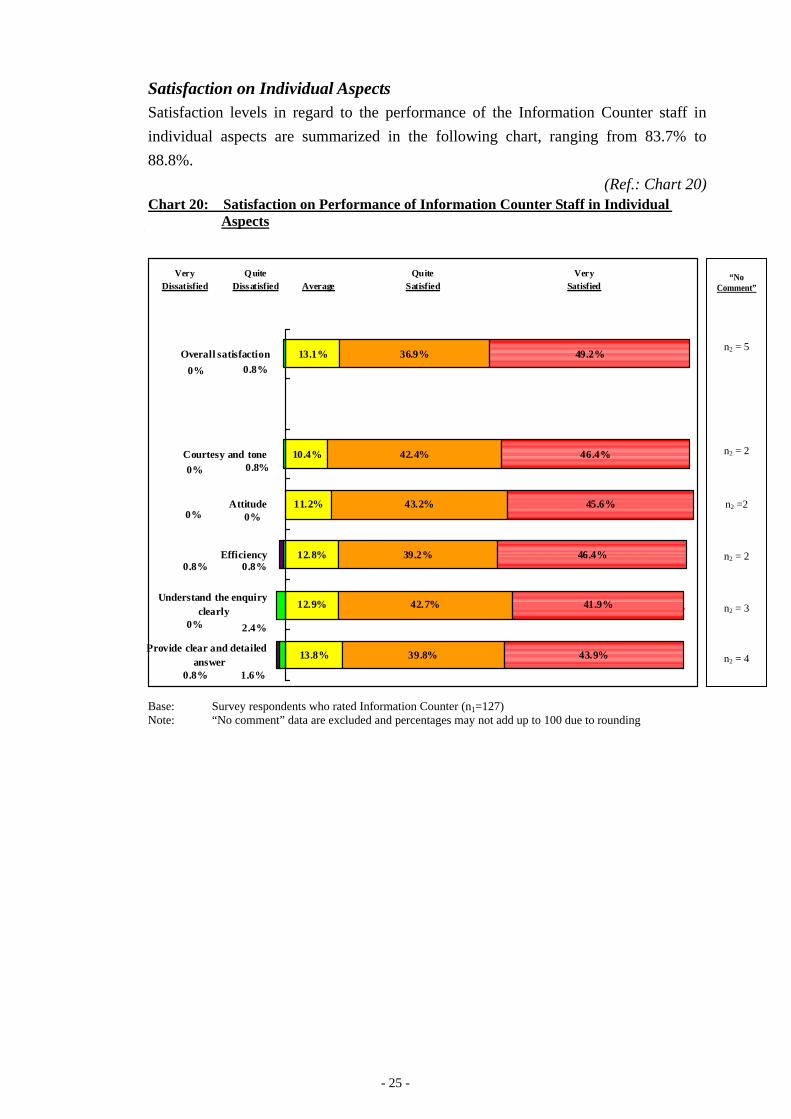
Satisfaction on Individual Aspects Satisfaction levels in regard to the performance of the Information Counter staff in individual aspects are summarized in the following chart, ranging from 83.7% to 88.8%.
(Ref.: Chart 20) Chart 20: Satisfaction on Performance of Information Counter Staff in Individual
Aspects
13.8%
12.9%
12.8%
11.2%
10.4%
13.1%
39.8%
42.7%
39.2%
43.2%
42.4%
36.9% 49.2%
46.4%
45.6%
46.4%
41.9%
43.9%
0.8%
0%
0.8%
0.8%
2.4%
1.6% 0.8%
0%
0%
0%
0%
0.8%
Provide clear and detailed answer
Understand the enquiry clearly
Efficiency
Attitude
Courtesy and tone
Overall satisfaction
Very Dissatisfied
Quite Dissatisfied Average
Quite Satisfied
Very Satisfied
“No Comment”
n2 = 5
n2 = 2
n2 =2
n2 = 2
n2 = 3
n2 = 4
Base: Survey respondents who rated Information Counter (n1=127) Note: “No comment” data are excluded and percentages may not add up to 100 due to rounding
- 25 -
4.1.5 Office Environment
Overall Satisfaction 93.1% of the respondents were satisfied with the environment of the Customer Centre / New Territories Search Offices. 6.5% rated average and 0.4% were dissatisfied.
(Ref.: Chart 21) Chart 21: Overall Satisfaction on Office Environment
50.2% 42.9%
6.5%
0.4% 0%
Very Sat isfied
Quite Satisfied
Average
Quite Dissatisfied
Very Dissatisfied
Base: Survey respondents who rated office environment (n1=252) Note: “No comment” data (n2=5) are excluded and percentages may not add up to 100 due to rounding
Overall satisfaction levels analyzed by districts are summarized in the following table. For counter survey, Tai Po Search Office received the highest rating (100%), followed by Customer Centre (95.5%) and Yuen Long Search Office (86.7%).
(Ref.: Table 5) Table 5: Overall Satisfaction on Office Environment by Districts
Total (%)
Postal Survey
(%)
Counter Survey
(%)
Counter Survey Customer
Centre (%)
Tai Po
(%)
Tsuen Wan (%)
Yuen Long (%)
Very Satisfied 50.2 39.8 59.0 68.2 63.9 45.8 50.0 Quite Satisfied 42.9 54.0 33.6 27.3 36.1 37.5 36.7 Average 6.5 6.2 6.7 4.6 - 12.5 13.3 Quite Dissatisfied 0.4 - 0.8 - - 4.2 -Very Dissatisfied - - - - - - -Base: Survey respondents who rated counter search service
252 116 136 45 36 25 30
“No comment” data 5 3 2 1 - 1 -
Note: For counter survey, ratings are grouped according to the office by which the completed questionnaire was received
“No comment” data are excluded and percentages may not add up to 100 due to rounding
- 26 -
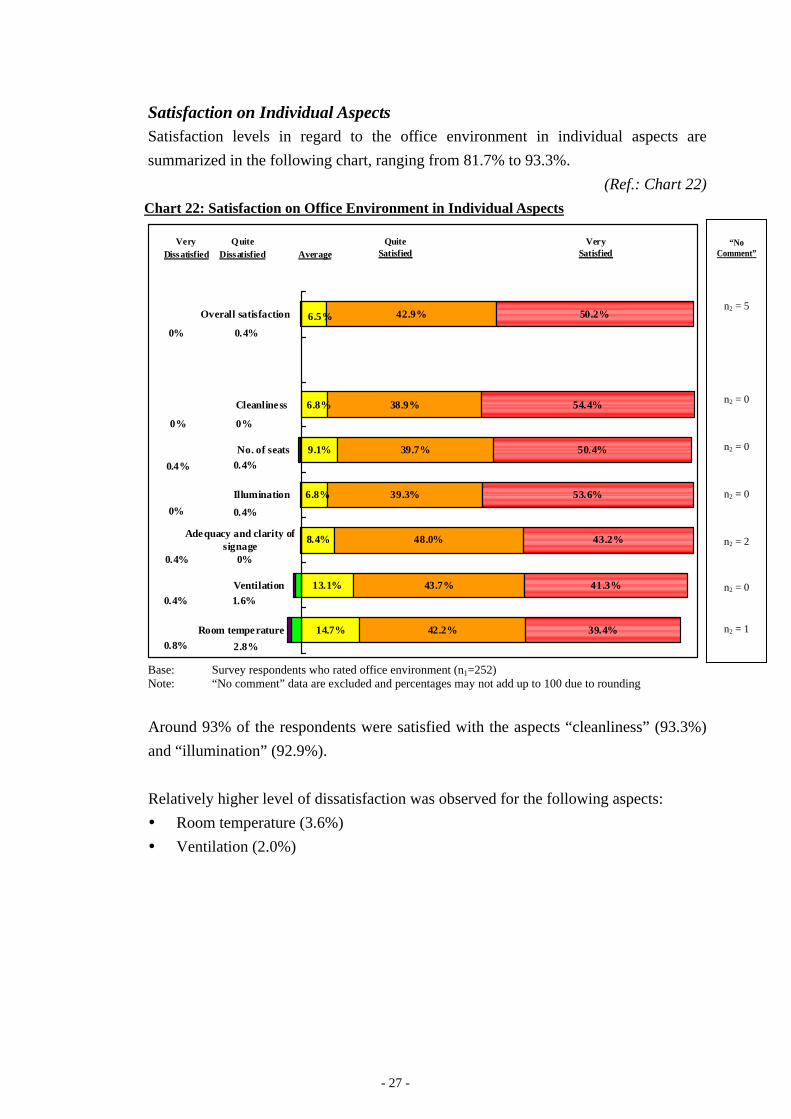
Satisfaction on Individual Aspects Satisfaction levels in regard to the office environment in individual aspects are summarized in the following chart, ranging from 81.7% to 93.3%.
(Ref.: Chart 22) Chart 22: Satisfaction on Office Environment in Individual Aspects
14.7%
13.1%
8.4%
9.1%
42.2%
43.7%
48.0%
39.3%
39.7%
38.9%
42.9%
39.4%
41.3%
43.2%
53.6%
50.4%
54.4%
50.2%
6.8%
6.5%
6.8%
2.8%
1.6%
0%
0.4%
0.4%
0%
0.4%
0.4%
0%
0.8%
0.4%
0.4%
0%
0%
Room tempe rature
Ventilation
Adequacy and clarity of signage
Illumination
No. of seats
Cleanline ss
Overall satisfaction
Very Diss atisfied
Quite Dissatisfied Average
Quite Satisfied
Very Satisfied
“No Comment”
n2 = 5
n2 = 0
n2 = 0
n2 = 0
n2 = 2
n2 = 0
n2 = 1
Base: Survey respondents who rated office environment (n1=252) Note: “No comment” data are excluded and percentages may not add up to 100 due to rounding
Around 93% of the respondents were satisfied with the aspects “cleanliness” (93.3%) and “illumination” (92.9%).
Relatively higher level of dissatisfaction was observed for the following aspects: y Room temperature (3.6%) y Ventilation (2.0%)
- 27 -
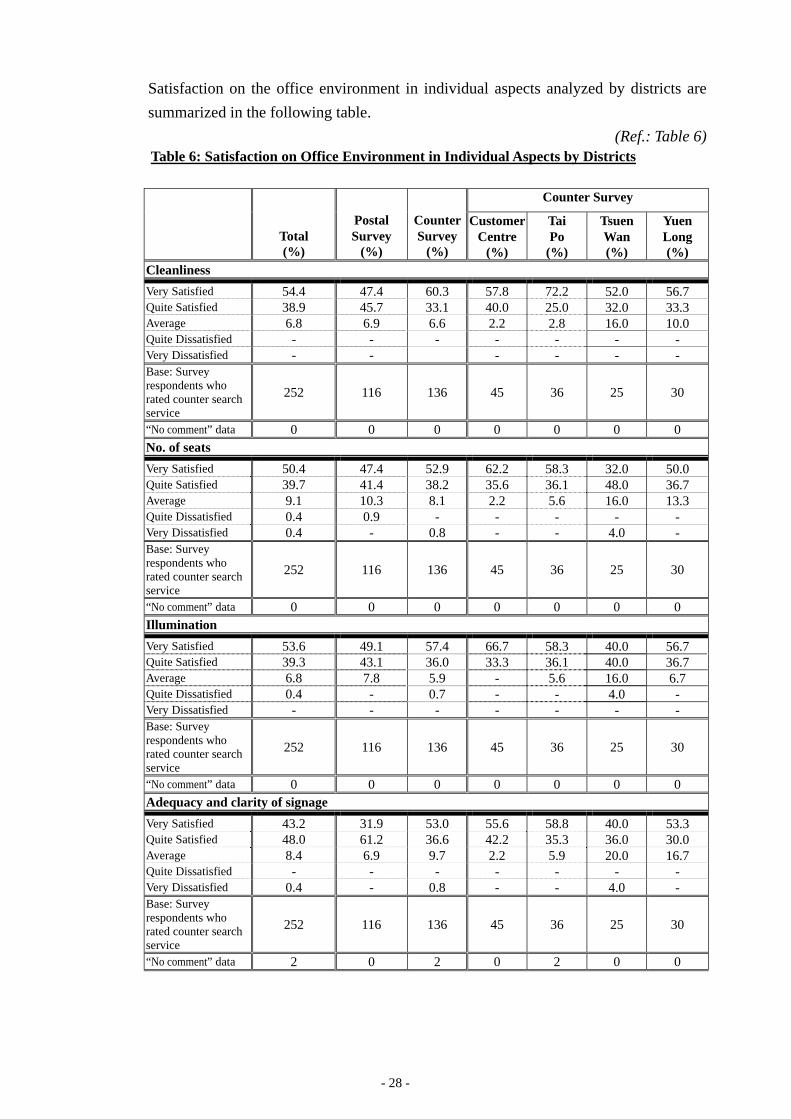
Satisfaction on the office environment in individual aspects analyzed by districts are summarized in the following table.
(Ref.: Table 6) Table 6: Satisfaction on Office Environment in Individual Aspects by Districts
Total (%)
Postal Survey
(%)
Counter Survey
(%)
Counter Survey
Customer Centre
(%)
Tai Po
(%)
Tsuen Wan (%)
Yuen Long (%)
Cleanliness Very Satisfied Quite Satisfied Average Quite Dissatisfied Very Dissatisfied
54.4 38.9 6.8 --
47.4 45.7 6.9 --
60.3 33.1 6.6 -
57.8 40.0 2.2 --
72.2 25.0 2.8 --
52.0 32.0 16.0
--
56.7 33.3 10.0
--
Base: Survey respondents who rated counter search service
252 116 136 45 36 25 30
“No comment” data 0 0 0 0 0 0 0 No. of seats Very Satisfied Quite Satisfied Average Quite Dissatisfied Very Dissatisfied
50.4 39.7 9.1 0.4 0.4
47.4 41.4 10.3 0.9 -
52.9 38.2 8.1 -
0.8
62.2 35.6 2.2 --
58.3 36.1 5.6 --
32.0 48.0 16.0
-4.0
50.0 36.7 13.3
--
Base: Survey respondents who rated counter search service
252 116 136 45 36 25 30
“No comment” data 0 0 0 0 0 0 0 Illumination Very Satisfied Quite Satisfied Average Quite Dissatisfied Very Dissatisfied
53.6 39.3 6.8 0.4 -
49.1 43.1 7.8 --
57.4 36.0 5.9 0.7 -
66.7 33.3
---
58.3 36.1 5.6 --
40.0 40.0 16.0 4.0 -
56.7 36.7 6.7 --
Base: Survey respondents who rated counter search service
252 116 136 45 36 25 30
“No comment” data 0 0 0 0 0 0 0 Adequacy and clarity of signage Very Satisfied Quite Satisfied Average Quite Dissatisfied Very Dissatisfied
43.2 48.0 8.4 -
0.4
31.9 61.2 6.9 --
53.0 36.6 9.7 -
0.8
55.6 42.2 2.2 --
58.8 35.3 5.9 --
40.0 36.0 20.0
-4.0
53.3 30.0 16.7
--
Base: Survey respondents who rated counter search service
252 116 136 45 36 25 30
“No comment” data 2 0 2 0 2 0 0
- 28 -
Total (%)
Postal Survey
(%)
Counter Survey
(%)
Counter Survey
Customer Centre
(%)
Tai Po
(%)
Tsuen Wan (%)
Yuen Long (%)
Ventilation Very Satisfied Quite Satisfied Average Quite Dissatisfied Very Dissatisfied
41.3 43.7 13.1 1.6 0.4
31.0 54.3 13.8 0.9 -
50.0 34.6 12.5 2.21 0.7
55.6 35.6 6.7 2.2 -
61.1 30.6 8.3 --
36.0 44.0 16.0
-4.0
40.0 30.0 23.3 6.7 -
Base: Survey respondents who rated counter search service
252 116 136 45 36 25 30
“No comment” data 0 0 0 0 0 0 0 Room temperature Very Satisfied Quite Satisfied Average Quite Dissatisfied Very Dissatisfied
39.4 42.2 14.7 2.8 0.8
31.3 51.3 16.5
-0.9
46.3 34.6 13.2 5.2 0.7
48.9 37.8 11.1 2.2 -
61.1 27.8 8.3 2.8 -
36.0 44.0 16.0
-4.0
33.3 30.0 20.0 16.7
-Base: Survey respondents who rated counter search service
252 116 136 45 36 25 30
“No comment” data 1 1 0 0 0 0 0
Note: For counter survey, ratings are grouped according to the office by which the completed questionnaire was received
“No comment” data are excluded and percentages may not add up to 100 due to rounding
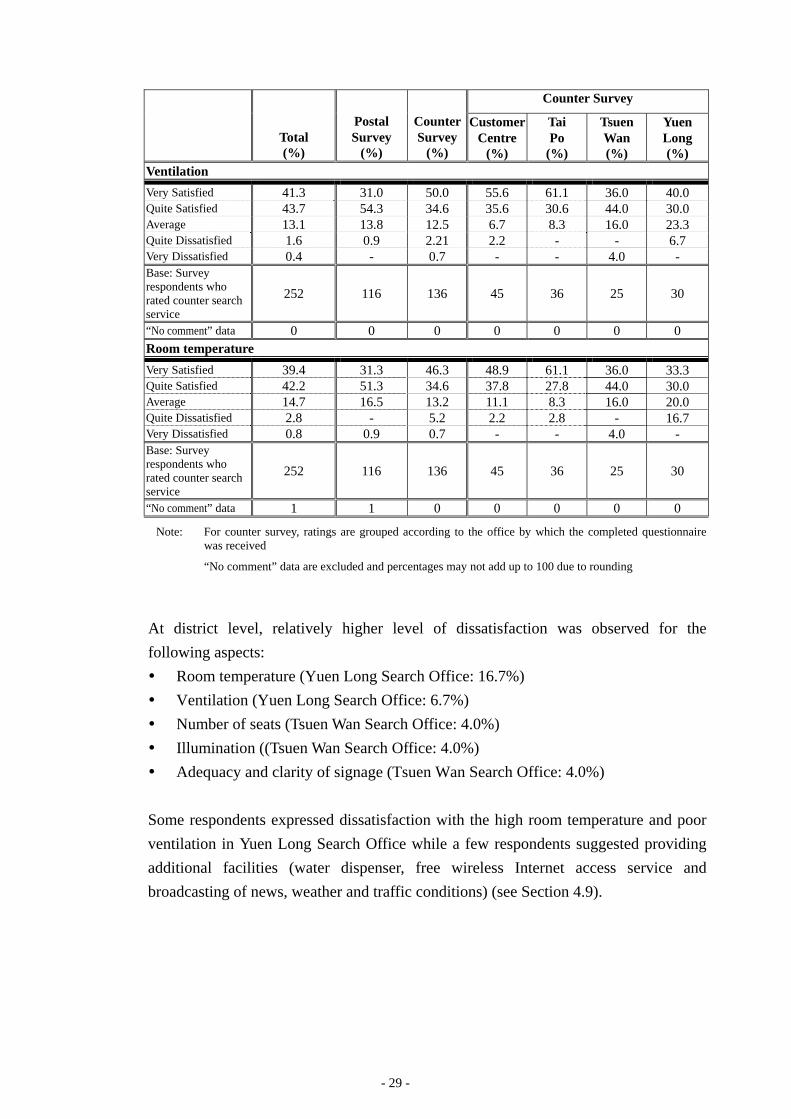
At district level, relatively higher level of dissatisfaction was observed for the following aspects: y Room temperature (Yuen Long Search Office: 16.7%) y Ventilation (Yuen Long Search Office: 6.7%) y Number of seats (Tsuen Wan Search Office: 4.0%) y Illumination ((Tsuen Wan Search Office: 4.0%) y Adequacy and clarity of signage (Tsuen Wan Search Office: 4.0%)
Some respondents expressed dissatisfaction with the high room temperature and poor ventilation in Yuen Long Search Office while a few respondents suggested providing additional facilities (water dispenser, free wireless Internet access service and broadcasting of news, weather and traffic conditions) (see Section 4.9).
- 29 -
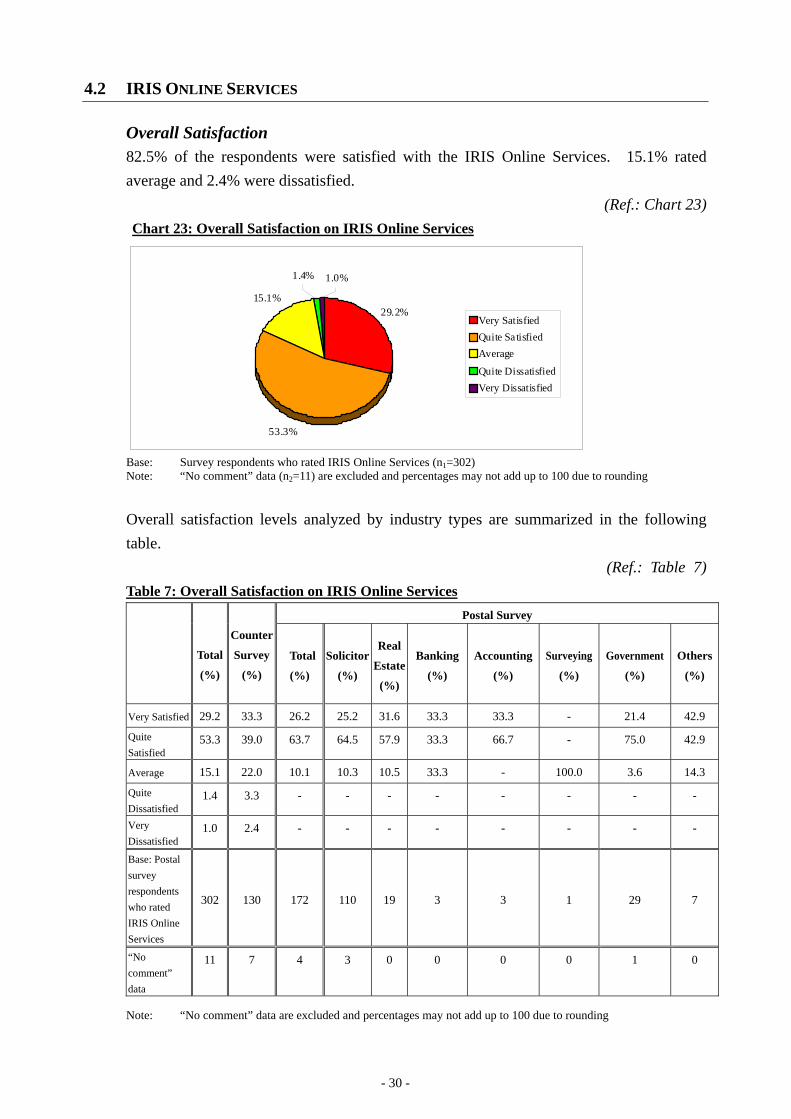
4.2 IRIS ONLINE SERVICES
Overall Satisfaction 82.5% of the respondents were satisfied with the IRIS Online Services. 15.1% rated average and 2.4% were dissatisfied.
(Ref.: Chart 23) Chart 23: Overall Satisfaction on IRIS Online Services
29.2%
53.3%
15.1%
1.4% 1.0%
Very Satisfied Quite Sa tisfied Average
Quite Dissatisfied Very Dissatisfied
Base: Survey respondents who rated IRIS Online Services (n1=302) Note: “No comment” data (n2=11) are excluded and percentages may not add up to 100 due to rounding
Overall satisfaction levels analyzed by industry types are summarized in the following table.
(Ref.: Table 7) Table 7: Overall Satisfaction on IRIS Online Services
Total
(%)
Counter
Survey
(%)
Postal Survey
Total
(%)
Solicitor
(%)
Real
Estate
(%)
Banking
(%)
Accounting
(%)
Surveying
(%)
Government
(%)
Others
(%)
Very Satisfied 29.2 33.3 26.2 25.2 31.6 33.3 33.3 - 21.4 42.9
Quite Satisfied
53.3 39.0 63.7 64.5 57.9 33.3 66.7 - 75.0 42.9
Average 15.1 22.0 10.1 10.3 10.5 33.3 - 100.0 3.6 14.3
Quite Dissatisfied
1.4 3.3 - - - - - - - -
Very Dissatisfied
1.0 2.4 - - - - - - - -
Base: Postal survey respondents who rated IRIS Online Services
302 130 172 110 19 3 3 1 29 7
“No comment” data
11 7 4 3 0 0 0 0 1 0
Note: “No comment” data are excluded and percentages may not add up to 100 due to rounding
- 30 -
Very Quite Quite Very Dissatisfied Dissatisfied Average Satisfied Satisfied
Overall satisfaction 53.3%
1.0% 1.4% 15.1% 29.2%
Ease of accessing the 12.5% 41.7%
website 1.0%
43.4%
1.4%
Ease of login (for 14.3% 41.6% 42.0%
subscribers) 1.3% 0.8%
Ease of operating /using 18.1% 56.3% the System
1.0% 2.1%
Design and appearance 24.9% 53.9%
of the webpage 1.4% 1.4%
Speed of system response 17.4% 49.5% 26.6%
& stability 1.7% 4.8%
Service hours 11.0% 50.3% 2.4% 1.4%
34.9%
18.4%
22.5%
“No Comment”
n2 = 11
n2 = 7
n2 = 64
n2 = 9
n2 = 9
n2 = 9
n2 = 10
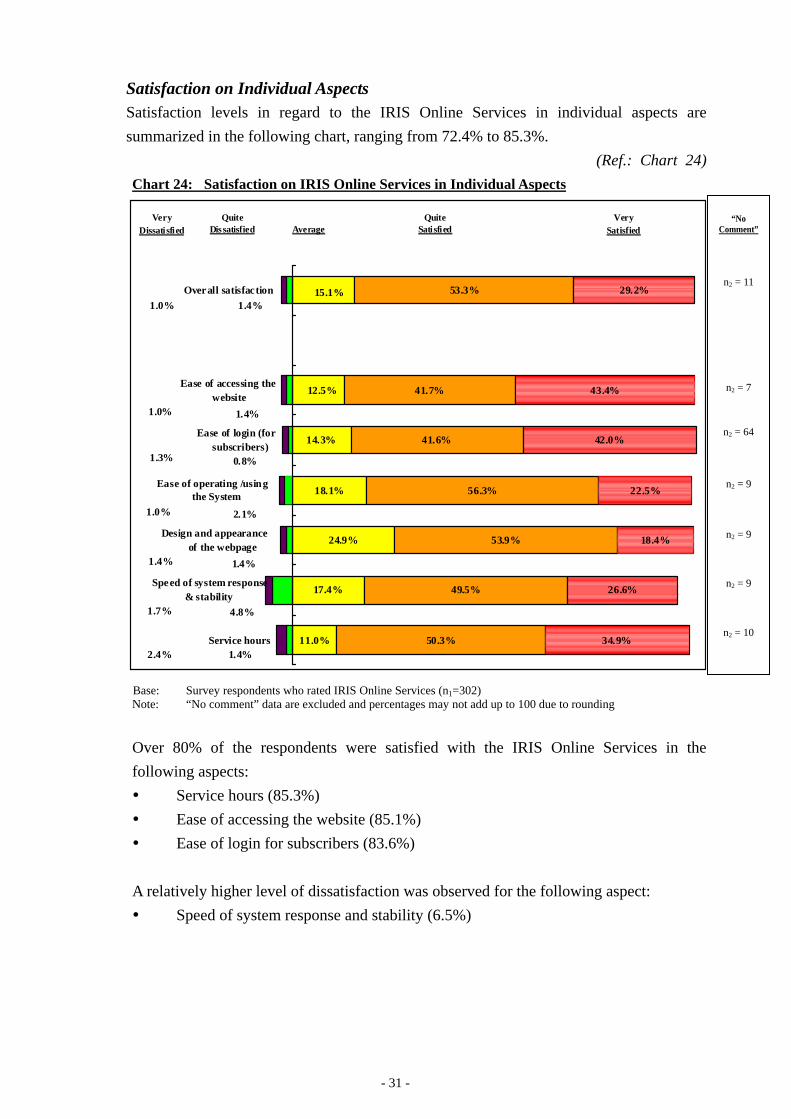
Satisfaction on Individual Aspects Satisfaction levels in regard to the IRIS Online Services in individual aspects are summarized in the following chart, ranging from 72.4% to 85.3%.
(Ref.: Chart 24) Chart 24: Satisfaction on IRIS Online Services in Individual Aspects
Base: Survey respondents who rated IRIS Online Services (n1=302) Note: “No comment” data are excluded and percentages may not add up to 100 due to rounding
Over 80% of the respondents were satisfied with the IRIS Online Services in the following aspects: y Service hours (85.3%) y Ease of accessing the website (85.1%) y Ease of login for subscribers (83.6%)
A relatively higher level of dissatisfaction was observed for the following aspect: y Speed of system response and stability (6.5%)
- 31 -
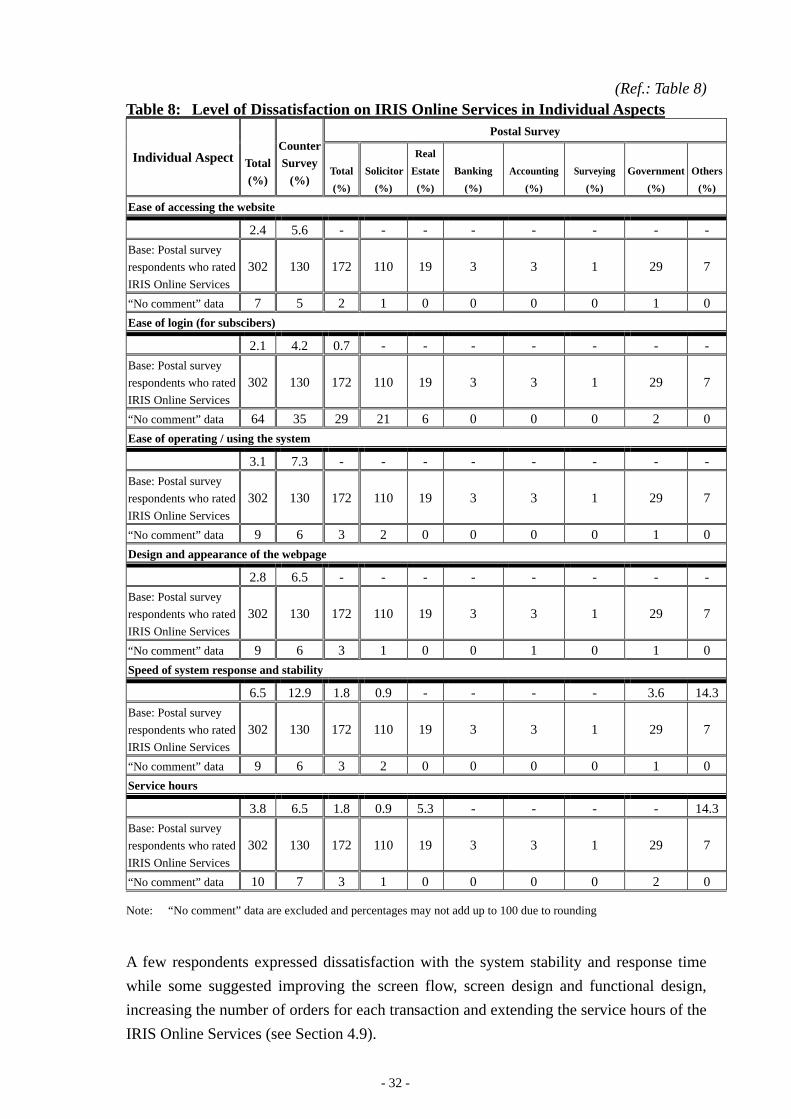
(Ref.: Table 8) Table 8: Level of Dissatisfaction on IRIS Online Services in Individual Aspects
Individual Aspect Total (%)
Counter Survey
(%)
Postal Survey
Total (%)
Solicitor (%)
Real Estate
(%) Banking
(%) Accounting
(%) Surveying
(%) Government
(%) Others
(%)
Ease of accessing the website
2.4 5.6 - - - - - - - -Base: Postal survey respondents who rated IRIS Online Services
302 130 172 110 19 3 3 1 29 7
“No comment” data 7 5 2 1 0 0 0 0 1 0 Ease of login (for subscibers)
2.1 4.2 0.7 - - - - - - -Base: Postal survey respondents who rated IRIS Online Services
302 130 172 110 19 3 3 1 29 7
“No comment” data 64 35 29 21 6 0 0 0 2 0 Ease of operating / using the system
3.1 7.3 - - - - - - - -Base: Postal survey respondents who rated IRIS Online Services
302 130 172 110 19 3 3 1 29 7
“No comment” data 9 6 3 2 0 0 0 0 1 0 Design and appearance of the webpage
2.8 6.5 - - - - - - - -Base: Postal survey respondents who rated IRIS Online Services
302 130 172 110 19 3 3 1 29 7
“No comment” data 9 6 3 1 0 0 1 0 1 0 Speed of system response and stability
6.5 12.9 1.8 0.9 - - - - 3.6 14.3 Base: Postal survey respondents who rated IRIS Online Services
302 130 172 110 19 3 3 1 29 7
“No comment” data 9 6 3 2 0 0 0 0 1 0 Service hours
3.8 6.5 1.8 0.9 5.3 - - - - 14.3 Base: Postal survey respondents who rated IRIS Online Services
302 130 172 110 19 3 3 1 29 7
“No comment” data 10 7 3 1 0 0 0 0 2 0
Note: “No comment” data are excluded and percentages may not add up to 100 due to rounding
A few respondents expressed dissatisfaction with the system stability and response time while some suggested improving the screen flow, screen design and functional design, increasing the number of orders for each transaction and extending the service hours of the IRIS Online Services (see Section 4.9).
- 32 -
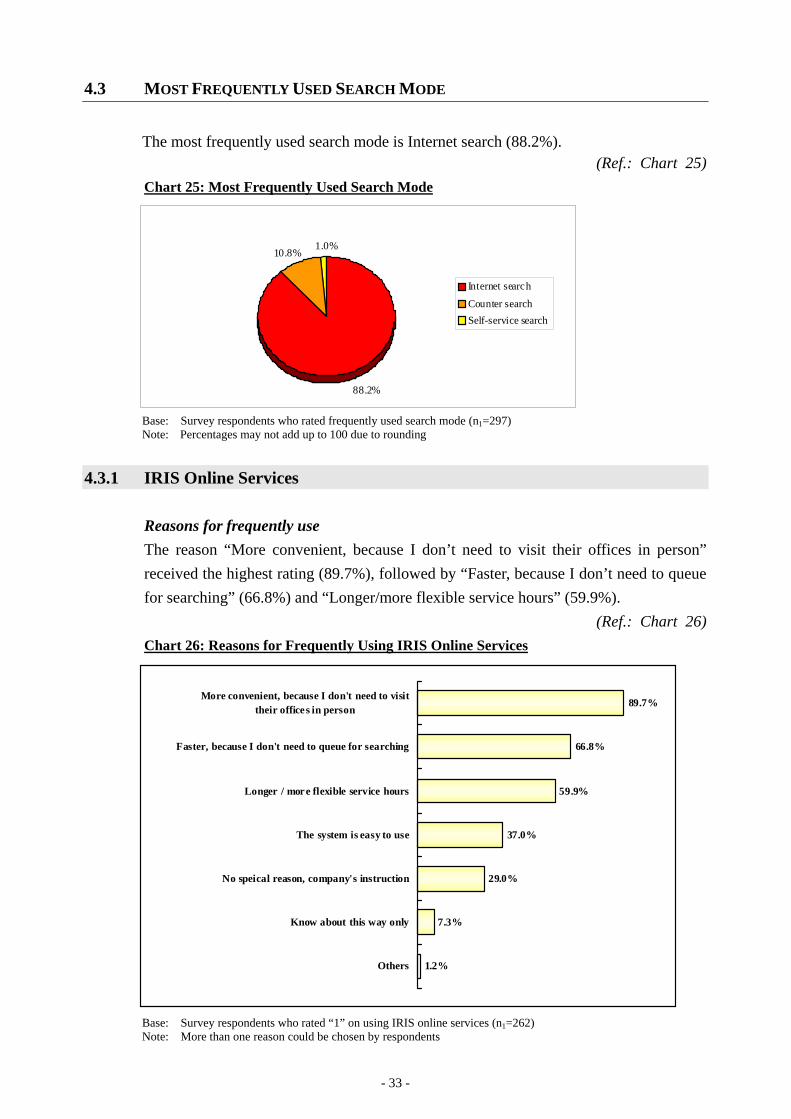
4.3 MOST FREQUENTLY USED SEARCH MODE
The most frequently used search mode is Internet search (88.2%). (Ref.: Chart 25)
Chart 25: Most Frequently Used Search Mode
88.2%
1.0% 10.8%
Internet search
Counter search Self-service search
Base: Survey respondents who rated frequently used search mode (n1=297) Note: Percentages may not add up to 100 due to rounding
4.3.1 IRIS Online Services
Reasons for frequently use The reason “More convenient, because I don’t need to visit their offices in person” received the highest rating (89.7%), followed by “Faster, because I don’t need to queue for searching” (66.8%) and “Longer/more flexible service hours” (59.9%).
(Ref.: Chart 26) Chart 26: Reasons for Frequently Using IRIS Online Services
1.2%
7.3%
29.0%
37.0%
59.9%
66.8%
89.7%
Others
Know about this way only
No speical reason, company's instruction
The system is easy to use
Longer / mor e flexible service hours
Faster, because I don't need to queue for searching
More convenient, because I don't need to visit their offices in person
Base: Survey respondents who rated “1” on using IRIS online services (n1=262) Note: More than one reason could be chosen by respondents
- 33 -
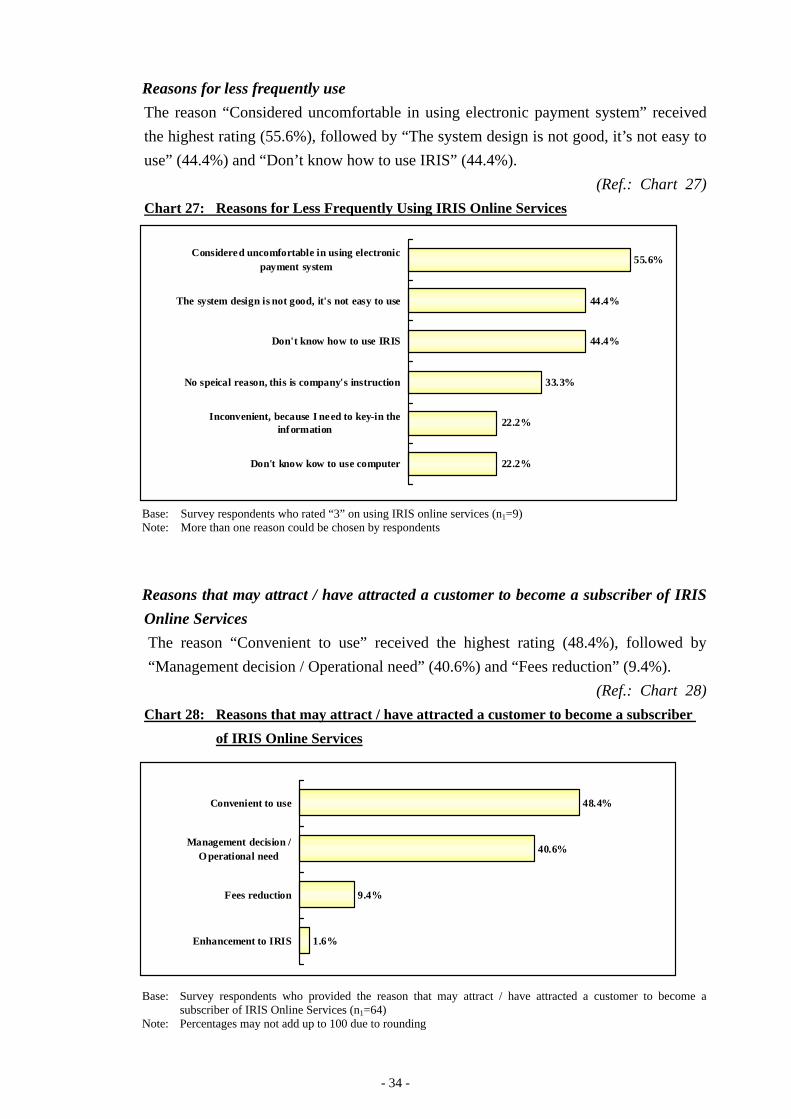
Reasons for less frequently use The reason “Considered uncomfortable in using electronic payment system” received the highest rating (55.6%), followed by “The system design is not good, it’s not easy to use” (44.4%) and “Don’t know how to use IRIS” (44.4%).
(Ref.: Chart 27) Chart 27: Reasons for Less Frequently Using IRIS Online Services
22.2%
22.2%
33.3%
44.4%
44.4%
55.6%
Don't know kow to use computer
Inconvenient, because I need to key-in the inf ormation
No speical reason, this is company's instruction
Don't know how to use IRIS
The system design is not good, it's not easy to use
Considere d uncomfortable in using electronic payment system
Base: Survey respondents who rated “3” on using IRIS online services (n1=9) Note: More than one reason could be chosen by respondents
Reasons that may attract / have attracted a customer to become a subscriber of IRIS Online Services The reason “Convenient to use” received the highest rating (48.4%), followed by “Management decision / Operational need” (40.6%) and “Fees reduction” (9.4%).
(Ref.: Chart 28) Chart 28: Reasons that may attract / have attracted a customer to become a subscriber
of IRIS Online Services
1.6%
9.4%
40.6%
48.4%
Enhancement to IRIS
Fees reduction
Management decision / O perational need
Convenient to use
Base:
Note:
Survey respondents who provided the reason that may attract / have attracted a customer to become a subscriber of IRIS Online Services (n1=64) Percentages may not add up to 100 due to rounding
- 34 -
4.3.2 Counter Search
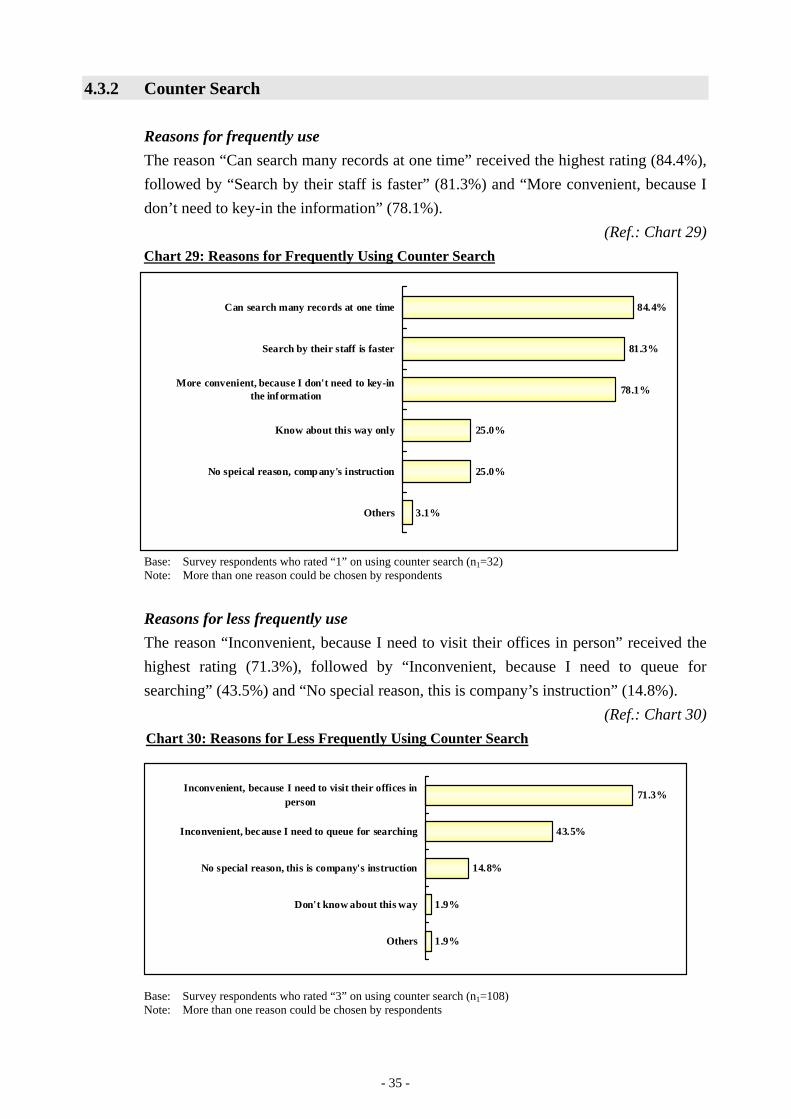
Reasons for frequently use The reason “Can search many records at one time” received the highest rating (84.4%), followed by “Search by their staff is faster” (81.3%) and “More convenient, because I don’t need to key-in the information” (78.1%).
(Ref.: Chart 29) Chart 29: Reasons for Frequently Using Counter Search
3.1%
25.0%
25.0%
78.1%
81.3%
84.4%
Others
No speical reason, comp any's instruction
Know about this way only
More convenient, because I don't need to key-in the inf ormation
Search by their staff is faster
Can search many records at one time
Base: Survey respondents who rated “1” on using counter search (n1=32) Note: More than one reason could be chosen by respondents
Reasons for less frequently use The reason “Inconvenient, because I need to visit their offices in person” received the highest rating (71.3%), followed by “Inconvenient, because I need to queue for searching” (43.5%) and “No special reason, this is company’s instruction” (14.8%).
(Ref.: Chart 30) Chart 30: Reasons for Less Frequently Using Counter Search
1.9%
1.9%
14.8%
43.5%
71.3%
Others
Don't know about this way
No special reason, this is company's instruction
Inconvenient, bec ause I need to queue for searching
Inconvenient, because I need to visit their offices in person
Base: Survey respondents who rated “3” on using counter search (n1=108) Note: More than one reason could be chosen by respondents
- 35 -
Convenient location of Customer Centre / NT Search Office(s)
Faster, because I don't need to queue for searching
The system is easy to use 33.3%
33.3%
33.3%
4.3.3 Self-service Search
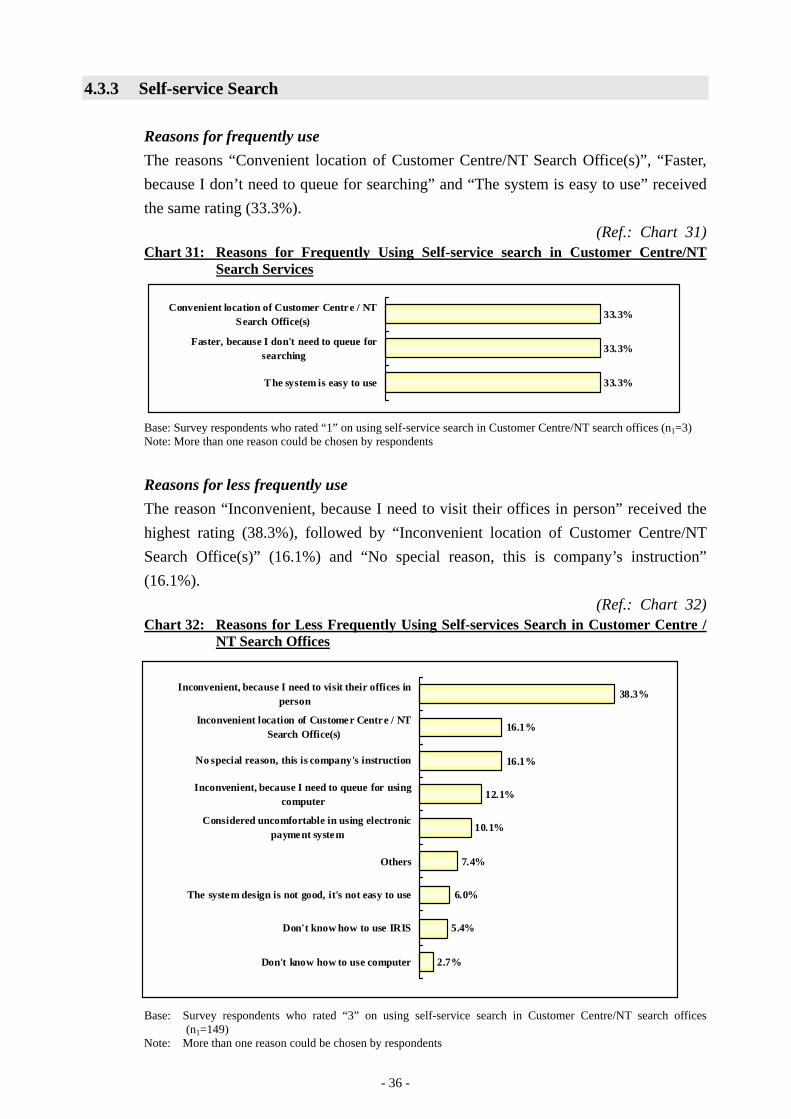
Reasons for frequently use The reasons “Convenient location of Customer Centre/NT Search Office(s)”, “Faster, because I don’t need to queue for searching” and “The system is easy to use” received the same rating (33.3%).
(Ref.: Chart 31) Chart 31: Reasons for Frequently Using Self-service search in Customer Centre/NT
Search Services
Base: Survey respondents who rated “1” on using self-service search in Customer Centre/NT search offices (n1=3) Note: More than one reason could be chosen by respondents
Reasons for less frequently use The reason “Inconvenient, because I need to visit their offices in person” received the highest rating (38.3%), followed by “Inconvenient location of Customer Centre/NT Search Office(s)” (16.1%) and “No special reason, this is company’s instruction” (16.1%).
(Ref.: Chart 32) Chart 32: Reasons for Less Frequently Using Self-services Search in Customer Centre /
NT Search Offices
2.7%
5.4%
6.0%
7.4%
10.1%
12.1%
16.1%
16.1%
38.3%
Don't know how to use computer
Don't know how to use IRIS
The syste m design is not good, it's not easy to use
Others
Considered uncomfortable in using electronic payme nt syste m
Inconvenient, because I need to queue for using computer
No special reason, this is company's instruction
Inconvenient location of Customer Centre / NT Search Office(s)
Inconvenient, because I need to visit their offices in person
Base: Survey respondents who rated “3” on using self-service search in Customer Centre/NT search offices (n1=149)
Note: More than one reason could be chosen by respondents
- 36 -
4.4 CUSTOMER SERVICE HOTLINE
4.4.1 Interactive Voice Response System (IVRS)
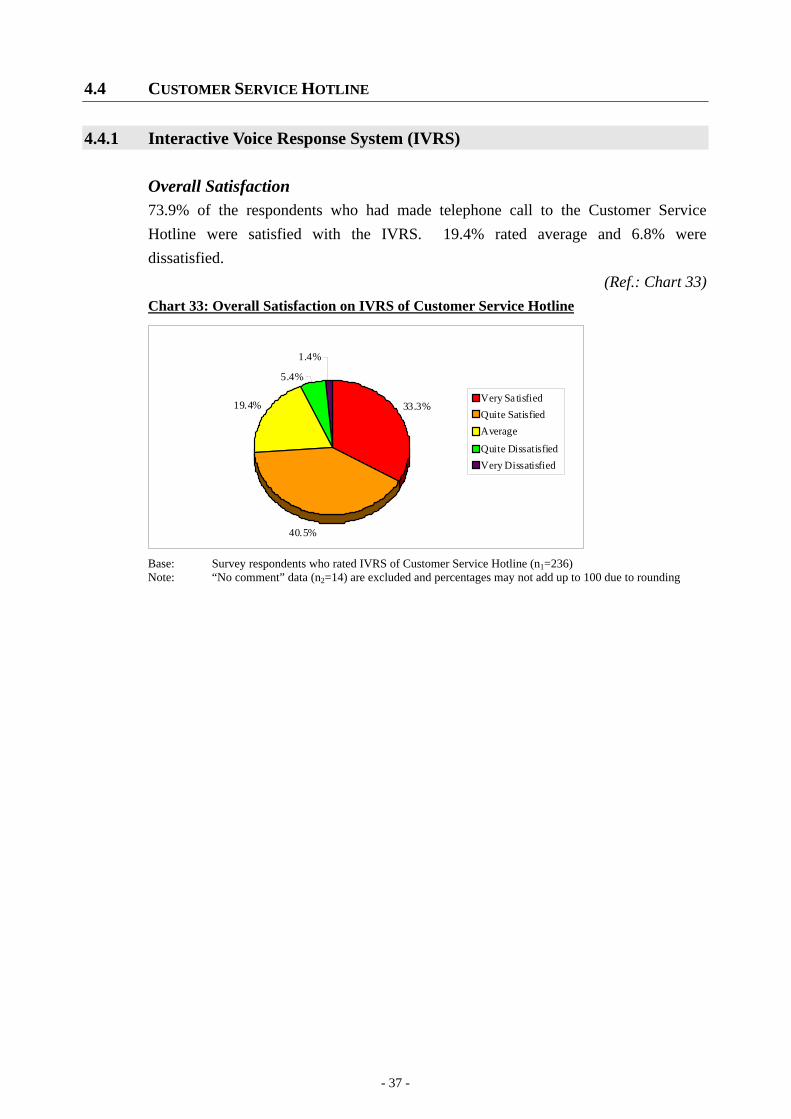
Overall Satisfaction 73.9% of the respondents who had made telephone call to the Customer Service Hotline were satisfied with the IVRS. 19.4% rated average and 6.8% were dissatisfied.
(Ref.: Chart 33) Chart 33: Overall Satisfaction on IVRS of Customer Service Hotline
33.3%
40.5%
19.4%
5.4%
1.4%
Very Sa tisfied Quite Satisfied Average
Quite Dissatisfied Very Dissatisfied
Base: Survey respondents who rated IVRS of Customer Service Hotline (n1=236) Note: “No comment” data (n2=14) are excluded and percentages may not add up to 100 due to rounding
- 37 -
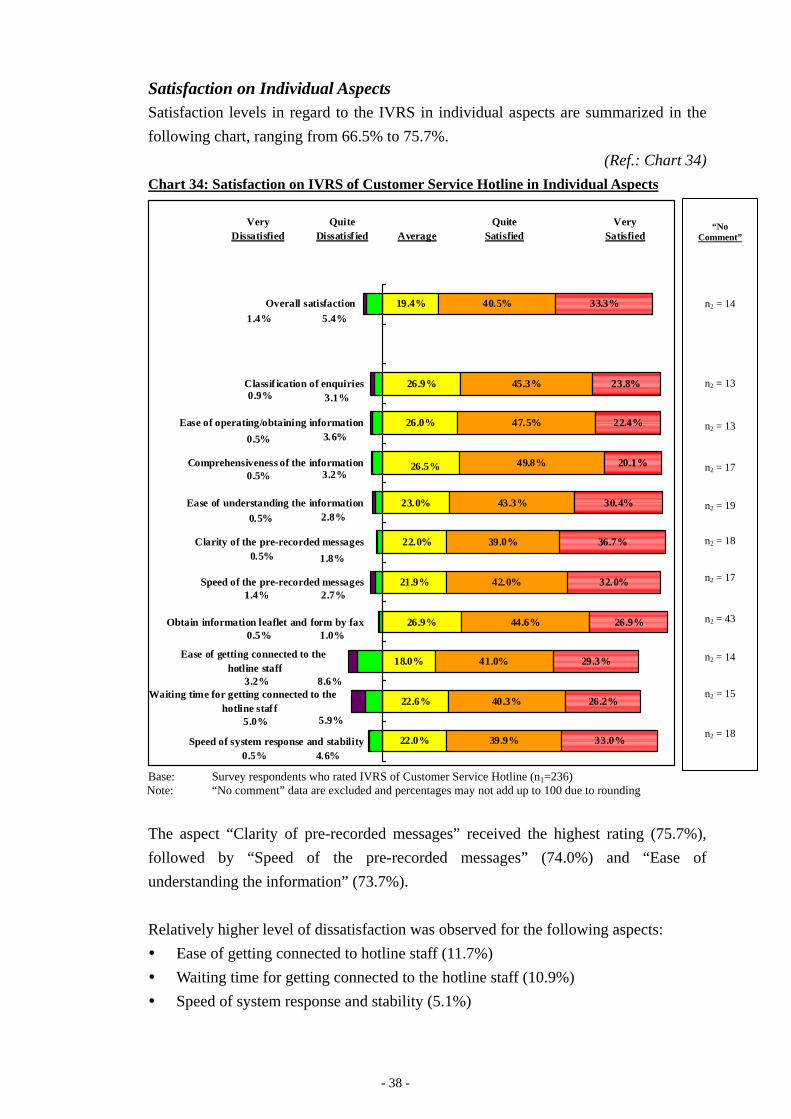
Satisfaction on Individual Aspects Satisfaction levels in regard to the IVRS in individual aspects are summarized in the following chart, ranging from 66.5% to 75.7%.
(Ref.: Chart 34) Chart 34: Satisfaction on IVRS of Customer Service Hotline in Individual Aspects
22.0%
22.6%
18.0%
26.9%
21.9%
23.0%
26.0%
26.9%
19.4%
39.9%
40.3%
41.0%
44.6%
42.0%
39.0%
43.3%
49.8%
47.5%
45.3%
40.5%
33.0%
26.2%
29.3%
26.9%
32.0%
36.7%
30.4%
20.1%
22.4%
23.8%
33.3%
26.5%
22.0%
5.4%
3.1%
3.6%
3.2%
2.8%
1.8%
2.7%
1.0%
8.6%
5.9%
4.6%
1.4%
0.9%
0.5%
0.5%
0.5%
0.5%
1.4%
0.5%
3.2%
5.0%
0.5% Speed of system response and stability
Waiting time for getting connected to the hotline staf f
Ease of getting connected to the hotline staff
Obtain information leaflet and form by fax
Speed of the pre-recorded messages
Clarity of the pre-recorded messages
Ease of understanding the information
Comprehensiveness of the information
Ease of operating/obtaining information
Classif ication of enquiries
Overall satisfaction
Very Dissatisfied
Quite Dissatisf ied Average
Quite Satisfied
Very Satisfied
“No Comment”
n2 = 14
n2 = 13
n2 = 13
n2 = 17
n2 = 19
n2 = 18
n2 = 17
n2 = 43
n2 = 14
n2 = 15
n2 = 18
Base: Survey respondents who rated IVRS of Customer Service Hotline (n1=236) Note: “No comment” data are excluded and percentages may not add up to 100 due to rounding
The aspect “Clarity of pre-recorded messages” received the highest rating (75.7%), followed by “Speed of the pre-recorded messages” (74.0%) and “Ease of understanding the information” (73.7%).
Relatively higher level of dissatisfaction was observed for the following aspects: y Ease of getting connected to hotline staff (11.7%) y Waiting time for getting connected to the hotline staff (10.9%) y Speed of system response and stability (5.1%)
- 38 -
4.4.2 Performance of Hotline Staff
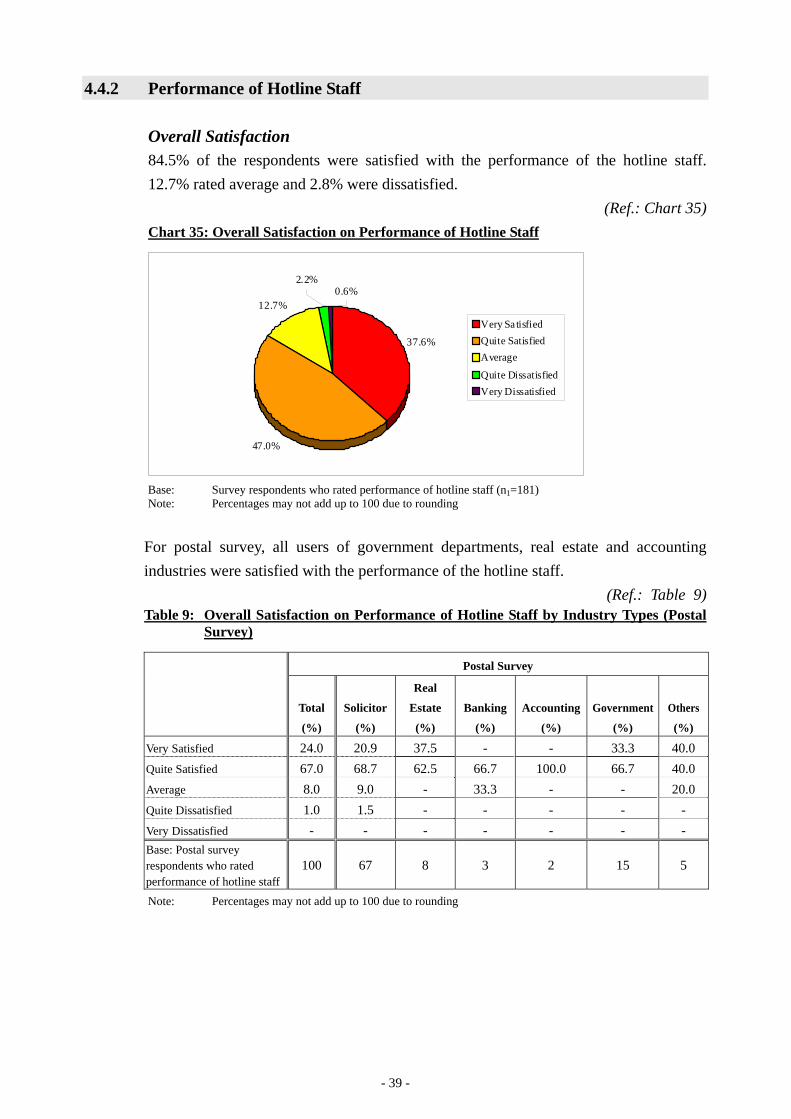
Overall Satisfaction 84.5% of the respondents were satisfied with the performance of the hotline staff. 12.7% rated average and 2.8% were dissatisfied.
(Ref.: Chart 35) Chart 35: Overall Satisfaction on Performance of Hotline Staff
37.6%
47.0%
12.7%
2.2% 0.6%
Very Sa tisfied Quite Satisfied Average
Quite Dissatisfied Very Dissatisfied
Base: Survey respondents who rated performance of hotline staff (n1=181) Note: Percentages may not add up to 100 due to rounding
For postal survey, all users of government departments, real estate and accounting industries were satisfied with the performance of the hotline staff.
(Ref.: Table 9) Table 9: Overall Satisfaction on Performance of Hotline Staff by Industry Types (Postal
Survey)
Postal Survey
Real
Total Solicitor Estate Banking Accounting Government Others
(%) (%) (%) (%) (%) (%) (%)
Very Satisfied 24.0 20.9 37.5 - - 33.3 40.0 Quite Satisfied 67.0 68.7 62.5 66.7 100.0 66.7 40.0 Average 8.0 9.0 - 33.3 - - 20.0 Quite Dissatisfied 1.0 1.5 - - - - -Very Dissatisfied - - - - - - -Base: Postal survey respondents who rated performance of hotline staff
100 67 8 3 2 15 5
Note: Percentages may not add up to 100 due to rounding
- 39 -
Very Quite Quite Very Dissatisfied Dissatisfied Average Satisfied Satisfied
Overall satisfaction 0.6% 2.2%
Courtesy and tone 0% 1.7%
Attitude 0% 1.7%
Efficiency 0% 2.2%
Understand the enquiry clearly
0% 0.6%
Provide c lear and detailed answer
0% 1.1%
14.9% 50.3% 33.7%
16.0%
17.8%
13.3%
12.7%
12.7%
49.7%
47.8%
47.5%
49.7%
47.0% 37.6%
35.9%
37.6%
32.2%
33.7%
“No Comment”
n2 = 0
n2 = 0
n2 = 0
n2 = 1
n2 = 0
n2 = 0
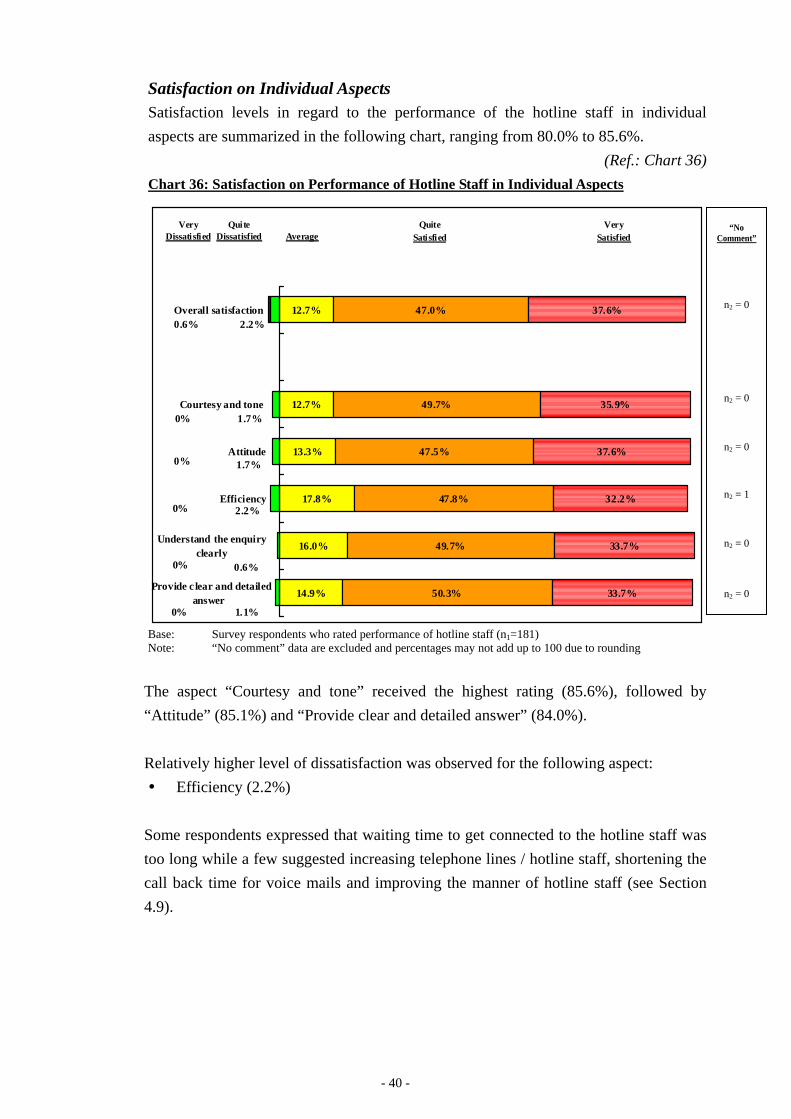
Satisfaction on Individual Aspects Satisfaction levels in regard to the performance of the hotline staff in individual aspects are summarized in the following chart, ranging from 80.0% to 85.6%.
(Ref.: Chart 36) Chart 36: Satisfaction on Performance of Hotline Staff in Individual Aspects
Base: Survey respondents who rated performance of hotline staff (n1=181) Note: “No comment” data are excluded and percentages may not add up to 100 due to rounding
The aspect “Courtesy and tone” received the highest rating (85.6%), followed by “Attitude” (85.1%) and “Provide clear and detailed answer” (84.0%).
Relatively higher level of dissatisfaction was observed for the following aspect: y Efficiency (2.2%)
Some respondents expressed that waiting time to get connected to the hotline staff was too long while a few suggested increasing telephone lines / hotline staff, shortening the call back time for voice mails and improving the manner of hotline staff (see Section 4.9).
- 40 -
4.5 OVERALL SATISFACTION ON THE SERVICES PROVIDED BY THE LAND
REGISTRY
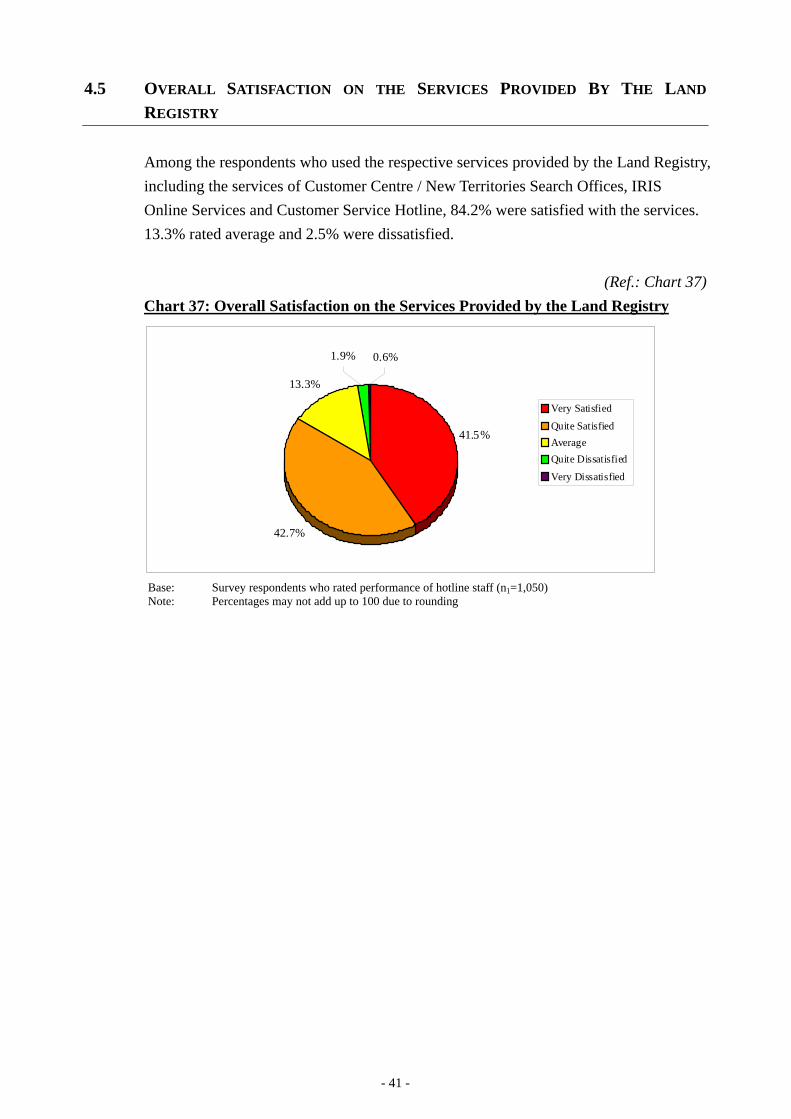
Among the respondents who used the respective services provided by the Land Registry, including the services of Customer Centre / New Territories Search Offices, IRIS Online Services and Customer Service Hotline, 84.2% were satisfied with the services. 13.3% rated average and 2.5% were dissatisfied.
(Ref.: Chart 37) Chart 37: Overall Satisfaction on the Services Provided by the Land Registry
41.5%
42.7%
13.3%
1.9% 0.6%
Very Satisfied
Quite Satisfied Average Quite Dissatisfied
Very Dissatisfied
Base: Survey respondents who rated performance of hotline staff (n1=1,050) Note: Percentages may not add up to 100 due to rounding
- 41 -
4.6 THE e-MEMORIAL FORM
The Land Registry launched an e-Memorial Form in late 2007 as an alternative to the conventional pre-printed memorial form. An enhanced version of the e-Memorial Form with new and extended functions was released in July 2009.
4.6.1 Internet Access
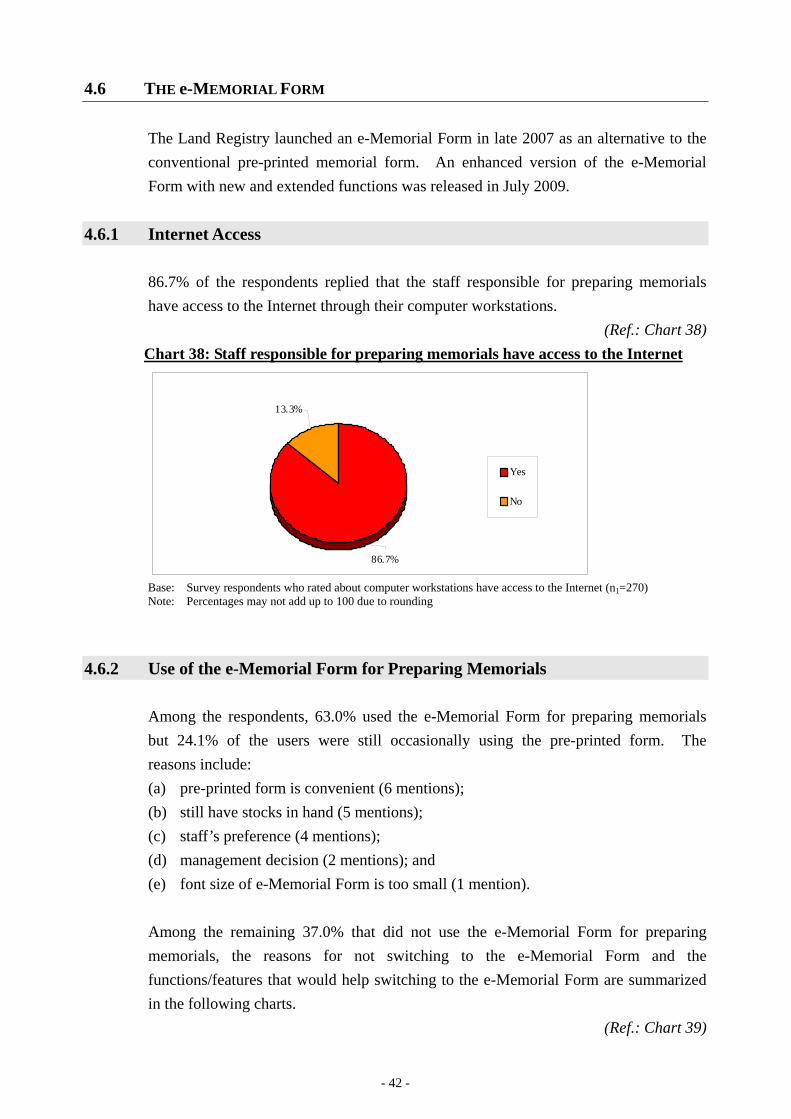
86.7% of the respondents replied that the staff responsible for preparing memorials have access to the Internet through their computer workstations.
(Ref.: Chart 38) Chart 38: Staff responsible for preparing memorials have access to the Internet
13.3%
86.7%
Yes
No
Base: Survey respondents who rated about computer workstations have access to the Internet (n1=270) Note: Percentages may not add up to 100 due to rounding
4.6.2 Use of the e-Memorial Form for Preparing Memorials
Among the respondents, 63.0% used the e-Memorial Form for preparing memorials but 24.1% of the users were still occasionally using the pre-printed form. The reasons include: (a) pre-printed form is convenient (6 mentions); (b) still have stocks in hand (5 mentions); (c) staff’s preference (4 mentions); (d) management decision (2 mentions); and (e) font size of e-Memorial Form is too small (1 mention).
Among the remaining 37.0% that did not use the e-Memorial Form for preparing memorials, the reasons for not switching to the e-Memorial Form and the functions/features that would help switching to the e-Memorial Form are summarized in the following charts.
(Ref.: Chart 39)
- 42 -
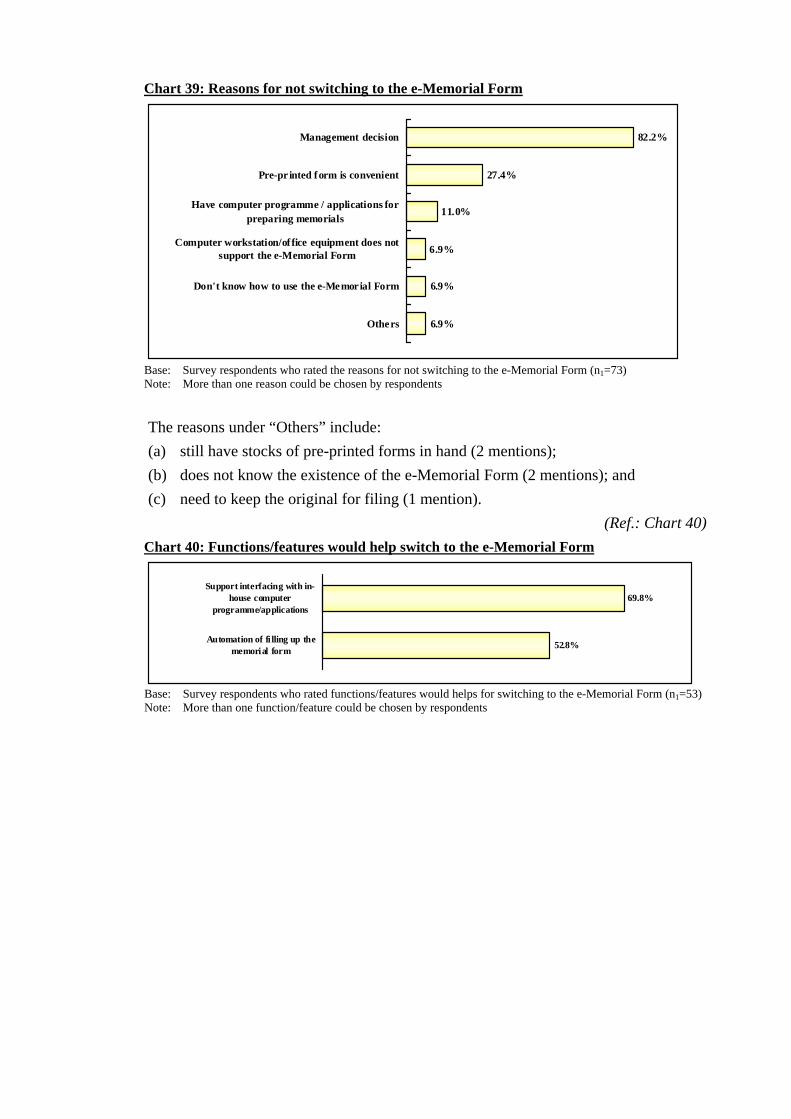
Chart 39: Reasons for not switching to the e-Memorial Form
6.9%
6.9%
6.9%
11.0%
27.4%
82.2%
Othe rs
Don't know how to use the e-Me mor ial Form
Computer workstation/of fice equipment does not support the e-Memorial Form
Have computer programme / applications for preparing memorials
Pre-pr inted form is convenient
Management decision
Base: Survey respondents who rated the reasons for not switching to the e-Memorial Form (n1=73) Note: More than one reason could be chosen by respondents
The reasons under “Others” include: (a) still have stocks of pre-printed forms in hand (2 mentions); (b) does not know the existence of the e-Memorial Form (2 mentions); and (c) need to keep the original for filing (1 mention).
(Ref.: Chart 40) Chart 40: Functions/features would help switch to the e-Memorial Form
Support interfacing with in-house computer
programme/applications
Automation of fi lling up the memorial form 52.8%
69.8%
Base: Survey respondents who rated functions/features would helps for switching to the e-Memorial Form (n1=53) Note: More than one function/feature could be chosen by respondents
4.7 TITLE REGISTRATION SYSTEM
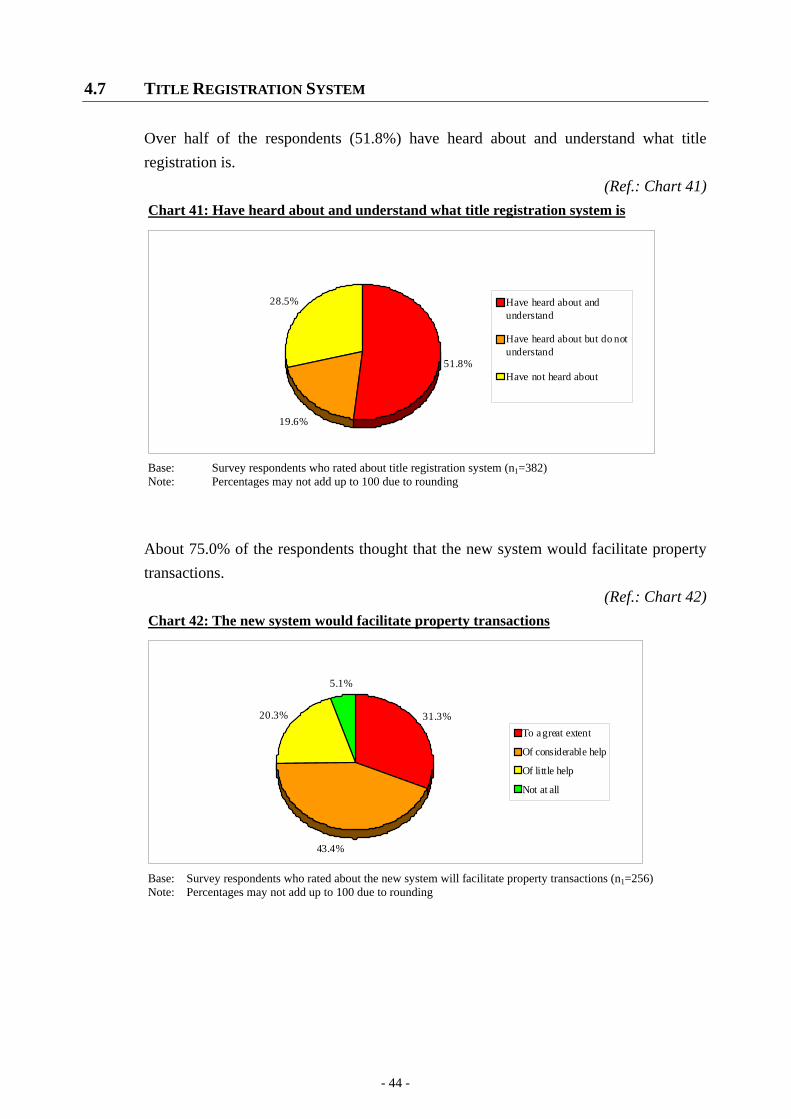
Over half of the respondents (51.8%) have heard about and understand what title registration is.
(Ref.: Chart 41) Chart 41: Have heard about and understand what title registration system is
51.8%
19.6%
28.5% Have heard about and understand
Have heard about but do not understand
Have not heard about
Base: Survey respondents who rated about title registration system (n1=382) Note: Percentages may not add up to 100 due to rounding
About 75.0% of the respondents thought that the new system would facilitate property transactions.
(Ref.: Chart 42) Chart 42: The new system would facilitate property transactions
31.3%
43.4%
20.3%
5.1%
To a great extent
Of considerable help
Of little help
Not at all
Base: Survey respondents who rated about the new system will facilitate property transactions (n1=256) Note: Percentages may not add up to 100 due to rounding
- 44 -
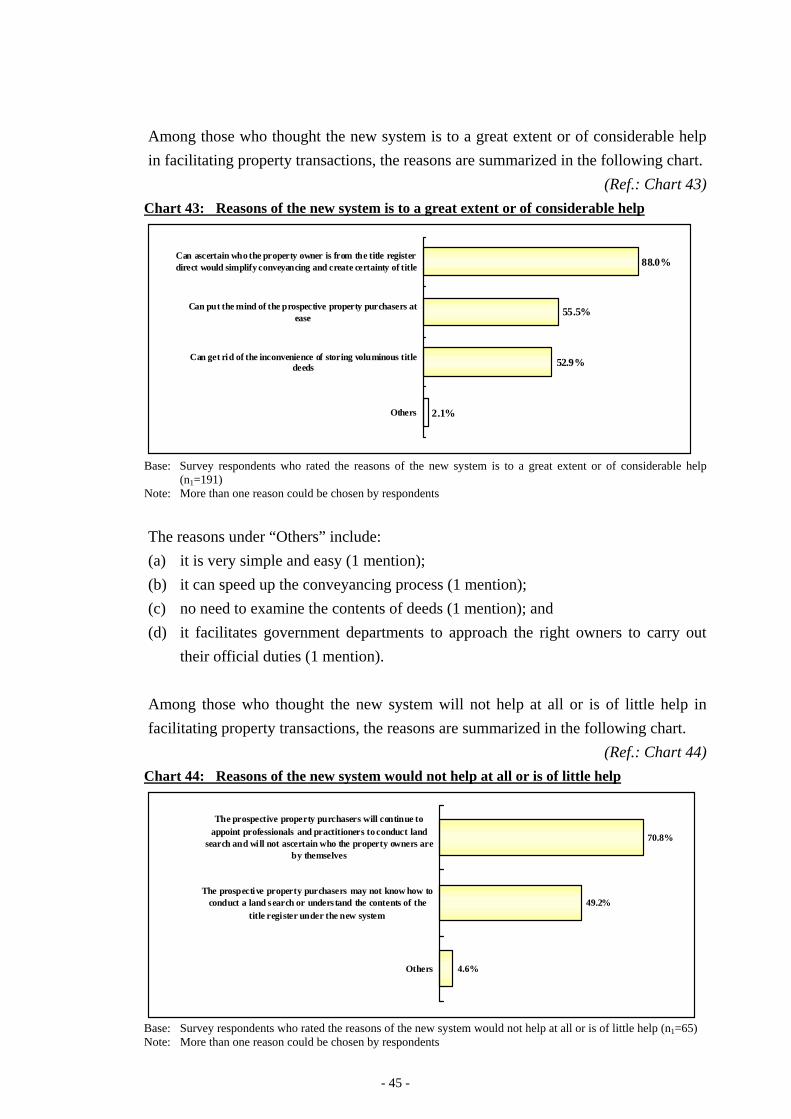
Among those who thought the new system is to a great extent or of considerable help in facilitating property transactions, the reasons are summarized in the following chart.
(Ref.: Chart 43) Chart 43: Reasons of the new system is to a great extent or of considerable help
2.1%
52.9%
55.5%
88.0%
Others
Can get ri d of the inconvenience of storing voluminous title deeds
Can put the mind of the prospective property purchasers at ease
Can ascertain who the property owner is from the title register direct would simplify conveyancing and create certainty of title
Base: Survey respondents who rated the reasons of the new system is to a great extent or of considerable help (n1=191)
Note: More than one reason could be chosen by respondents
The reasons under “Others” include: (a) it is very simple and easy (1 mention); (b) it can speed up the conveyancing process (1 mention); (c) no need to examine the contents of deeds (1 mention); and (d) it facilitates government departments to approach the right owners to carry out
their official duties (1 mention).
Among those who thought the new system will not help at all or is of little help in facilitating property transactions, the reasons are summarized in the following chart.
(Ref.: Chart 44) Chart 44: Reasons of the new system would not help at all or is of little help
4.6%
49.2%
70.8%
Others
The prospecti ve property purchasers may not know how to conduct a land s earch or unders tand the contents of the
title register under the new system
The prospective property purchasers will continue to appoint professionals and practitioners to conduct land
search and will not ascertain who the property owners are by themselves
Base: Survey respondents who rated the reasons of the new system would not help at all or is of little help (n1=65) Note: More than one reason could be chosen by respondents
- 45 -

The reasons under “Others” include: (a) it still needs to have lawyers to check the title deeds (1 mention); (b) it still needs to check who were the previous owners (1 mention); (c) under the deeds registration system, the professionals are clear about the property
title and can help reduce fraud cases. Even there are frauds, the clients can take action against the solicitors firms. The existing registration system can put the mind of both vendors and purchasers at ease. (1 mention).
- 46 -
4.8 PROFILE AND USAGE PATTERN OF SURVEY RESPONDENTS
4.8.1 Profile of Survey Respondents
4.8.1.1 Counter Survey
For counter survey, the profile of the respondents are summarized below: y Industry type: majority of the respondents were engaged in the solicitor industry
(29.2%) y Company size: 50.2% of the respondents with company size of less than 20
(Ref.: Table 10) Table 10: Profile of Respondents of Counter Survey
Respondents of Counter Survey (n1=247)
Solicitor 29.2% Real estate 15.0% Banking 4.1% Accounting 3.2% Surveying 7.3% Research 3.6% Government 8.5% Others 18.6%
Industry type
No answer 10.5% 1 - 9 30.8% 10 – 19 19.4% 20 – 49 14.2% 50 – 99 6.5% 100 or above 7.7%
Company size
No answer 21.5%
Note: Percentages may not add up to 100 due to rounding
- 47 -
4.8.1.2 Postal Survey
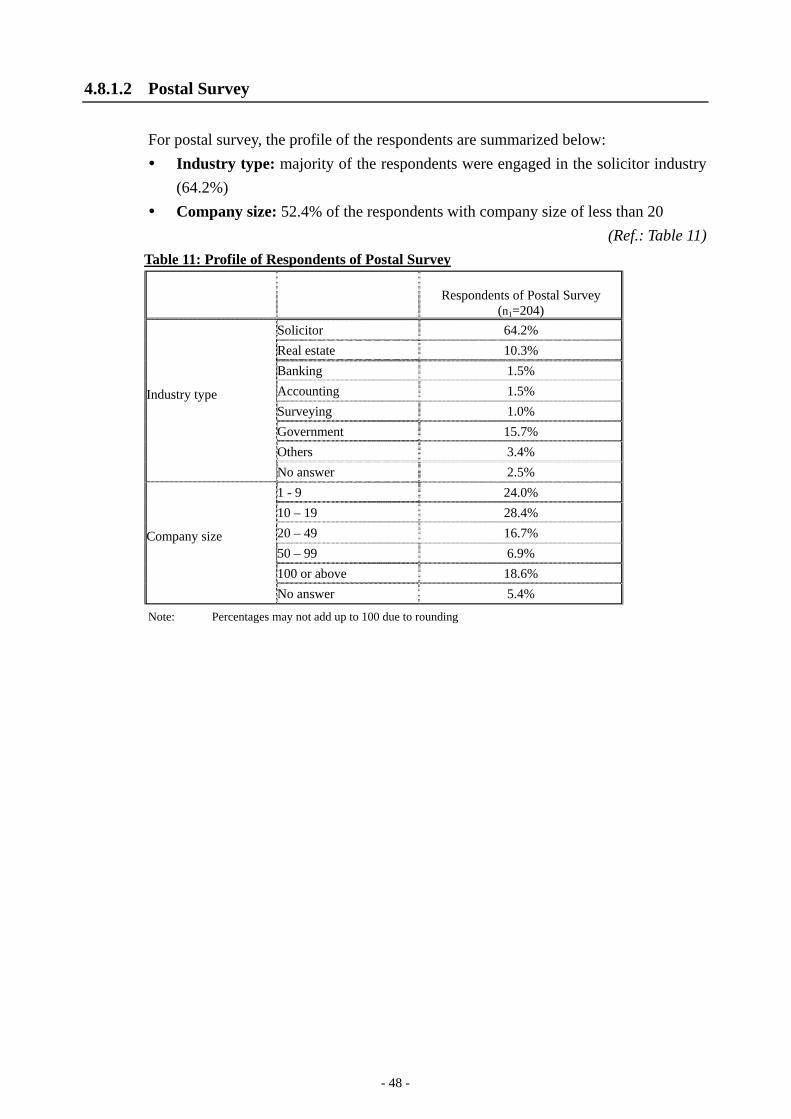
For postal survey, the profile of the respondents are summarized below: y Industry type: majority of the respondents were engaged in the solicitor industry
(64.2%) y Company size: 52.4% of the respondents with company size of less than 20
(Ref.: Table 11) Table 11: Profile of Respondents of Postal Survey
Respondents of Postal Survey (n1=204)
Solicitor 64.2% Real estate 10.3% Banking 1.5% Accounting 1.5% Surveying 1.0% Government 15.7% Others 3.4%
Industry type
No answer 2.5% 1 - 9 24.0% 10 – 19 28.4% 20 – 49 16.7% 50 – 99 6.9% 100 or above 18.6%
Company size
No answer 5.4%
Note: Percentages may not add up to 100 due to rounding
- 48 -
4.8.2 Usage Pattern of Survey Respondents
4.8.2.1 Customer Centre / New Territories Search Offices
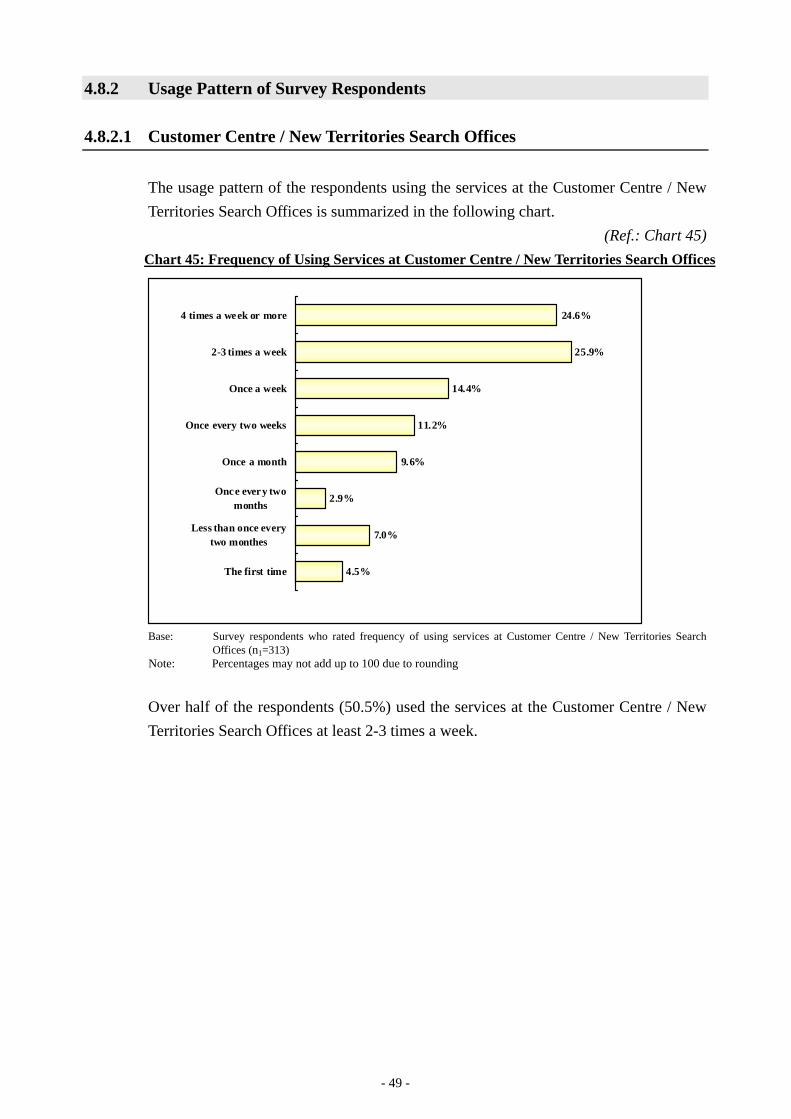
The usage pattern of the respondents using the services at the Customer Centre / New Territories Search Offices is summarized in the following chart.
(Ref.: Chart 45) Chart 45: Frequency of Using Services at Customer Centre / New Territories Search Offices
4.5%
7.0%
2.9%
9.6%
11.2%
14.4%
25.9%
24.6%
The first time
Less than once every two monthes
Once every two months
Once a month
Once every two weeks
Once a week
2-3 times a week
4 times a we ek or more
Base: Survey respondents who rated frequency of using services at Customer Centre / New Territories Search Offices (n1=313)
Note: Percentages may not add up to 100 due to rounding
Over half of the respondents (50.5%) used the services at the Customer Centre / New Territories Search Offices at least 2-3 times a week.
- 49 -
4.8.2.2 IRIS Online Services
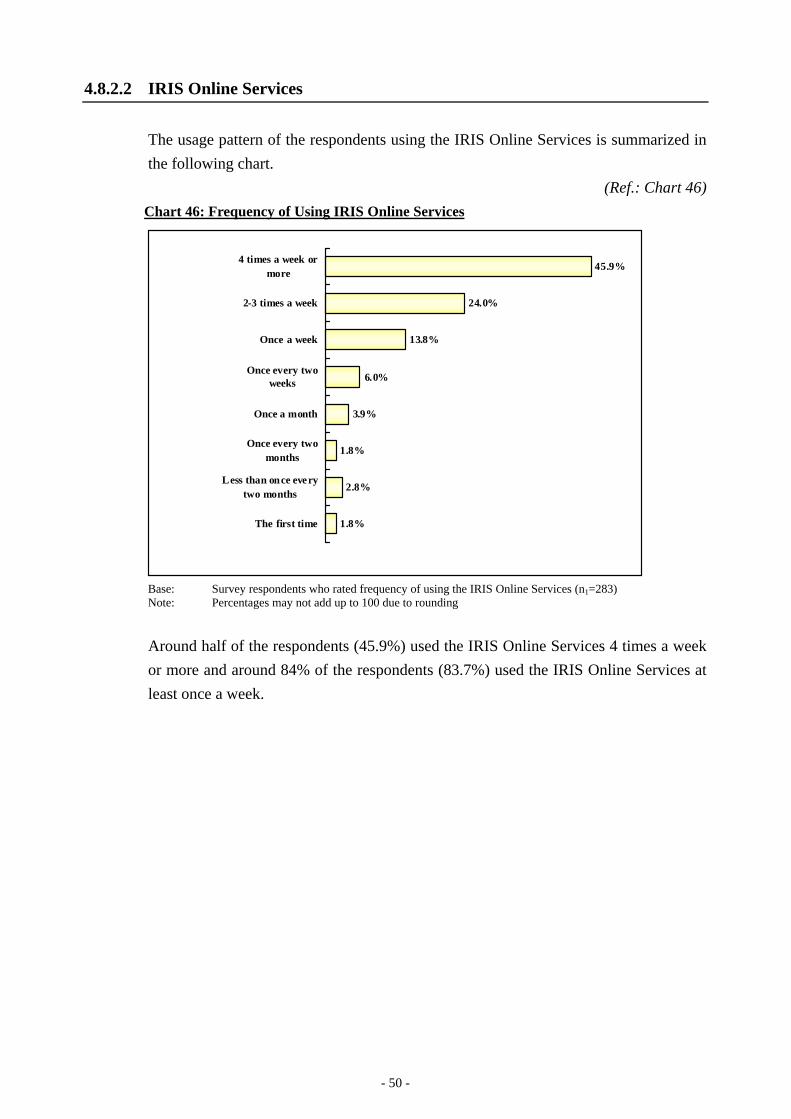
The usage pattern of the respondents using the IRIS Online Services is summarized in the following chart.
(Ref.: Chart 46) Chart 46: Frequency of Using IRIS Online Services
1.8%
2.8%
1.8%
3.9%
6.0%
13.8%
24.0%
45.9%
The first time
Less than once every two months
Once every two months
Once a month
Once every two weeks
Once a week
2-3 times a week
4 times a week or more
Base: Survey respondents who rated frequency of using the IRIS Online Services (n1=283) Note: Percentages may not add up to 100 due to rounding
Around half of the respondents (45.9%) used the IRIS Online Services 4 times a week or more and around 84% of the respondents (83.7%) used the IRIS Online Services at least once a week.
- 50 -
4.8.2.3 Customer Service Hotline
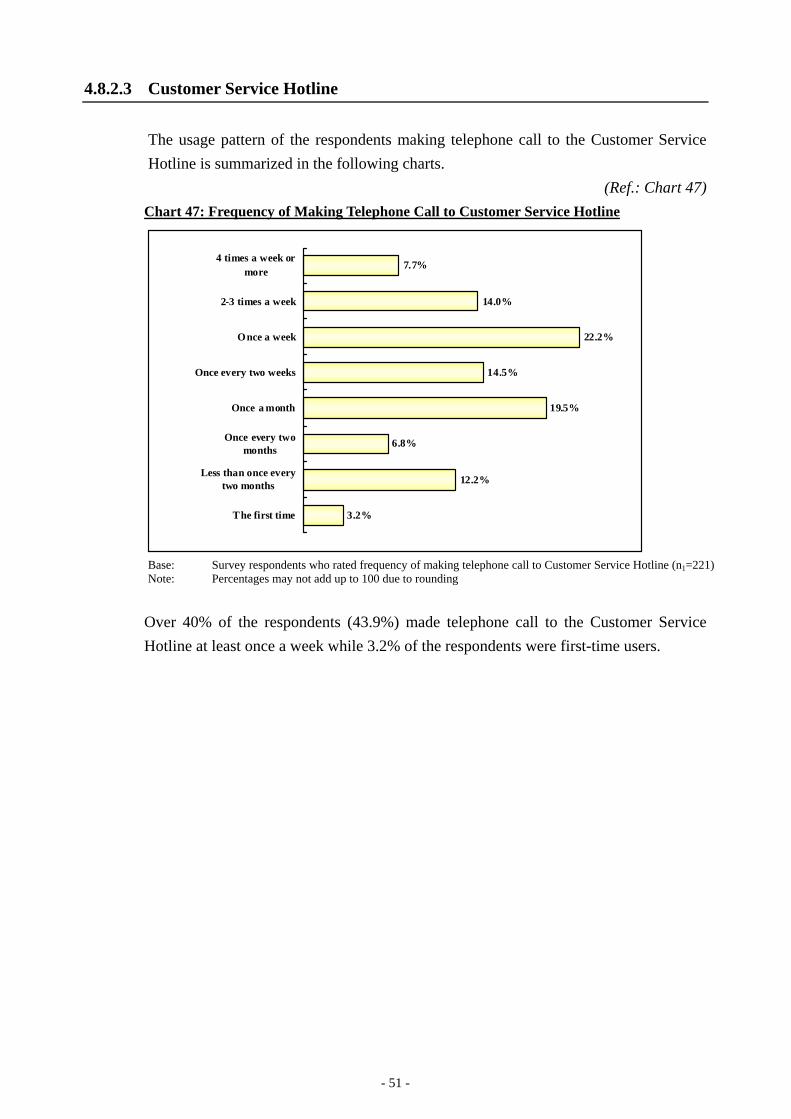
The usage pattern of the respondents making telephone call to the Customer Service Hotline is summarized in the following charts.
(Ref.: Chart 47) Chart 47: Frequency of Making Telephone Call to Customer Service Hotline
3.2%
12.2%
6.8%
19.5%
14.5%
22.2%
14.0%
7.7%
The first time
Less than once every two months
Once every two months
Once a month
Once every two weeks
Once a week
2-3 times a week
4 times a week or more
Base: Survey respondents who rated frequency of making telephone call to Customer Service Hotline (n1=221) Note: Percentages may not add up to 100 due to rounding
Over 40% of the respondents (43.9%) made telephone call to the Customer Service Hotline at least once a week while 3.2% of the respondents were first-time users.
- 51 -
Enquire registration information of land documents
Enquire online serach services
To connect to hotline staff to seek assistance
Other services (MDB, MMIM, Street Index and NT Lot/Addrsss Cross Reference Table)
Enquire address/tele no./service hours of the Customer Centre/SearchOffices
Enquire counter search services information
Obtain information leaflet and form by fax
Provide suggestions
Enquire owners incorporation matters
Others
Lodge complaints
53.8%
44.1%
41.5%
17.4%
14.4%
8.1%
7.6%
4.2%
3.8%
3.0%
2.1%
4 times a week or more 6.2%
2-3 times a week 10.7%
Once a week 2 4.9%
Once every two weeks 1 4.1%
Once a month 19.8%
Once every two months 10 .2%
Less than once every two months 11.9%
The f irst time 2.3%
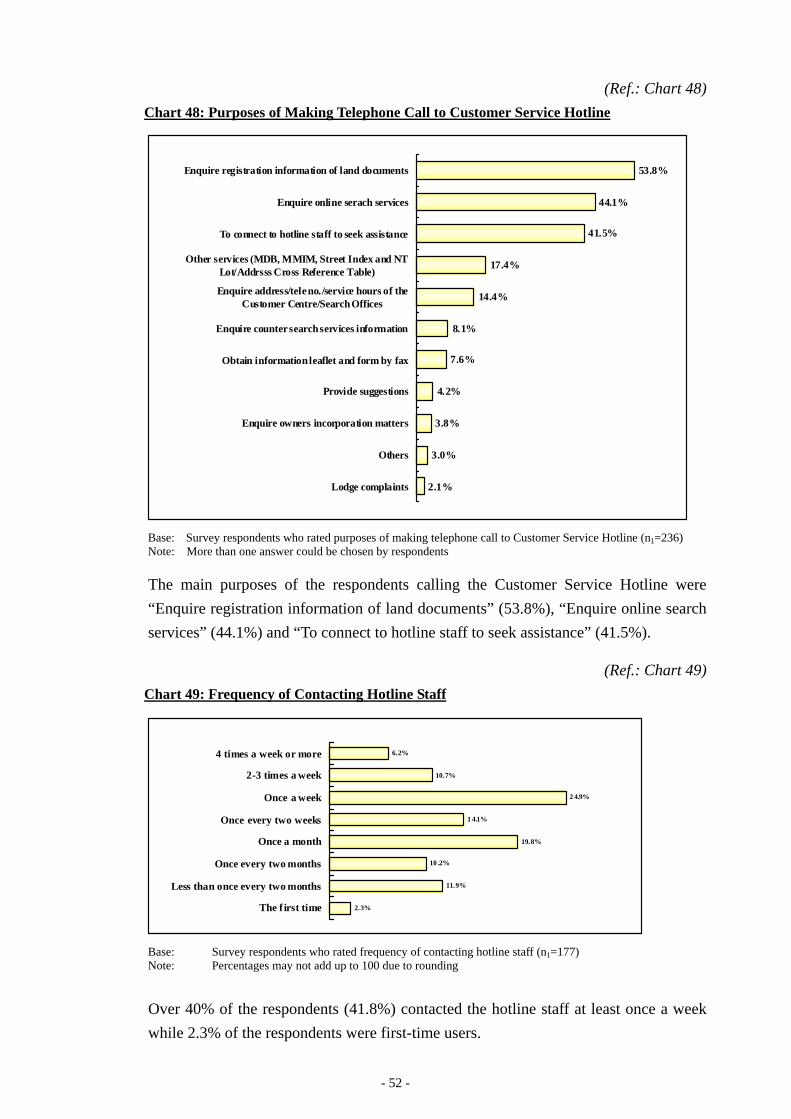
(Ref.: Chart 48) Chart 48: Purposes of Making Telephone Call to Customer Service Hotline
Base: Survey respondents who rated purposes of making telephone call to Customer Service Hotline (n1=236) Note: More than one answer could be chosen by respondents
The main purposes of the respondents calling the Customer Service Hotline were “Enquire registration information of land documents” (53.8%), “Enquire online search services” (44.1%) and “To connect to hotline staff to seek assistance” (41.5%).
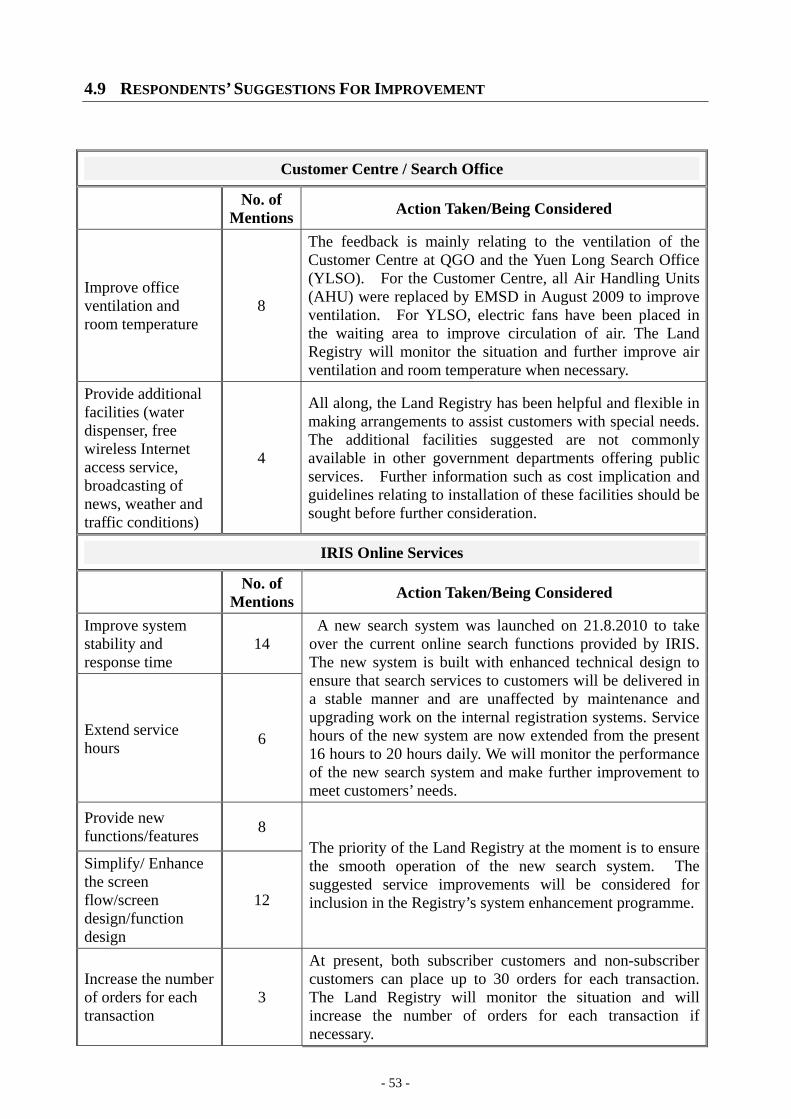
(Ref.: Chart 49) Chart 49: Frequency of Contacting Hotline Staff
Base: Survey respondents who rated frequency of contacting hotline staff (n1=177) Note: Percentages may not add up to 100 due to rounding
Over 40% of the respondents (41.8%) contacted the hotline staff at least once a week while 2.3% of the respondents were first-time users.
- 52 -
4.9 RESPONDENTS’ SUGGESTIONS FOR IMPROVEMENT
Customer Centre / Search Office
No. of Mentions Action Taken/Being Considered
Improve office ventilation and room temperature
8
The feedback is mainly relating to the ventilation of the Customer Centre at QGO and the Yuen Long Search Office (YLSO). For the Customer Centre, all Air Handling Units (AHU) were replaced by EMSD in August 2009 to improve ventilation. For YLSO, electric fans have been placed in the waiting area to improve circulation of air. The Land Registry will monitor the situation and further improve air ventilation and room temperature when necessary.
Provide additional facilities (water dispenser, free wireless Internet access service, broadcasting of news, weather and traffic conditions)
4
All along, the Land Registry has been helpful and flexible in making arrangements to assist customers with special needs. The additional facilities suggested are not commonly available in other government departments offering public services. Further information such as cost implication and guidelines relating to installation of these facilities should be sought before further consideration.
IRIS Online Services
No. of Mentions Action Taken/Being Considered
Improve system stability and response time
14 A new search system was launched on 21.8.2010 to take
over the current online search functions provided by IRIS. The new system is built with enhanced technical design to ensure that search services to customers will be delivered in a stable manner and are unaffected by maintenance and upgrading work on the internal registration systems. Service hours of the new system are now extended from the present 16 hours to 20 hours daily. We will monitor the performance of the new search system and make further improvement to meet customers’ needs.
Extend service hours 6
Provide new functions/features 8
The priority of the Land Registry at the moment is to ensure the smooth operation of the new search system. The suggested service improvements will be considered for inclusion in the Registry’s system enhancement programme.
Simplify/ Enhance the screen flow/screen design/function design
12
Increase the number of orders for each transaction
3
At present, both subscriber customers and non-subscriber customers can place up to 30 orders for each transaction. The Land Registry will monitor the situation and will increase the number of orders for each transaction if necessary.
- 53 -
Customer Service Hotline
No. of Mentions Action Taken/Being Considered
Increase telephone lines/helpdesk staff 4 Following the revamp of the Interactive Voice Response
System in August 2009, the number of service telephone lines has been increased from 12 to 24. The Land Registry will continue to monitor the situation and increase telephone lines and staff if necessary.
Shorten the waiting time 9
Shorten the call back time for voice mails
3
According to Performance Pledges 2009/10 and 2010/11, the service standard and performance target for telephone enquiry services are as follows:
Service Type Service Standard Performance Target (%)
Voice mail left during office hours
Return calls within 60 minutes after receiving the voice mail
92
Voice mail left after office hours
Return calls before 10 am on the next working day
92
The performance target was fully met (100% performance) in 2009/10 and 2010/11 (up to July 2010). Regular review of the service standard and the performance target would be conducted.
Improve the manner of helpdesk staff 4
Regular training on customer service skills are organized to frontline staff by the Training Unit. More focused courses to strengthen telephone communication skills of the helpdesk staff will be arranged whenever necessary.
Note: Suggestions with less than 3 mentions were not shown.
- 54 -
5. CONCLUSION
As indicated by the results of the survey, the overall satisfaction on the services provided by the Land Registry is 84.2%.
Customers were generally satisfied with the services provided at the Customer Centre and New Territories Search Offices (ranging from 76.7% to 94.1%) and the staff performance (ranging from 84.7% to 95.0%). Counter search service received the highest ratings in both provision of service (94.1%) and staff performance (95.0%).
While the overall satisfaction on the environment of the Customer Centre / New Territories Search Offices was high (93.1%), relatively higher level of dissatisfaction was observed for the aspects “Room temperature” (3.6%) and “Ventilation” (2.0%).
The overall satisfaction rate for the IRIS Online Services was 82.5%. Relatively higher level of dissatisfaction was observed for the aspect “Speed of system response and stability” (6.5%).
IRIS Online Services was the most frequently used mode (88.2%), followed by counter search (10.8%) and self-service search (1.0%).
As regards the Customer Service Hotline, the overall satisfaction rate for staff performance was 84.5%. The overall satisfaction rate for IVRS (73.9%) with relatively higher level of dissatisfaction on the aspects “Ease of getting connected to hotline staff” (11.7%), “Waiting time for getting connected to the hotline staff (10.9%) and “Speed of system response and stability (5.1%).
86.7% of the respondents who are responsible for preparing memorials have access to the Internet. Among the respondents, 63.0% had adopted the use of the e-Memorial Form for preparing memorials and 24.1% of them still occasionally using the pre-printed form for preparing memorials.
In response to the questions on Title Registration System, over half of the respondents (51.8%) have heard about and understand what title registration is. About 75.0% thought that the new system would facilitate property transactions.
Way forward Based on the findings and comments / feedback collected in the survey, an Action Plan will be drawn up for discussion in the Performance Monitoring Committee Meeting to set the priorities of the improvement items for follow-up by the relevant Division Heads.
- 55 -
Recommended


![Joe Stiglitz 030910 (Issued)[1]](https://img.pdfslide.net/doc/110x75/5571f82d49795991698cd298/joe-stiglitz-030910-issued1.jpg)