Data Center Infrastructure Scorecard— Governance, RAM, and Cost-to-Serve Assessment
-------------------------------------------------------------------------------------------------Data is comprised of 1 response from John Smith
Prepared for:
John Smith
Infrastructure Manager
Computer Megacorp, Inc.
April, 27th, 2015
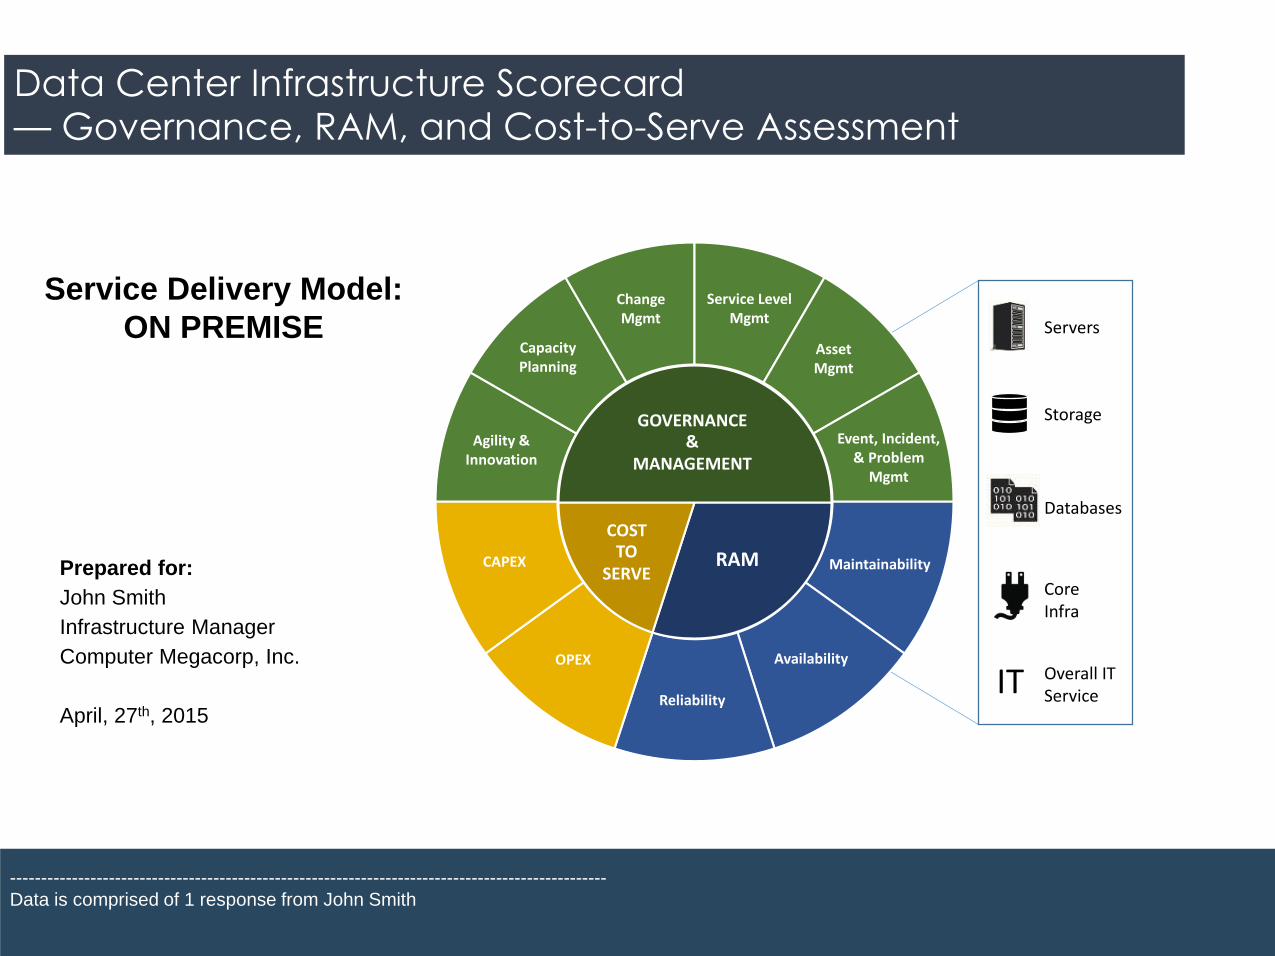
Service Delivery Model:
ON PREMISE
IT
Servers
Storage
Databases
CoreInfra
Overall ITService
GOVERNANCE
MANAGEMENT&
COST
SERVETO RAM
Agility & Innovation
CapacityPlanning
Event, Incident, & Problem
Mgmt
ChangeMgmt
AssetMgmt
Service Level Mgmt
OPEX
CAPEX
Availability
Reliability
Maintainability
Infrastructure Scorecard – Summary Dashboard
Governance and Management Maturity Scores
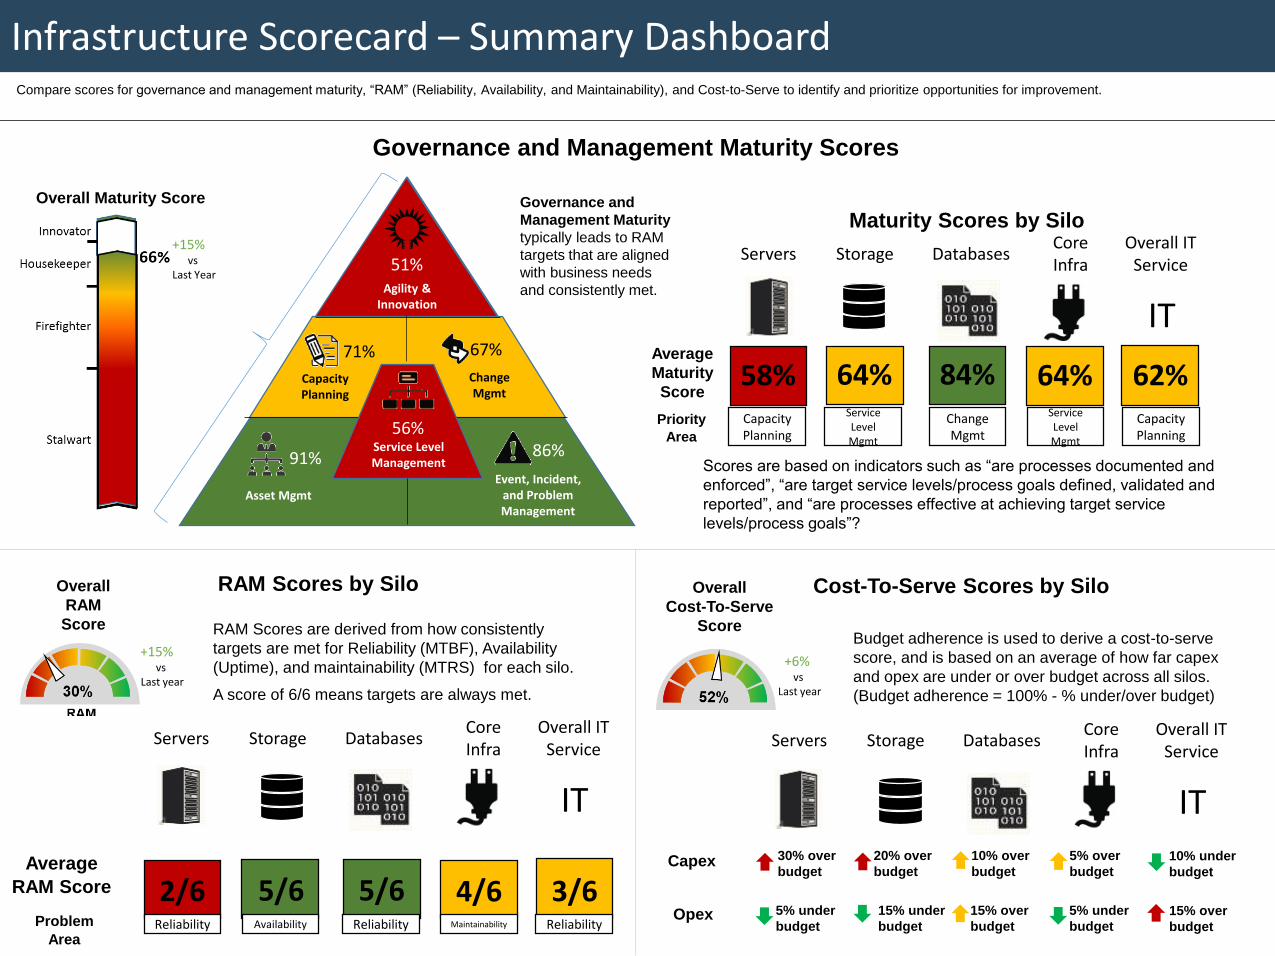
Compare scores for governance and management maturity, “RAM” (Reliability, Availability, and Maintainability), and Cost-to-Serve to identify and prioritize opportunities for improvement.
Agility & Innovation
CapacityPlanning
Event, Incident, and Problem Management
ChangeMgmt
Asset Mgmt
Governance and
Management Maturity
typically leads to RAM
targets that are aligned
with business needs
and consistently met.
Overall Maturity Score
Service Level Management
+15%vs
Last Year
+15%vs
Last year
+6%vs
Last year
51%
67%
86%
71%
91%
56%
Servers Storage DatabasesCoreInfra
Overall ITService
IT
Maturity Scores by Silo
58% 62%64% 84% 64%
Scores are based on indicators such as “are processes documented and
enforced”, “are target service levels/process goals defined, validated and
reported”, and “are processes effective at achieving target service
levels/process goals”?
Servers Storage DatabasesCoreInfra
Overall ITService
IT
RAM Scores by Silo
2/6 3/65/6 5/6 4/6
Cost-To-Serve Scores by Silo
Servers Storage DatabasesCoreInfra
Overall ITService
IT
Opex
Capex 30% over
budget
20% over
budget
5% under
budget
15% under
budget
10% over
budget
15% over
budget
5% over
budget
5% under
budget
10% under
budget
15% over
budget
Average
RAM Score
Overall
RAM
Score
Overall
Cost-To-Serve
Score
Reliability Availability Reliability Maintainability Reliability
RAM Scores are derived from how consistently
targets are met for Reliability (MTBF), Availability
(Uptime), and maintainability (MTRS) for each silo.
A score of 6/6 means targets are always met.
Problem
Area
Budget adherence is used to derive a cost-to-serve
score, and is based on an average of how far capex
and opex are under or over budget across all silos.
(Budget adherence = 100% - % under/over budget)
Average
Maturity
Score
CapacityPlanning
Service LevelMgmt
Change Mgmt
Service LevelMgmt
CapacityPlanning
Priority
Area
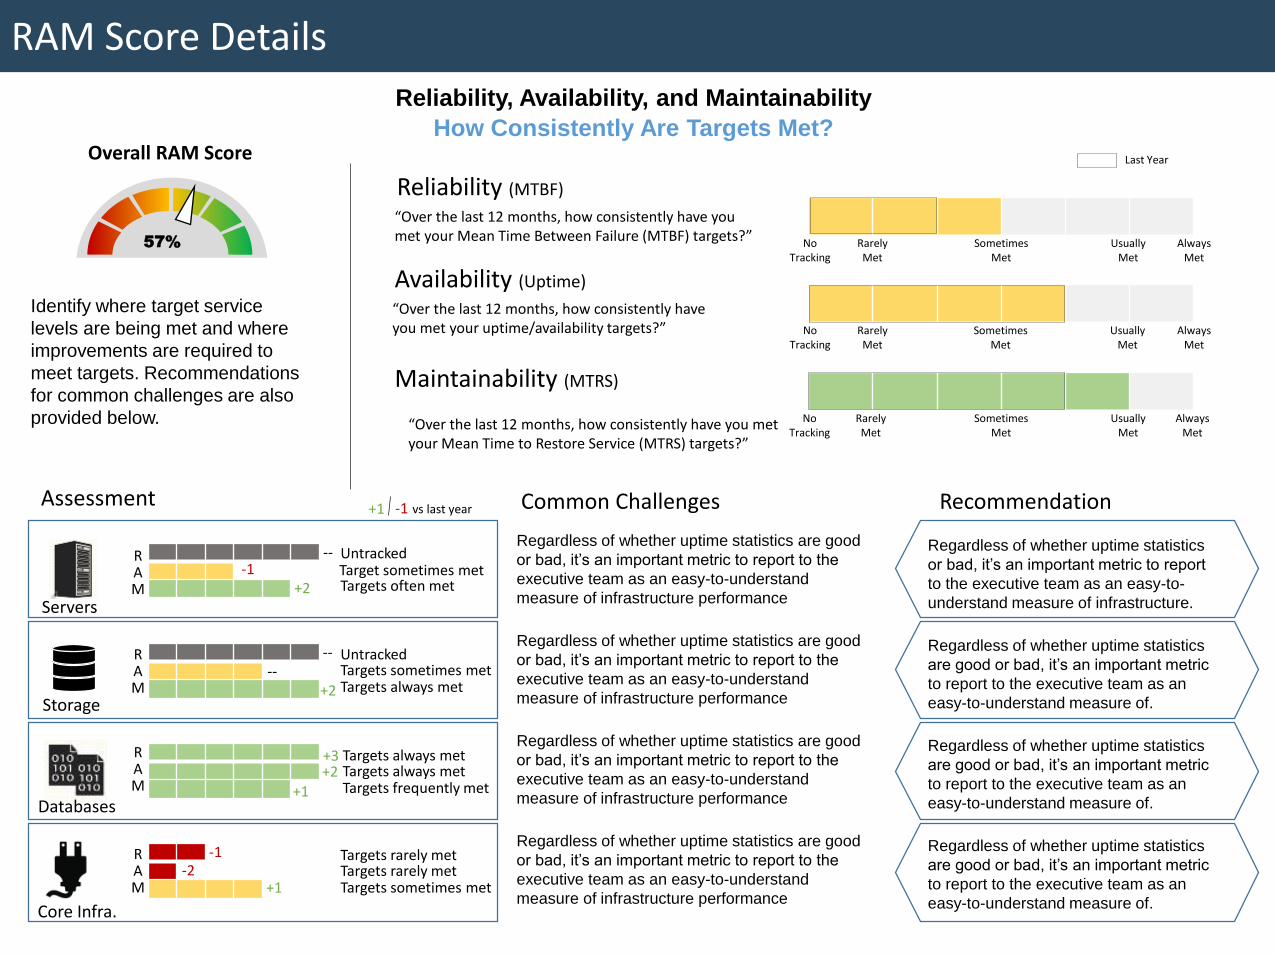
57%
RAM Score Details
Identify where target service
levels are being met and where
improvements are required to
meet targets. Recommendations
for common challenges are also
provided below.
Overall RAM Score
Servers
Storage
Databases
Core Infra.
RAM
RAM
UntrackedTarget sometimes metTargets often met
RAM
RAM
UntrackedTargets sometimes metTargets always met
Targets always metTargets always metTargets frequently met
Targets rarely metTargets rarely metTargets sometimes met
Assessment Common Challenges Recommendation
Regardless of whether uptime statistics are good
or bad, it’s an important metric to report to the
executive team as an easy-to-understand
measure of infrastructure performance
Regardless of whether uptime statistics are good
or bad, it’s an important metric to report to the
executive team as an easy-to-understand
measure of infrastructure performance
Regardless of whether uptime statistics are good
or bad, it’s an important metric to report to the
executive team as an easy-to-understand
measure of infrastructure performance
Regardless of whether uptime statistics are good
or bad, it’s an important metric to report to the
executive team as an easy-to-understand
measure of infrastructure performance
Regardless of whether uptime statistics
or bad, it’s an important metric to report
to the executive team as an easy-to-
understand measure of infrastructure.
Regardless of whether uptime statistics
are good or bad, it’s an important metric
to report to the executive team as an
easy-to-understand measure of.
Regardless of whether uptime statistics
are good or bad, it’s an important metric
to report to the executive team as an
easy-to-understand measure of.
Regardless of whether uptime statistics
are good or bad, it’s an important metric
to report to the executive team as an
easy-to-understand measure of.
Reliability, Availability, and Maintainability
How Consistently Are Targets Met?
Reliability (MTBF)
“Over the last 12 months, how consistently have you met your Mean Time Between Failure (MTBF) targets?”
Availability (Uptime)
“Over the last 12 months, how consistently have you met your uptime/availability targets?”
Maintainability (MTRS)
AlwaysMet
“Over the last 12 months, how consistently have you met your Mean Time to Restore Service (MTRS) targets?”
AlwaysMet
AlwaysMet
NoTracking
NoTracking
NoTracking
RarelyMet
RarelyMet
RarelyMet
SometimesMet
SometimesMet
SometimesMet
UsuallyMet
UsuallyMet
UsuallyMet
Last Year
---1
+2
----
+2
+3
+1+2
-1
+1-2
-1+1 vs last year
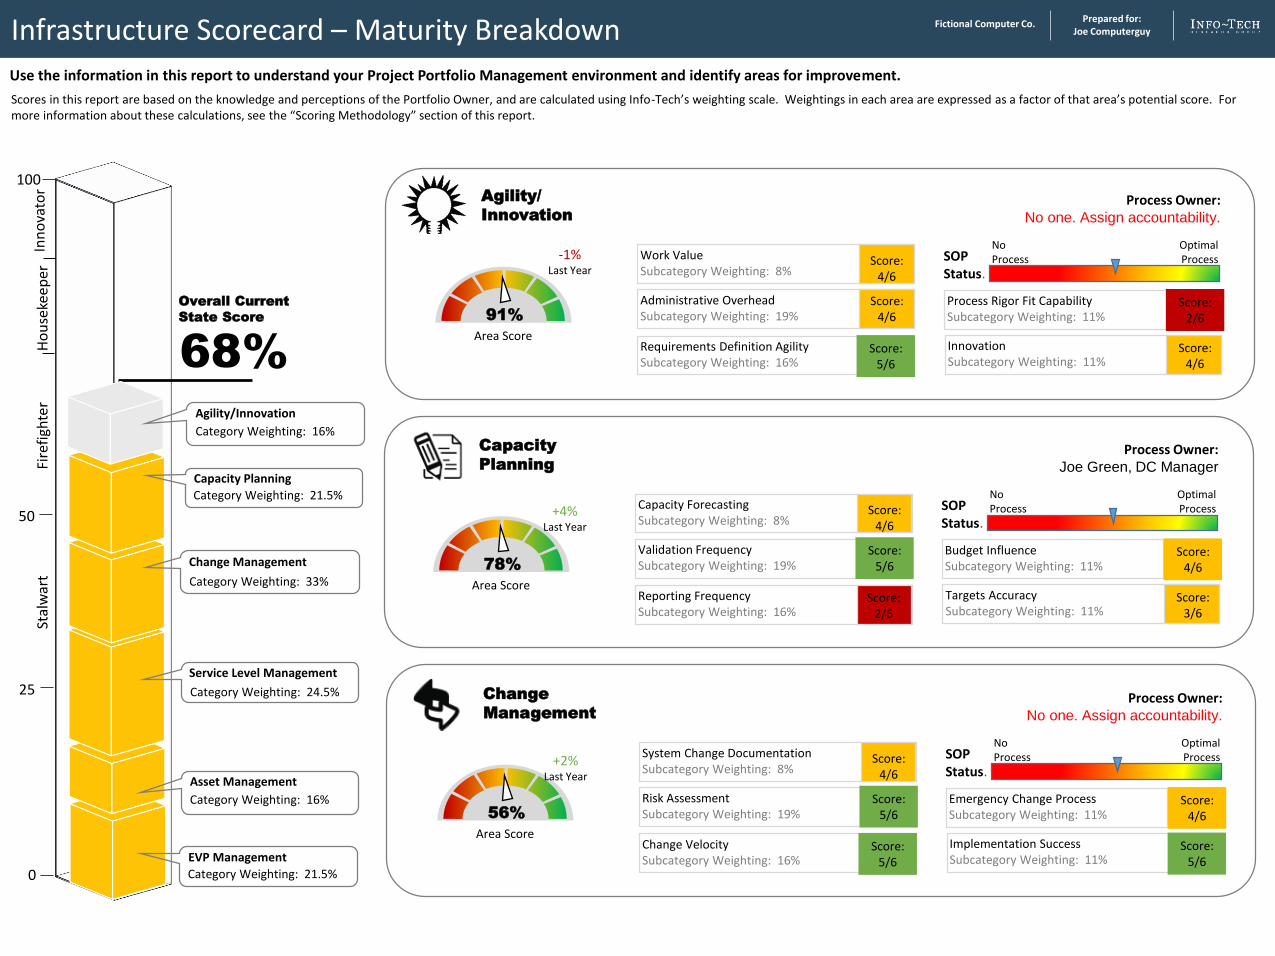
Infrastructure Scorecard – Maturity Breakdown
Use the information in this report to understand your Project Portfolio Management environment and identify areas for improvement.
Scores in this report are based on the knowledge and perceptions of the Portfolio Owner, and are calculated using Info-Tech’s weighting scale. Weightings in each area are expressed as a factor of that area’s potential score. For more information about these calculations, see the “Scoring Methodology” section of this report.
Fictional Computer Co. Prepared for: Joe Computerguy
91%
Area Score
Agility/
Innovation
Work ValueSubcategory Weighting: 8%
Score:4/6
Requirements Definition AgilitySubcategory Weighting: 16%
Score:5/6
Administrative OverheadSubcategory Weighting: 19%
Score:4/6
Process Rigor Fit CapabilitySubcategory Weighting: 11%
Score:2/6
InnovationSubcategory Weighting: 11%
Score:4/6
100
0
50
25
68%
Overall Current
State Score
Process Owner: No one. Assign accountability.
OptimalProcess
NoProcessSOP
Status.
78%
Area Score
Capacity
Planning
Capacity ForecastingSubcategory Weighting: 8%
Score:4/6
Reporting FrequencySubcategory Weighting: 16%
Score:2/6
Validation FrequencySubcategory Weighting: 19%
Score:5/6
Budget InfluenceSubcategory Weighting: 11%
Score:4/6
Targets AccuracySubcategory Weighting: 11%
Score:3/6
Process Owner: Joe Green, DC Manager
OptimalProcess
NoProcessSOP
Status.
56%
Area Score
Change
Management
System Change DocumentationSubcategory Weighting: 8%
Score:4/6
Change VelocitySubcategory Weighting: 16%
Score:5/6
Risk AssessmentSubcategory Weighting: 19%
Score:5/6
Emergency Change ProcessSubcategory Weighting: 11%
Score:4/6
Implementation SuccessSubcategory Weighting: 11%
Score:5/6
Process Owner: No one. Assign accountability.
OptimalProcess
NoProcessSOP
Status.
Change Management
Category Weighting: 33%
Category Weighting: 21.5%
Capacity Planning
Category Weighting: 16%
Agility/Innovation
Inn
ova
tor
Ho
use
kee
per
Fire
figh
ter
Stal
war
t
-1%Last Year
+4%Last Year
+2%Last Year
Category Weighting: 21.5%
EVP Management
Category Weighting: 24.5%
Service Level Management
Category Weighting: 16%
Asset Management
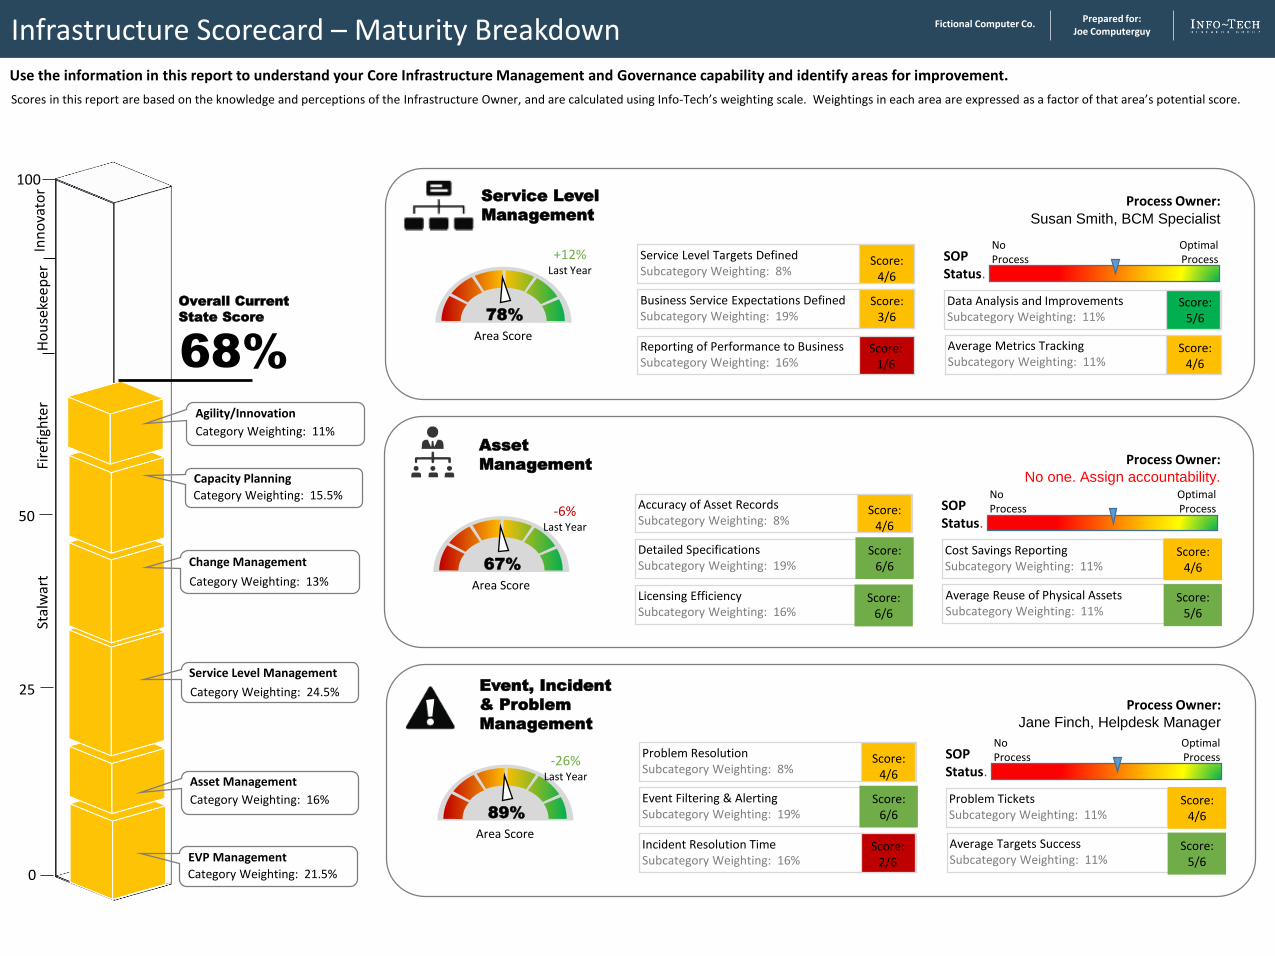
Infrastructure Scorecard – Maturity Breakdown
Use the information in this report to understand your Core Infrastructure Management and Governance capability and identify areas for improvement.
Scores in this report are based on the knowledge and perceptions of the Infrastructure Owner, and are calculated using Info-Tech’s weighting scale. Weightings in each area are expressed as a factor of that area’s potential score.
Fictional Computer Co. Prepared for: Joe Computerguy
78%
Area Score
Service Level
Management
Service Level Targets DefinedSubcategory Weighting: 8%
Score:4/6
Reporting of Performance to BusinessSubcategory Weighting: 16%
Score:1/6
Business Service Expectations DefinedSubcategory Weighting: 19%
Score:3/6
Data Analysis and ImprovementsSubcategory Weighting: 11%
Score:5/6
Average Metrics TrackingSubcategory Weighting: 11%
Score:4/6
Process Owner: Susan Smith, BCM Specialist
OptimalProcess
NoProcessSOP
Status.
67%
Area Score
Asset
Management
Accuracy of Asset RecordsSubcategory Weighting: 8%
Score:4/6
Licensing EfficiencySubcategory Weighting: 16%
Score:6/6
Detailed SpecificationsSubcategory Weighting: 19%
Score:6/6
Cost Savings ReportingSubcategory Weighting: 11%
Score:4/6
Average Reuse of Physical AssetsSubcategory Weighting: 11%
Score:5/6
Process Owner: Jane Finch, Helpdesk Manager
OptimalProcess
NoProcessSOP
Status.
89%
Area Score
Event, Incident
& Problem
Management
Problem ResolutionSubcategory Weighting: 8%
Score:4/6
Incident Resolution TimeSubcategory Weighting: 16%
Score:2/6
Event Filtering & AlertingSubcategory Weighting: 19%
Score:6/6
Problem TicketsSubcategory Weighting: 11%
Score:4/6
Average Targets SuccessSubcategory Weighting: 11%
Score:5/6
Process Owner: No one. Assign accountability.
OptimalProcess
NoProcessSOP
Status.
0
50
Category Weighting: 21.5%
EVP Management
25 Category Weighting: 24.5%
Service Level Management
Category Weighting: 16%
Asset Management
Change Management
Category Weighting: 13%
Category Weighting: 15.5%
Capacity Planning
Category Weighting: 11%
Agility/Innovation
+12%Last Year
-6%Last Year
-26%Last Year
100
Inn
ova
tor
Ho
use
kee
per
Fire
figh
ter
Stal
war
t
68%
Overall Current
State Score
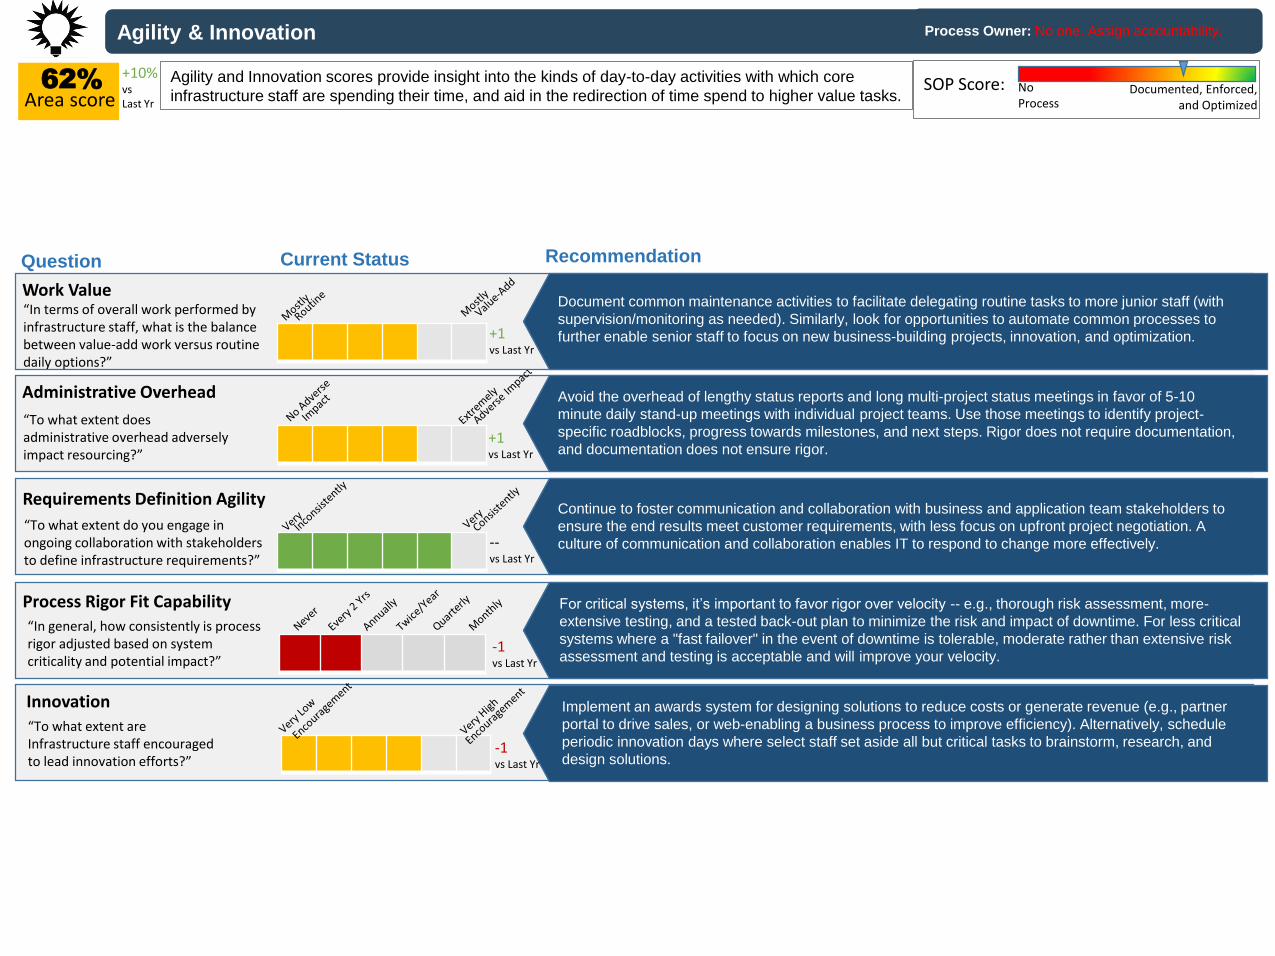
Agility & Innovation
62%
Area scoreAgility and Innovation scores provide insight into the kinds of day-to-day activities with which core
infrastructure staff are spending their time, and aid in the redirection of time spend to higher value tasks.
Avoid the overhead of lengthy status reports and long multi-project status meetings in favor of 5-10
minute daily stand-up meetings with individual project teams. Use those meetings to identify project-
specific roadblocks, progress towards milestones, and next steps. Rigor does not require documentation,
and documentation does not ensure rigor.
Process Owner: No one. Assign accountability.
Documented, Enforced, and Optimized
No Process
SOP Score:
“To what extent do you engage in ongoing collaboration with stakeholders to define infrastructure requirements?”
Requirements Definition AgilityContinue to foster communication and collaboration with business and application team stakeholders to
ensure the end results meet customer requirements, with less focus on upfront project negotiation. A
culture of communication and collaboration enables IT to respond to change more effectively.
“In general, how consistently is process rigor adjusted based on system criticality and potential impact?”
Process Rigor Fit Capability For critical systems, it’s important to favor rigor over velocity -- e.g., thorough risk assessment, more-
extensive testing, and a tested back-out plan to minimize the risk and impact of downtime. For less critical
systems where a "fast failover" in the event of downtime is tolerable, moderate rather than extensive risk
assessment and testing is acceptable and will improve your velocity.
Implement an awards system for designing solutions to reduce costs or generate revenue (e.g., partner
portal to drive sales, or web-enabling a business process to improve efficiency). Alternatively, schedule
periodic innovation days where select staff set aside all but critical tasks to brainstorm, research, and
design solutions.
“To what extent are Infrastructure staff encouraged to lead innovation efforts?”
Innovation
“To what extent does administrative overhead adversely impact resourcing?”
Administrative Overhead
Document common maintenance activities to facilitate delegating routine tasks to more junior staff (with
supervision/monitoring as needed). Similarly, look for opportunities to automate common processes to
further enable senior staff to focus on new business-building projects, innovation, and optimization.
RecommendationQuestion Current Status
“In terms of overall work performed by infrastructure staff, what is the balance between value-add work versus routine daily options?”
Work Value
+1vs Last Yr
+1vs Last Yr
--vs Last Yr
-1vs Last Yr
-1vs Last Yr
+10%vs Last Yr
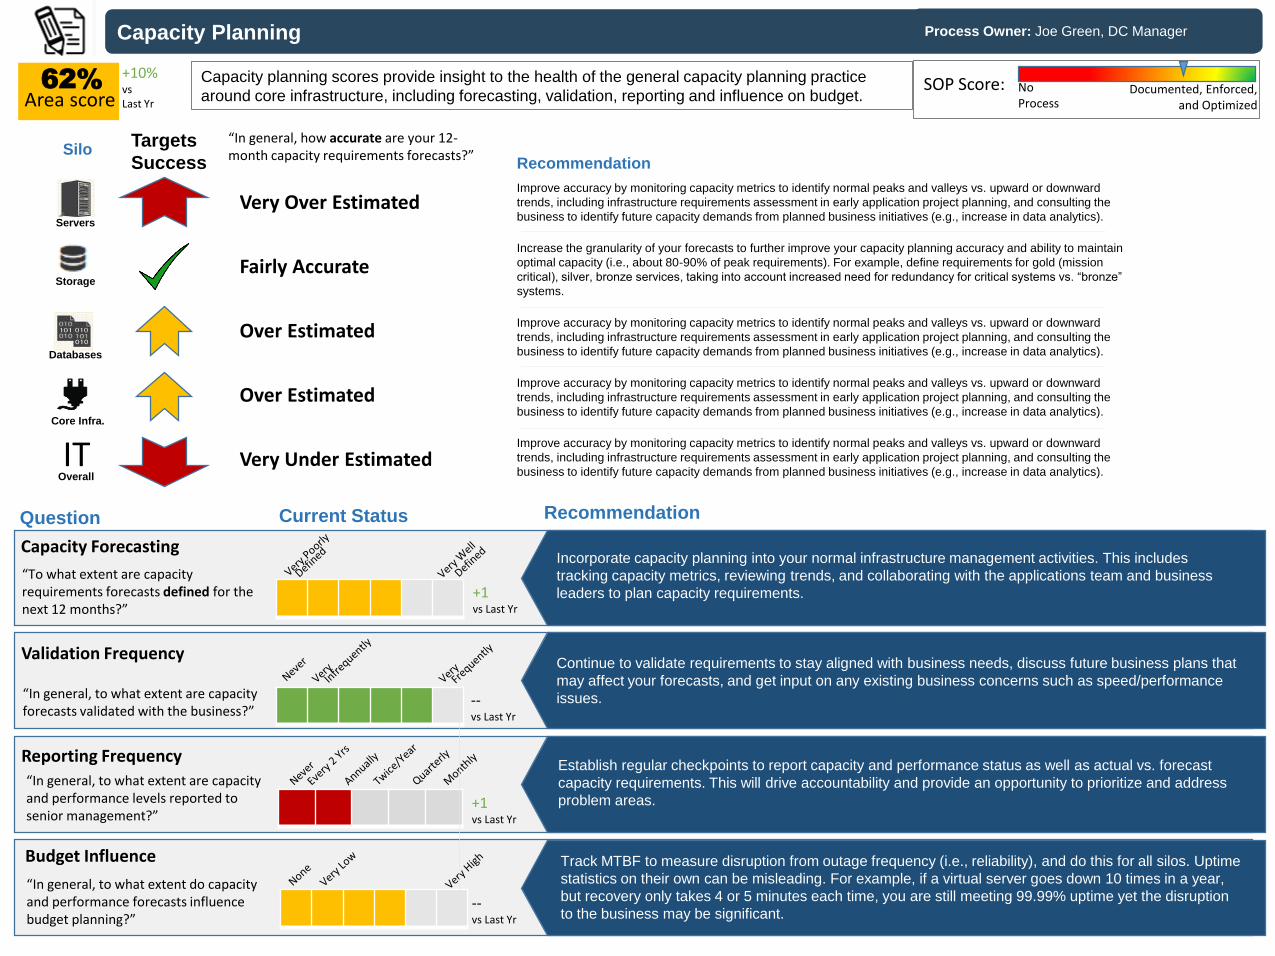
Capacity Planning
62%
Area scoreCapacity planning scores provide insight to the health of the general capacity planning practice
around core infrastructure, including forecasting, validation, reporting and influence on budget.
Incorporate capacity planning into your normal infrastructure management activities. This includes
tracking capacity metrics, reviewing trends, and collaborating with the applications team and business
leaders to plan capacity requirements.
Process Owner: Joe Green, DC Manager
Documented, Enforced, and Optimized
No Process
SOP Score:
Recommendation
“In general, to what extent are capacity forecasts validated with the business?”
Validation Frequency
Question Current Status
Continue to validate requirements to stay aligned with business needs, discuss future business plans that
may affect your forecasts, and get input on any existing business concerns such as speed/performance
issues.
“In general, to what extent are capacity and performance levels reported to senior management?”
Reporting FrequencyEstablish regular checkpoints to report capacity and performance status as well as actual vs. forecast
capacity requirements. This will drive accountability and provide an opportunity to prioritize and address
problem areas.
Track MTBF to measure disruption from outage frequency (i.e., reliability), and do this for all silos. Uptime
statistics on their own can be misleading. For example, if a virtual server goes down 10 times in a year,
but recovery only takes 4 or 5 minutes each time, you are still meeting 99.99% uptime yet the disruption
to the business may be significant.
“In general, to what extent do capacity and performance forecasts influence budget planning?”
Budget Influence
Very Over Estimated
Very Under Estimated
Over Estimated
“To what extent are capacity requirements forecasts defined for the next 12 months?”
Capacity Forecasting
“In general, how accurate are your 12-month capacity requirements forecasts?”
Improve accuracy by monitoring capacity metrics to identify normal peaks and valleys vs. upward or downward
trends, including infrastructure requirements assessment in early application project planning, and consulting the
business to identify future capacity demands from planned business initiatives (e.g., increase in data analytics).
Increase the granularity of your forecasts to further improve your capacity planning accuracy and ability to maintain
optimal capacity (i.e., about 80-90% of peak requirements). For example, define requirements for gold (mission
critical), silver, bronze services, taking into account increased need for redundancy for critical systems vs. “bronze”
systems.
Improve accuracy by monitoring capacity metrics to identify normal peaks and valleys vs. upward or downward
trends, including infrastructure requirements assessment in early application project planning, and consulting the
business to identify future capacity demands from planned business initiatives (e.g., increase in data analytics).
Recommendation
Fairly Accurate
Targets
Success
+10%vs Last Yr
+1vs Last Yr
+1vs Last Yr
--vs Last Yr
--vs Last Yr
Servers
Storage
Databases
Core Infra.
ITOverall
Silo
Over EstimatedImprove accuracy by monitoring capacity metrics to identify normal peaks and valleys vs. upward or downward
trends, including infrastructure requirements assessment in early application project planning, and consulting the
business to identify future capacity demands from planned business initiatives (e.g., increase in data analytics).
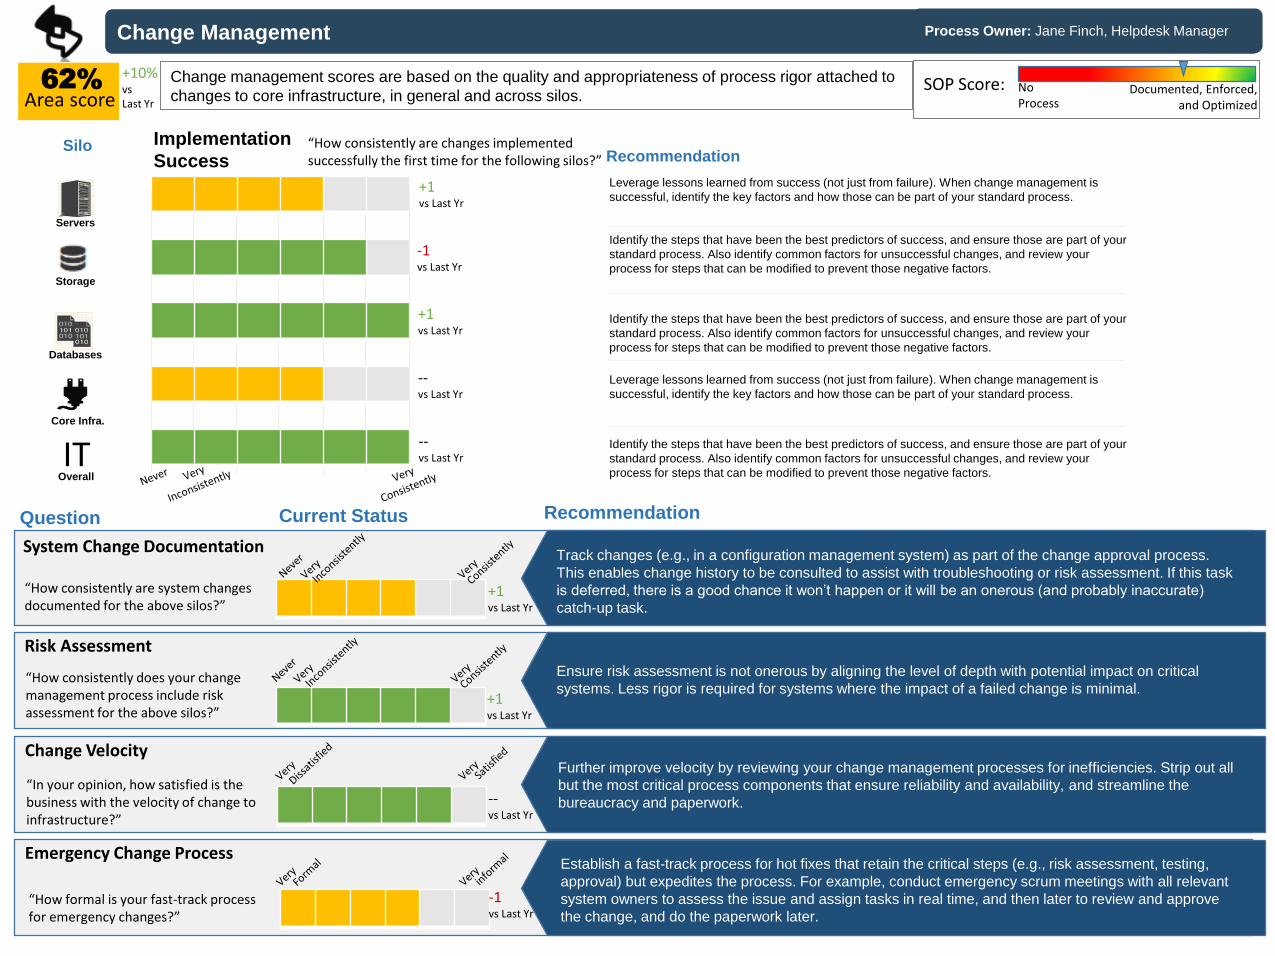
Change Management
62%
Area scoreChange management scores are based on the quality and appropriateness of process rigor attached to
changes to core infrastructure, in general and across silos.
Track changes (e.g., in a configuration management system) as part of the change approval process.
This enables change history to be consulted to assist with troubleshooting or risk assessment. If this task
is deferred, there is a good chance it won’t happen or it will be an onerous (and probably inaccurate)
catch-up task.
Process Owner: Jane Finch, Helpdesk Manager
Documented, Enforced, and Optimized
No Process
SOP Score:
Recommendation
“In your opinion, how satisfied is the business with the velocity of change to infrastructure?”
Change Velocity
Question Current Status
Ensure risk assessment is not onerous by aligning the level of depth with potential impact on critical
systems. Less rigor is required for systems where the impact of a failed change is minimal.
“How formal is your fast-track process for emergency changes?”
Emergency Change Process
Further improve velocity by reviewing your change management processes for inefficiencies. Strip out all
but the most critical process components that ensure reliability and availability, and streamline the
bureaucracy and paperwork.
Establish a fast-track process for hot fixes that retain the critical steps (e.g., risk assessment, testing,
approval) but expedites the process. For example, conduct emergency scrum meetings with all relevant
system owners to assess the issue and assign tasks in real time, and then later to review and approve
the change, and do the paperwork later.
“How consistently are system changes documented for the above silos?”
System Change Documentation
“How consistently does your change management process include risk assessment for the above silos?”
Risk Assessment
Leverage lessons learned from success (not just from failure). When change management is
successful, identify the key factors and how those can be part of your standard process.
Identify the steps that have been the best predictors of success, and ensure those are part of your
standard process. Also identify common factors for unsuccessful changes, and review your
process for steps that can be modified to prevent those negative factors.
Identify the steps that have been the best predictors of success, and ensure those are part of your
standard process. Also identify common factors for unsuccessful changes, and review your
process for steps that can be modified to prevent those negative factors.
Leverage lessons learned from success (not just from failure). When change management is
successful, identify the key factors and how those can be part of your standard process.
Recommendation“How consistently are changes implemented successfully the first time for the following silos?”
Implementation
Success
Servers
Storage
Databases
Core Infra.
IT Identify the steps that have been the best predictors of success, and ensure those are part of your
standard process. Also identify common factors for unsuccessful changes, and review your
process for steps that can be modified to prevent those negative factors.Overall
+1vs Last Yr
+1vs Last Yr
--vs Last Yr
-1vs Last Yr
+1vs Last Yr
+1vs Last Yr
--vs Last Yr
-1vs Last Yr
--vs Last Yr
+10%vs Last Yr
Silo
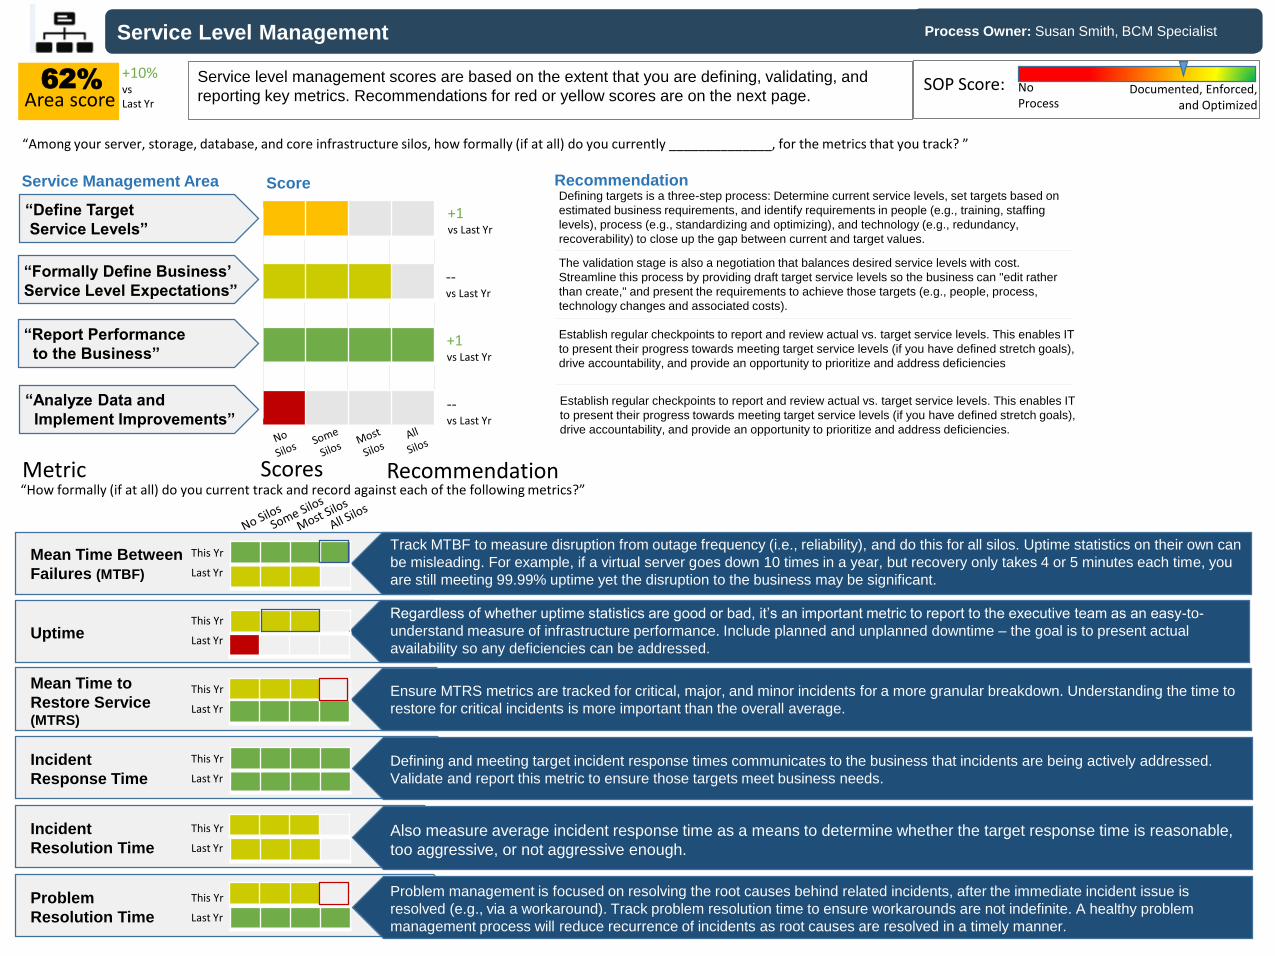
“Define Target
Service Levels”
“Analyze Data and
Implement Improvements”
“Report Performance
to the Business”
“Formally Define Business’
Service Level Expectations”
Service Level Management
62%
Area scoreService level management scores are based on the extent that you are defining, validating, and
reporting key metrics. Recommendations for red or yellow scores are on the next page.
Regardless of whether uptime statistics are good or bad, it’s an important metric to report to the executive team as an easy-to-
understand measure of infrastructure performance. Include planned and unplanned downtime – the goal is to present actual
availability so any deficiencies can be addressed.
Defining and meeting target incident response times communicates to the business that incidents are being actively addressed.
Validate and report this metric to ensure those targets meet business needs.
Ensure MTRS metrics are tracked for critical, major, and minor incidents for a more granular breakdown. Understanding the time to
restore for critical incidents is more important than the overall average.
Problem management is focused on resolving the root causes behind related incidents, after the immediate incident issue is
resolved (e.g., via a workaround). Track problem resolution time to ensure workarounds are not indefinite. A healthy problem
management process will reduce recurrence of incidents as root causes are resolved in a timely manner.
Also measure average incident response time as a means to determine whether the target response time is reasonable,
too aggressive, or not aggressive enough.
Metric Scores
Uptime
Mean Time to
Restore Service (MTRS)
Problem
Resolution Time
Incident
Resolution Time
Incident
Response Time
Recommendation
Process Owner: Susan Smith, BCM Specialist
Documented, Enforced, and Optimized
No Process
SOP Score:
Defining targets is a three-step process: Determine current service levels, set targets based on
estimated business requirements, and identify requirements in people (e.g., training, staffing
levels), process (e.g., standardizing and optimizing), and technology (e.g., redundancy,
recoverability) to close up the gap between current and target values.
The validation stage is also a negotiation that balances desired service levels with cost.
Streamline this process by providing draft target service levels so the business can "edit rather
than create," and present the requirements to achieve those targets (e.g., people, process,
technology changes and associated costs).
Establish regular checkpoints to report and review actual vs. target service levels. This enables IT
to present their progress towards meeting target service levels (if you have defined stretch goals),
drive accountability, and provide an opportunity to prioritize and address deficiencies
Recommendation
“Among your server, storage, database, and core infrastructure silos, how formally (if at all) do you currently ______________, for the metrics that you track? ”
+1vs Last Yr
+1vs Last Yr
--vs Last Yr
--vs Last Yr
+10%vs Last Yr
ScoreService Management Area
This Yr
Last Yr
This Yr
Last Yr
This Yr
Last Yr
This Yr
Last Yr
This Yr
Last Yr
“How formally (if at all) do you current track and record against each of the following metrics?”
Track MTBF to measure disruption from outage frequency (i.e., reliability), and do this for all silos. Uptime statistics on their own can
be misleading. For example, if a virtual server goes down 10 times in a year, but recovery only takes 4 or 5 minutes each time, you
are still meeting 99.99% uptime yet the disruption to the business may be significant.
Mean Time Between
Failures (MTBF)
This Yr
Last Yr
Establish regular checkpoints to report and review actual vs. target service levels. This enables IT
to present their progress towards meeting target service levels (if you have defined stretch goals),
drive accountability, and provide an opportunity to prioritize and address deficiencies.
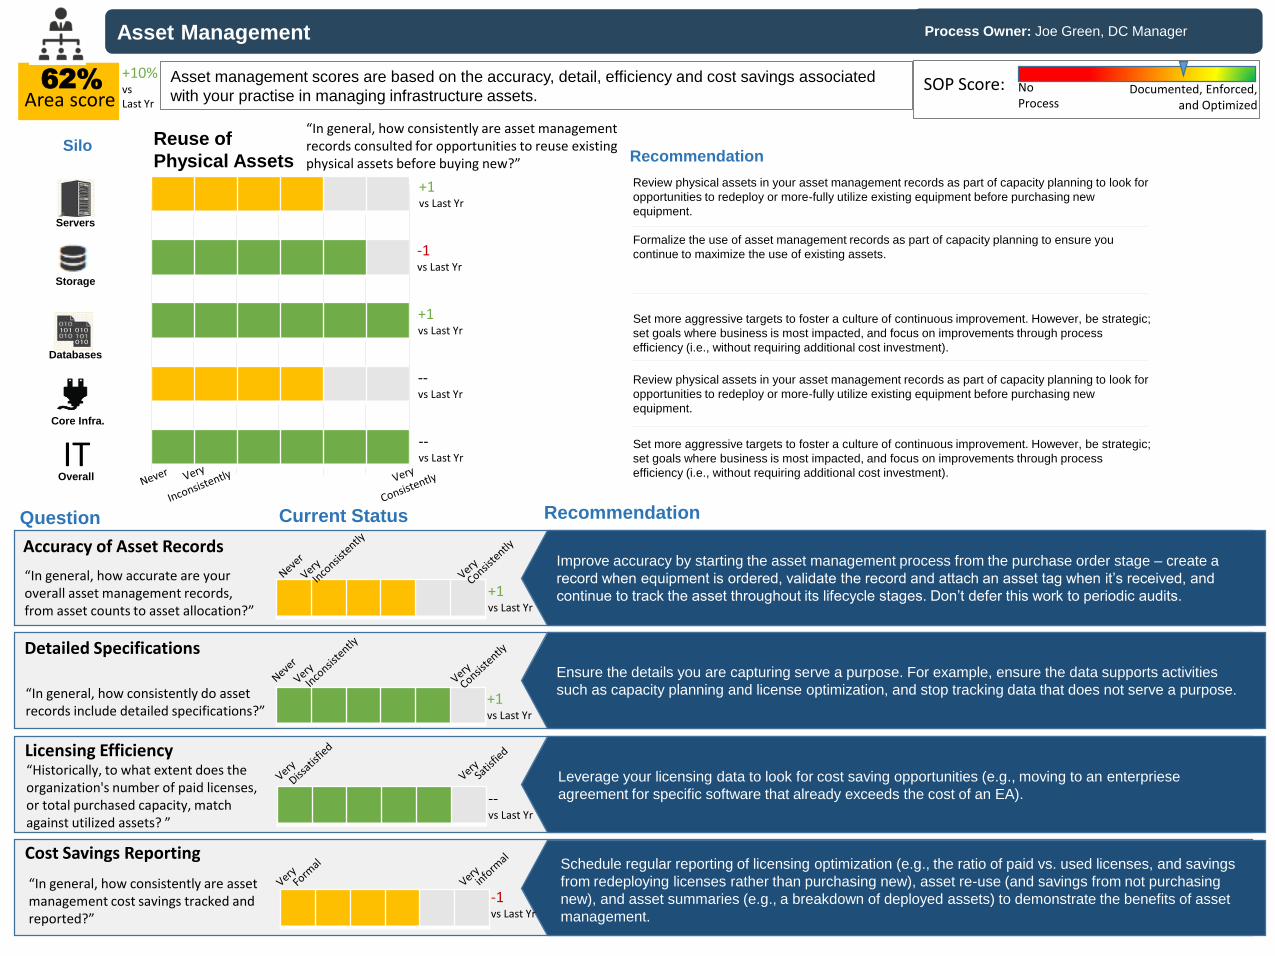
Asset Management
62%
Area scoreAsset management scores are based on the accuracy, detail, efficiency and cost savings associated
with your practise in managing infrastructure assets.
Improve accuracy by starting the asset management process from the purchase order stage – create a
record when equipment is ordered, validate the record and attach an asset tag when it’s received, and
continue to track the asset throughout its lifecycle stages. Don’t defer this work to periodic audits.
Documented, Enforced, and Optimized
No Process
SOP Score:
Recommendation
“Historically, to what extent does the organization's number of paid licenses, or total purchased capacity, match against utilized assets? ”
Licensing Efficiency
Question Current Status
Ensure the details you are capturing serve a purpose. For example, ensure the data supports activities
such as capacity planning and license optimization, and stop tracking data that does not serve a purpose.
“In general, how consistently are asset management cost savings tracked and reported?”
Cost Savings Reporting
Leverage your licensing data to look for cost saving opportunities (e.g., moving to an enterpriese
agreement for specific software that already exceeds the cost of an EA).
Schedule regular reporting of licensing optimization (e.g., the ratio of paid vs. used licenses, and savings
from redeploying licenses rather than purchasing new), asset re-use (and savings from not purchasing
new), and asset summaries (e.g., a breakdown of deployed assets) to demonstrate the benefits of asset
management.
“In general, how accurate are your overall asset management records, from asset counts to asset allocation?”
Accuracy of Asset Records
“In general, how consistently do asset records include detailed specifications?”
Detailed Specifications
Review physical assets in your asset management records as part of capacity planning to look for
opportunities to redeploy or more-fully utilize existing equipment before purchasing new
equipment.
Formalize the use of asset management records as part of capacity planning to ensure you
continue to maximize the use of existing assets.
Set more aggressive targets to foster a culture of continuous improvement. However, be strategic;
set goals where business is most impacted, and focus on improvements through process
efficiency (i.e., without requiring additional cost investment).
Review physical assets in your asset management records as part of capacity planning to look for
opportunities to redeploy or more-fully utilize existing equipment before purchasing new
equipment.
Recommendation
“In general, how consistently are asset management records consulted for opportunities to reuse existing physical assets before buying new?”
Reuse of
Physical Assets
Servers
Storage
Databases
Core Infra.
IT Set more aggressive targets to foster a culture of continuous improvement. However, be strategic;
set goals where business is most impacted, and focus on improvements through process
efficiency (i.e., without requiring additional cost investment).Overall
+1vs Last Yr
+1vs Last Yr
--vs Last Yr
-1vs Last Yr
+1vs Last Yr
+1vs Last Yr
--vs Last Yr
-1vs Last Yr
--vs Last Yr
+10%vs Last Yr
Silo
Process Owner: Joe Green, DC Manager
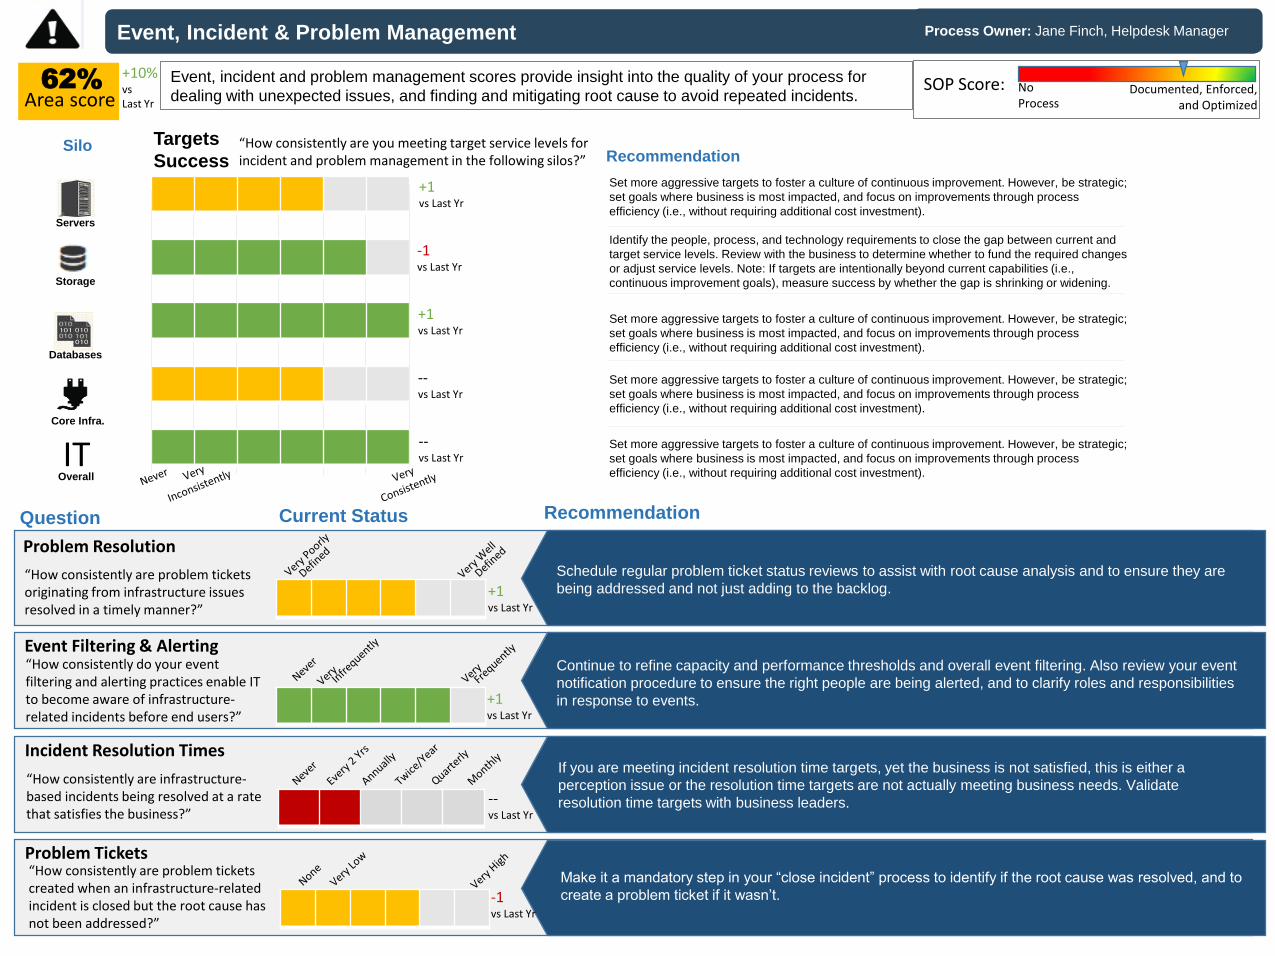
Event, Incident & Problem Management
62%
Area scoreEvent, incident and problem management scores provide insight into the quality of your process for
dealing with unexpected issues, and finding and mitigating root cause to avoid repeated incidents.
Schedule regular problem ticket status reviews to assist with root cause analysis and to ensure they are
being addressed and not just adding to the backlog.
Process Owner: Jane Finch, Helpdesk Manager
Documented, Enforced, and Optimized
No Process
SOP Score:
Recommendation
“How consistently are infrastructure-based incidents being resolved at a rate that satisfies the business?”
Incident Resolution Times
Question Current Status
Continue to refine capacity and performance thresholds and overall event filtering. Also review your event
notification procedure to ensure the right people are being alerted, and to clarify roles and responsibilities
in response to events.
“How consistently are problem tickets created when an infrastructure-related incident is closed but the root cause has not been addressed?”
Problem Tickets
If you are meeting incident resolution time targets, yet the business is not satisfied, this is either a
perception issue or the resolution time targets are not actually meeting business needs. Validate
resolution time targets with business leaders.
Make it a mandatory step in your “close incident” process to identify if the root cause was resolved, and to
create a problem ticket if it wasn’t.
“How consistently are problem tickets originating from infrastructure issues resolved in a timely manner?”
Problem Resolution
“How consistently do your event filtering and alerting practices enable IT to become aware of infrastructure-related incidents before end users?”
Event Filtering & Alerting
Set more aggressive targets to foster a culture of continuous improvement. However, be strategic;
set goals where business is most impacted, and focus on improvements through process
efficiency (i.e., without requiring additional cost investment).
Identify the people, process, and technology requirements to close the gap between current and
target service levels. Review with the business to determine whether to fund the required changes
or adjust service levels. Note: If targets are intentionally beyond current capabilities (i.e.,
continuous improvement goals), measure success by whether the gap is shrinking or widening.
Set more aggressive targets to foster a culture of continuous improvement. However, be strategic;
set goals where business is most impacted, and focus on improvements through process
efficiency (i.e., without requiring additional cost investment).
Set more aggressive targets to foster a culture of continuous improvement. However, be strategic;
set goals where business is most impacted, and focus on improvements through process
efficiency (i.e., without requiring additional cost investment).
Recommendation“How consistently are you meeting target service levels for incident and problem management in the following silos?”
Targets
Success
Servers
Storage
Databases
Core Infra.
IT Set more aggressive targets to foster a culture of continuous improvement. However, be strategic;
set goals where business is most impacted, and focus on improvements through process
efficiency (i.e., without requiring additional cost investment).Overall
+1vs Last Yr
+1vs Last Yr
--vs Last Yr
-1vs Last Yr
+1vs Last Yr
+1vs Last Yr
--vs Last Yr
-1vs Last Yr
--vs Last Yr
+10%vs Last Yr
Silo
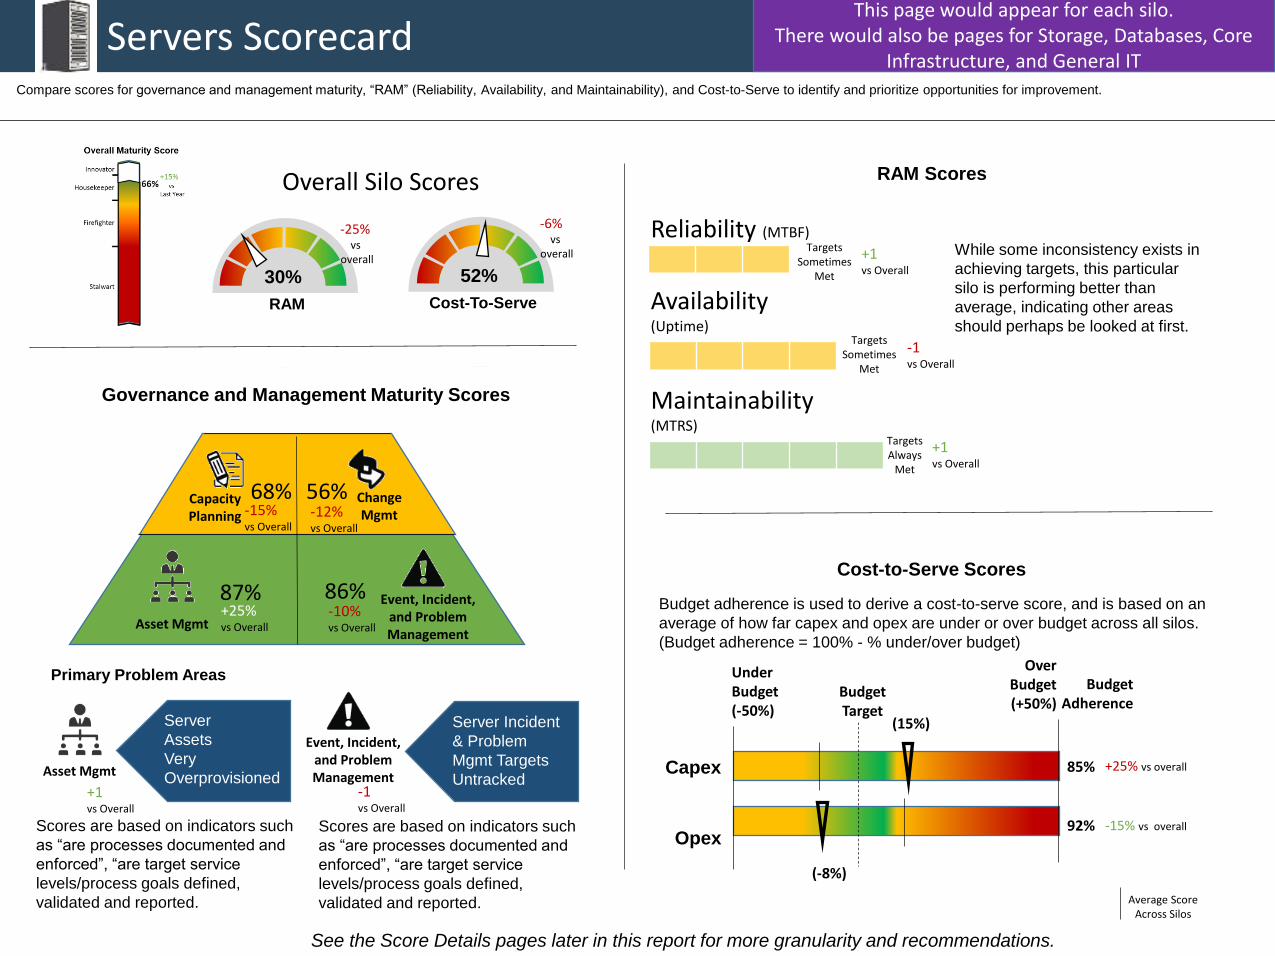
Servers Scorecard
Governance and Management Maturity Scores
Compare scores for governance and management maturity, “RAM” (Reliability, Availability, and Maintainability), and Cost-to-Serve to identify and prioritize opportunities for improvement.
Cost-to-Serve Scores
Scores are based on indicators such
as “are processes documented and
enforced”, “are target service
levels/process goals defined,
validated and reported.
Budget adherence is used to derive a cost-to-serve score, and is based on an
average of how far capex and opex are under or over budget across all silos.
(Budget adherence = 100% - % under/over budget)
UnderBudget(-50%)
OverBudget(+50%)
Budget Target
Capex
Opex
See the Score Details pages later in this report for more granularity and recommendations.
(15%)
(-8%)
Budget Adherence
85%
92%
CapacityPlanning
Event, Incident, and Problem Management
ChangeMgmt
Asset Mgmt
Reliability (MTBF)
Availability(Uptime)
Maintainability(MTRS)
TargetsSometimes
Met
TargetsSometimes
Met
30%
RAM
52%
Cost-To-Serve
TargetsAlways
Met
Primary Problem Areas
Asset Mgmt
Event, Incident, and Problem Management
-25%vs
overall
-6%vs
overall
Overall Silo Scores
Server
Assets
Very
Overprovisioned
Server Incident
& Problem
Mgmt Targets
Untracked
RAM Scores
While some inconsistency exists in
achieving targets, this particular
silo is performing better than
average, indicating other areas
should perhaps be looked at first.
Scores are based on indicators such
as “are processes documented and
enforced”, “are target service
levels/process goals defined,
validated and reported. Average ScoreAcross Silos
-15% vs overall
+25% vs overall
+1vs Overall
+1vs Overall
-1vs Overall
+1vs Overall
-1vs Overall
68% 56%
87% 86%+25%vs Overall
-10%vs Overall
-12%vs Overall
-15%vs Overall
This page would appear for each silo.There would also be pages for Storage, Databases, Core
Infrastructure, and General IT
Recommended