Clayton Heinrich Mineral and Energy Economy Research Institute of the Polish Academy of Sciences
Instytut Gospodarki Surowcami Mineralnymi i Energią Polskiej Akademii Nauk November 21, 2014
Data Driven Sustainable Food Purchasing
An Economic Input-Output Life Cycle Assessment case study applying the Comprehensive Environmental Data Archive (CEDA)
! Background ! About Me ! About CEDA ! About the Bren School
! Data Driven Sustainable Food Purchasing ! Thesis Group ! Client ! Problem ! Data ! Methods & Analysis (CEDA) ! Discussion & Conclusions
! Discussion
Agenda MEERI Visit - 21.11.2014!
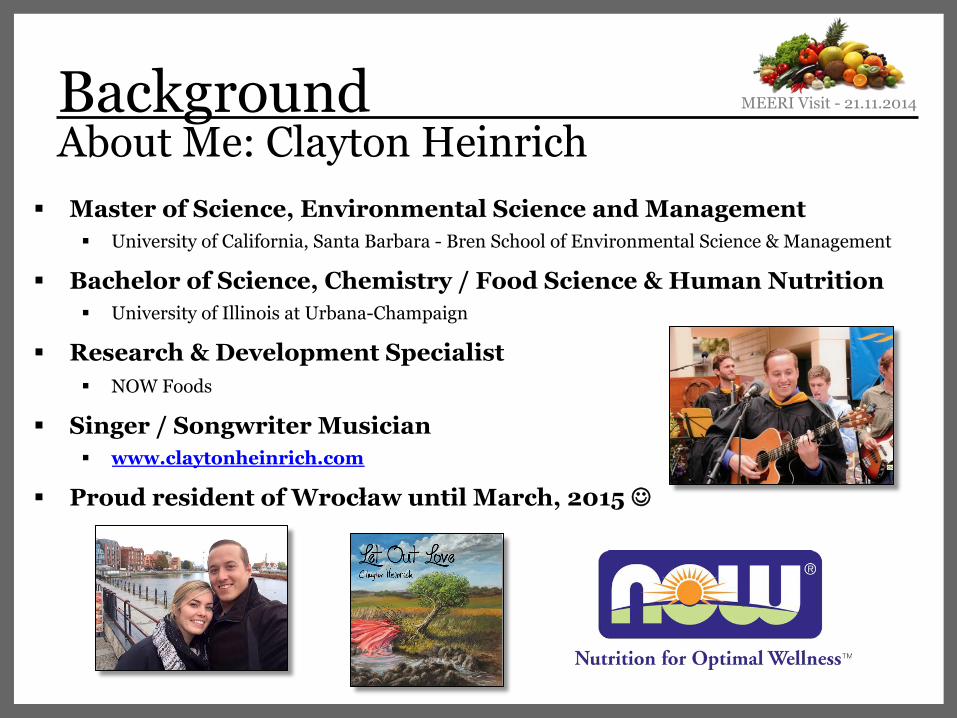
Background About Me: Clayton Heinrich
! Master of Science, Environmental Science and Management ! University of California, Santa Barbara - Bren School of Environmental Science & Management
! Bachelor of Science, Chemistry / Food Science & Human Nutrition ! University of Illinois at Urbana-Champaign
! Research & Development Specialist ! NOW Foods
! Singer / Songwriter Musician ! www.claytonheinrich.com
! Proud resident of Wrocław until March, 2015 ☺
MEERI Visit - 21.11.2014!
About CEDA Background
! Comprehensive Environmental Data Archive (CEDA) ! Developed by Sangwon Suh, PhD
! Economic input-output life cycle assessment tool used to quantify environmental impacts of different industrial processes
! Multiple functions ! Suite of indicator results ! Input Contribution tool
! Output Contribution tool
! Diverse applications ! Carbon footprinting, water consumption, other emissions
! More information at: http://iersweb.com/services/ceda/
MEERI Visit - 21.11.2014!
Background
! Master of Environmental Science and Management
! 2 year program ! Integrates science,
management, law, economics, policy
! Group Project, capstone work that serves as Master’s thesis
About the Bren School MEERI Visit - 21.11.2014!
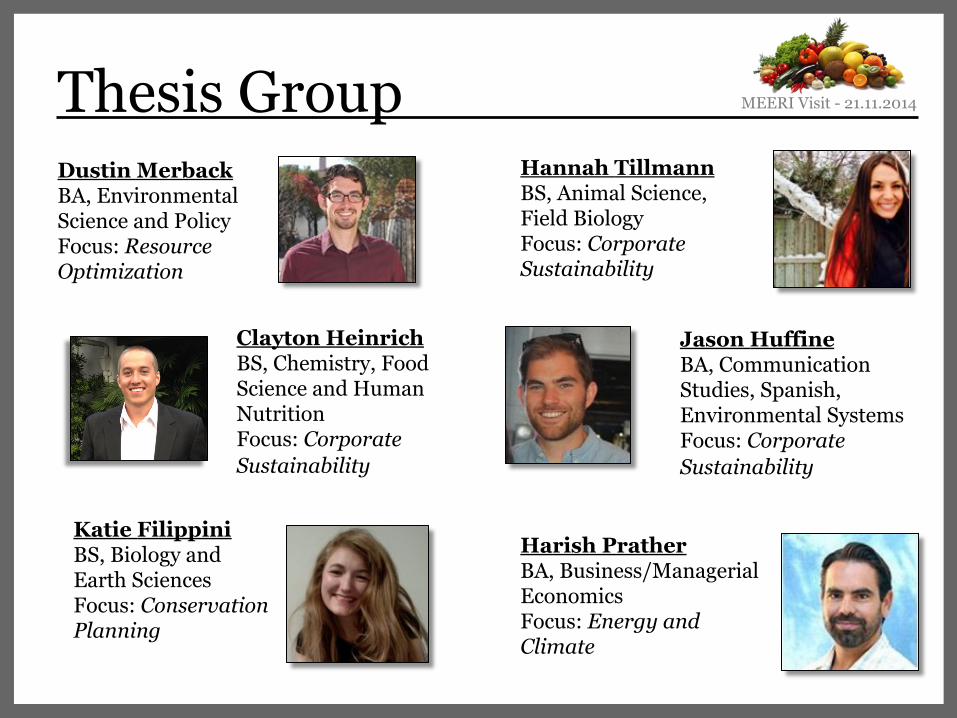
Thesis Group Dustin Merback BA, Environmental Science and Policy Focus: Resource Optimization
Clayton Heinrich BS, Chemistry, Food Science and Human Nutrition Focus: Corporate Sustainability
Katie Filippini BS, Biology and Earth Sciences Focus: Conservation Planning
Hannah Tillmann BS, Animal Science, Field Biology Focus: Corporate Sustainability
Jason Huffine BA, Communication Studies, Spanish, Environmental Systems Focus: Corporate Sustainability
Harish Prather BA, Business/Managerial Economics Focus: Energy and Climate
MEERI Visit - 21.11.2014!
Google, Inc.
! Internet Search Engine & Online Advertising
! Annual Revenue - $50 Billion (2012)
! 70 Offices Globally ! Great Employee
Benefits
Client MEERI Visit - 21.11.2014!
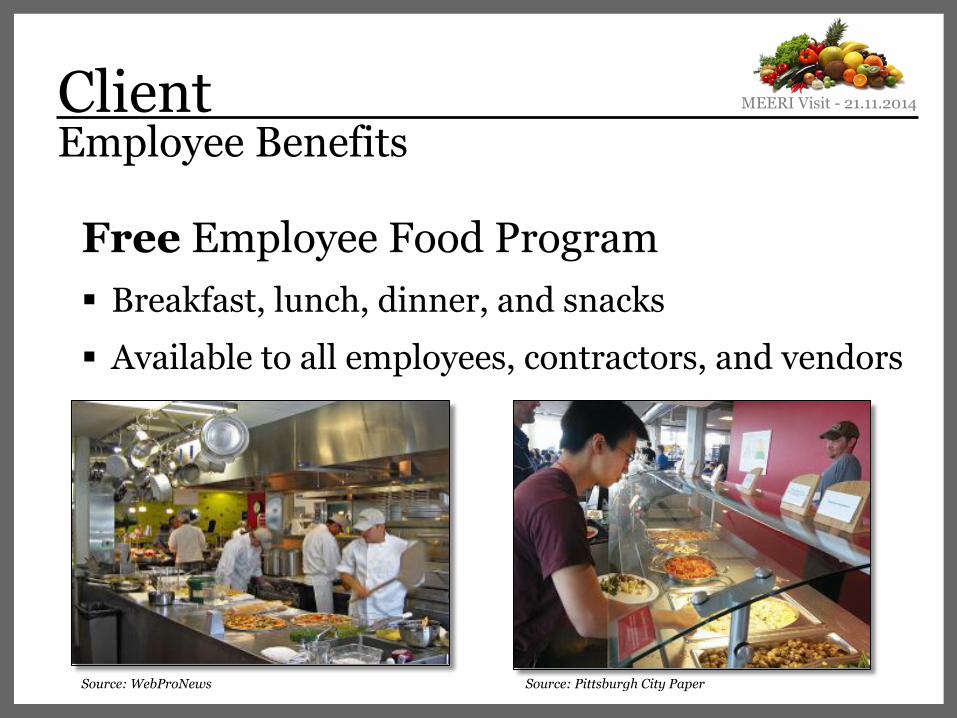
Employee Benefits
Free Employee Food Program ! Breakfast, lunch, dinner, and snacks ! Available to all employees, contractors, and vendors
!
Client
Source: WebProNews Source: Pittsburgh City Paper
MEERI Visit - 21.11.2014!
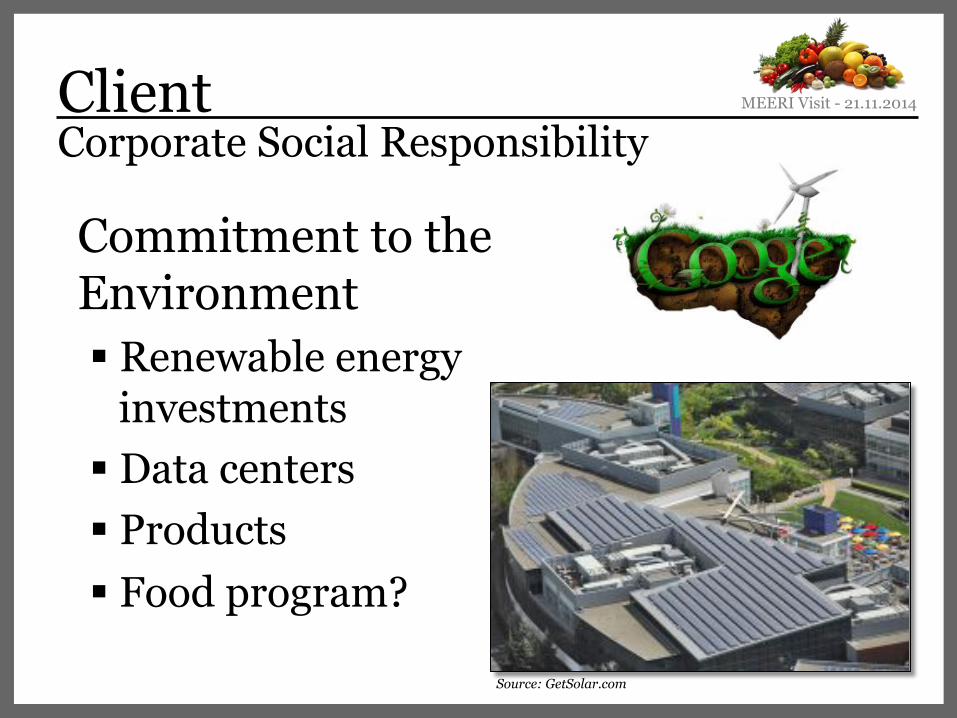
Corporate Social Responsibility
Commitment to the Environment ! Renewable energy
investments ! Data centers ! Products ! Food program?
Client
Source: GetSolar.com
MEERI Visit - 21.11.2014!
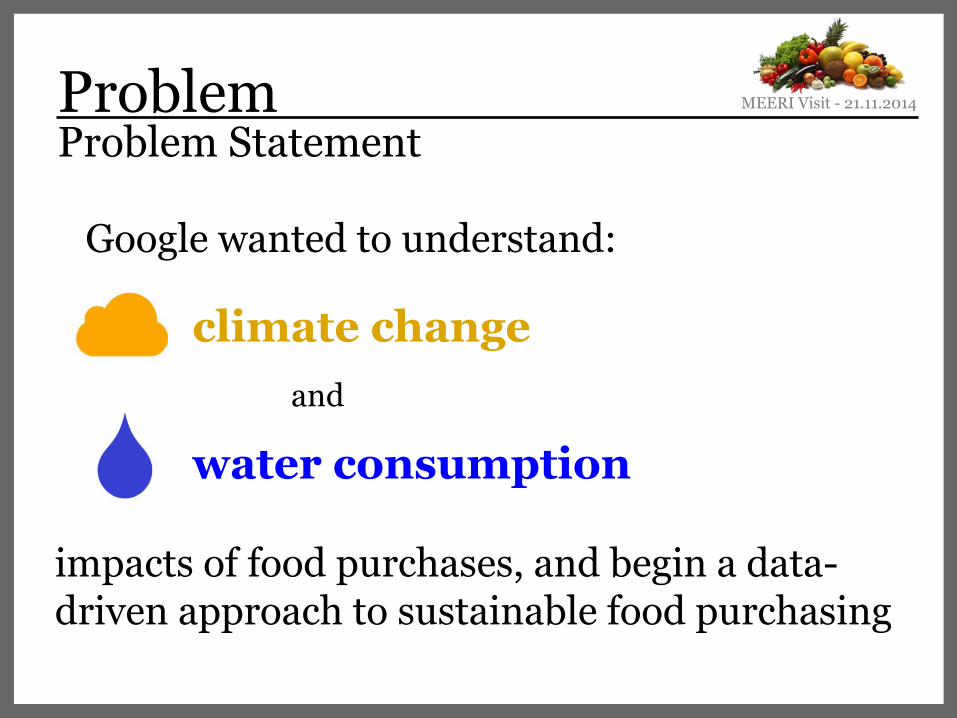
Problem Statement
Google wanted to understand: ! ! climate change and
! water consumption
impacts of food purchases, and begin a data-driven approach to sustainable food purchasing
Problem MEERI Visit - 21.11.2014!
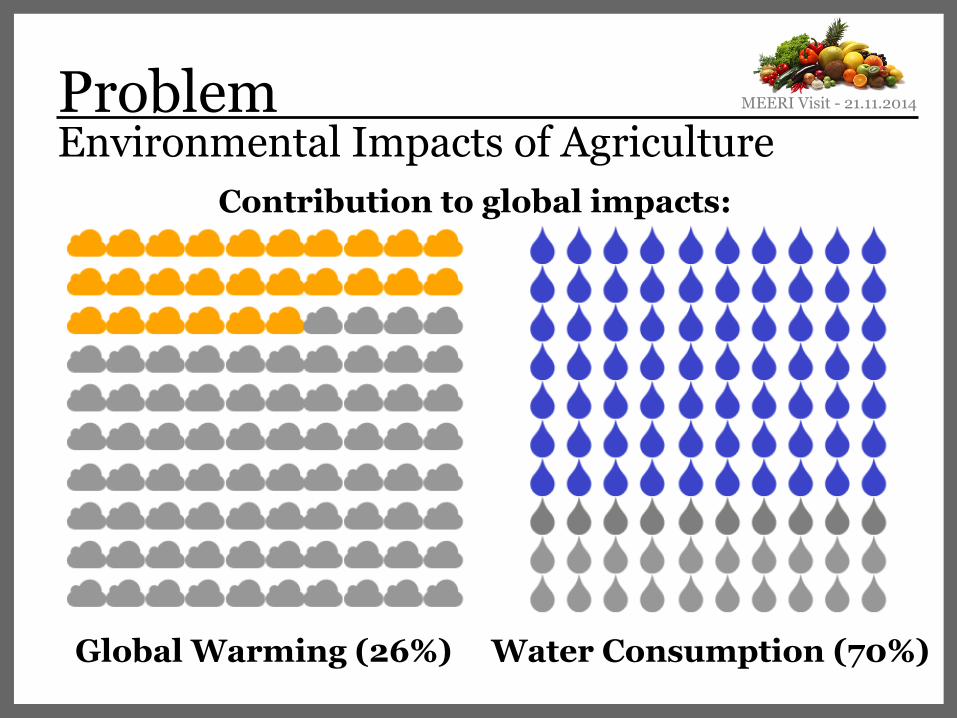
Problem Environmental Impacts of Agriculture
!
Global Warming (26%) Water Consumption (70%)
Contribution to global impacts:
MEERI Visit - 21.11.2014!
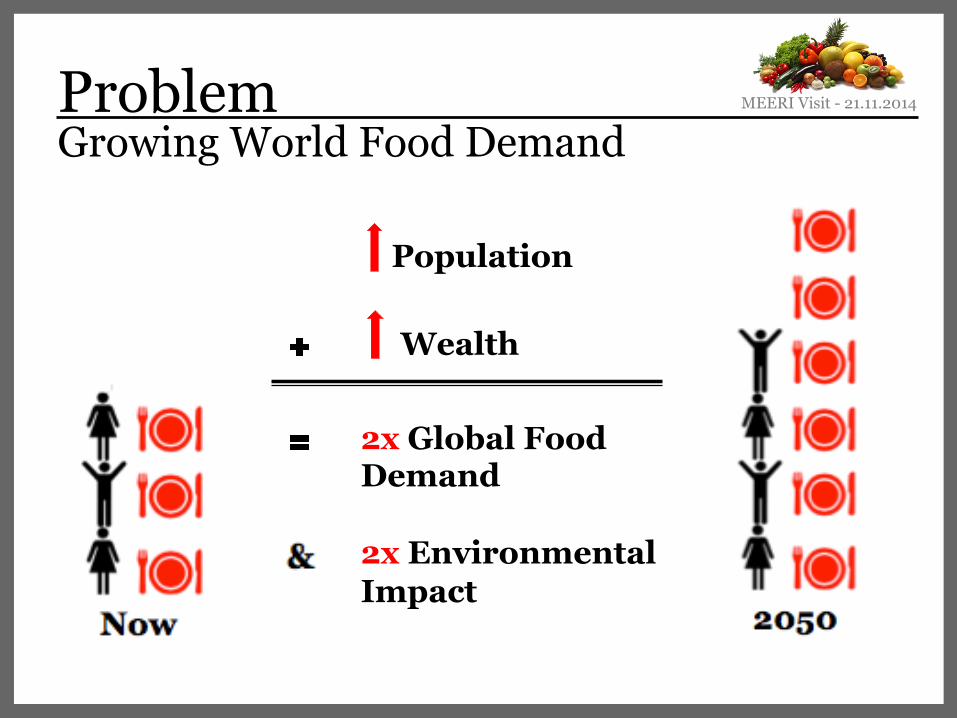
Population
Wealth
2x Global Food Demand 2x Environmental Impact
Problem Growing World Food Demand
MEERI Visit - 21.11.2014!
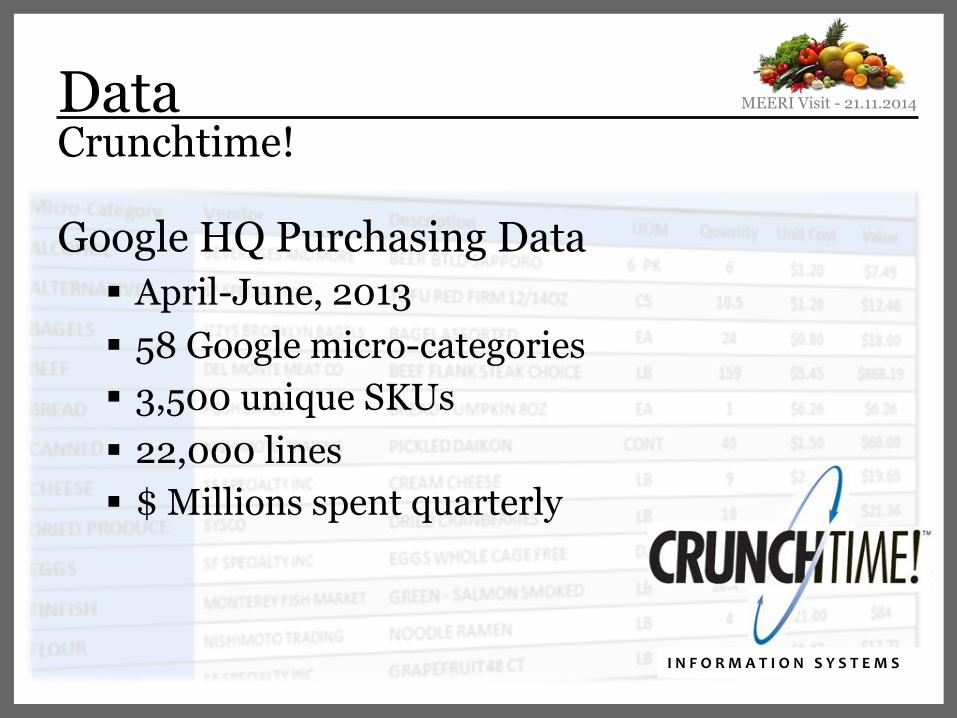
Data Crunchtime!
I"N"F"O"R"M"A"T"I"O"N"""S"Y"S"T"E"M"S"
Google HQ Purchasing Data
! April-June, 2013
! 58 Google micro-categories
! 3,500 unique SKUs
! 22,000 lines
! $ Millions spent quarterly
MEERI Visit - 21.11.2014!
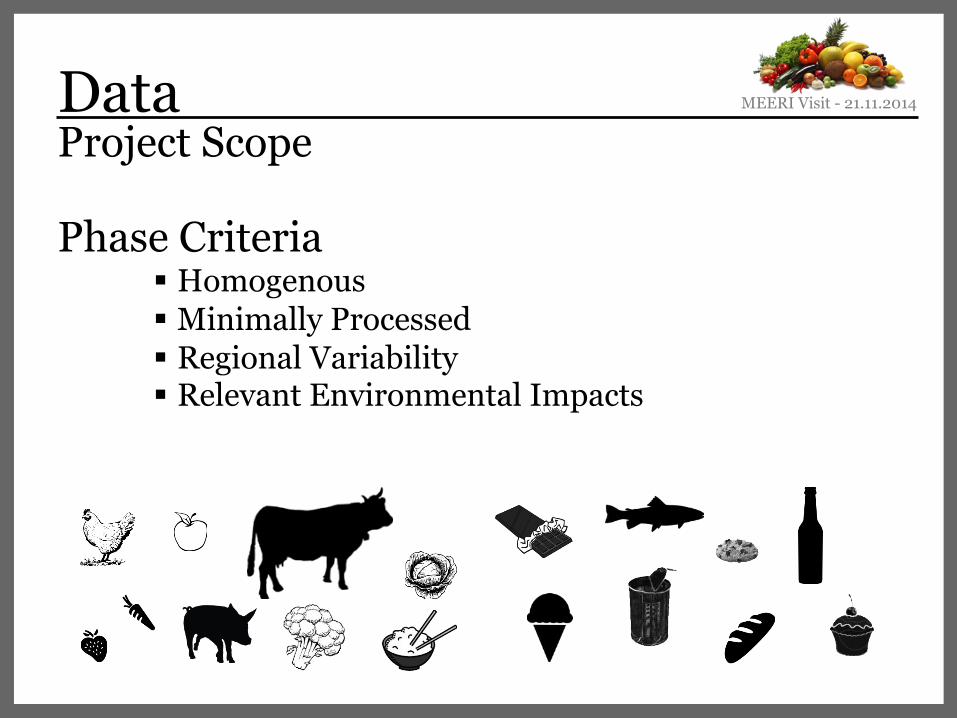
Data Project Scope
Phase Criteria
! Homogenous ! Minimally Processed ! Regional Variability ! Relevant Environmental Impacts
!
MEERI Visit - 21.11.2014!
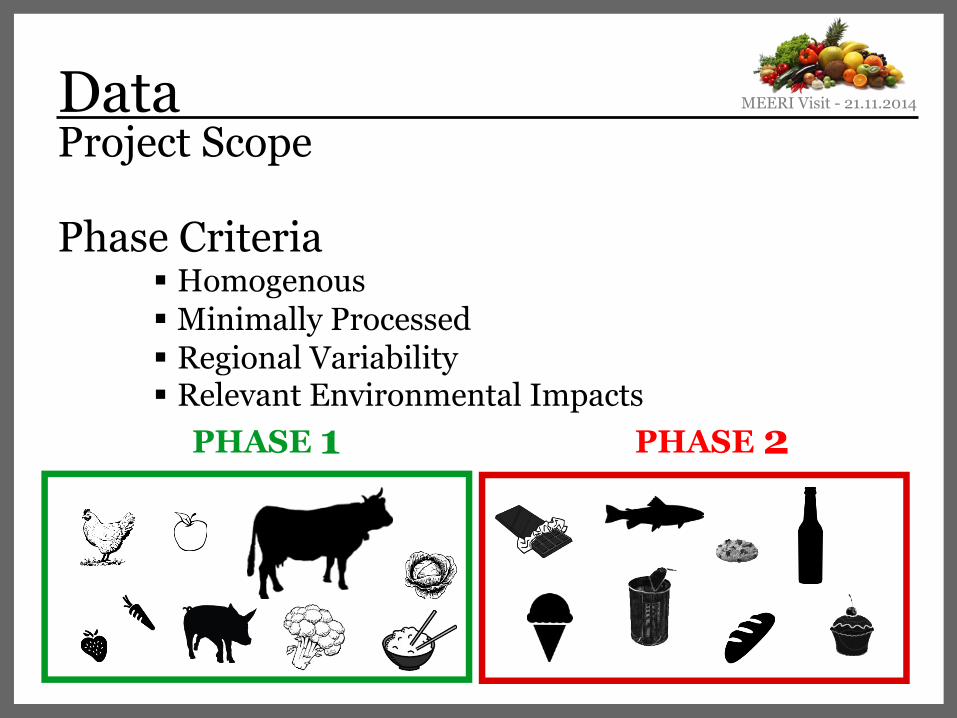
Data Project Scope
PHASE PHASE 1 2
Phase Criteria
! Homogenous
! Minimally Processed
! Regional Variability
! Relevant Environmental Impacts
!
MEERI Visit - 21.11.2014!
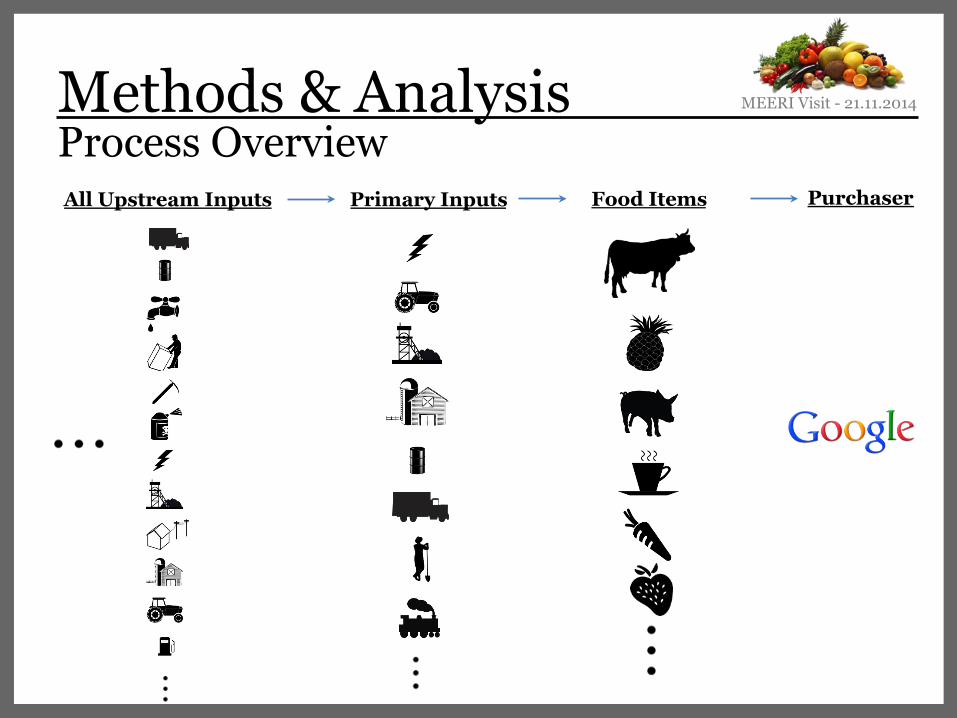
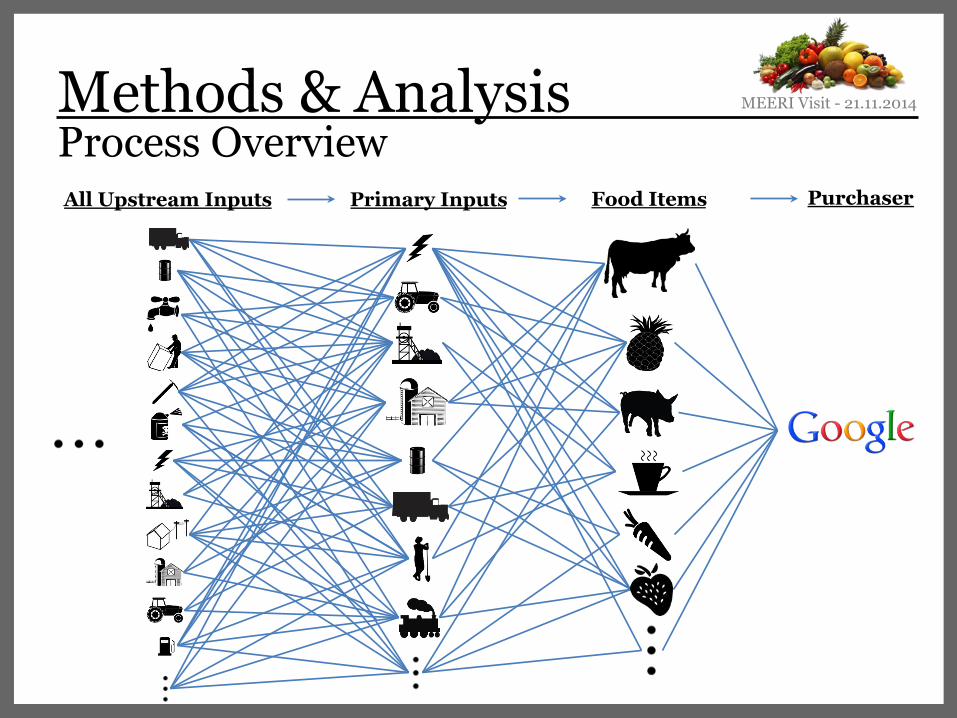
Process Overview Food Items Primary Inputs All Upstream Inputs Purchaser
Methods & Analysis MEERI Visit - 21.11.2014!
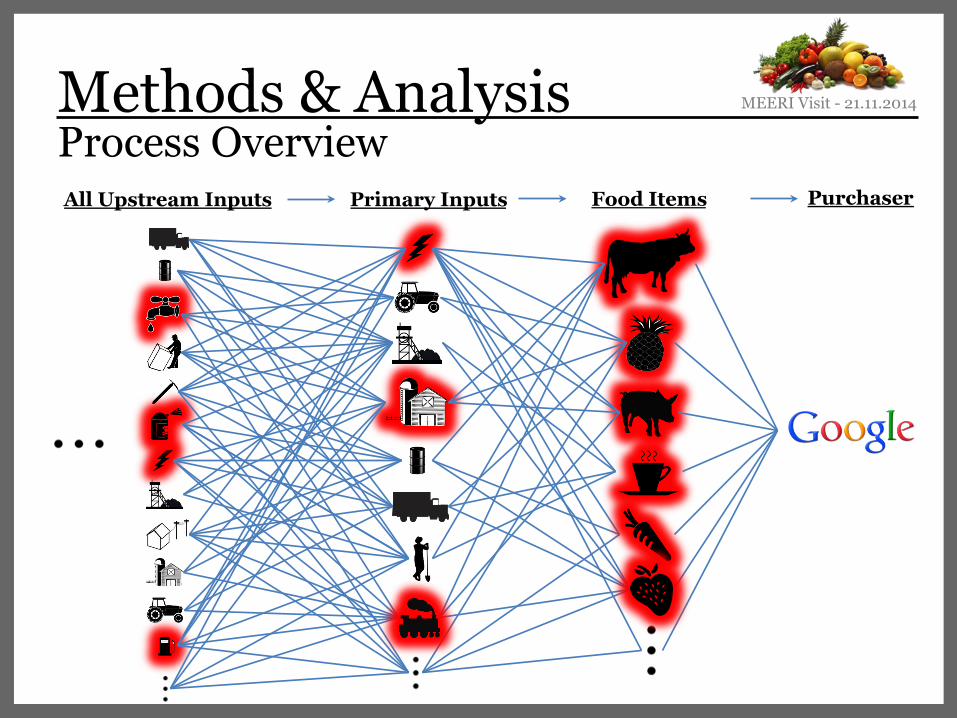
Process Overview Food Items Primary Inputs All Upstream Inputs Purchaser
Methods & Analysis MEERI Visit - 21.11.2014!
Process Overview Food Items Primary Inputs All Upstream Inputs Purchaser
Methods & Analysis MEERI Visit - 21.11.2014!
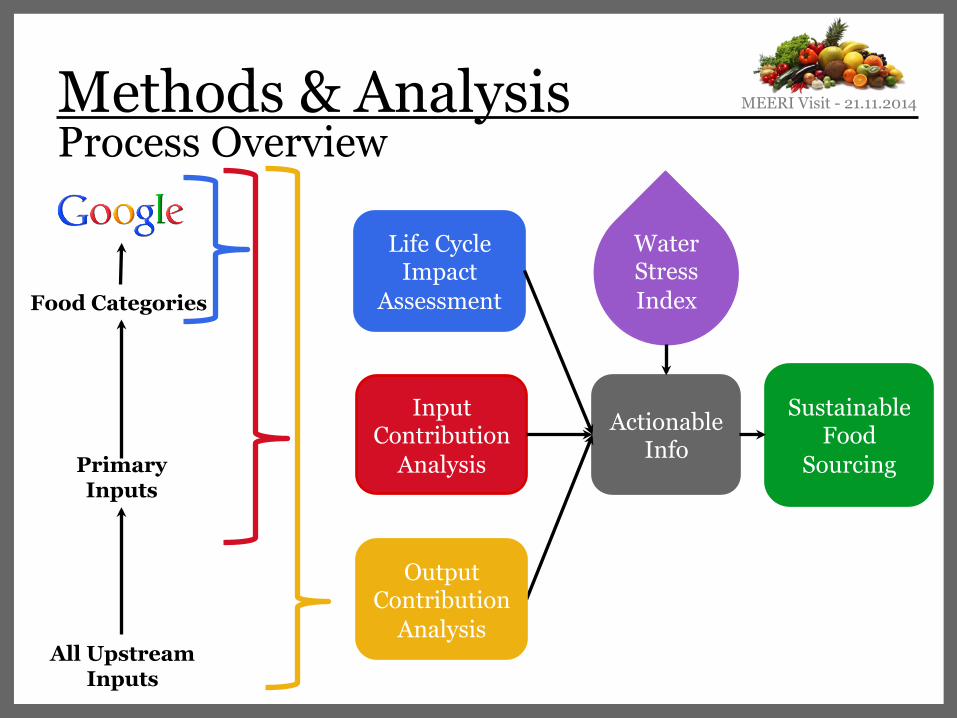
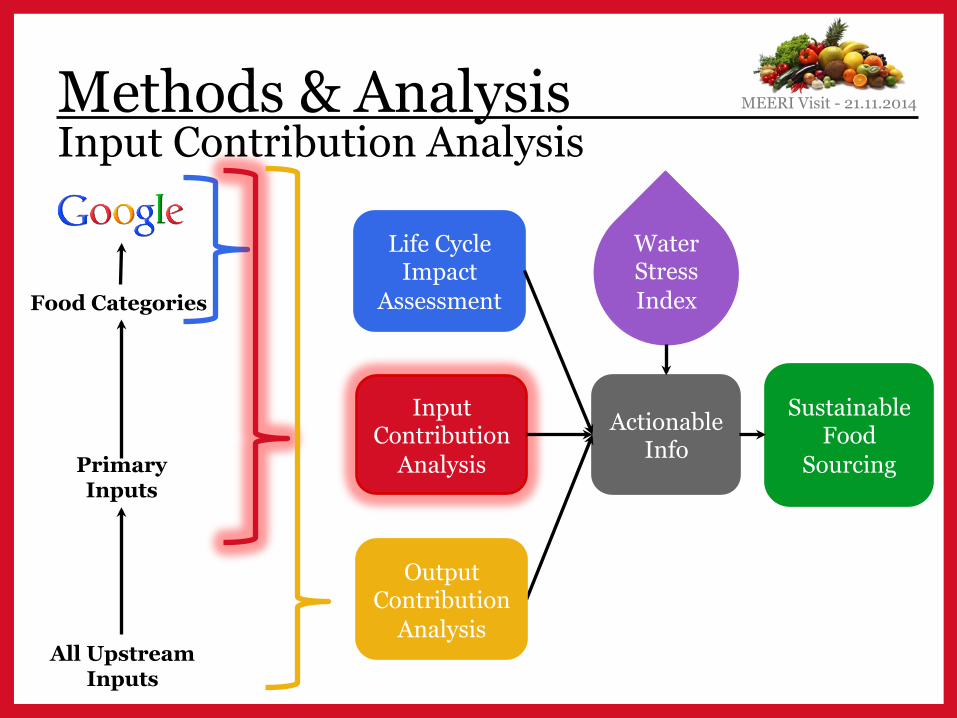
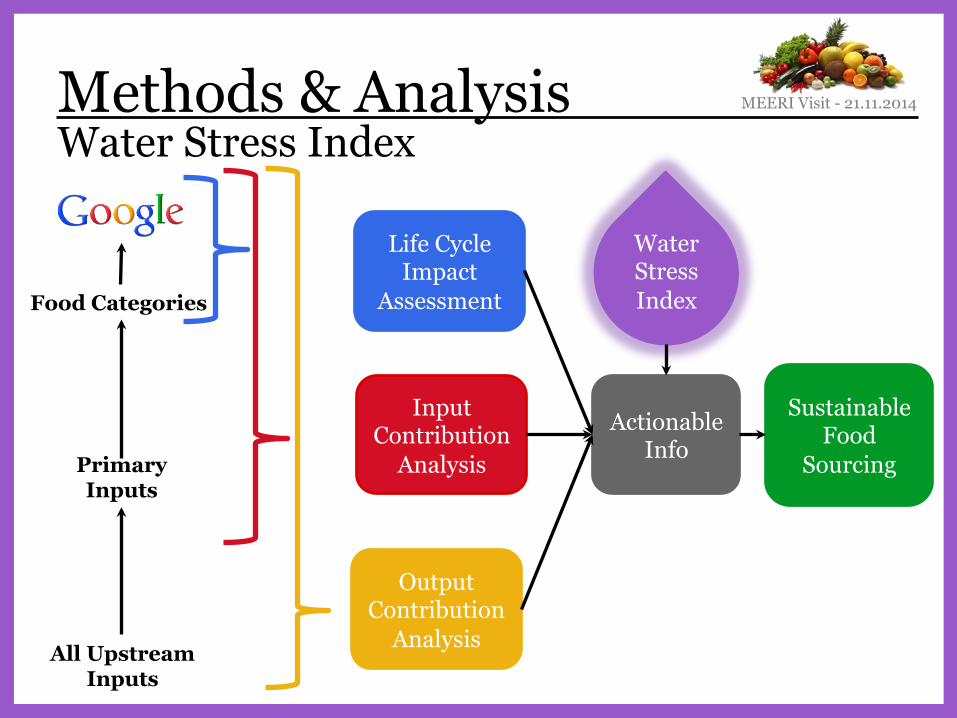
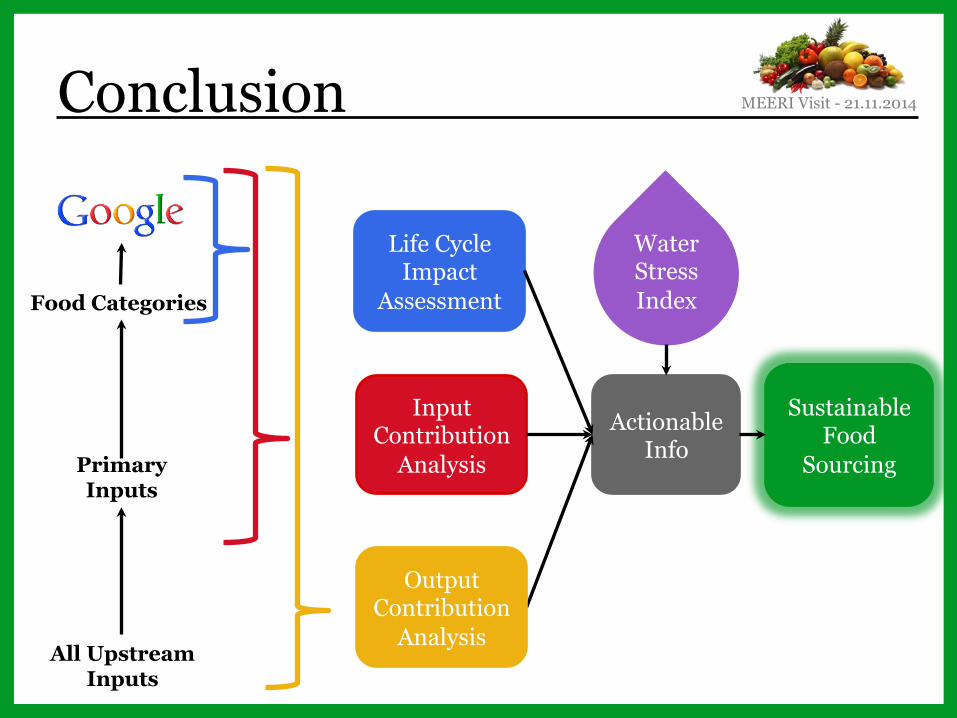
Actionable Info
Food Categories
Primary Inputs
All Upstream Inputs
Life Cycle Impact
Assessment
Input Contribution
Analysis
Sustainable Food
Sourcing
Methods & Analysis Process Overview
Water Stress Index
Output Contribution
Analysis
MEERI Visit - 21.11.2014!
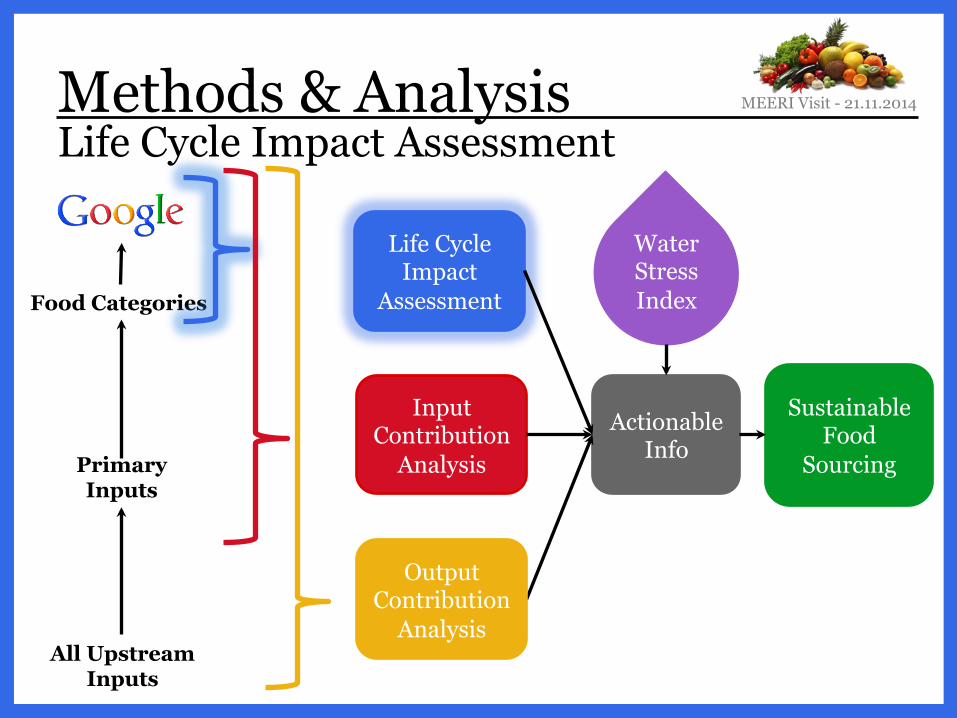
Actionable Info
Food Categories
Primary Inputs
All Upstream Inputs
Life Cycle Impact
Assessment
Input Contribution
Analysis
Sustainable Food
Sourcing
Methods & Analysis Life Cycle Impact Assessment
Water Stress Index
Output Contribution
Analysis
MEERI Visit - 21.11.2014!
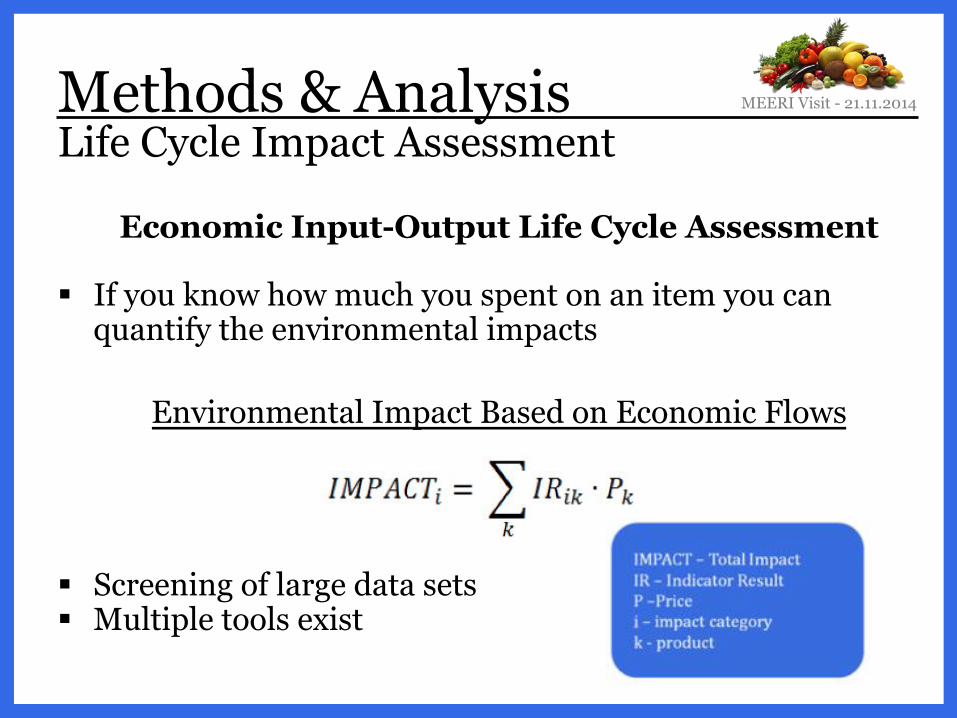
Economic Input-Output Life Cycle Assessment
! If you know how much you spent on an item you can quantify the environmental impacts
Environmental Impact Based on Economic Flows
! Screening of large data sets ! Multiple tools exist !
Methods & Analysis Life Cycle Impact Assessment
MEERI Visit - 21.11.2014!
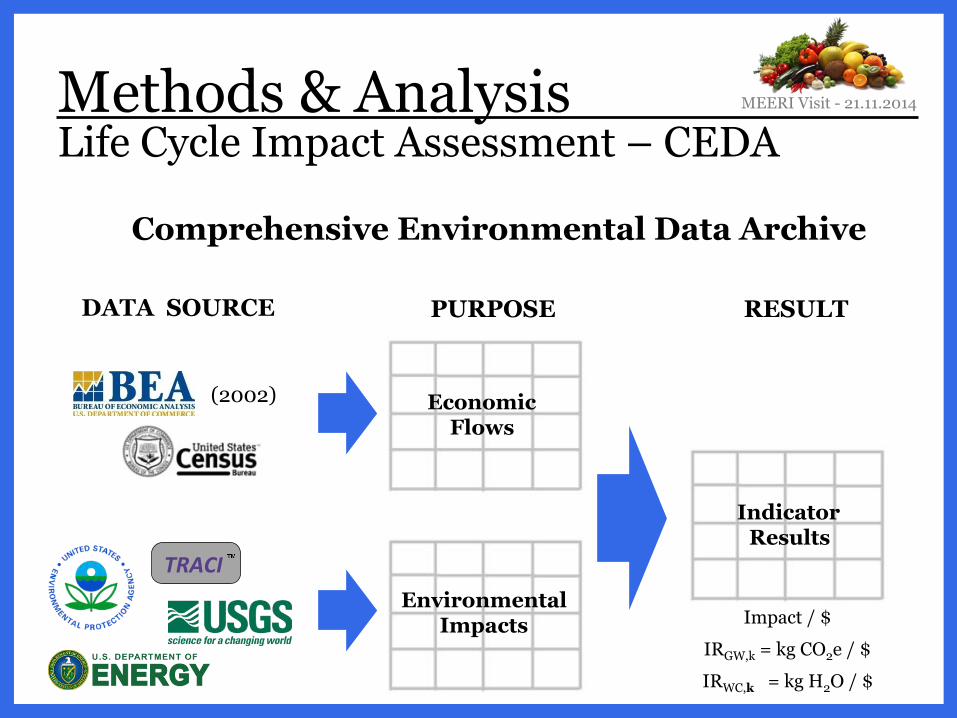
Methods & Analysis Life Cycle Impact Assessment – CEDA
Economic Flows
Environmental Impacts
Indicator Results
Impact / $
IRGW,k = kg CO2e / $
IRWC,k = kg H2O / $
DATA SOURCE PURPOSE RESULT
(2002)
TRACI&
Comprehensive Environmental Data Archive!
MEERI Visit - 21.11.2014!
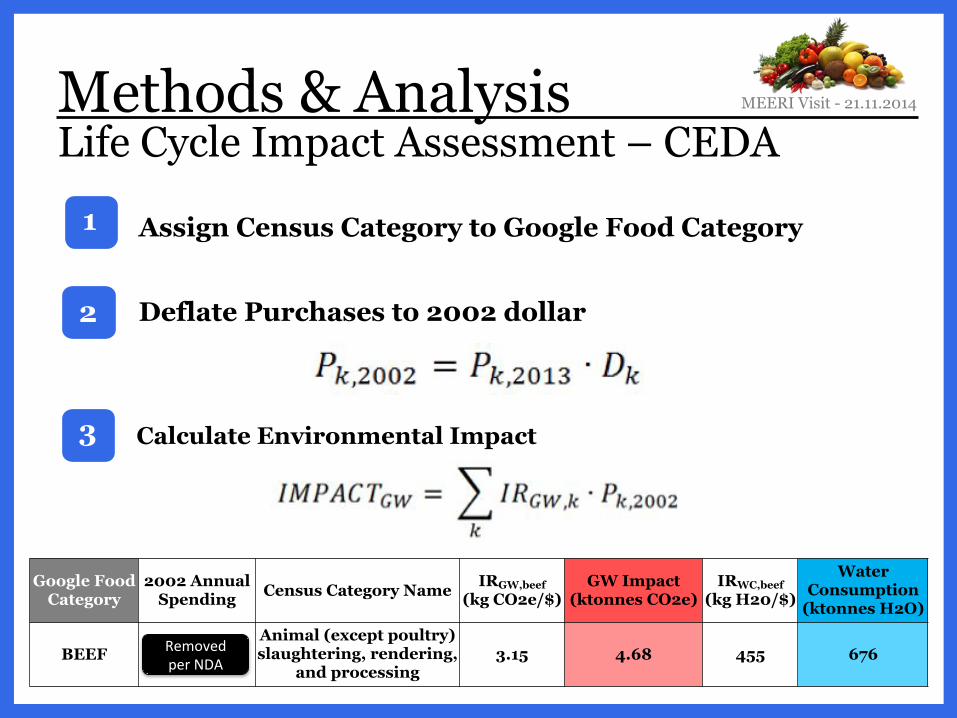
Methods & Analysis Life Cycle Impact Assessment – CEDA !
Assign Census Category to Google Food Category Deflate Purchases to 2002 dollar
Calculate Environmental Impact
1
2
3
Google Food Category
2002 Annual Spending Census Category Name IRGW,beef
(kg CO2e/$) GW Impact
(ktonnes CO2e) IRWC,beef
(kg H20/$)
Water Consumption
(ktonnes H2O)
BEEF Animal (except poultry) slaughtering, rendering,
and processing 3.15 4.68 455 676
MEERI Visit - 21.11.2014!
Removed!per!NDA!
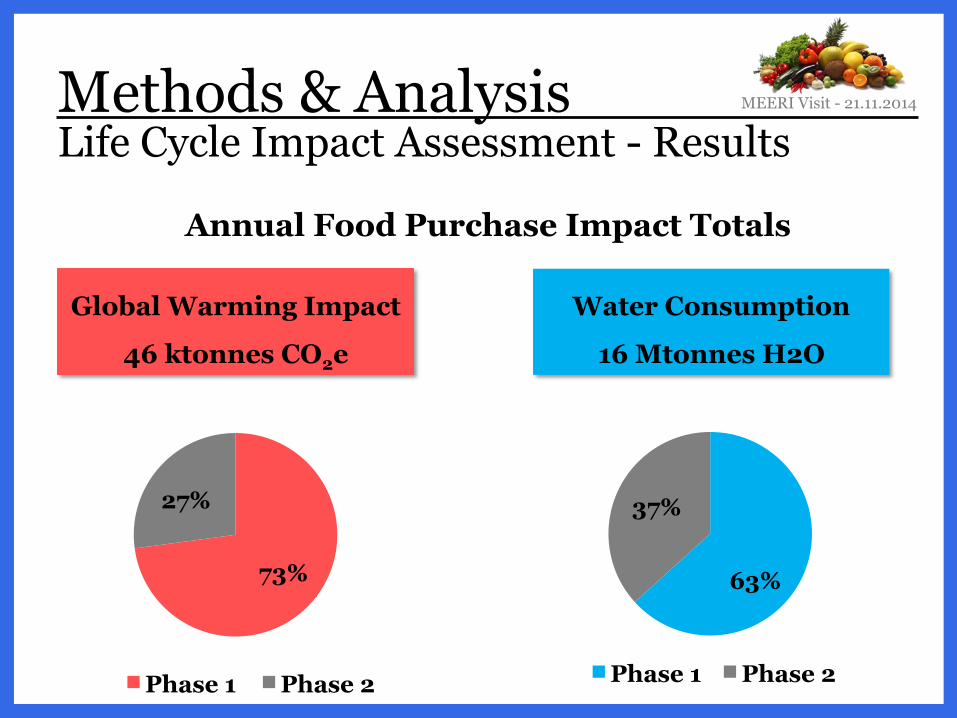
Methods & Analysis Life Cycle Impact Assessment - Results
Global Warming Impact
46 ktonnes CO2e
Water Consumption
16 Mtonnes H2O
Annual Food Purchase Impact Totals
Phase 1 Phase 2
73%
27%
Phase 1 Phase 2
37%
63%
MEERI Visit - 21.11.2014!
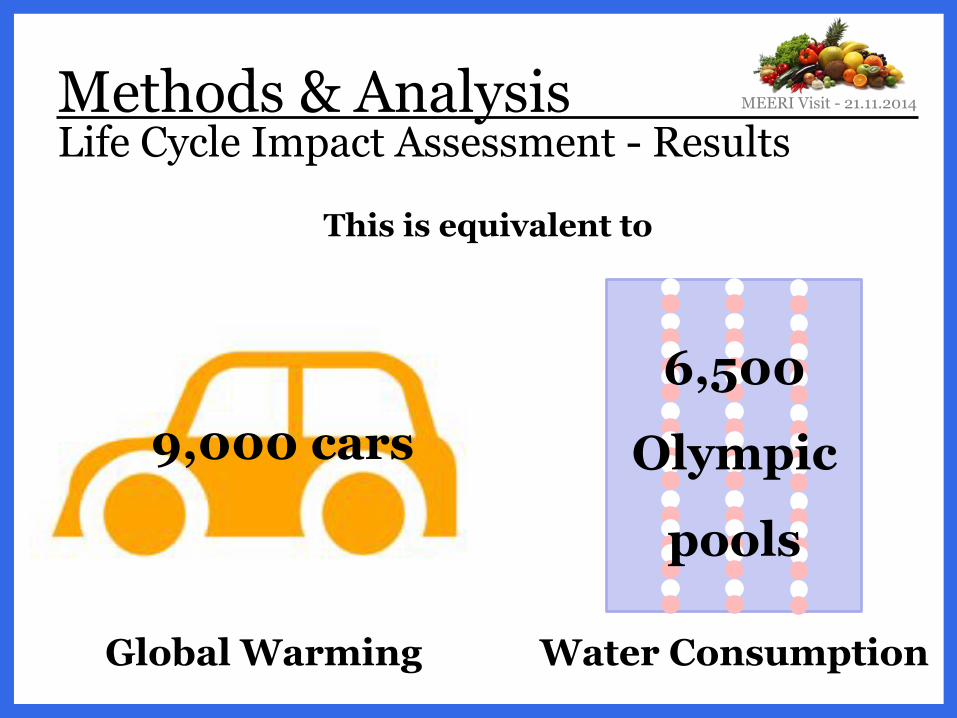
Methods & Analysis Life Cycle Impact Assessment - Results
9,000 cars
This is equivalent to
Global Warming Water Consumption
6,500
Olympic
pools
MEERI Visit - 21.11.2014!
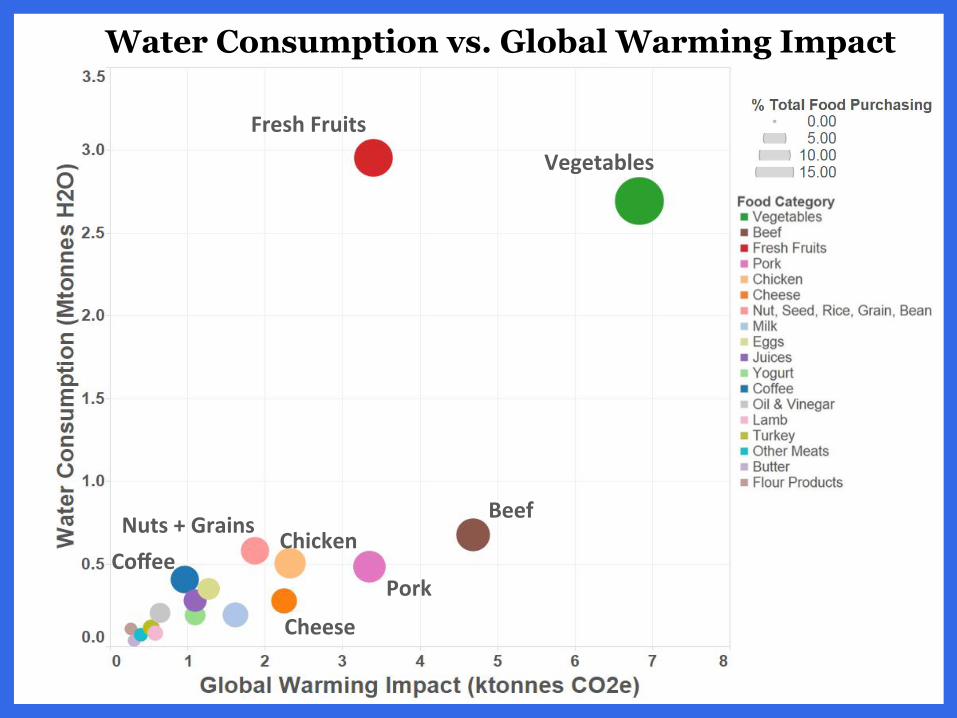
Vegetables)Fresh)Fruits)
Beef)
Pork)
Chicken)
Cheese)
Coffee)Nuts)+)Grains)
Water Consumption vs. Global Warming Impact
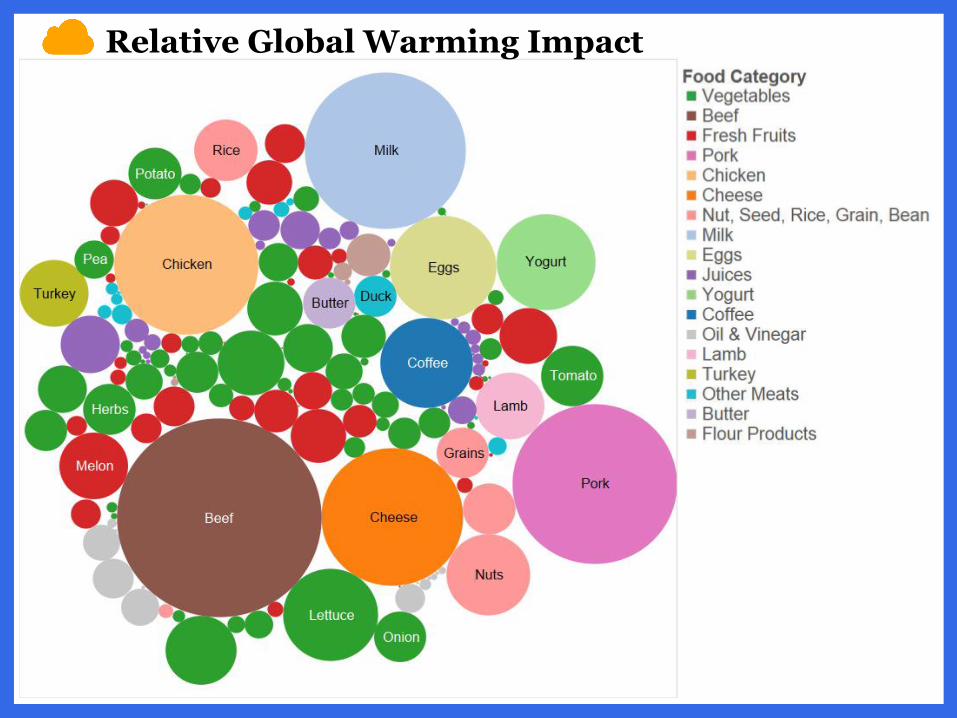
Relative Global Warming Impact
Actionable Info
Food Categories
Primary Inputs
All Upstream Inputs
Life Cycle Impact
Assessment
Input Contribution
Analysis
Sustainable Food
Sourcing
Methods & Analysis Input Contribution Analysis
Water Stress Index
Output Contribution
Analysis
MEERI Visit - 21.11.2014!
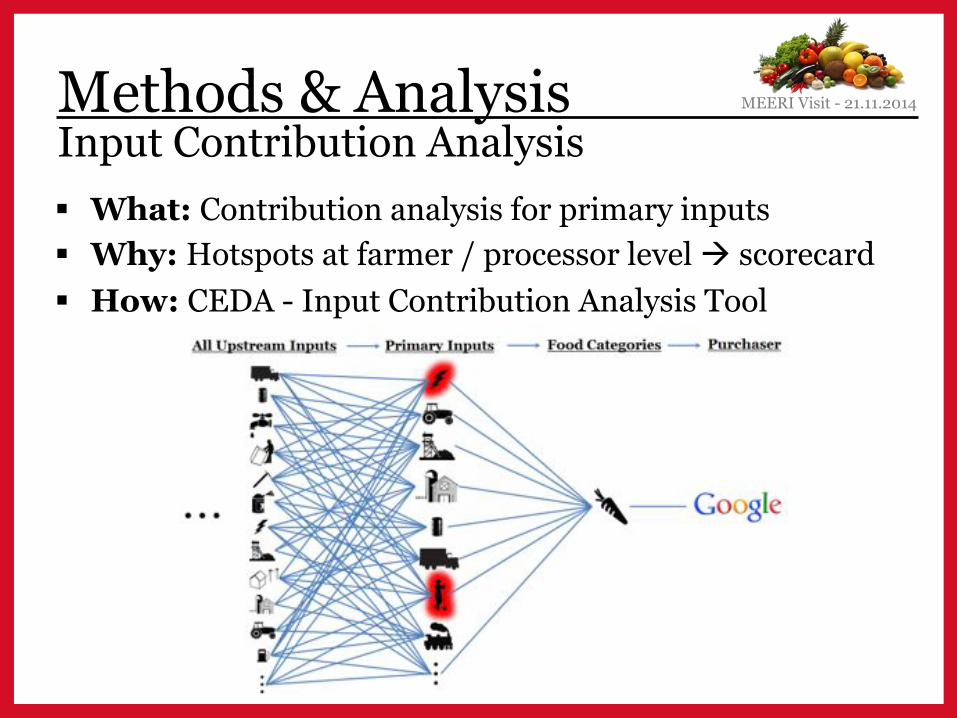
Methods & Analysis Input Contribution Analysis ! What: Contribution analysis for primary inputs ! Why: Hotspots at farmer / processor level " scorecard ! How: CEDA - Input Contribution Analysis Tool
MEERI Visit - 21.11.2014!
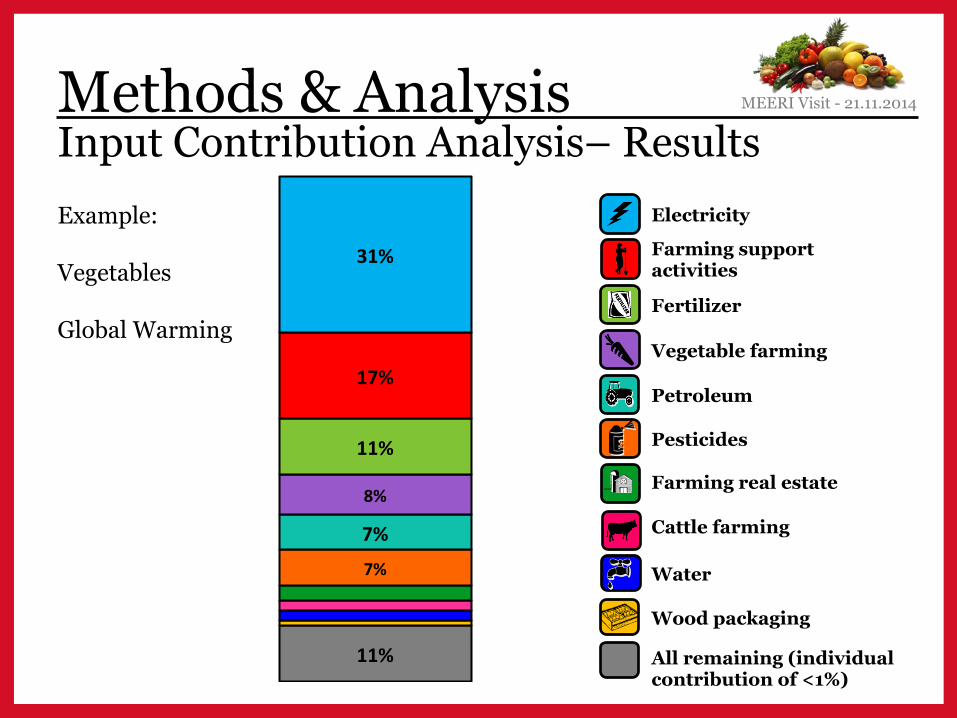
Methods & Analysis Input Contribution Analysis– Results
Petroleum
Fertilizer
Water
Pesticides
Wood packaging
Vegetable farming
Farming real estate
Cattle farming
Electricity
Farming support activities
All remaining (individual contribution of <1%)
11%)
7%)
7%)
8%)
11%)
17%)
31%)
Example: Vegetables Global Warming
MEERI Visit - 21.11.2014!

Actionable Info
Food Categories
Primary Inputs
All Upstream Inputs
Life Cycle Impact
Assessment
Input Contribution
Analysis
Sustainable Food
Sourcing
Methods & Analysis Output Contribution Analysis
Water Stress Index
Output Contribution
Analysis
MEERI Visit - 21.11.2014!
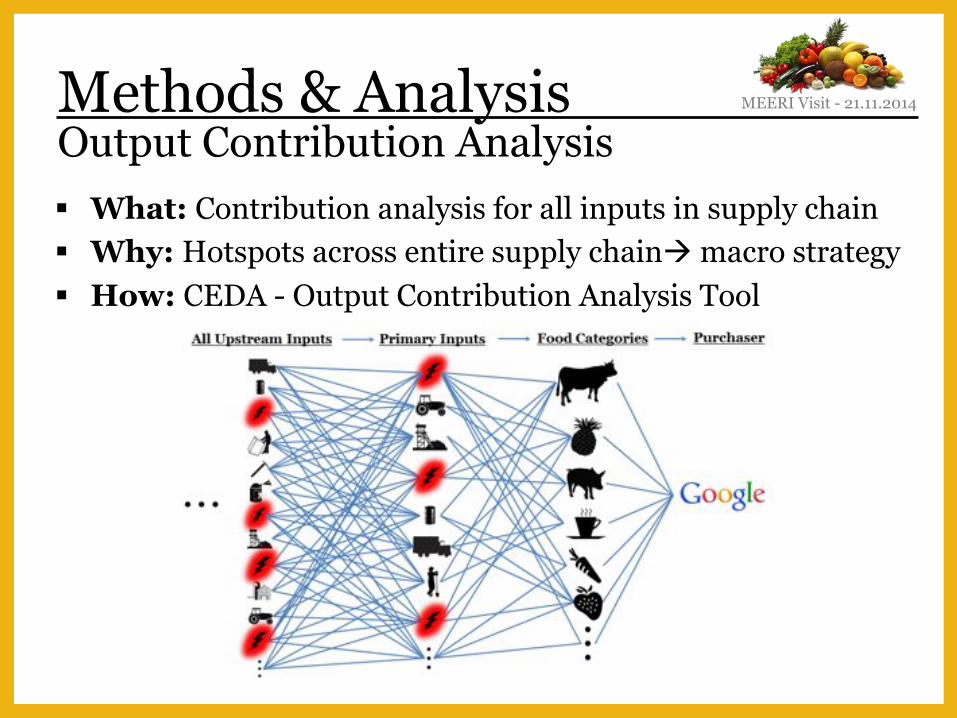
Methods & Analysis Output Contribution Analysis ! What: Contribution analysis for all inputs in supply chain ! Why: Hotspots across entire supply chain" macro strategy ! How: CEDA - Output Contribution Analysis Tool
MEERI Visit - 21.11.2014!
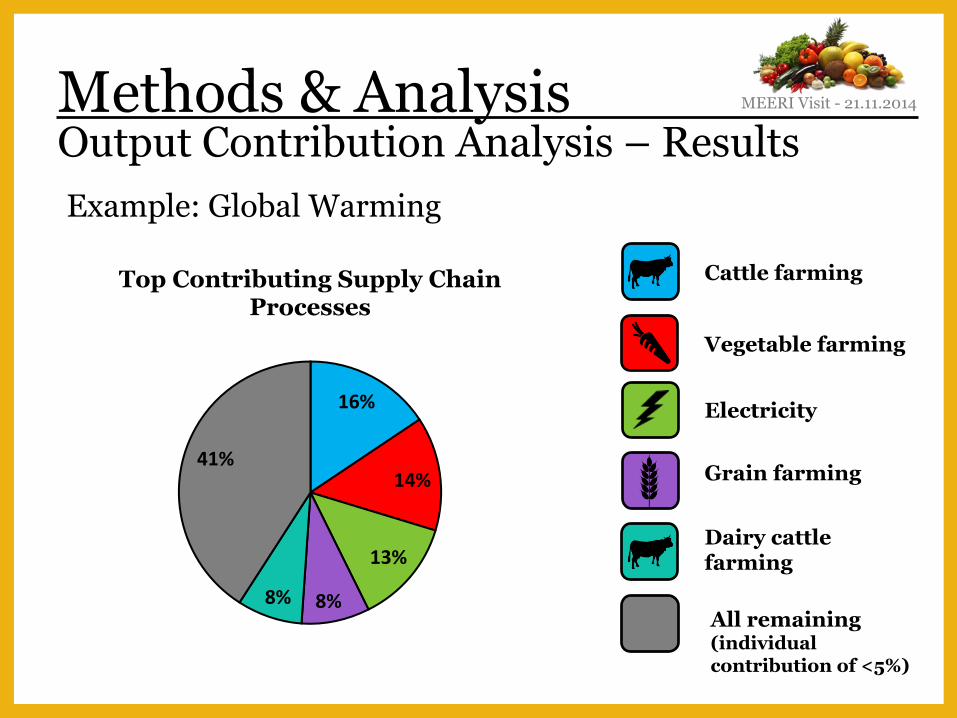
Example: Global Warming
Methods & Analysis Output Contribution Analysis – Results
Electricity
Cattle farming
Vegetable farming
Dairy cattle farming
Grain farming
All remaining (individual contribution of <5%)
16%)
14%)
13%)
8%)8%)
41%)
Top Contributing Supply Chain Processes
MEERI Visit - 21.11.2014!
Actionable Info
Food Categories
Primary Inputs
All Upstream Inputs
Life Cycle Impact
Assessment
Input Contribution
Analysis
Output Contribution
Analysis
Sustainable Food
Sourcing
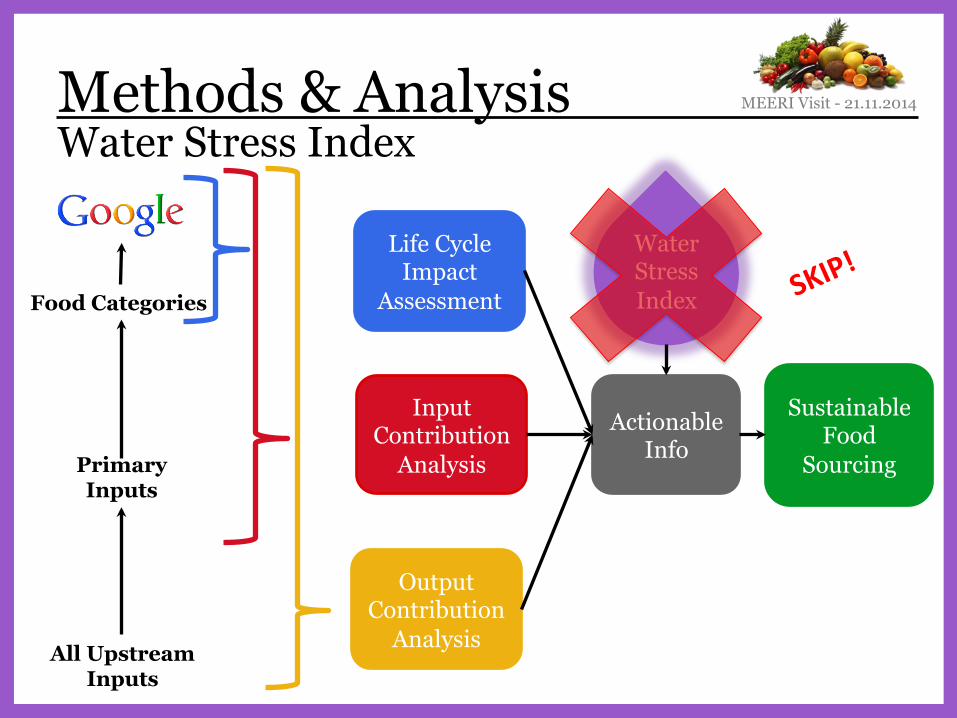
Methods & Analysis Water Stress Index
Water Stress Index
MEERI Visit - 21.11.2014!
Actionable Info
Food Categories
Primary Inputs
All Upstream Inputs
Life Cycle Impact
Assessment
Input Contribution
Analysis
Output Contribution
Analysis
Sustainable Food
Sourcing
Methods & Analysis Water Stress Index
Water Stress Index
MEERI Visit - 21.11.2014!
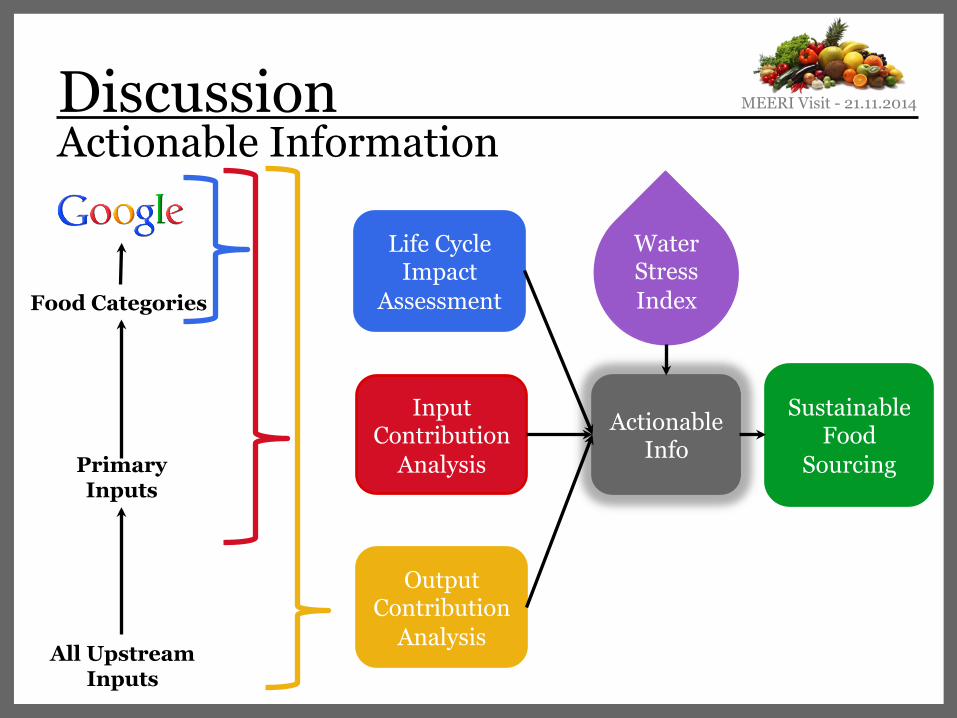
Actionable Info
Food Categories
Primary Inputs
All Upstream Inputs
Life Cycle Impact
Assessment
Input Contribution
Analysis
Output Contribution
Analysis
Sustainable Food
Sourcing
Discussion Actionable Information
Water Stress Index
MEERI Visit - 21.11.2014!
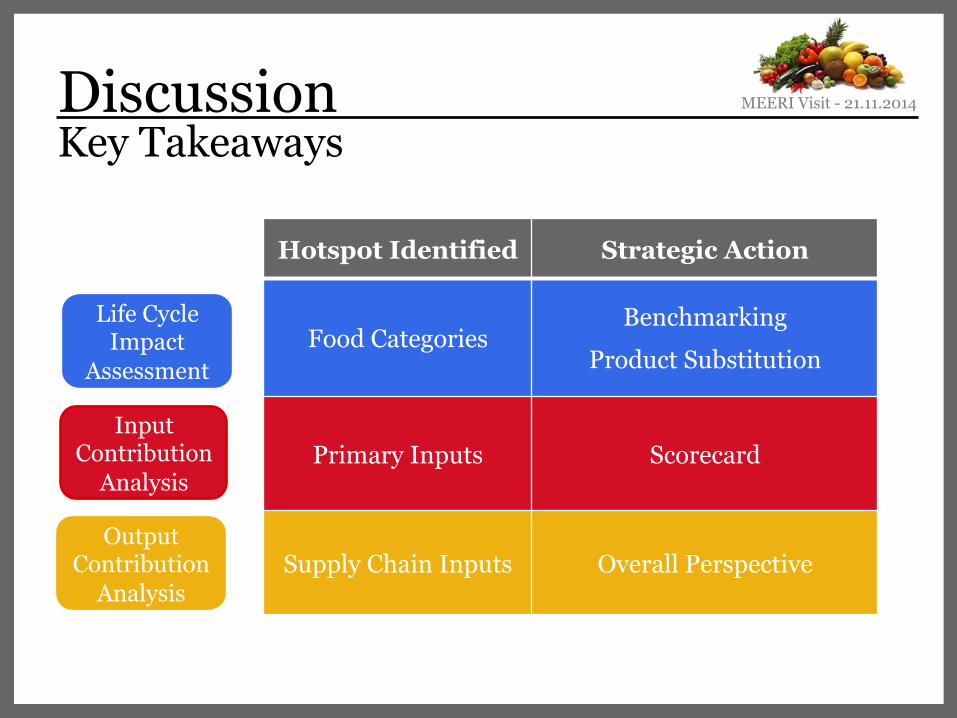
Discussion Key Takeaways
Hotspot Identified Strategic Action
Food Categories Benchmarking
Product Substitution
Primary Inputs Scorecard
Supply Chain Inputs Overall Perspective
Life Cycle Impact
Assessment
Input Contribution
Analysis
Output Contribution
Analysis
MEERI Visit - 21.11.2014!
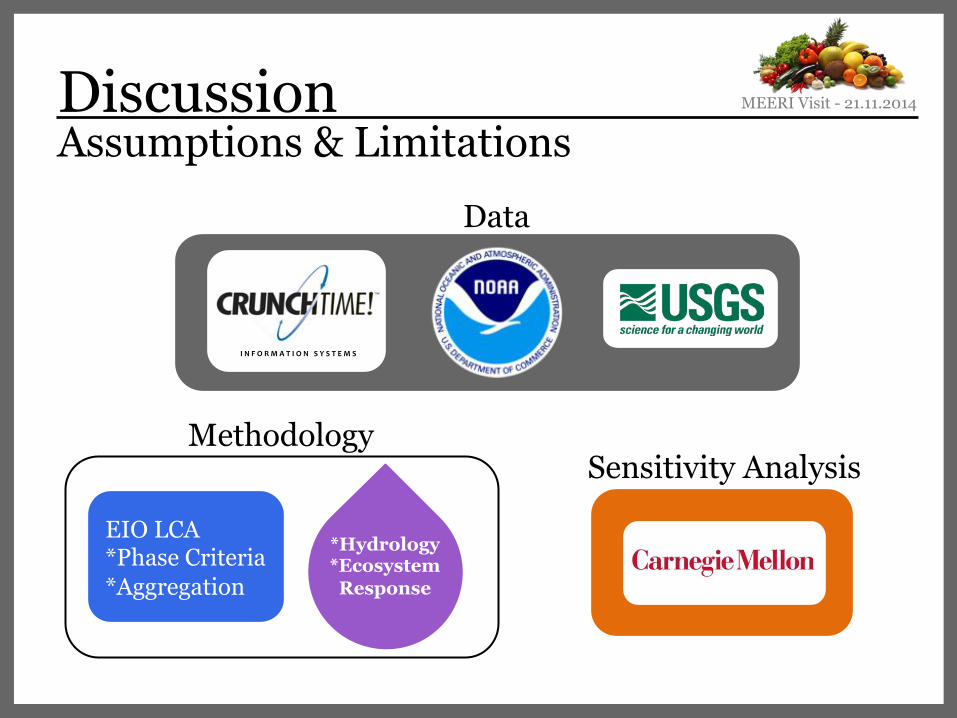
Discussion Assumptions & Limitations
Methodology Sensitivity Analysis
EIO LCA *Phase Criteria *Aggregation
Data
I"N"F"O"R"M"A"T"I"O"N"""S"Y"S"T"E"M"S"
*Hydrology *Ecosystem Response
MEERI Visit - 21.11.2014!
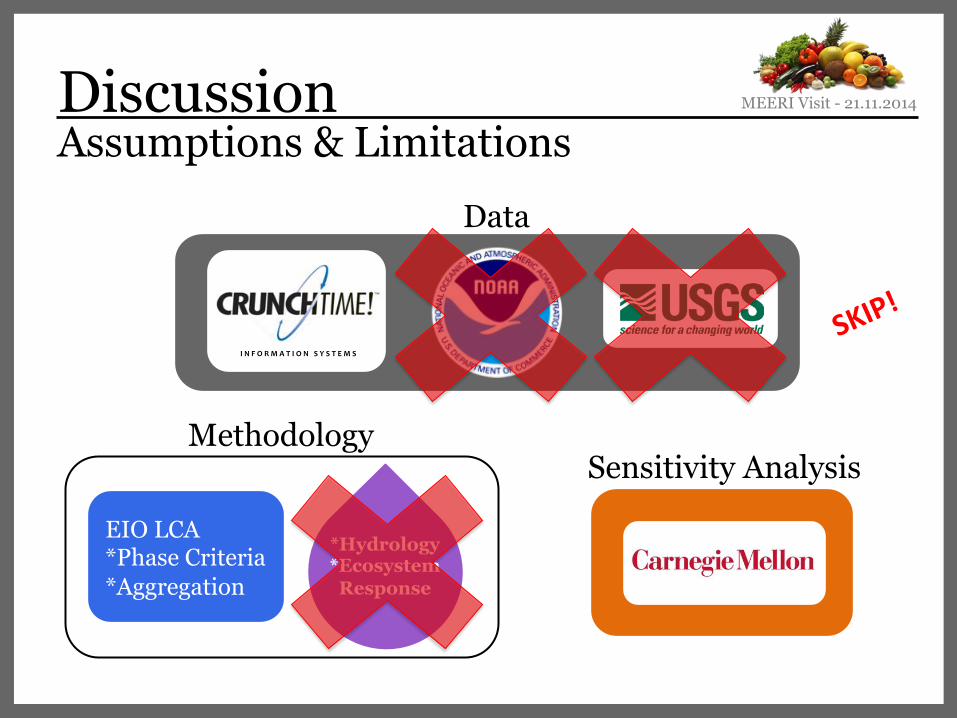
Discussion Assumptions & Limitations
Methodology Sensitivity Analysis
EIO LCA *Phase Criteria *Aggregation
Data
I"N"F"O"R"M"A"T"I"O"N"""S"Y"S"T"E"M"S"
*Hydrology *Ecosystem Response
MEERI Visit - 21.11.2014!
Actionable Info
Food Categories
Primary Inputs
All Upstream Inputs
Life Cycle Impact
Assessment
Input Contribution
Analysis
Sustainable Food
Sourcing
Water Stress Index
Conclusion
Output Contribution
Analysis
MEERI Visit - 21.11.2014!
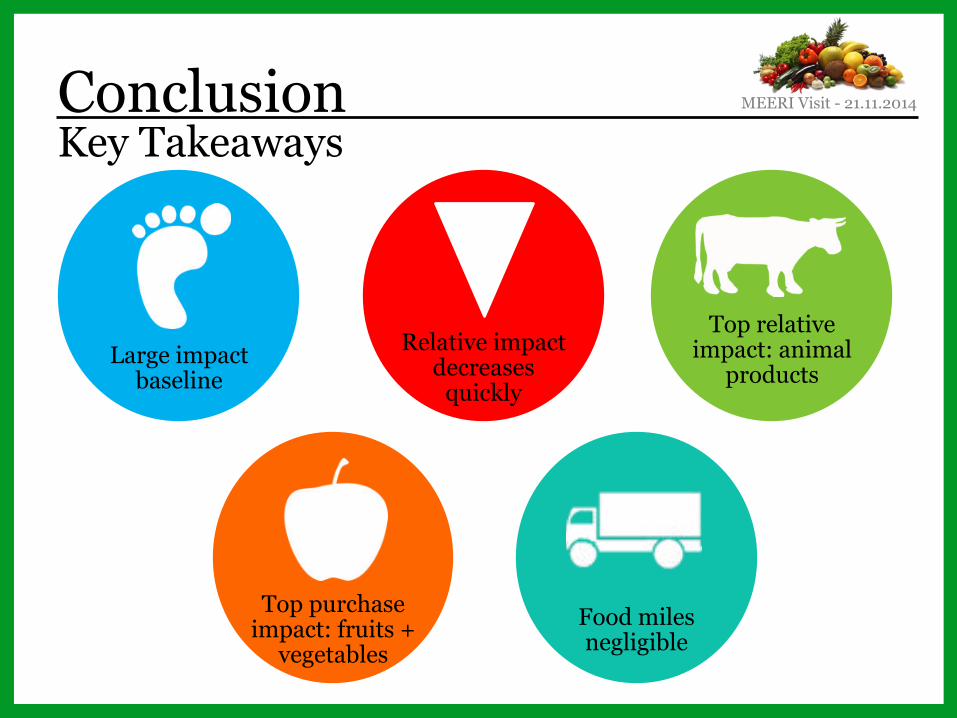
Food miles negligible
Top purchase impact: fruits +
vegetables
Key Takeaways
Large impact baseline
Relative impact decreases
quickly
Top relative impact: animal
products
Conclusion MEERI Visit - 21.11.2014!
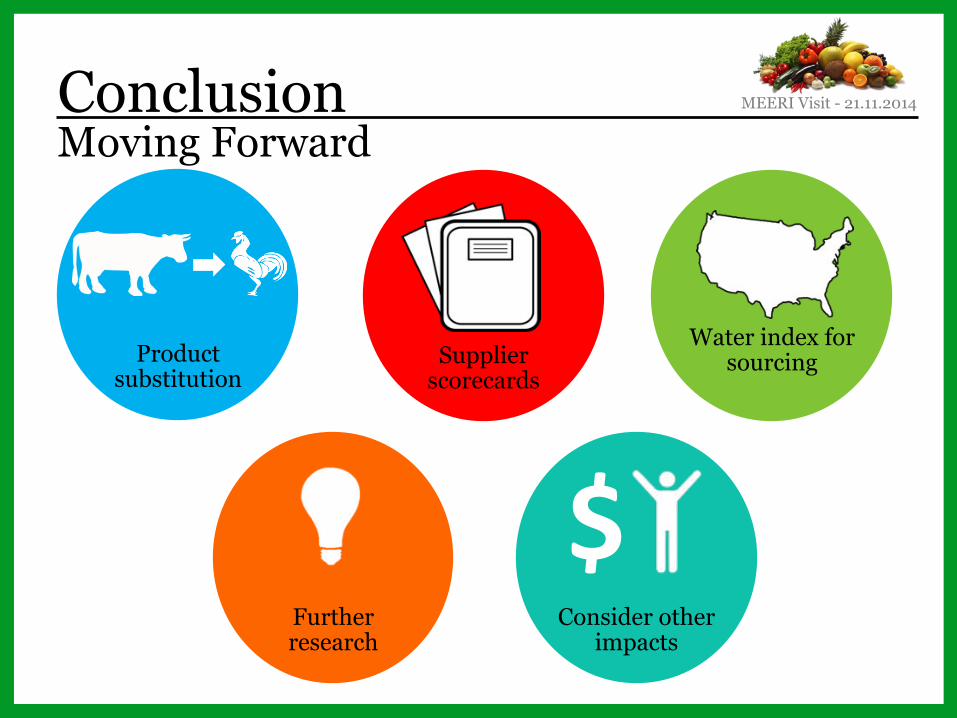
Product substitution
Further research
Moving Forward
Supplier scorecards
Water index for sourcing
Consider other impacts
$)
Conclusion MEERI Visit - 21.11.2014!
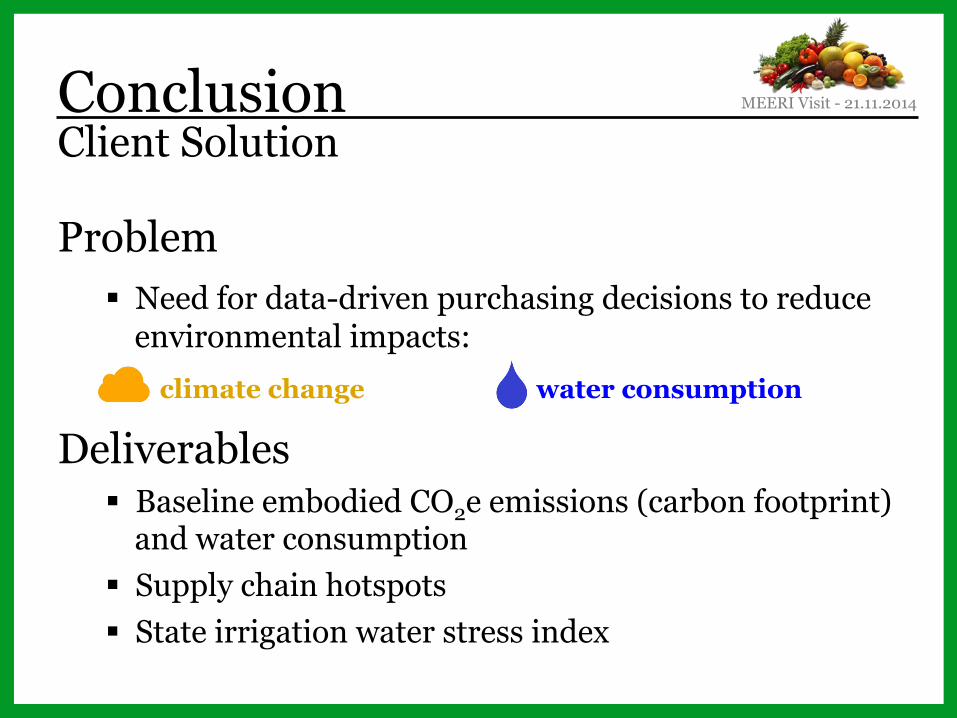
Client Solution Conclusion
Problem ! Need for data-driven purchasing decisions to reduce
environmental impacts: climate change water consumption
Deliverables ! Baseline embodied CO2e emissions (carbon footprint)
and water consumption ! Supply chain hotspots ! State irrigation water stress index
MEERI Visit - 21.11.2014!
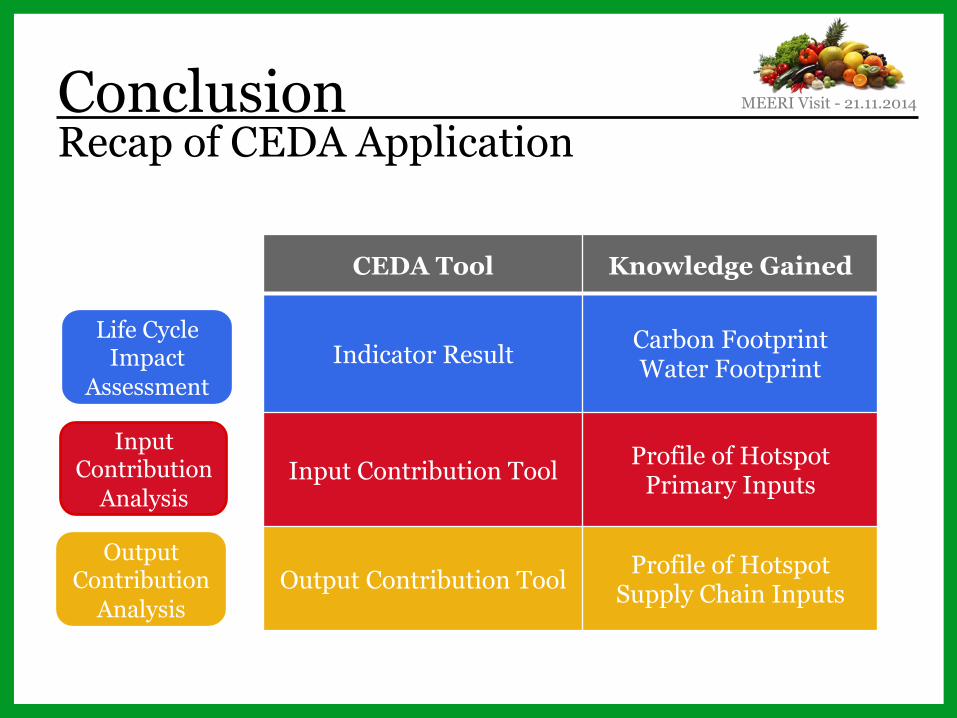
Recap of CEDA Application Conclusion MEERI Visit - 21.11.2014!
CEDA Tool Knowledge Gained
Indicator Result Carbon Footprint Water Footprint
Input Contribution Tool Profile of Hotspot Primary Inputs
Output Contribution Tool Profile of Hotspot Supply Chain Inputs
Life Cycle Impact
Assessment
Input Contribution
Analysis
Output Contribution
Analysis
Special Thanks Conclusion
! Sangwon Suh, PhD ! David Tilman, PhD ! Gary Libecap, PhD ! Yi Yang, PhD(c) ! Shivira Tomar, MESM ! Eric Edwards, PhD(c) ! Aubrey Dugger, PhD(c) ! Stephan Pfister, PhD
Google ! David Bennett ! Victoria Ho
Bon Appetit ! Helene York ! Charlie Liao ! Joe Dominguez
MEERI Visit - 21.11.2014!
Thank you!
Questions?
MEERI Visit - 21.11.2014!
Link to “Data Driven Sustainable Food Purchasing” Full Report
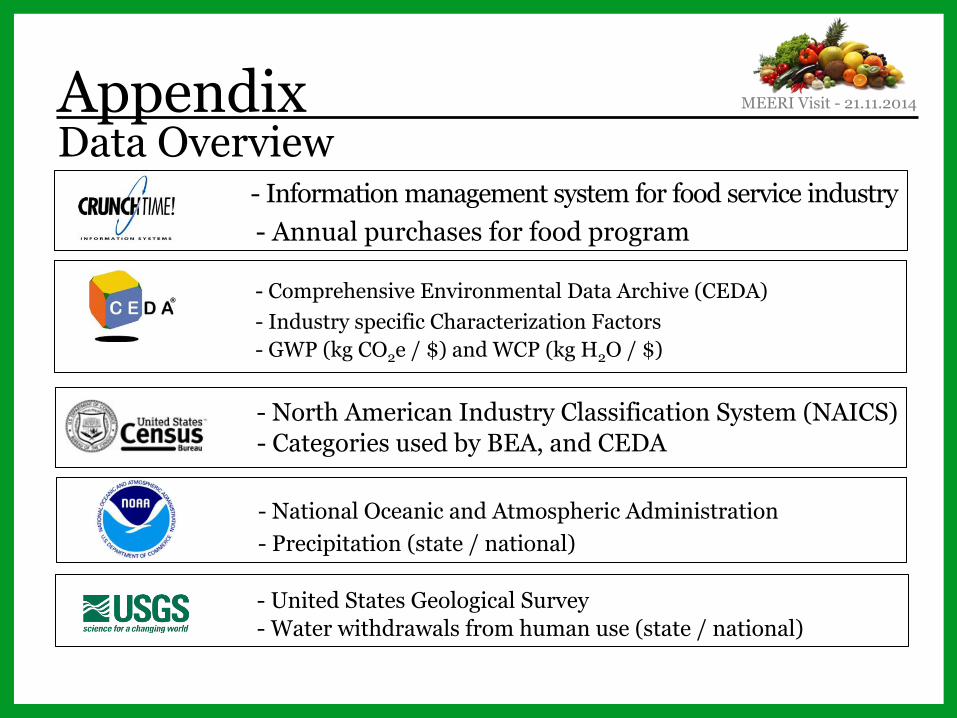
Appendix Data Overview
- Information management system for food service industry - Annual purchases for food program
- Comprehensive Environmental Data Archive (CEDA) - Industry specific Characterization Factors - GWP (kg CO2e / $) and WCP (kg H2O / $)
- North American Industry Classification System (NAICS) - Categories used by BEA, and CEDA
- National Oceanic and Atmospheric Administration - Precipitation (state / national)
- United States Geological Survey - Water withdrawals from human use (state / national)
MEERI Visit - 21.11.2014!
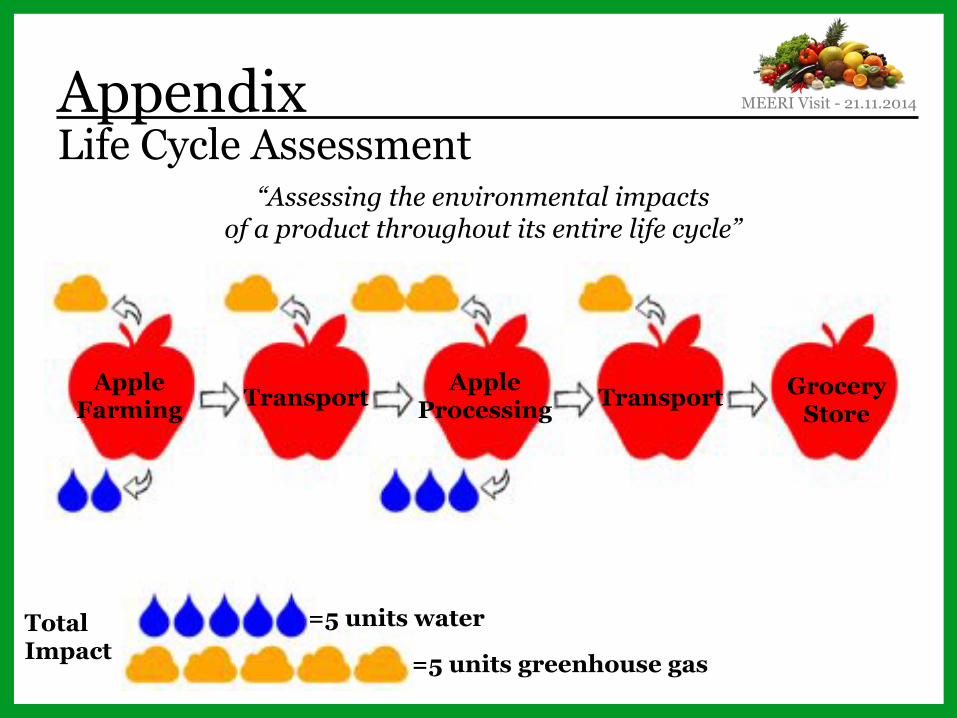
Apple Farming Transport Apple
Processing Transport Grocery Store
Life Cycle Assessment
Total Impact
=5 units water
=5 units greenhouse gas
“Assessing the environmental impacts of a product throughout its entire life cycle”
Appendix MEERI Visit - 21.11.2014!
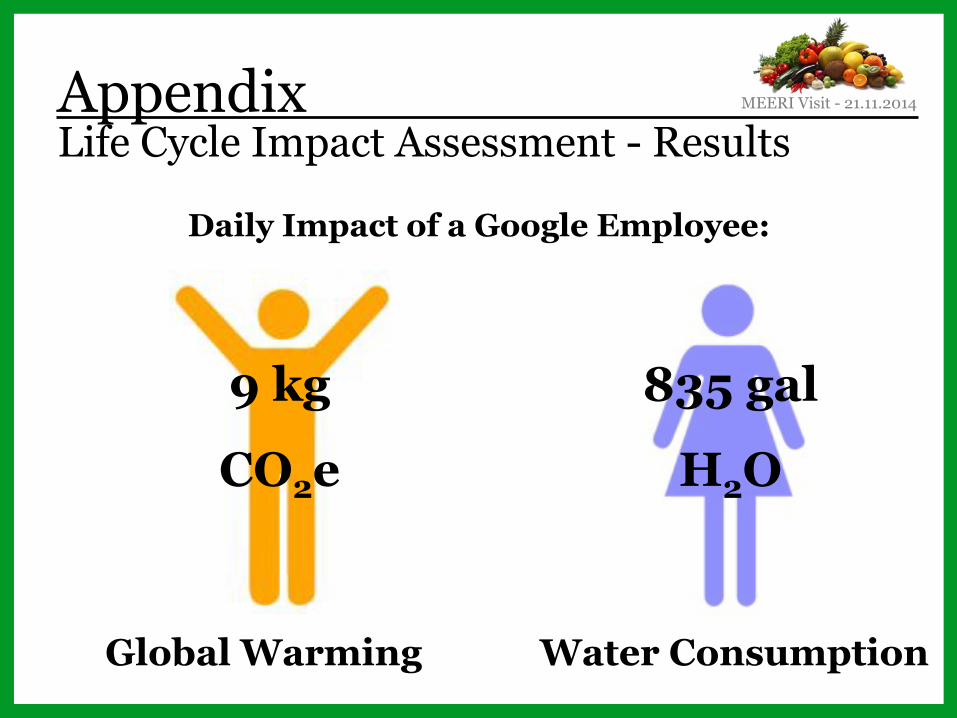
Appendix Life Cycle Impact Assessment - Results
Daily Impact of a Google Employee:
Global Warming Water Consumption
835 gal
H2O
9 kg
CO2e
MEERI Visit - 21.11.2014!
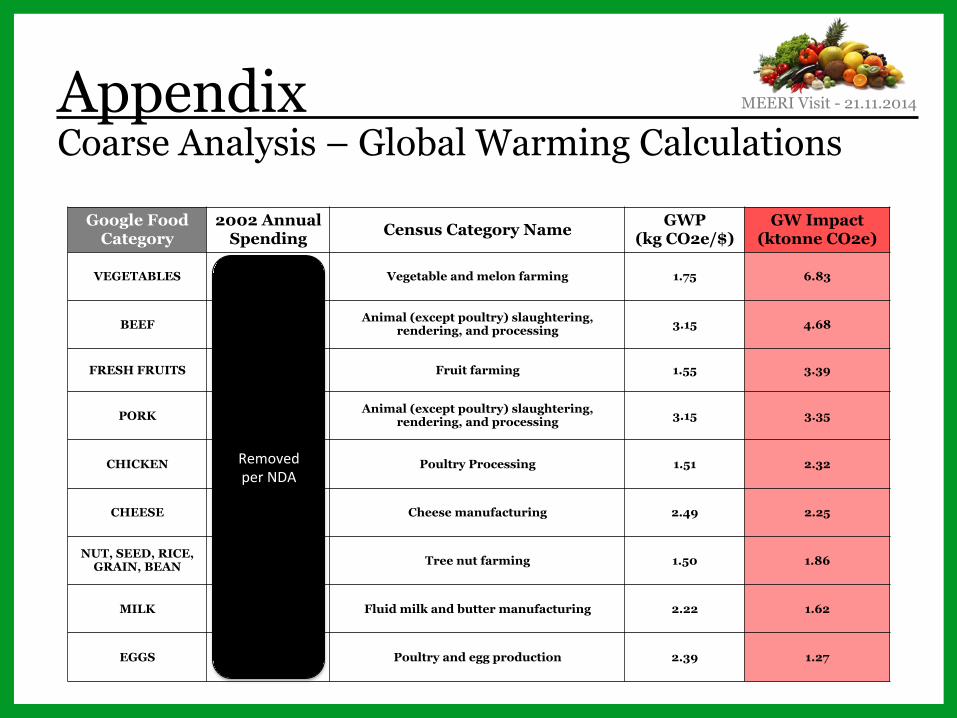
Appendix
Google Food Category
2002 Annual Spending Census Category Name GWP
(kg CO2e/$) GW Impact
(ktonne CO2e)
VEGETABLES $3,945,382 Vegetable and melon farming 1.75 6.83
BEEF $1,485,709 Animal (except poultry) slaughtering, rendering, and processing 3.15 4.68
FRESH FRUITS $2,138,852 Fruit farming 1.55 3.39
PORK $1,062,846 Animal (except poultry) slaughtering, rendering, and processing 3.15 3.35
CHICKEN $1,541,277 Poultry Processing 1.51 2.32
CHEESE $903,527 Cheese manufacturing 2.49 2.25
NUT, SEED, RICE, GRAIN, BEAN $769,921 Tree nut farming 1.50 1.86
MILK $729,370 Fluid milk and butter manufacturing 2.22 1.62
EGGS $532,869 Poultry and egg production 2.39 1.27
Coarse Analysis – Global Warming Calculations
Removed!per!NDA!
MEERI Visit - 21.11.2014!
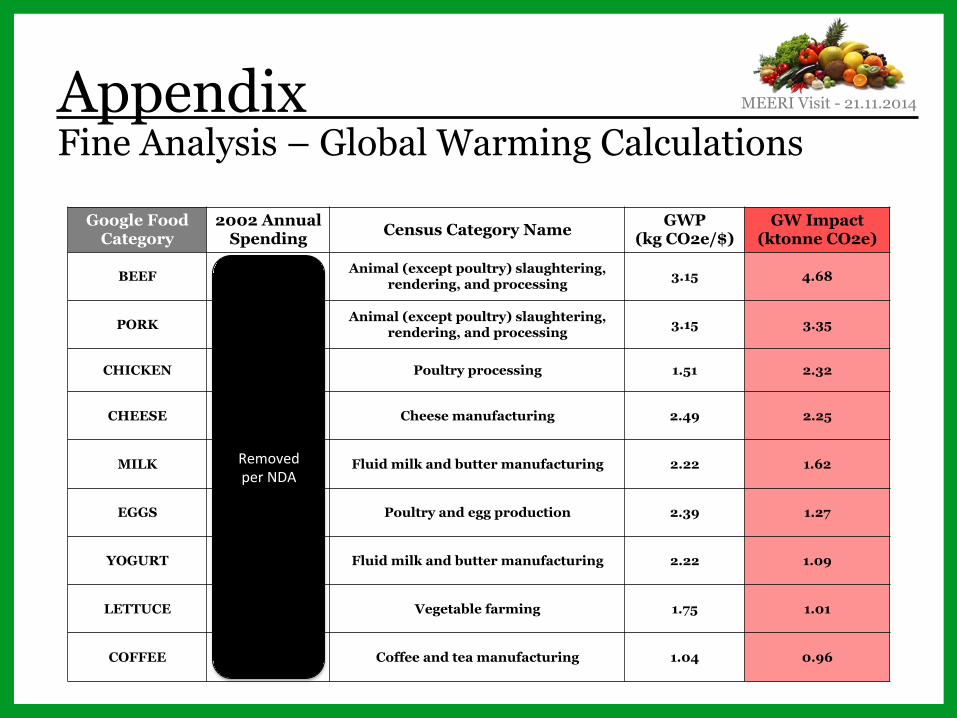
Appendix Fine Analysis – Global Warming Calculations
Google Food Category
2002 Annual Spending Census Category Name GWP
(kg CO2e/$) GW Impact
(ktonne CO2e)
BEEF $1,485,709 Animal (except poultry) slaughtering, rendering, and processing 3.15 4.68
PORK $1,062,846 Animal (except poultry) slaughtering, rendering, and processing 3.15 3.35
CHICKEN $1,541,277 Poultry processing 1.51 2.32
CHEESE $903,527 Cheese manufacturing 2.49 2.25
MILK $729,370 Fluid milk and butter manufacturing 2.22 1.62
EGGS $532,370 Poultry and egg production 2.39 1.27
YOGURT $123,117 Fluid milk and butter manufacturing 2.22 1.09
LETTUCE $143,742 Vegetable farming 1.75 1.01
COFFEE $903,527 Coffee and tea manufacturing 1.04 0.96
Removed!per!NDA!
MEERI Visit - 21.11.2014!
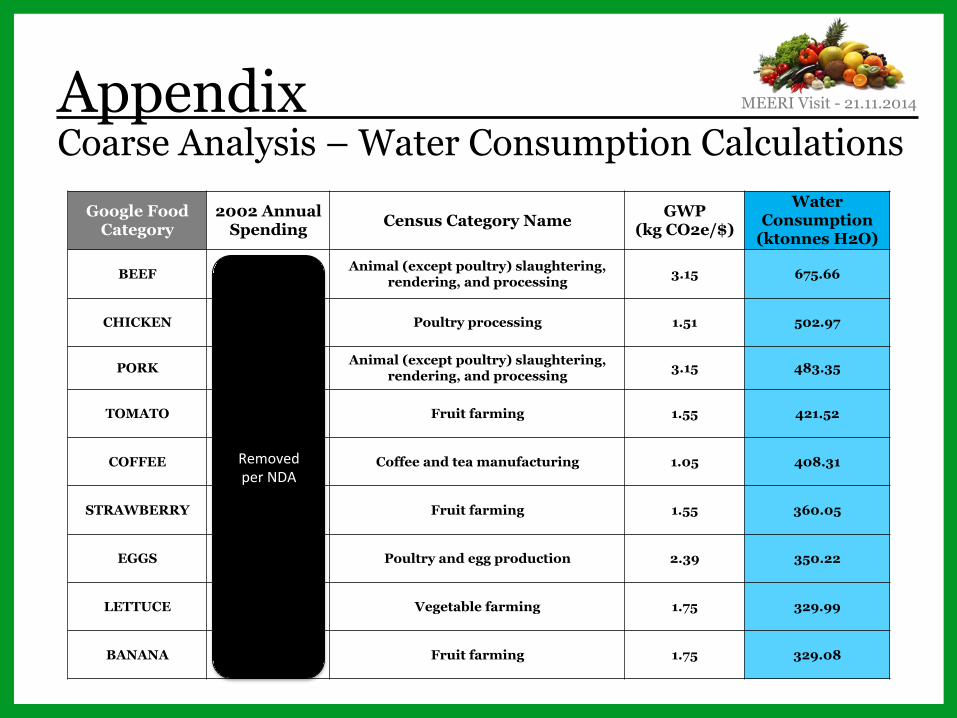
Appendix Coarse Analysis – Water Consumption Calculations
Google Food Category
2002 Annual Spending Census Category Name GWP
(kg CO2e/$)
Water Consumption
(ktonnes H2O)
BEEF $1,485,709 Animal (except poultry) slaughtering, rendering, and processing 3.15 675.66
CHICKEN $1,541,277 Poultry processing 1.51 502.97
PORK $1,062,846 Animal (except poultry) slaughtering, rendering, and processing 3.15 483.35
TOMATO $278,351 Fruit farming 1.55 421.52
COFFEE $915,601 Coffee and tea manufacturing 1.05 408.31
STRAWBERRY $237,761 Fruit farming 1.55 360.05
EGGS $532,370 Poultry and egg production 2.39 350.22
LETTUCE $574,967 Vegetable farming 1.75 329.99
BANANA $217,310 Fruit farming 1.75 329.08
Removed!per!NDA!
MEERI Visit - 21.11.2014!
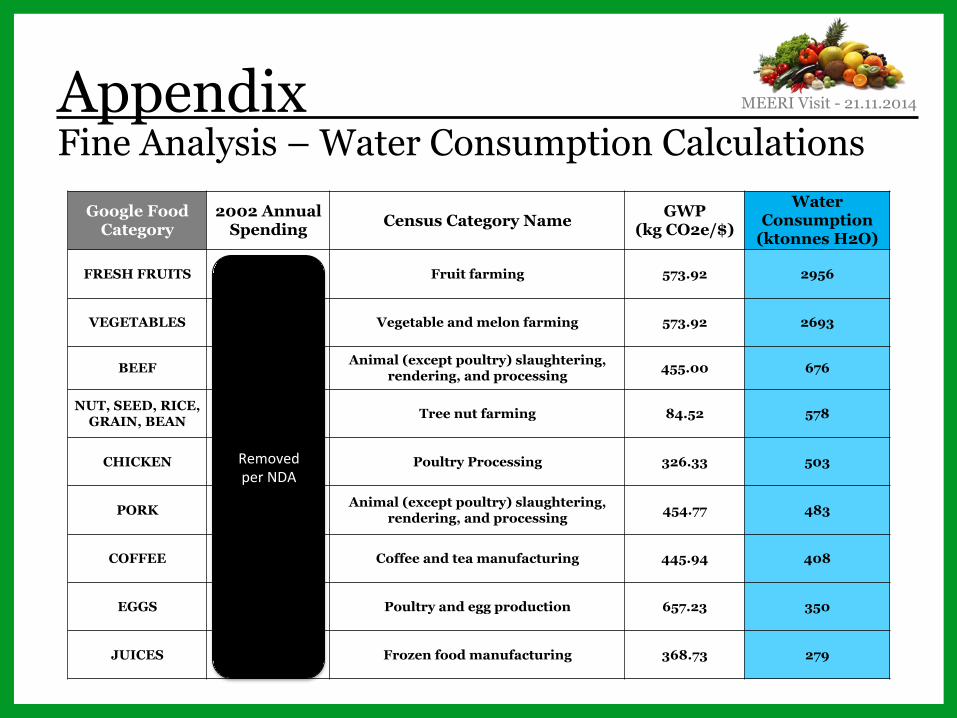
Appendix Fine Analysis – Water Consumption Calculations
Google Food Category
2002 Annual Spending Census Category Name GWP
(kg CO2e/$)
Water Consumption
(ktonnes H2O)
FRESH FRUITS $2,138,852 Fruit farming 573.92 2956
VEGETABLES $3,945,382 Vegetable and melon farming 573.92 2693
BEEF $1,485,709 Animal (except poultry) slaughtering, rendering, and processing 455.00 676
NUT, SEED, RICE, GRAIN, BEAN $769,921 Tree nut farming 84.52 578
CHICKEN $1,541,277 Poultry Processing 326.33 503
PORK $1,062,846 Animal (except poultry) slaughtering, rendering, and processing 454.77 483
COFFEE $903,527 Coffee and tea manufacturing 445.94 408
EGGS $532,869 Poultry and egg production 657.23 350
JUICES $188,915 Frozen food manufacturing 368.73 279
Removed!per!NDA!
MEERI Visit - 21.11.2014!
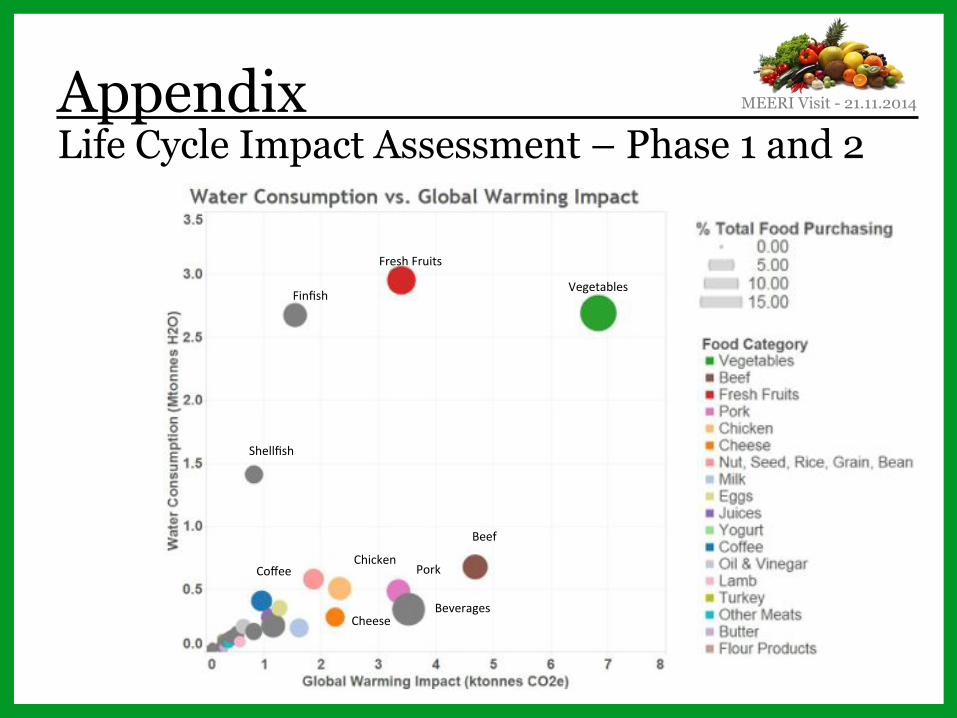
Life Cycle Impact Assessment – Phase 1 and 2
Finfish!
Shellfish!
Vegetables!
Fresh!Fruits!
Beef!
Pork!Chicken!
Cheese!
Coffee!
Beverages!
Appendix MEERI Visit - 21.11.2014!
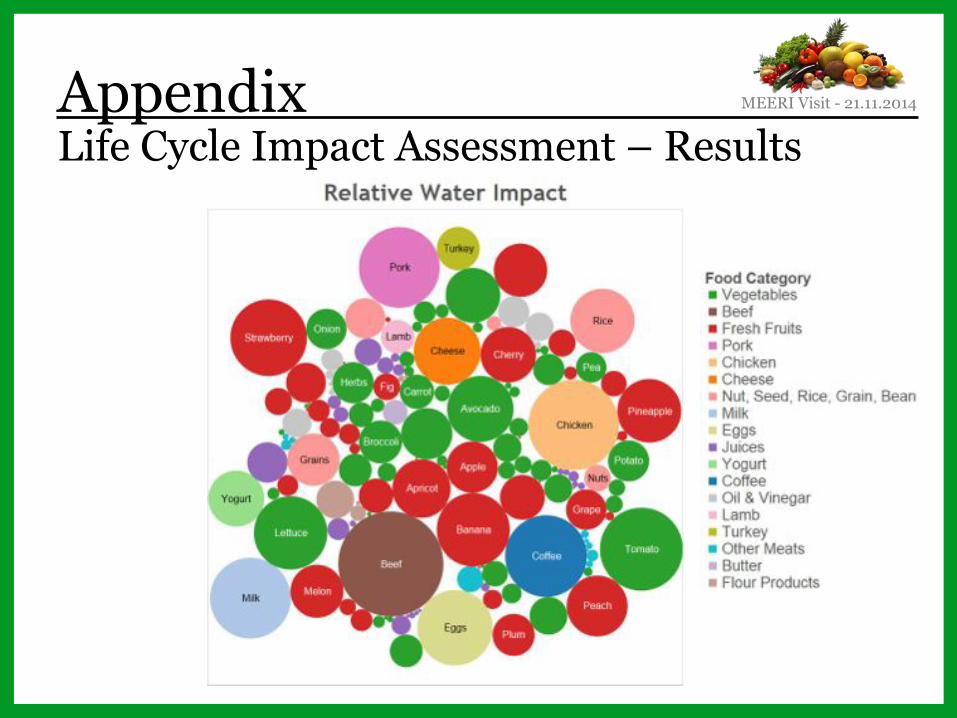
Appendix Life Cycle Impact Assessment – Results
MEERI Visit - 21.11.2014!
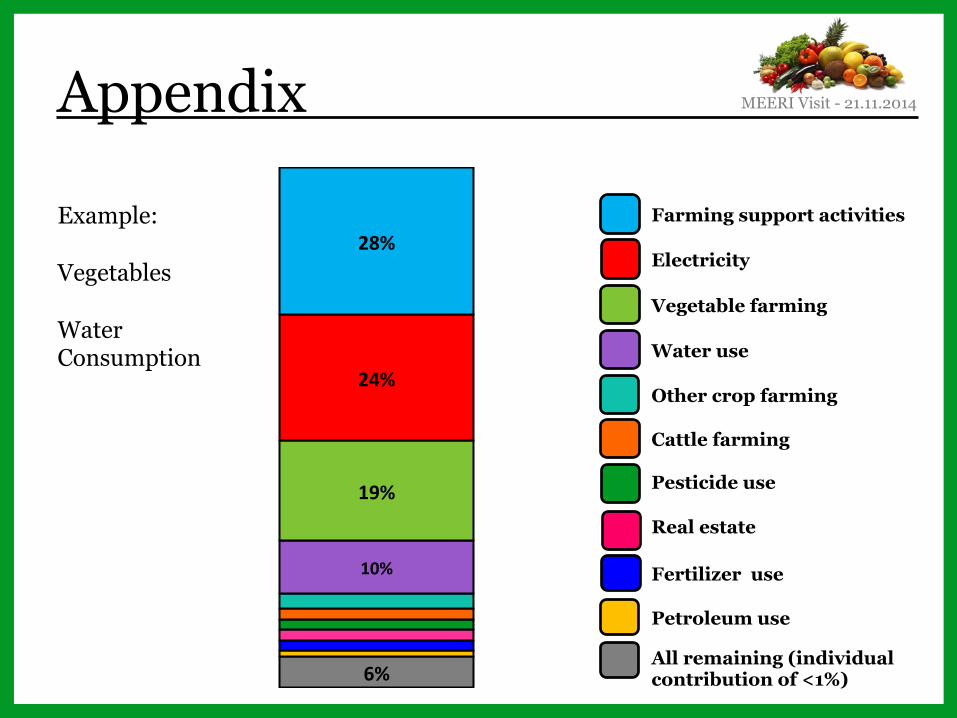
6%)
10%)
19%)
24%)
28%)
Appendix
Other crop farming
Vegetable farming
Fertilizer use
Cattle farming
Petroleum use
Water use
Pesticide use
Real estate
Farming support activities
Electricity
All remaining (individual contribution of <1%)
Example: Vegetables Water Consumption
MEERI Visit - 21.11.2014!
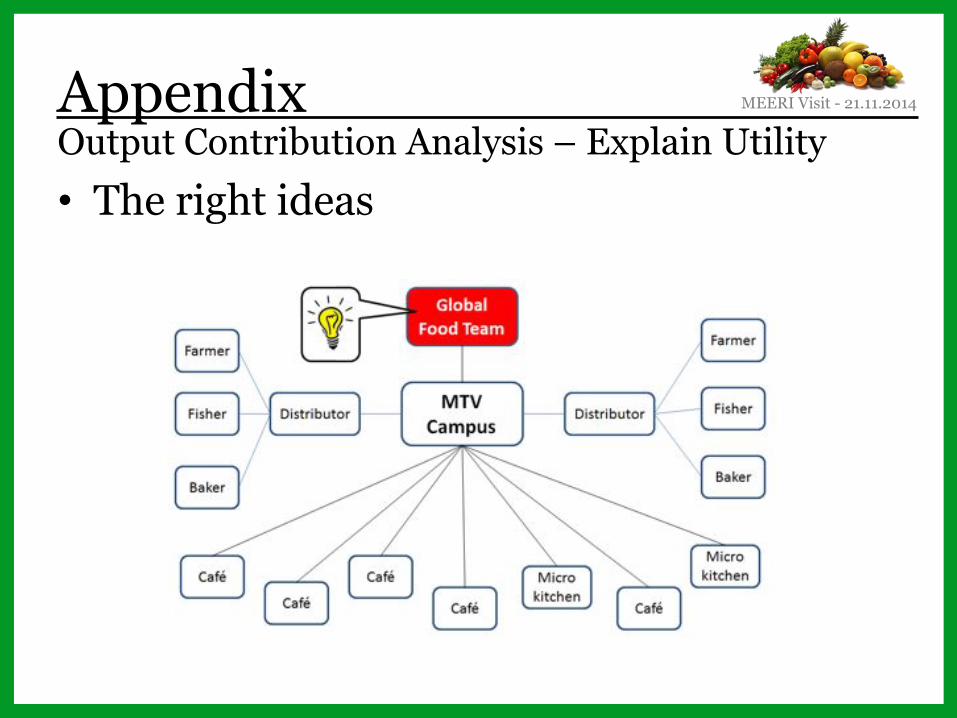
Appendix
• The right ideas Output Contribution Analysis – Explain Utility
MEERI Visit - 21.11.2014!
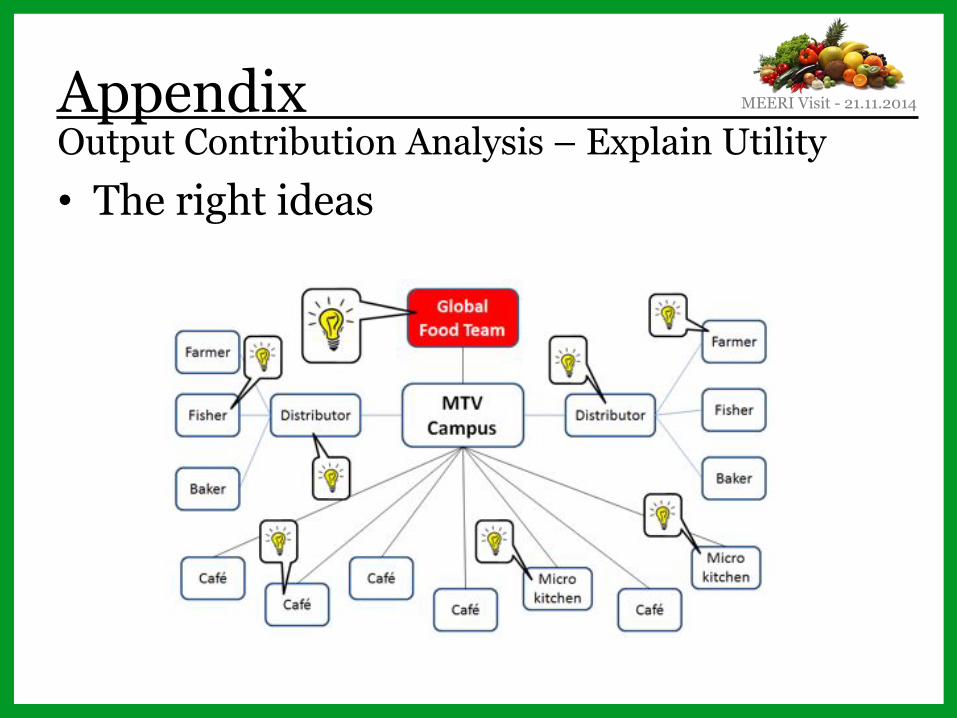
Appendix Output Contribution Analysis – Explain Utility • The right ideas
MEERI Visit - 21.11.2014!
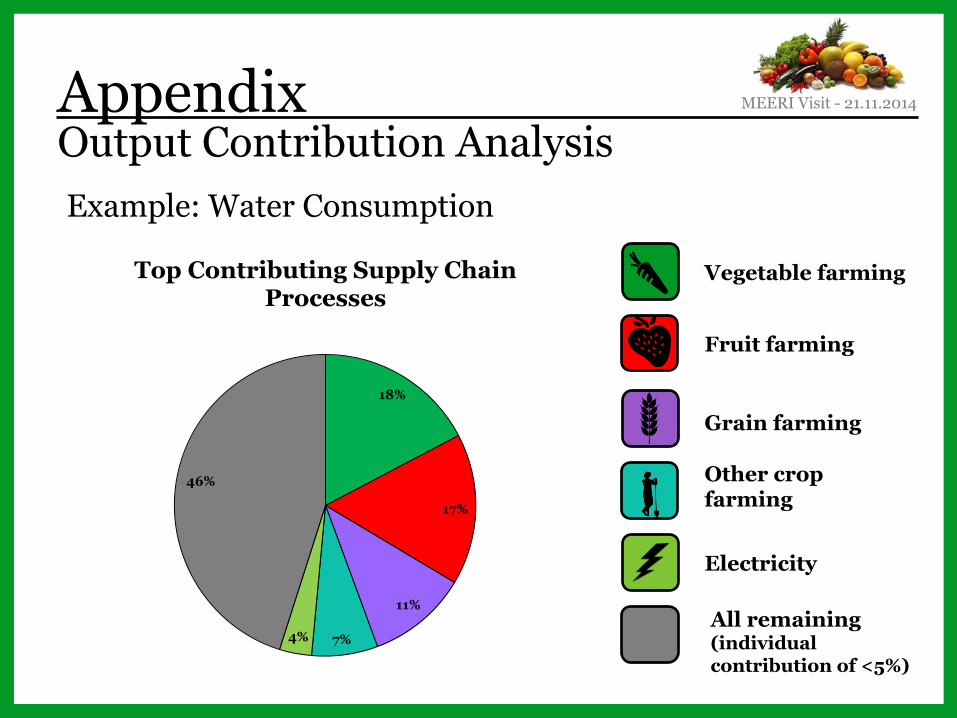
Example: Water Consumption
Appendix Output Contribution Analysis
Electricity
Vegetable farming
Fruit farming
Other crop farming
Grain farming
All remaining (individual contribution of <5%)
18%
17%
11%
7% 4%
46%
Top Contributing Supply Chain Processes
MEERI Visit - 21.11.2014!
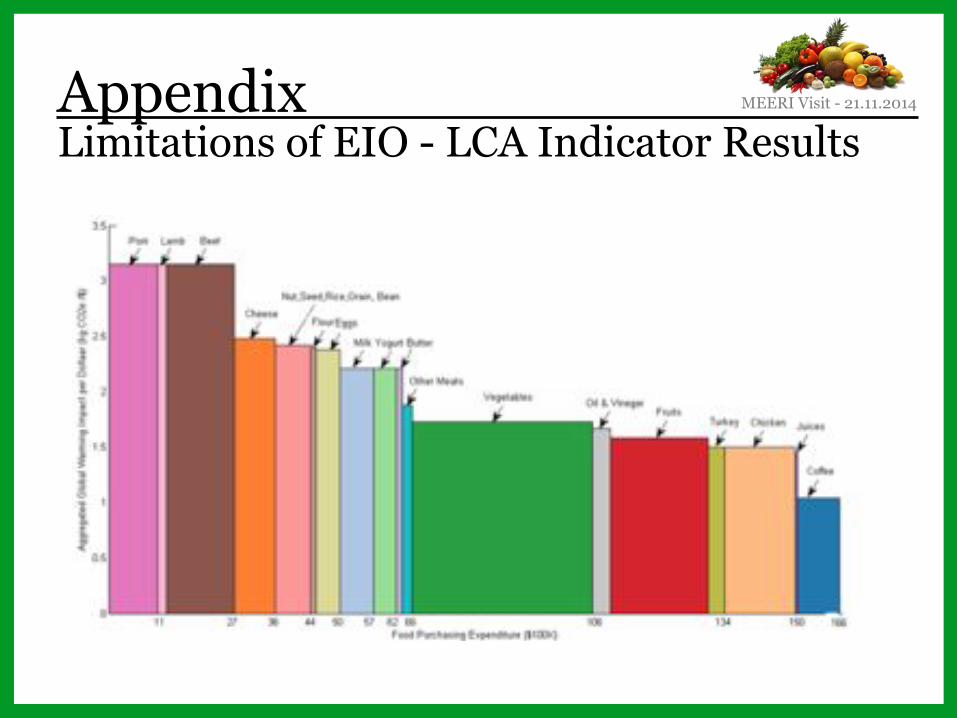
Appendix Limitations of EIO - LCA Indicator Results
MEERI Visit - 21.11.2014!
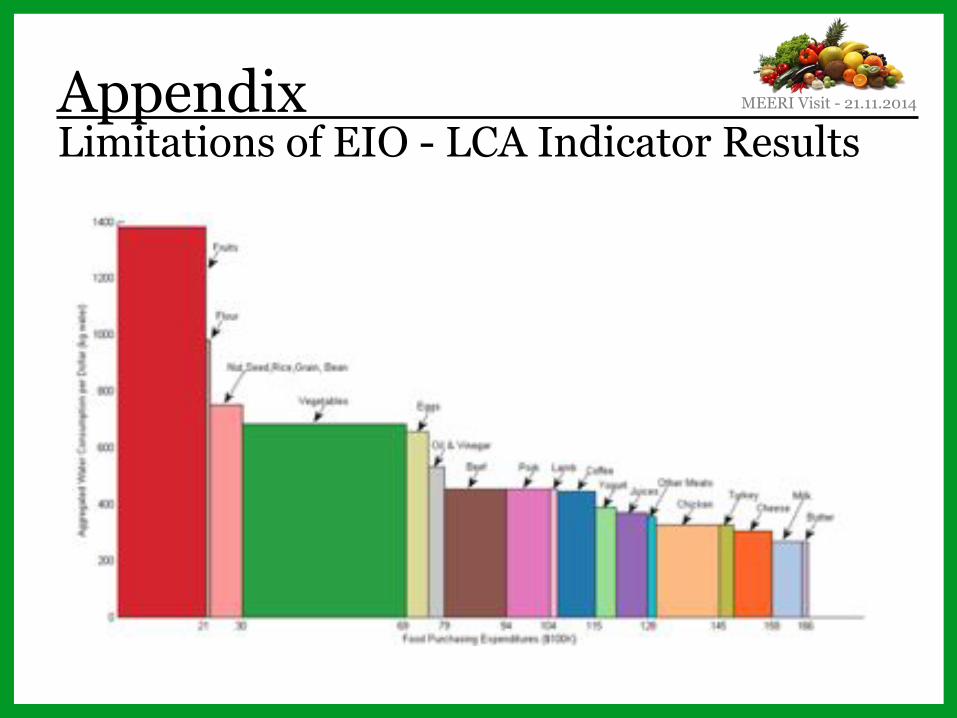
Appendix Limitations of EIO - LCA Indicator Results
MEERI Visit - 21.11.2014!
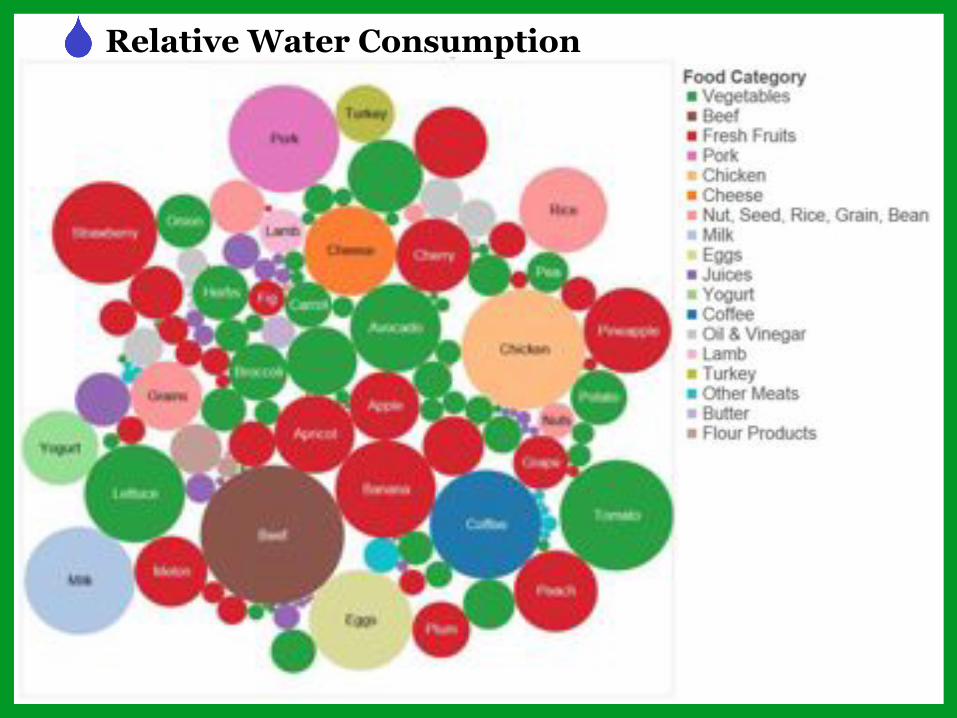
Relative Water Consumption
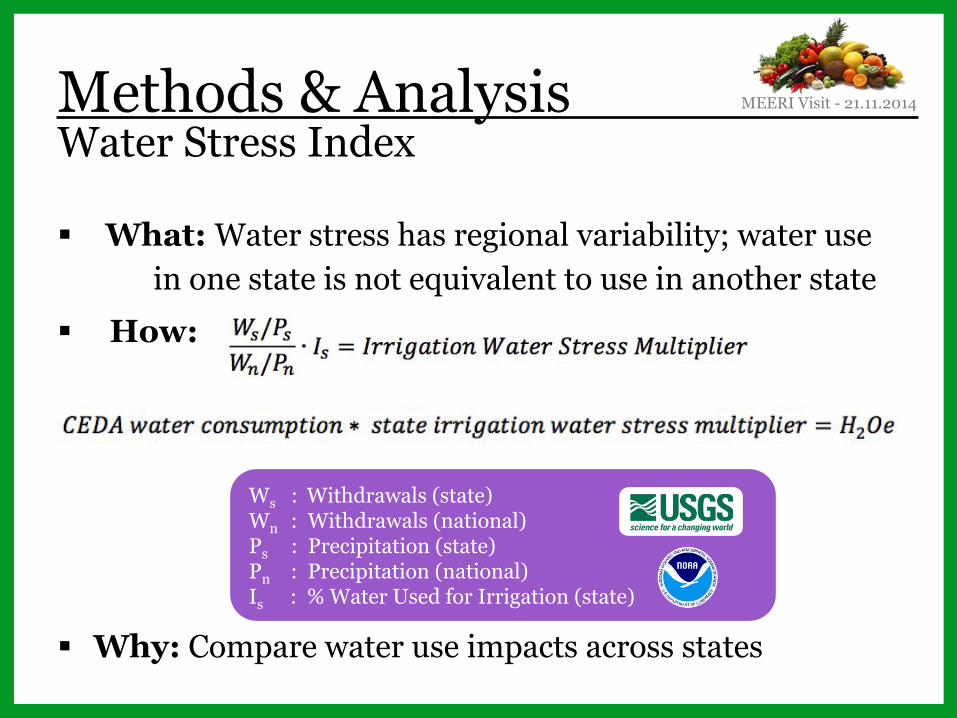
! What: Water stress has regional variability; water use in one state is not equivalent to use in another state!
! How:)
! Why: Compare water use impacts across states!
Methods & Analysis Water Stress Index
Ws : Withdrawals (state) Wn : Withdrawals (national) Ps : Precipitation (state) Pn : Precipitation (national) Is : % Water Used for Irrigation (state)
MEERI Visit - 21.11.2014!
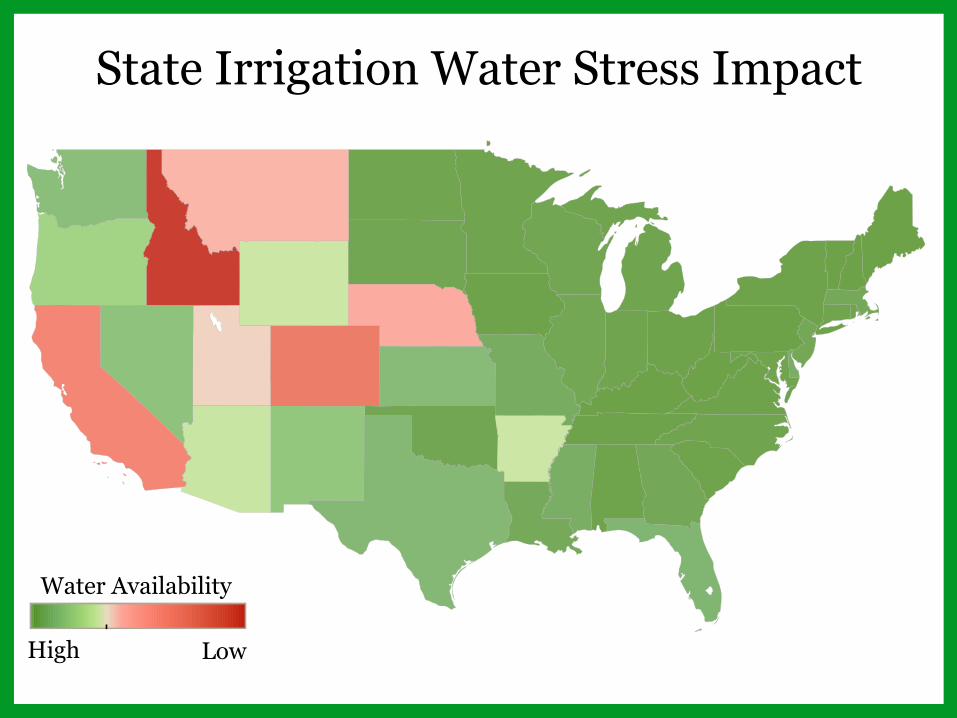
State Irrigation Water Stress Impact
High Low
Water Availability
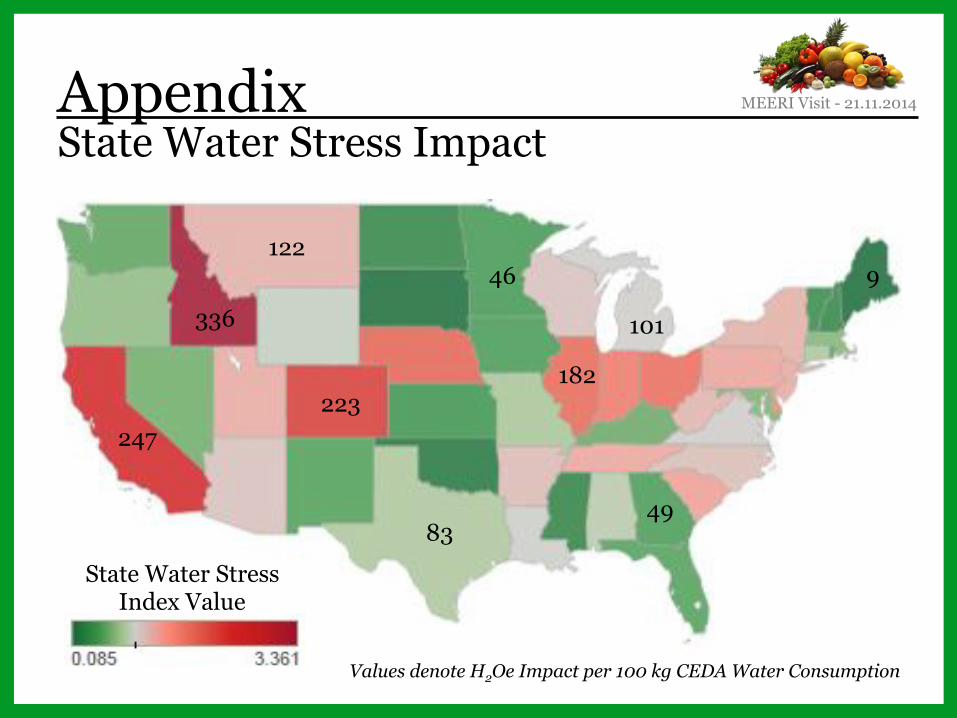
Values denote H2Oe Impact per 100 kg CEDA Water Consumption
State Water Stress Index Value
336
247
9
83
46 122
101
182
49
223
State Water Stress Impact Appendix MEERI Visit - 21.11.2014!
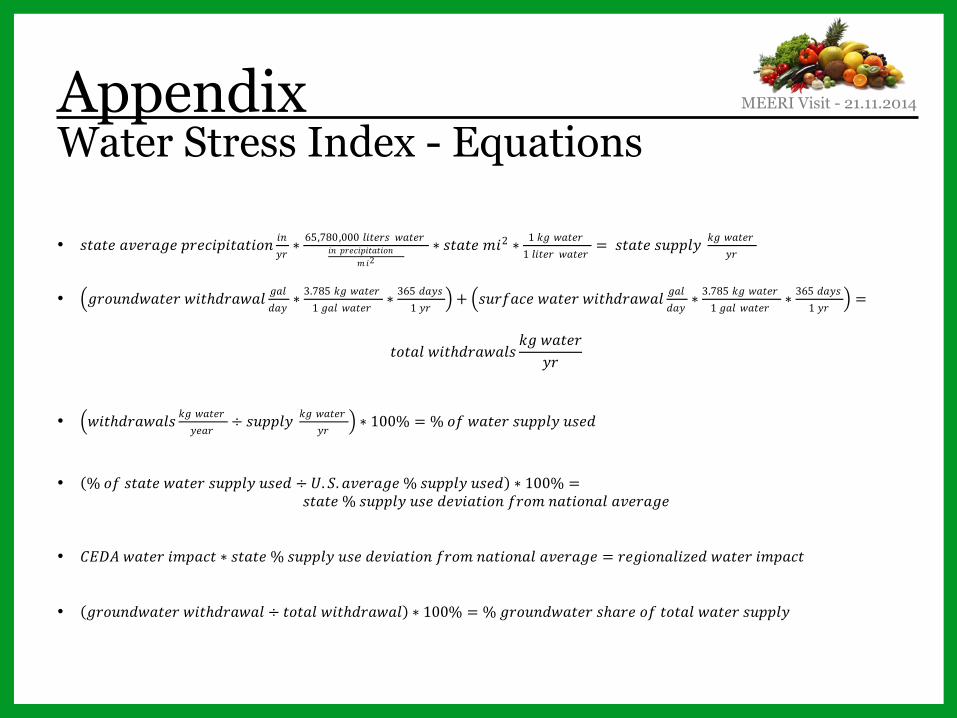
Appendix Water Stress Index - Equations
• !"#"$%#&$'#($%)'$*+)+"#"+,- +-.' ∗
65,780,000%6+"$'! %7#"$'+- %)'$*+)+"#"+,-
8 +2∗ !"#"$%8+2 ∗ 1%;( %7#"$'
1%6+"$' %7#"$' = %!"#"$%!=))6.% ;(%7#"$'.' !!• >(',=-?7#"$'%7+"ℎ?'#7#6 (#6?#. ∗
3.785%;(%7#"$'1%(#6 %7#"$' ∗ 365%?#.!1%.' C + >!='E#*$%7#"$'%7+"ℎ?'#7#6 (#6?#. ∗
3.785%;(%7#"$'1%(#6 %7#"$' ∗ 365%?#.!1%.' C = !
%","#6%7+"ℎ?'#7#6! ;(%7#"$'.' !
!!• >7+"ℎ?'#7#6! ;(%7#"$'.$#' ÷ !=))6.% ;(%7#"$'.' C ∗ 100% = %%,E%7#"$'%!=))6.%=!$?!!!• (%%,E%!"#"$%7#"$'%!=))6.%=!$? ÷ I. J. #&$'#($%%%!=))6.%=!$?) ∗ 100% =!
!"#"$%%%!=))6.%=!$%?$&+#"+,-%E',8%-#"+,-#6%#&$'#($!!!• LMNO%7#"$'%+8)#*" ∗ !"#"$%%%!=))6.%=!$%?$&+#"+,-%E',8%-#"+,-#6%#&$'#($ = '$(+,-#6+P$?%7#"$'%+8)#*"!!!• ((',=-?7#"$'%7+"ℎ?'#7#6 ÷ ","#6%7+"ℎ?'#7#6) ∗ 100% = %%(',=-?7#"$'%!ℎ#'$%,E%","#6%7#"$'%!=))6.!!!!
MEERI Visit - 21.11.2014!
Recommended