Data Rescue, QC and a metadatabase:
FCiências.ID's contribution to WP3
FFCUL /FCiências.ID
Instituto Dom Luiz
Faculty of Science of the University of Lisbon – Portugal
ERA-CLIM2 4rd General Assembly Bern 12-15 December 2017
Maria Antónia Valente, Maria Clara Ventura, Pedro Gomes, Maria Helena Cordeiro, Maria João Rocha, Liliana Matos,
Anabela Simões, Irina Pedroso
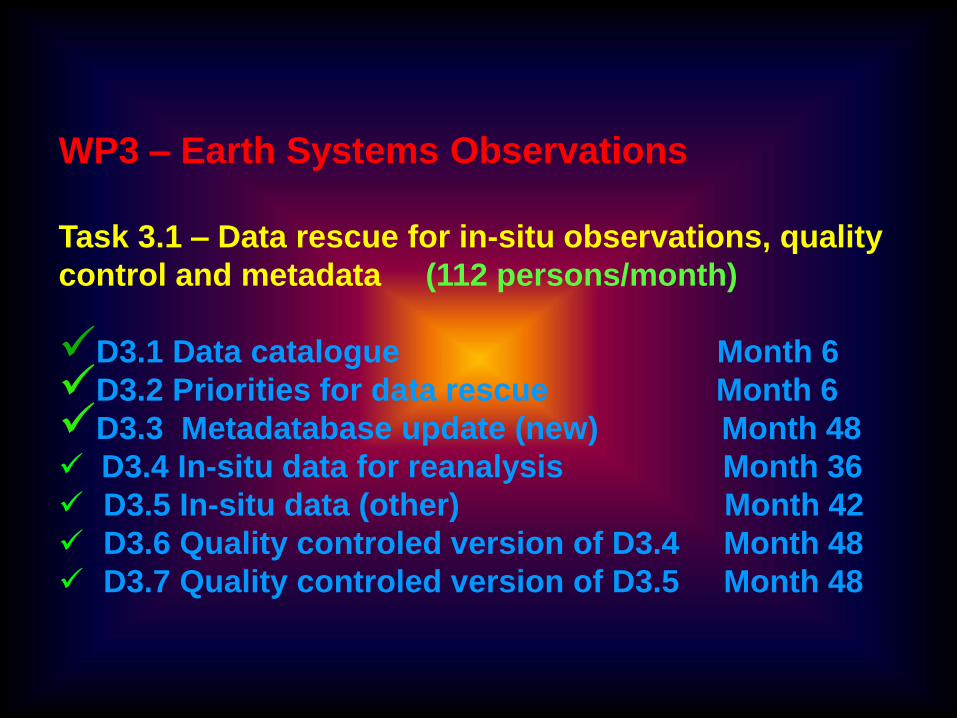
WP3 – Earth Systems Observations
Task 3.1 – Data rescue for in-situ observations, quality
control and metadata (112 persons/month)
D3.1 Data catalogue Month 6
D3.2 Priorities for data rescue Month 6
D3.3 Metadatabase update (new) Month 48
D3.4 In-situ data for reanalysis Month 36
D3.5 In-situ data (other) Month 42
D3.6 Quality controled version of D3.4 Month 48
D3.7 Quality controled version of D3.5 Month 48
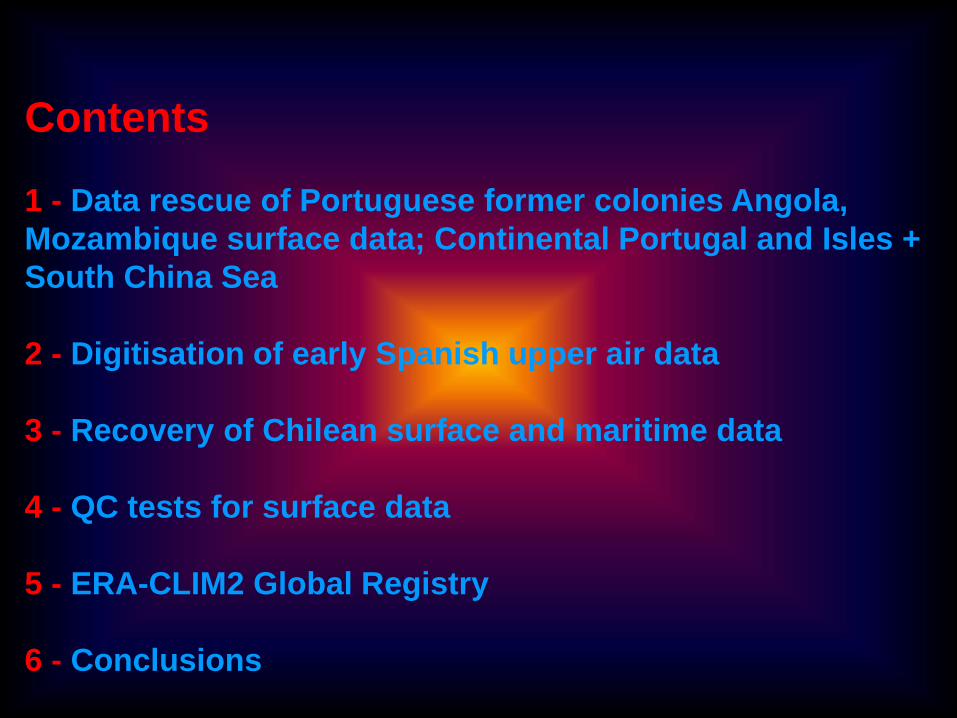
Contents
1 - Data rescue of Portuguese former colonies Angola,
Mozambique surface data; Continental Portugal and Isles +
South China Sea
2 - Digitisation of early Spanish upper air data
3 - Recovery of Chilean surface and maritime data
4 - QC tests for surface data
5 - ERA-CLIM2 Global Registry
6 - Conclusions
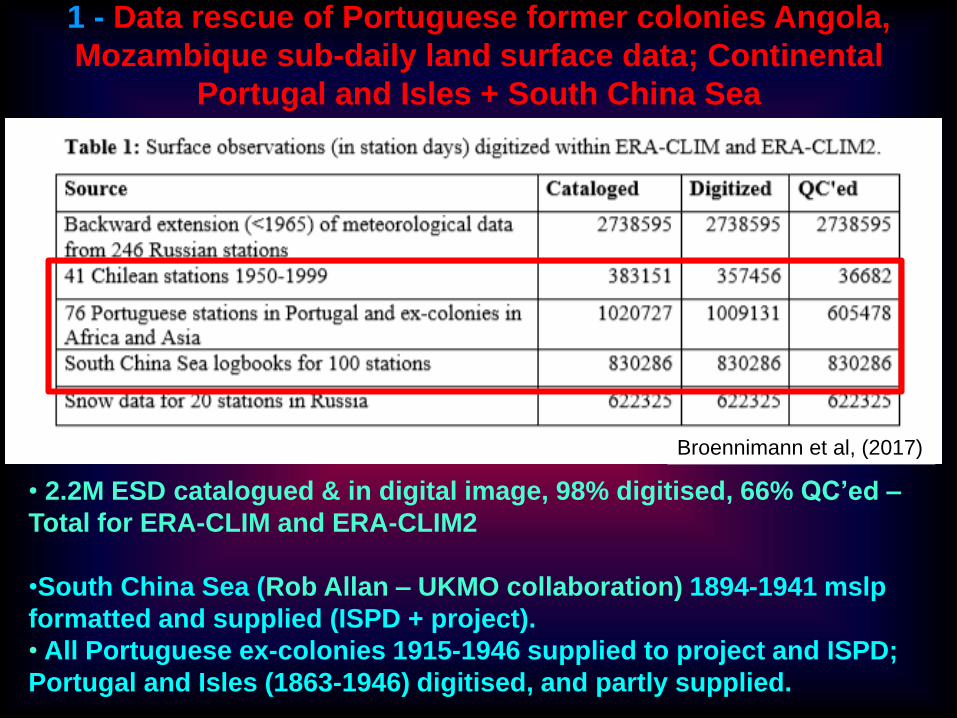
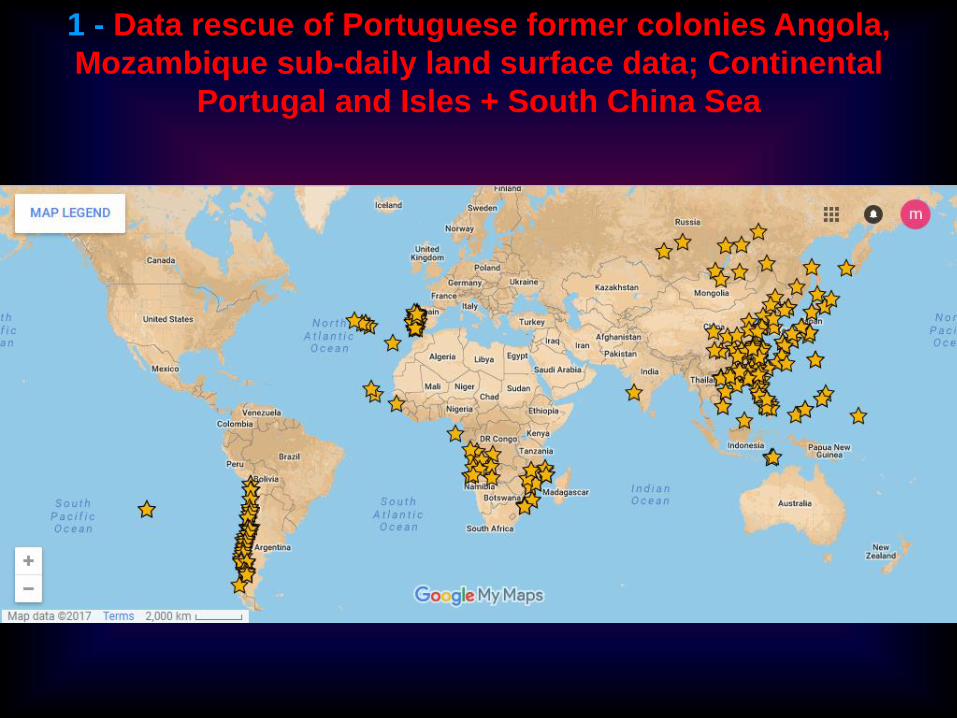
1 - Data rescue of Portuguese former colonies Angola,
Mozambique sub-daily land surface data; Continental
Portugal and Isles + South China Sea
• 2.2M ESD catalogued & in digital image, 98% digitised, 66% QC’ed –
Total for ERA-CLIM and ERA-CLIM2
•South China Sea (Rob Allan – UKMO collaboration) 1894-1941 mslp
formatted and supplied (ISPD + project).
• All Portuguese ex-colonies 1915-1946 supplied to project and ISPD;
Portugal and Isles (1863-1946) digitised, and partly supplied.
Broennimann et al, (2017)
1 - Data rescue of Portuguese former colonies Angola,
Mozambique sub-daily land surface data; Continental
Portugal and Isles + South China Sea
1 - Data rescue of Portuguese former colonies Angola,
Mozambique sub-daily land surface data; Continental
Portugal and Isles + South China Sea
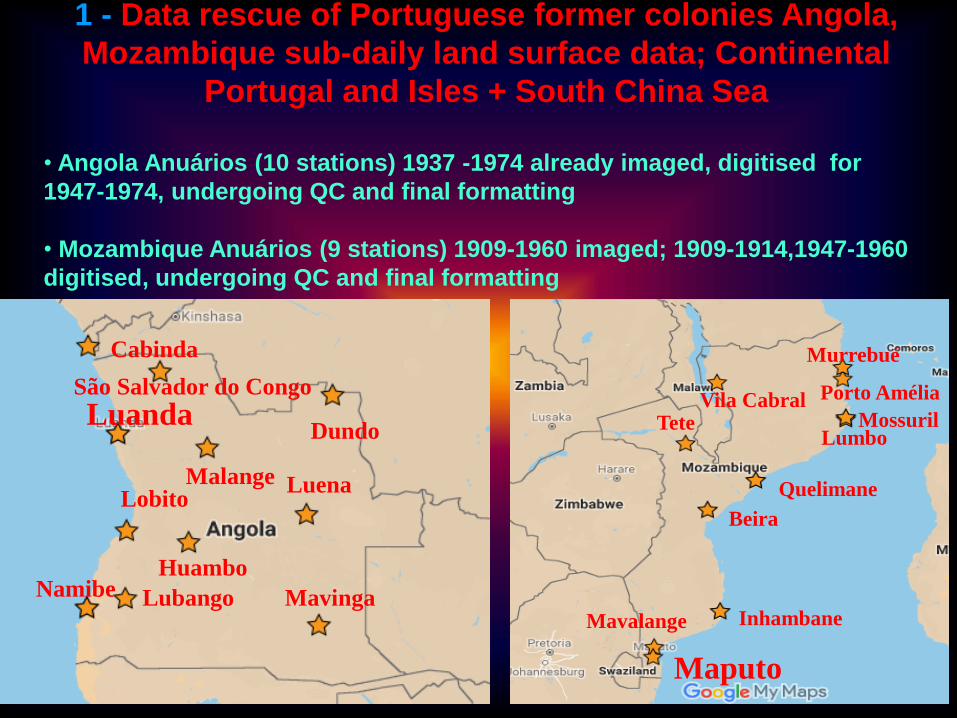
• Angola Anuários (10 stations) 1937 -1974 already imaged, digitised for
1947-1974, undergoing QC and final formatting
• Mozambique Anuários (9 stations) 1909-1960 imaged; 1909-1914,1947-1960
digitised, undergoing QC and final formatting
São Salvador do Congo
Namibe Lubango Mavinga
LuenaMalange
LuandaDundo
Cabinda
Lobito
Huambo
Murrebué
Porto Amélia
MossurilLumbo
Quelimane
Beira
Inhambane
Maputo
Mavalange
TeteVila Cabral
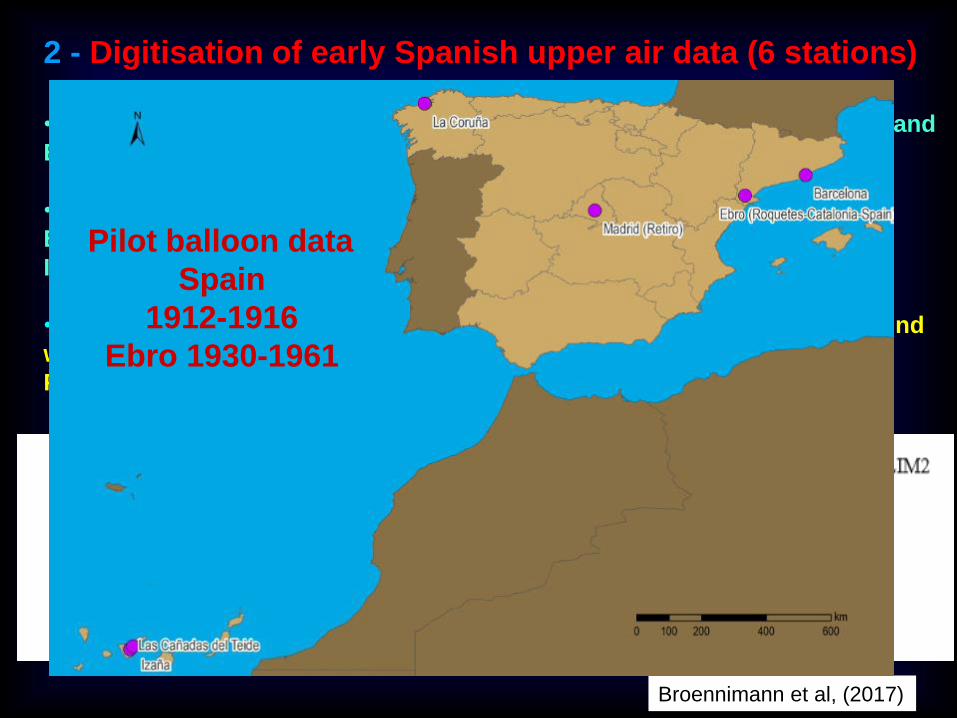
2 - Digitisation of early Spanish upper air data (6 stations)
• 40K station days, 100% imaged and digitised (typing) Total for ERA-CLIM and
ERA-CLIM2
• Finalised Spanish pilot balloon data for Madrid (1913-1916), La Coruña,
Barcelona (both 1914-16); Cañadas del Teide (Canary Islands) 1912-1915;
Izaña (Canary Islands -1916); Ebro (1930 -1961) – included in CHUAN
• New handwritten pilot balloon data at Valentia (Ireland) 1920 has been found
which is not in the upper air databases. Has been imaged and sent to
Fciências.ID for digitisation.
Broennimann et al, (2017)
Pilot balloon data
Spain
1912-1916
Ebro 1930-1961
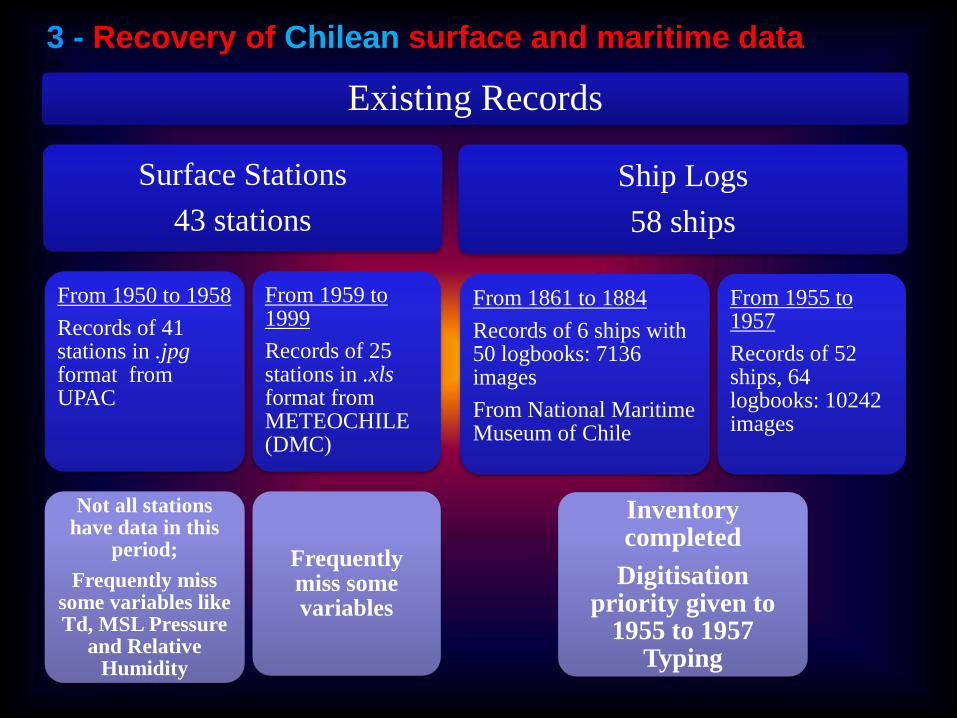
3 - Recovery of Chilean surface and maritime data
Existing Records
Surface Stations
43 stations
From 1950 to 1958
Records of 41 stations in .jpgformat from UPAC
Not all stations have data in this
period;
Frequently miss some variables like Td, MSL Pressure
and Relative Humidity
From 1959 to 1999
Records of 25 stations in .xlsformat from METEOCHILE (DMC)
Frequently miss some variables
Ship Logs
58 ships
From 1861 to 1884
Records of 6 ships with50 logbooks: 7136 images
From National MaritimeMuseum of Chile
Inventory completed
Digitisation priority given to
1955 to 1957 Typing
From 1955 to 1957
Records of 52 ships, 64 logbooks: 10242 images
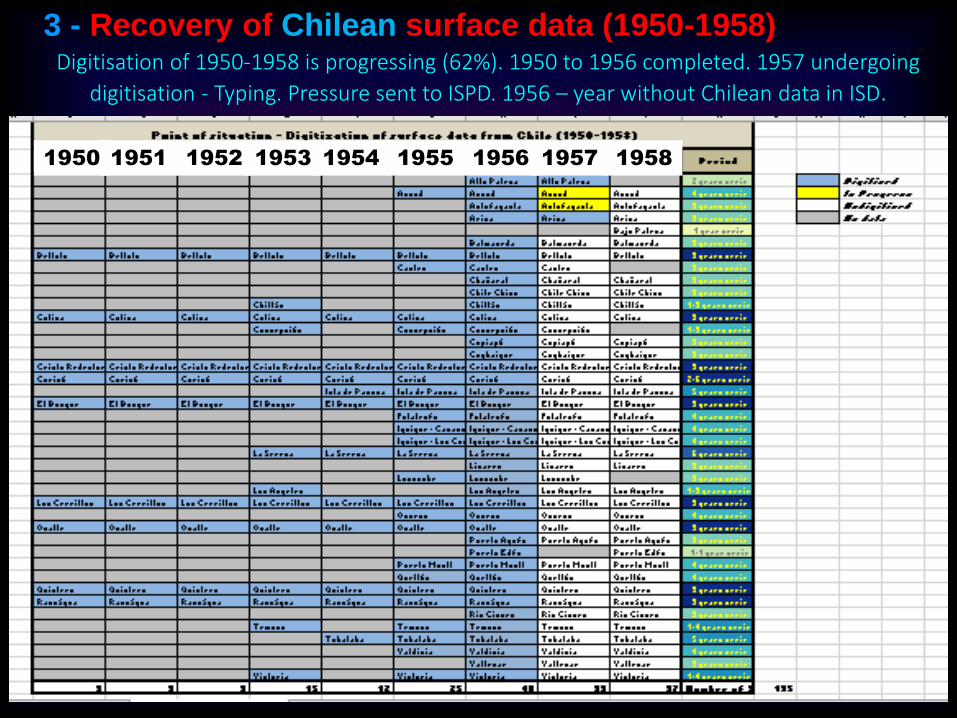
3 - Recovery of Chilean surface data (1950-1958)Digitisation of 1950-1958 is progressing (62%). 1950 to 1956 completed. 1957 undergoing
digitisation - Typing. Pressure sent to ISPD. 1956 – year without Chilean data in ISD.
1950 1951 1952 1953 1954 1955 1956 1957 1958

3 - Recovery of Chilean maritime dataSERIES of 64 SHIP LOGS: 1955 - 1957

Home page of the Portal lodging the ERA-CLIM2 FFCUL/FCiências.ID digitized data, for the countries and regions indicated. Available at http://eraclim2.rd.ciencias.ulisboa.pt/

Flags used do codify the observations:
0 – Correct
1 – Erroneous
9 – Suspect
M – Missing QC
CHECK 1: Gross Error Limit (GEL) – detecting outliersA set of checks was applied to surface pressure, mslp, wind speed and direction, temperature,
cloud cover. relative humidity and precipitation.
4 - QC tests for surface data
MSLPRESSURE : (units=hPa)
A suspected error was flagged when
p ≤ 870.0 or p ≥ 1100.0
WIND DIRECTION (dd) and FORCE (ff)
The values were considered correct when
dd ≥ 0º and dd ≤ 360º
ff ≤ 100 (ms-1) = 360 (km/h)
and the values were flagged as wrong when
dd < 0º and dd > 360º
ff < 0 (ms-1) = 0 (km/h)
an ff value above 100 ms-1 earned a suspicious value
flag.
TEMPERATURE (T)
Values were considered correct when
T ≥ -50ºC and T ≤ 50ºC
outside this interval, they are considered suspect
until more checks are applied
CLOUD COVER (N)
Values are considered correct when
N ≥ 0 and N ≤ 8 if cloud cover is in oktas
N=9 clouds are not visible, ex. in the case of fog
Or N ≥ 0 and N ≤ 10 if cloud cover is in tenths
RELATIVE HUMIDITY (RH)
Values are considered correct if
RH > 0% and HR ≤ 100%
If
RH >100% the value is reset to RH = 100%???
PRECIPITATION (RRR)
If RRR < 0 value is incorrect
RRR ≥ 0 value is correct
Threshold for maximum?
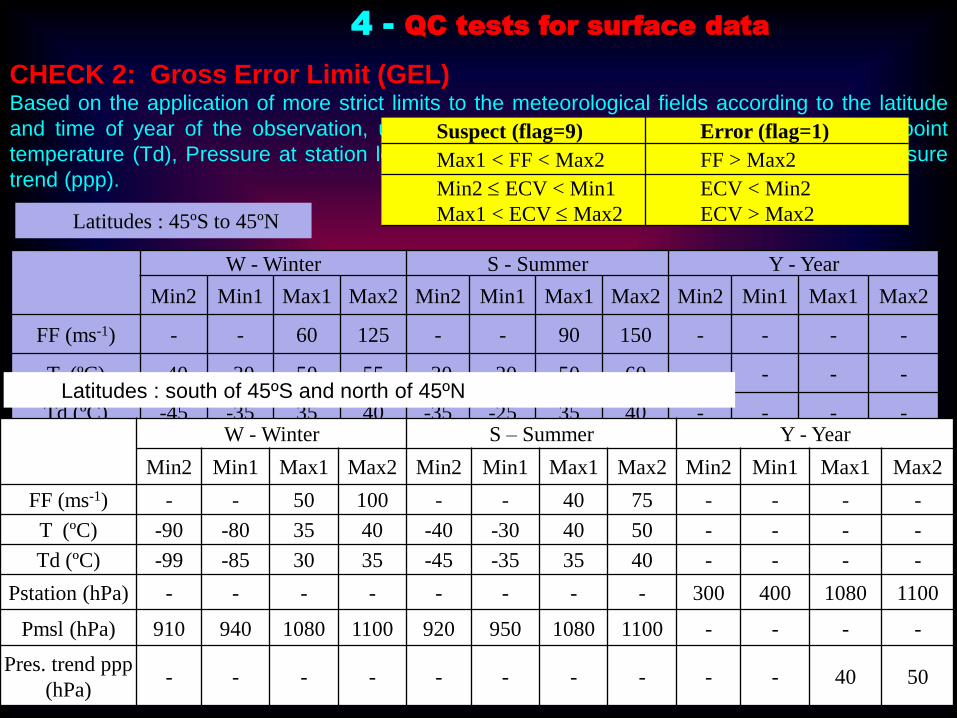
CHECK 2: Gross Error Limit (GEL)Based on the application of more strict limits to the meteorological fields according to the latitude
and time of year of the observation, used to flag wind speed (FF), temperature (T), dew point
temperature (Td), Pressure at station level (Pstation), Mean Sea Level pressure (Pmsl), pressure
trend (ppp).
W - Winter S - Summer Y - Year
Min2 Min1 Max1 Max2 Min2 Min1 Max1 Max2 Min2 Min1 Max1 Max2
FF (ms-1) - - 60 125 - - 90 150 - - - -
T (ºC) -40 -30 50 55 -30 -20 50 60 - - - -
Td (ºC) -45 -35 35 40 -35 -25 35 40 - - - -
Pstation (hPa) - - - - - - - - 300 400 1080 1100
Pmsl (hPa) 870 910 1080 1100 850 900 1080 1100 - - - -
Pres. trend
ppp (hPa)- - - - - - - - - - 40 50
Latitudes : south of 45ºS and north of 45ºN
W - Winter S – Summer Y - Year
Min2 Min1 Max1 Max2 Min2 Min1 Max1 Max2 Min2 Min1 Max1 Max2
FF (ms-1) - - 50 100 - - 40 75 - - - -
T (ºC) -90 -80 35 40 -40 -30 40 50 - - - -
Td (ºC) -99 -85 30 35 -45 -35 35 40 - - - -
Pstation (hPa) - - - - - - - - 300 400 1080 1100
Pmsl (hPa) 910 940 1080 1100 920 950 1080 1100 - - - -
Pres. trend ppp
(hPa)- - - - - - - - - - 40 50
4 - QC tests for surface data
Suspect (flag=9) Error (flag=1)
Max1 < FF < Max2 FF > Max2
Min2 ECV < Min1
Max1 < ECV Max2
ECV < Min2
ECV > Max2Latitudes : 45ºS to 45ºN
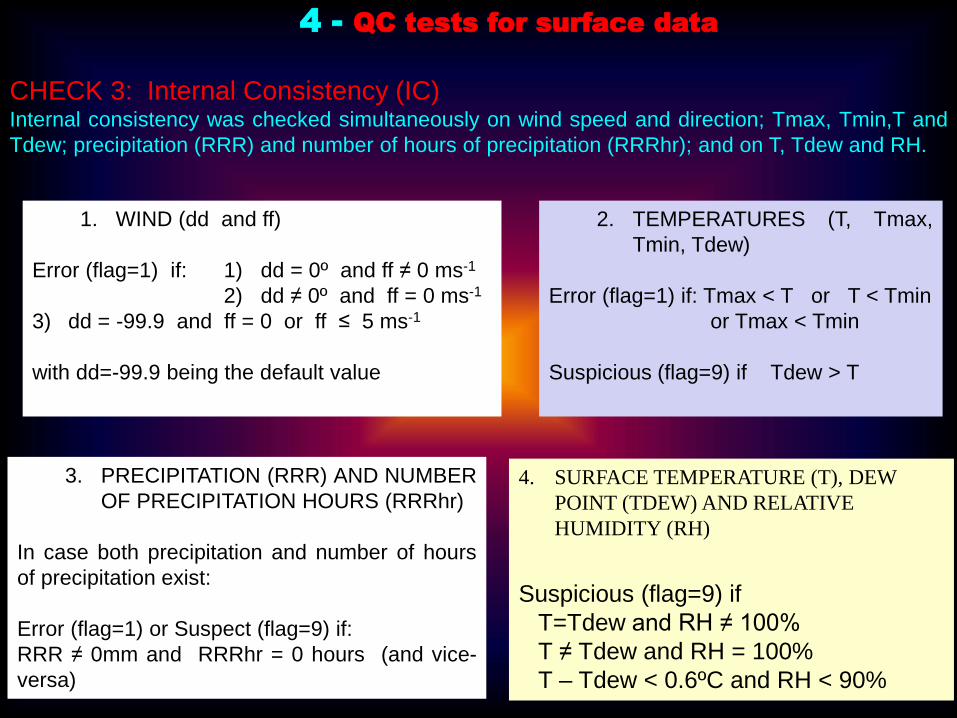
CHECK 3: Internal Consistency (IC)Internal consistency was checked simultaneously on wind speed and direction; Tmax, Tmin,T and
Tdew; precipitation (RRR) and number of hours of precipitation (RRRhr); and on T, Tdew and RH.
4 - QC tests for surface data
1. WIND (dd and ff)
Error (flag=1) if: 1) dd = 0º and ff ≠ 0 ms-1
2) dd ≠ 0º and ff = 0 ms-1
3) dd = -99.9 and ff = 0 or ff ≤ 5 ms-1
with dd=-99.9 being the default value
2. TEMPERATURES (T, Tmax,
Tmin, Tdew)
Error (flag=1) if: Tmax < T or T < Tmin
or Tmax < Tmin
Suspicious (flag=9) if Tdew > T
3. PRECIPITATION (RRR) AND NUMBER
OF PRECIPITATION HOURS (RRRhr)
In case both precipitation and number of hours
of precipitation exist:
Error (flag=1) or Suspect (flag=9) if:
RRR ≠ 0mm and RRRhr = 0 hours (and vice-
versa)
4. SURFACE TEMPERATURE (T), DEW
POINT (TDEW) AND RELATIVE
HUMIDITY (RH)
Suspicious (flag=9) if
T=Tdew and RH ≠ 100%
T ≠ Tdew and RH = 100%
T – Tdew < 0.6ºC and RH < 90%
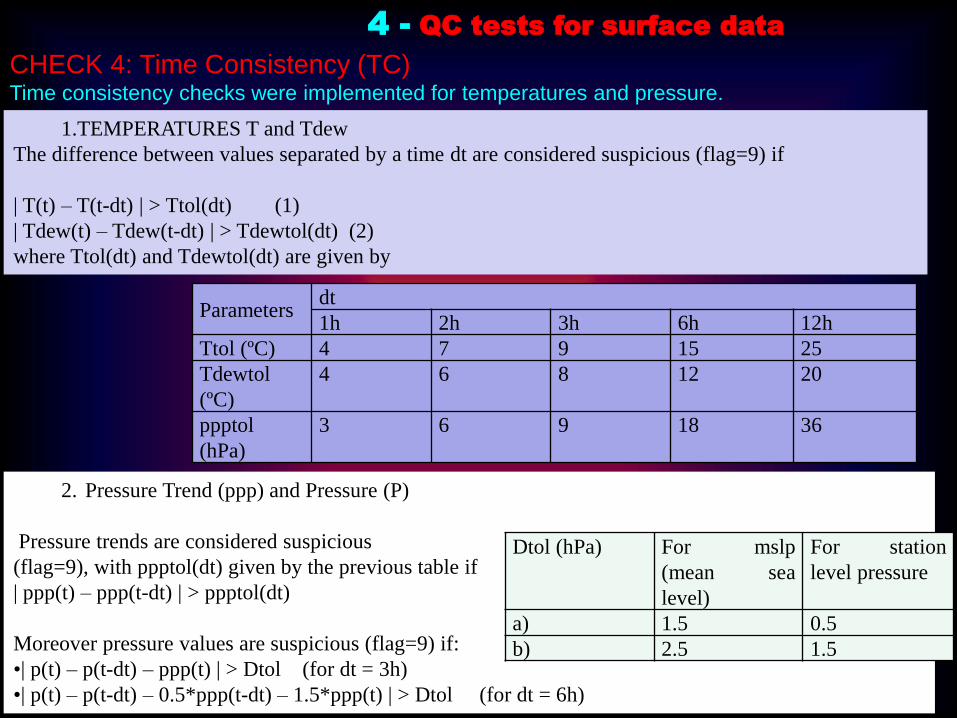
2. Pressure Trend (ppp) and Pressure (P)
Pressure trends are considered suspicious
(flag=9), with ppptol(dt) given by the previous table if
| ppp(t) – ppp(t-dt) | > ppptol(dt)
Moreover pressure values are suspicious (flag=9) if:
•| p(t) – p(t-dt) – ppp(t) | > Dtol (for dt = 3h)
•| p(t) – p(t-dt) – 0.5*ppp(t-dt) – 1.5*ppp(t) | > Dtol (for dt = 6h)
CHECK 4: Time Consistency (TC)Time consistency checks were implemented for temperatures and pressure.
Parametersdt
1h 2h 3h 6h 12h
Ttol (ºC) 4 7 9 15 25
Tdewtol
(ºC)
4 6 8 12 20
ppptol
(hPa)
3 6 9 18 36
Dtol (hPa) For mslp
(mean sea
level)
For station
level pressure
a) 1.5 0.5
b) 2.5 1.5
4 - QC tests for surface data
1.TEMPERATURES T and Tdew
The difference between values separated by a time dt are considered suspicious (flag=9) if
| T(t) – T(t-dt) | > Ttol(dt) (1)
| Tdew(t) – Tdew(t-dt) | > Tdewtol(dt) (2)
where Ttol(dt) and Tdewtol(dt) are given by

Formatting for ISPD
4 - QC tests for surface data
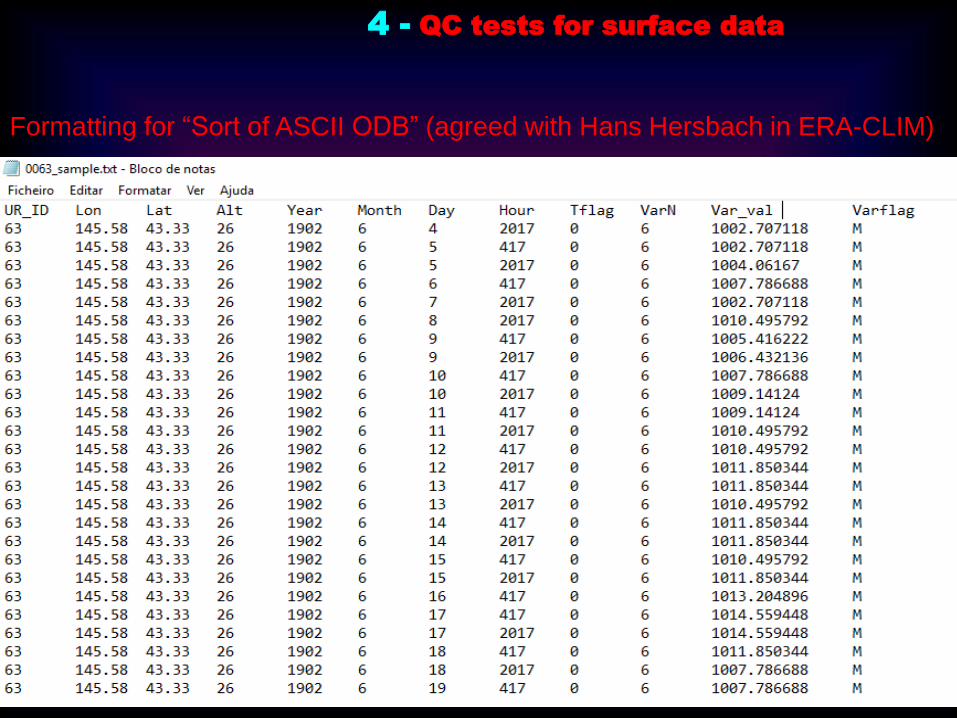
Formatting for “Sort of ASCII ODB” (agreed with Hans Hersbach in ERA-CLIM)
4 - QC tests for surface data
5 – ERA-CLIM2 Global Registry
Development of a global registry (Metadata base) that can list sources of
historical meteorological observations useful for Reanalyses, including
surface, upper air, maritime and other relevant data
Contains the ERA-CLIM2 inventories with detailed metadata.
Fciências.ID produced a source code in html, php and JavaScript,
using php.MySQL for data management. Much of the previous ERA-
CLIM Metadata base information was retained and the inventories
were adapted and uploaded to the new software.
The metadatabase includes the ISPD inventory (version 4 at the
moment).
Open Access (No more anonymous login)
It’s a searcheable and plotable database
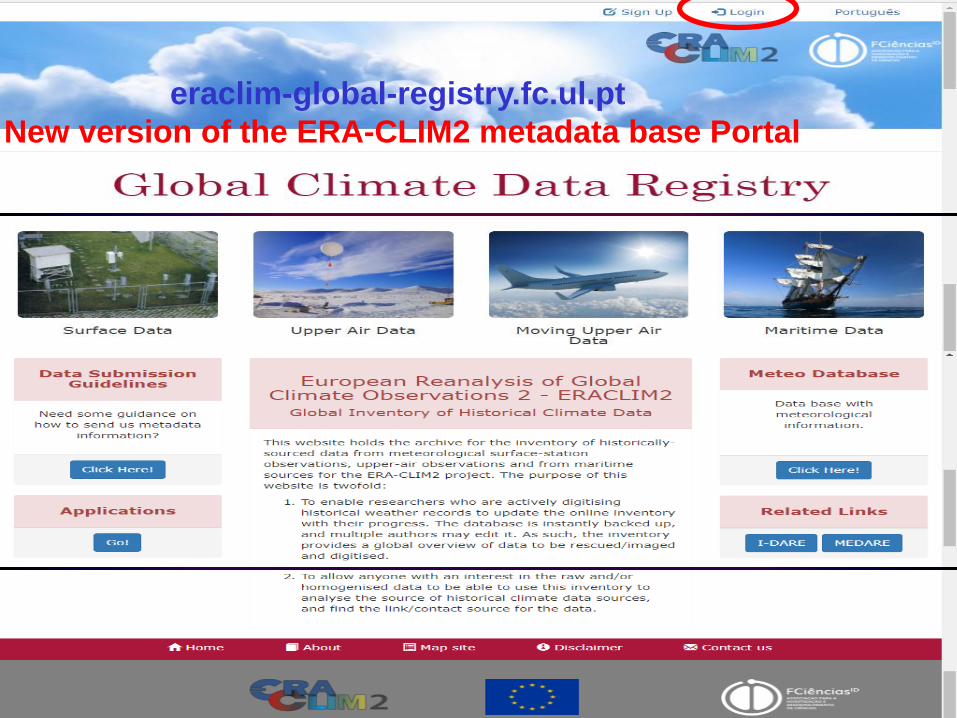
logineraclim-global-registry.fc.ul.pt
New version of the ERA-CLIM2 metadata base Portal
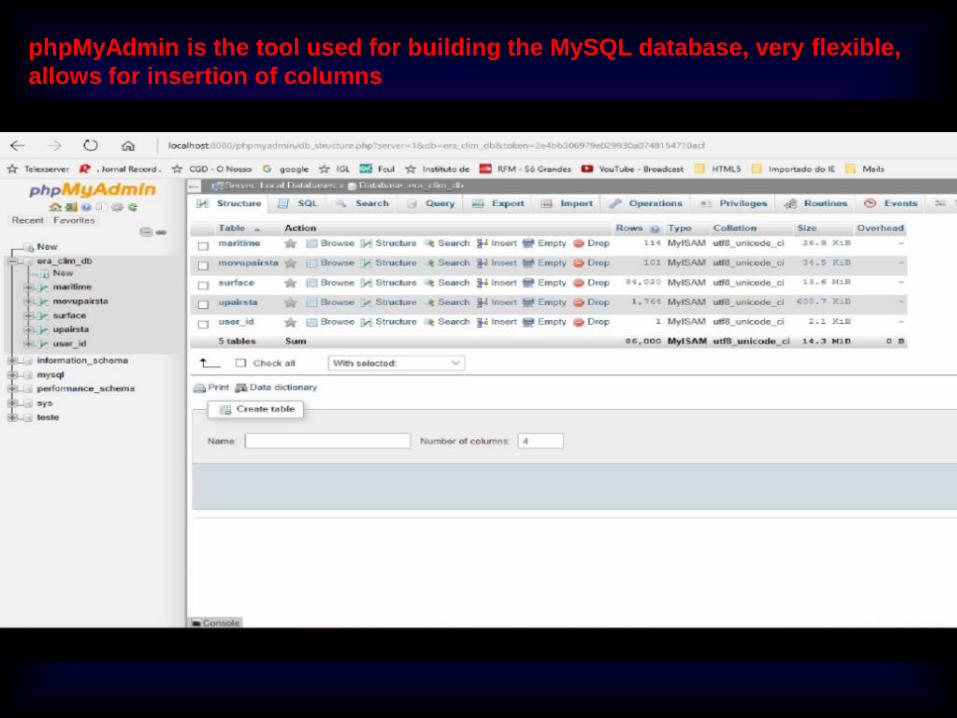
phpMyAdmin is the tool used for building the MySQL database, very flexible,
allows for insertion of columns
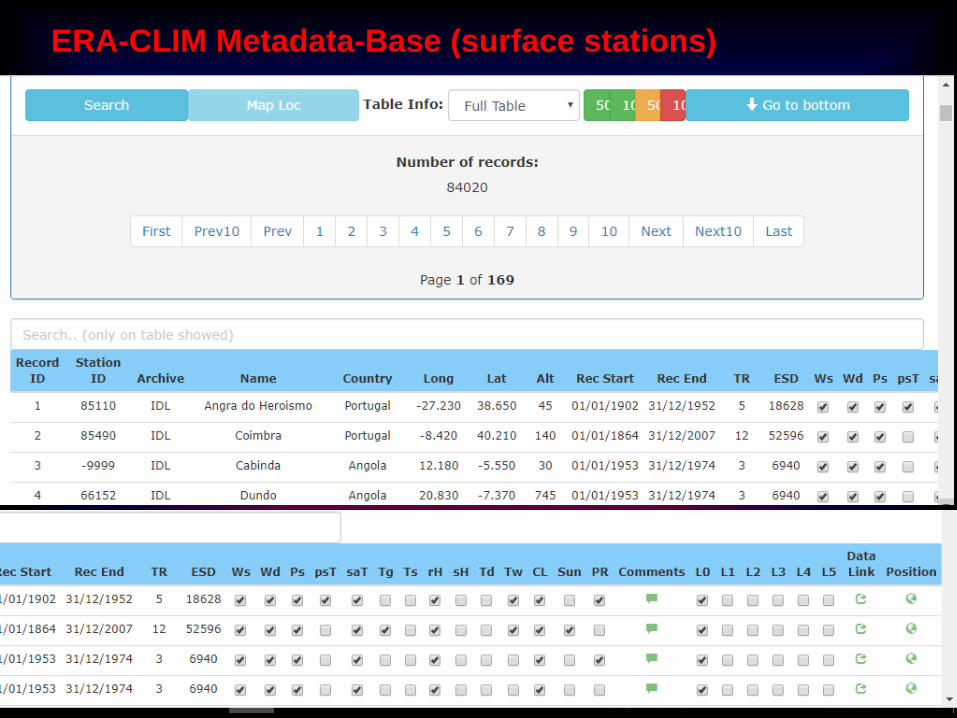
ERA-CLIM Metadata-Base (surface stations)
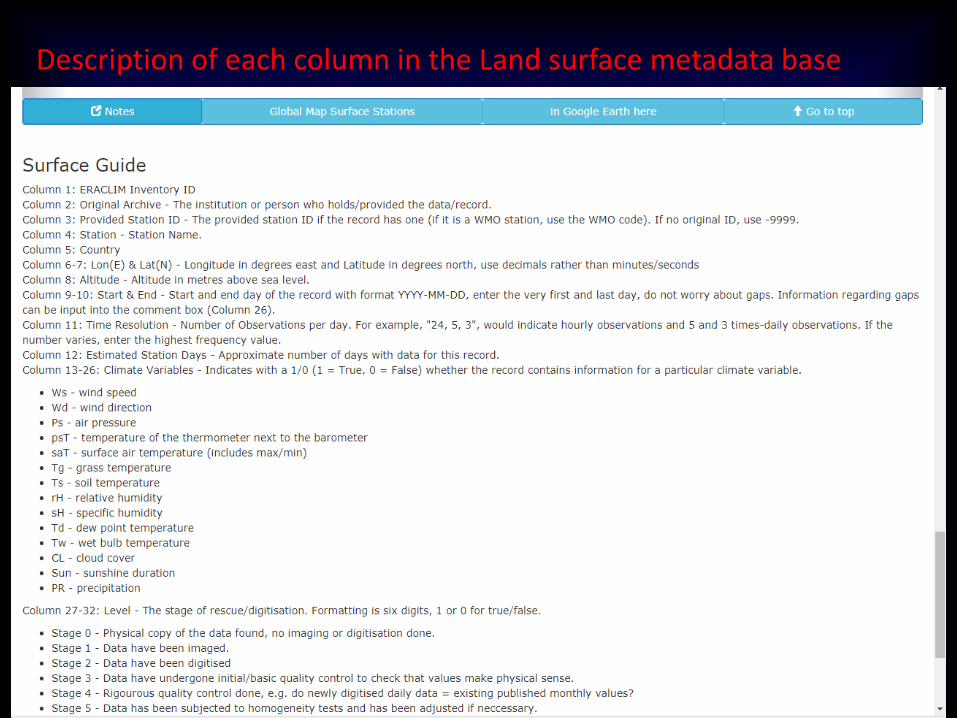
Description of each column in the Land surface metadata base
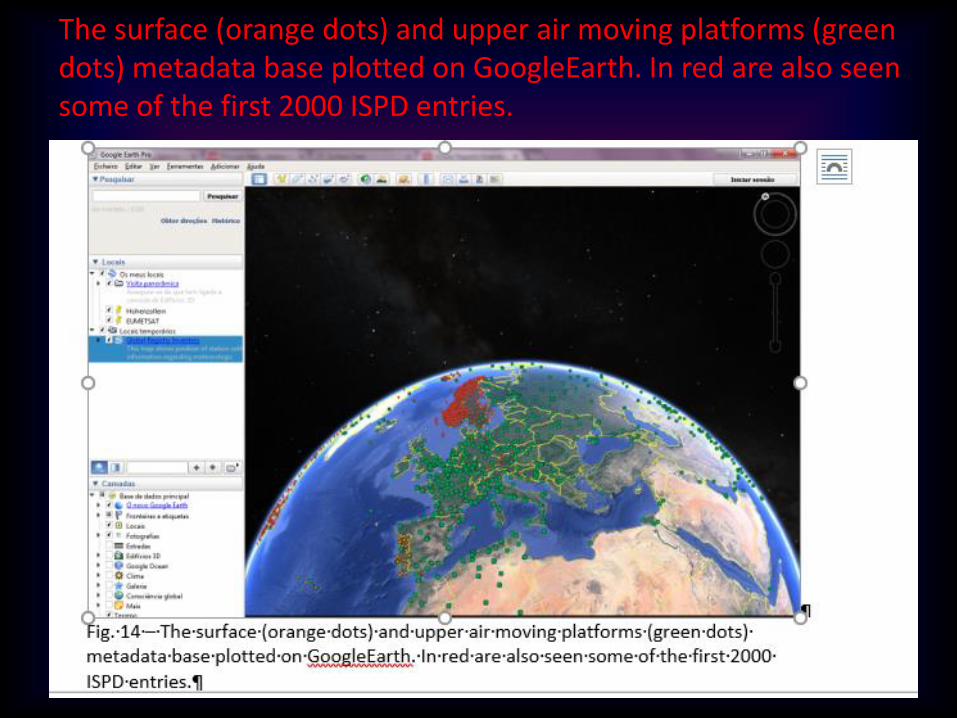
The surface (orange dots) and upper air moving platforms (green dots) metadata base plotted on GoogleEarth. In red are also seen some of the first 2000 ISPD entries.
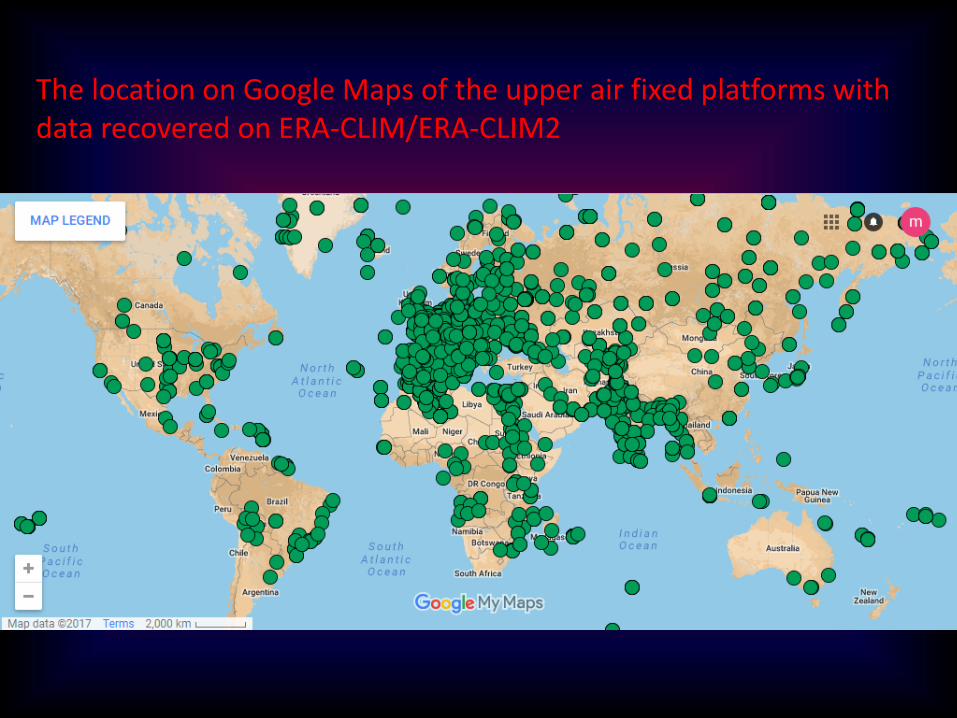
The location on Google Maps of the upper air fixed platforms with data recovered on ERA-CLIM/ERA-CLIM2
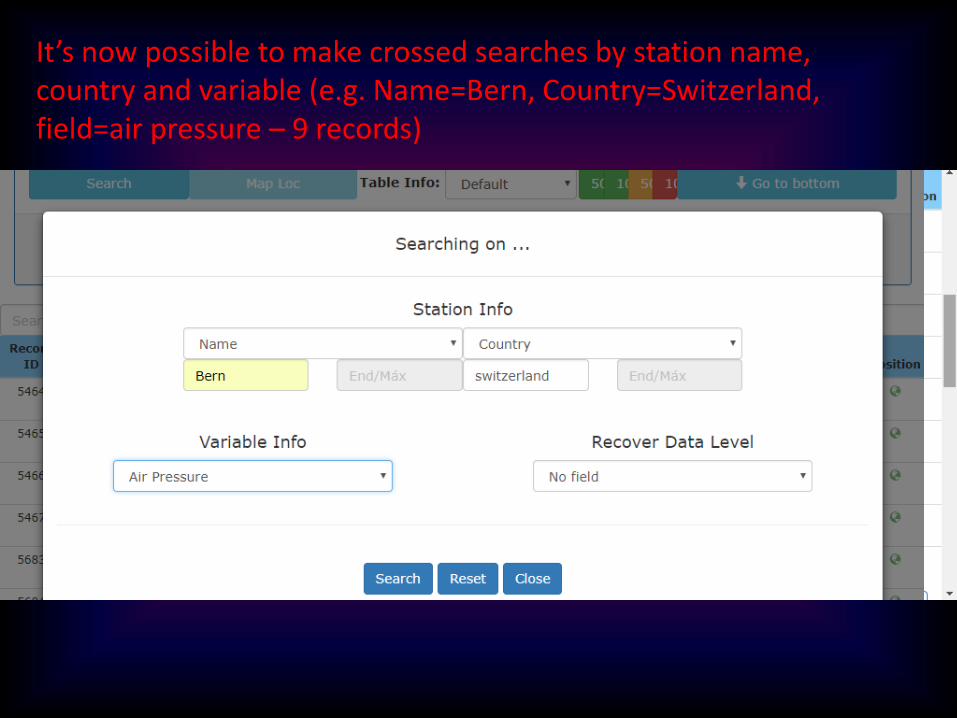
It’s now possible to make crossed searches by station name, country and variable (e.g. Name=Bern, Country=Switzerland, field=air pressure – 9 records)
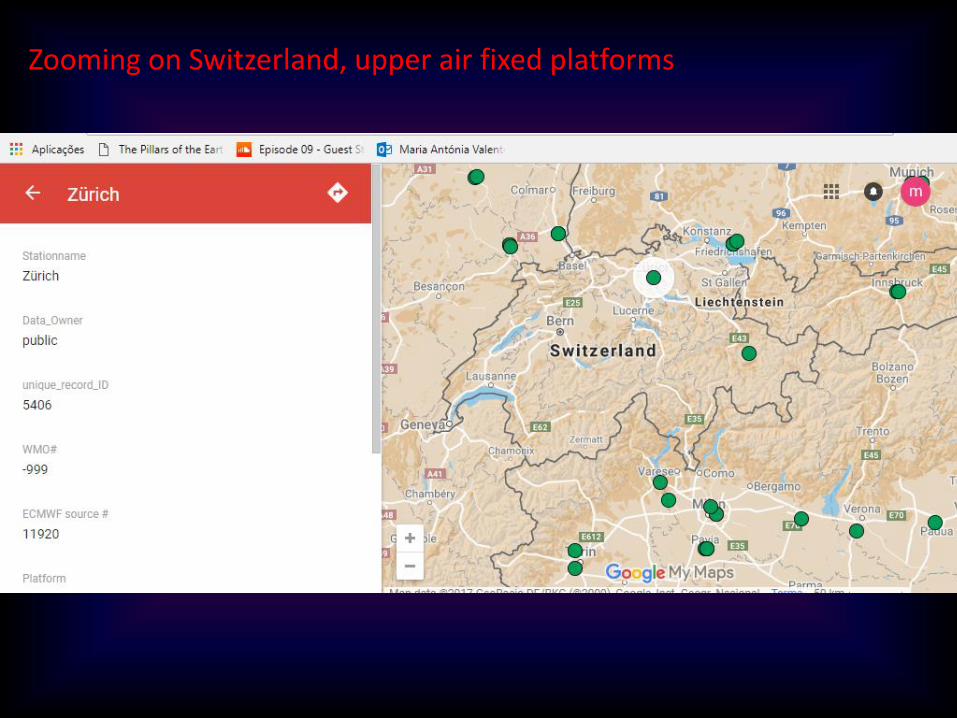
Zooming on Switzerland, upper air fixed platforms
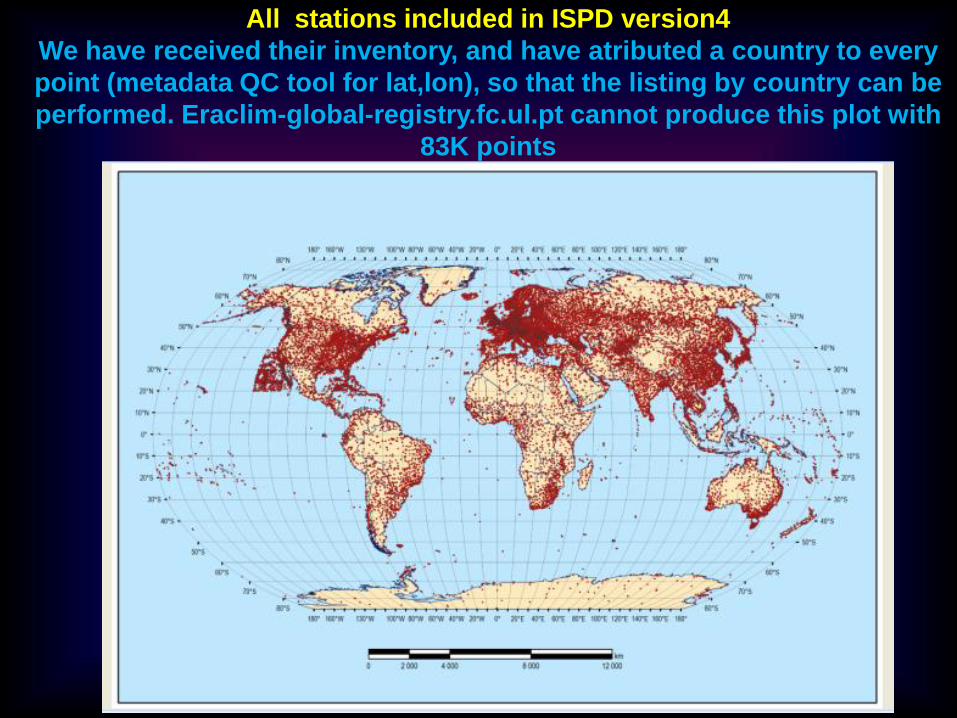
All stations included in ISPD version4
We have received their inventory, and have atributed a country to every
point (metadata QC tool for lat,lon), so that the listing by country can be
performed. Eraclim-global-registry.fc.ul.pt cannot produce this plot with
83K points
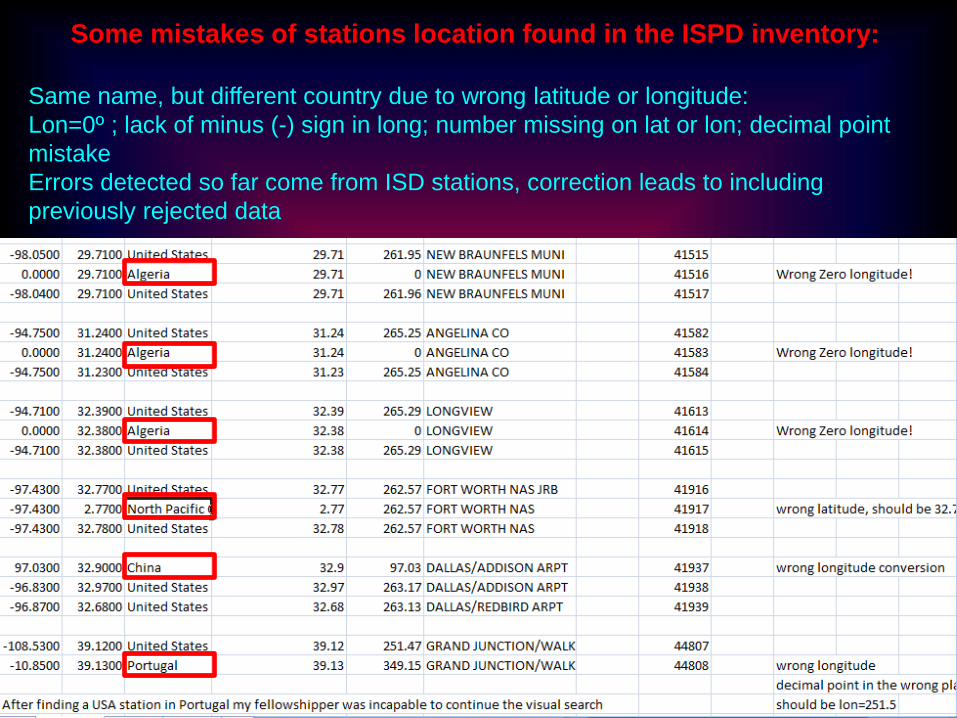
Some mistakes of stations location found in the ISPD inventory:
Same name, but different country due to wrong latitude or longitude:
Lon=0º ; lack of minus (-) sign in long; number missing on lat or lon; decimal point
mistake
Errors detected so far come from ISD stations, correction leads to including
previously rejected data
6 - Conclusions
A comprehensive work of historical data recovery, QC and
formatting has been developed for land surface and upper air data,
for Portugal and former territories, Chile, Spain and South China
Sea regions (UKMO collaboration). Many datasets have been
supplied to Global Databases (ISPD), CHUAN and ERA-CLIM2.
DARE activities are to be continued at a lower pace for an extra
year to finish some of the datasets initially planned for recovery.
The ERA-CLIM2 global metadatabase has been made publicly
accessible through the Registry Portal eraclim-global-registry.fc.ul.pt
The Registry will be maintained during an extra year until the C3S Data
Registry Service is fully operational.
Several tools developed during the ERA-CLIM2 DARE activities will be
passed to the C3S Data Rescue service (data and metadata QC,
formatting for ISPD, IMMA).
Recommended