Washington, D.C. Residential Population Density Analysis by Census Tract and Block Group – 2010 J. Otavio Thompson, Author. Email: [email protected] 1
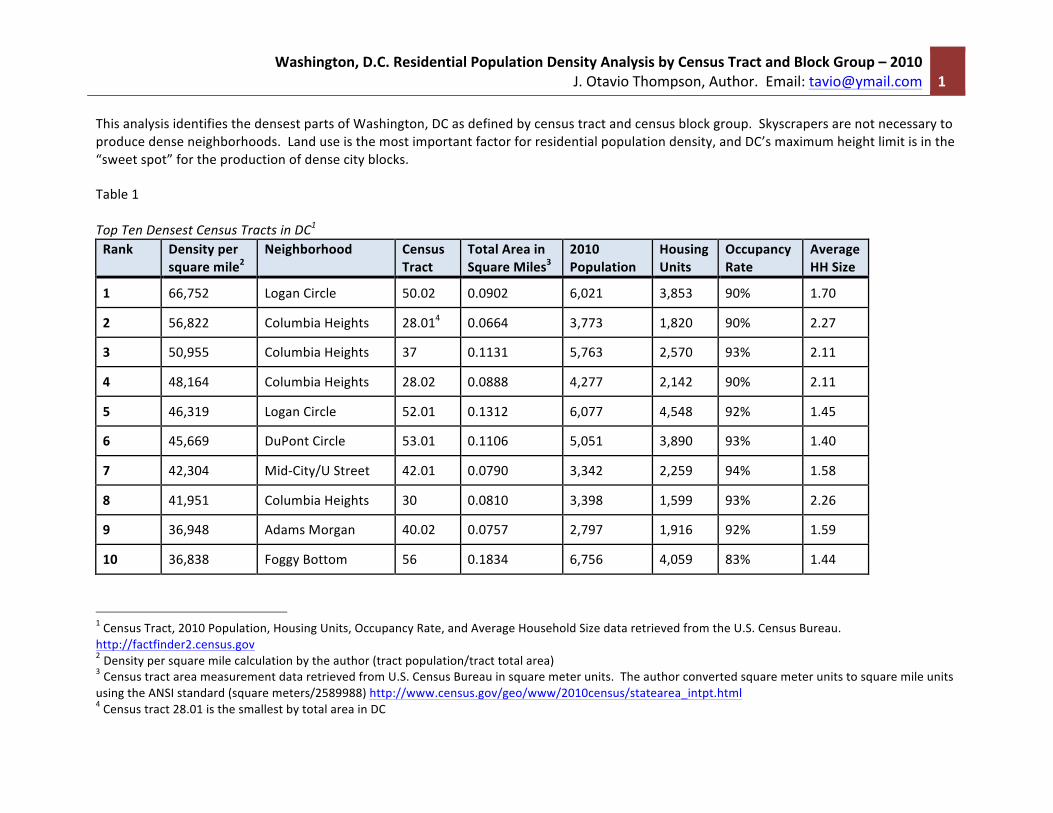
This analysis identifies the densest parts of Washington, DC as defined by census tract and census block group. Skyscrapers are not necessary to produce dense neighborhoods. Land use is the most important factor for residential population density, and DC’s maximum height limit is in the “sweet spot” for the production of dense city blocks. Table 1 Top Ten Densest Census Tracts in DC1 Rank Density per
square mile2 Neighborhood Census
Tract Total Area in Square Miles3
2010 Population
Housing Units
Occupancy Rate
Average HH Size
1 66,752 Logan Circle 50.02 0.0902 6,021 3,853 90% 1.70
2 56,822 Columbia Heights 28.014 0.0664 3,773 1,820 90% 2.27
3 50,955 Columbia Heights 37 0.1131 5,763 2,570 93% 2.11
4 48,164 Columbia Heights 28.02 0.0888 4,277 2,142 90% 2.11
5 46,319 Logan Circle 52.01 0.1312 6,077 4,548 92% 1.45
6 45,669 DuPont Circle 53.01 0.1106 5,051 3,890 93% 1.40
7 42,304 Mid-‐City/U Street 42.01 0.0790 3,342 2,259 94% 1.58
8 41,951 Columbia Heights 30 0.0810 3,398 1,599 93% 2.26
9 36,948 Adams Morgan 40.02 0.0757 2,797 1,916 92% 1.59
10 36,838 Foggy Bottom 56 0.1834 6,756 4,059 83% 1.44
1 Census Tract, 2010 Population, Housing Units, Occupancy Rate, and Average Household Size data retrieved from the U.S. Census Bureau. http://factfinder2.census.gov 2 Density per square mile calculation by the author (tract population/tract total area) 3 Census tract area measurement data retrieved from U.S. Census Bureau in square meter units. The author converted square meter units to square mile units using the ANSI standard (square meters/2589988) http://www.census.gov/geo/www/2010census/statearea_intpt.html 4 Census tract 28.01 is the smallest by total area in DC
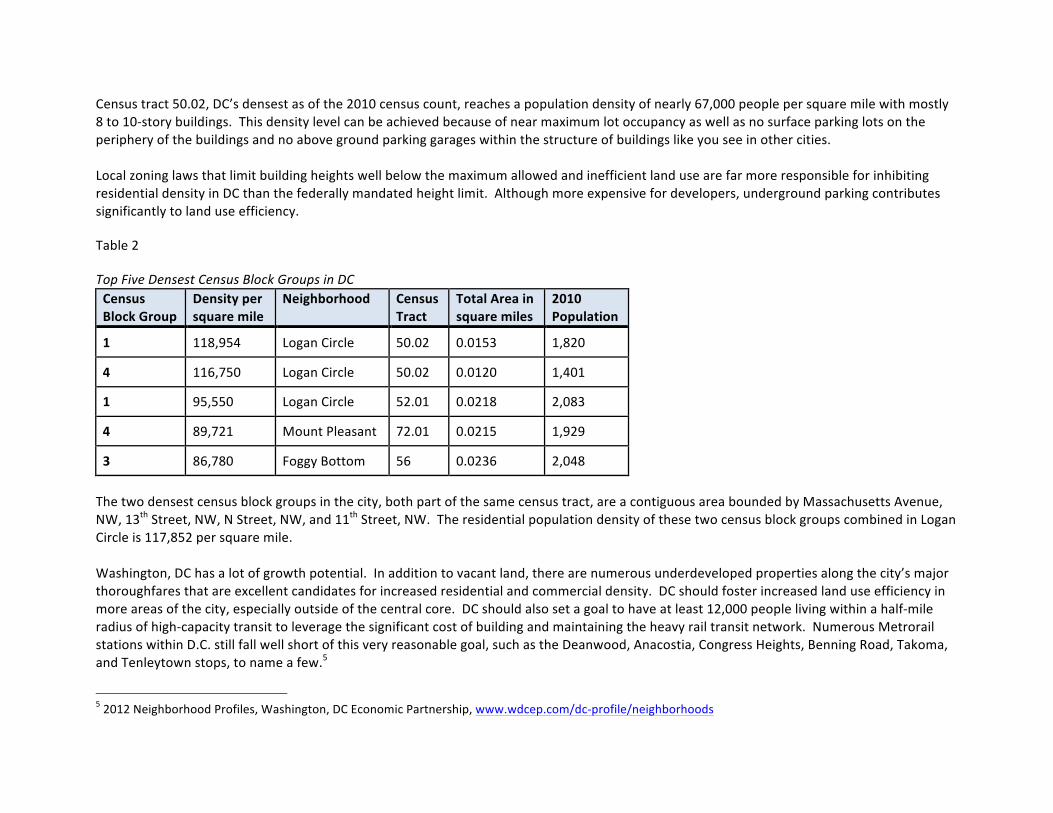
Census tract 50.02, DC’s densest as of the 2010 census count, reaches a population density of nearly 67,000 people per square mile with mostly 8 to 10-‐story buildings. This density level can be achieved because of near maximum lot occupancy as well as no surface parking lots on the periphery of the buildings and no above ground parking garages within the structure of buildings like you see in other cities. Local zoning laws that limit building heights well below the maximum allowed and inefficient land use are far more responsible for inhibiting residential density in DC than the federally mandated height limit. Although more expensive for developers, underground parking contributes significantly to land use efficiency. Table 2 Top Five Densest Census Block Groups in DC Census Block Group
Density per square mile
Neighborhood Census Tract
Total Area in square miles
2010 Population
1 118,954 Logan Circle 50.02 0.0153 1,820
4 116,750 Logan Circle 50.02 0.0120 1,401
1 95,550 Logan Circle 52.01 0.0218 2,083
4 89,721 Mount Pleasant 72.01 0.0215 1,929
3 86,780 Foggy Bottom 56 0.0236 2,048
The two densest census block groups in the city, both part of the same census tract, are a contiguous area bounded by Massachusetts Avenue, NW, 13th Street, NW, N Street, NW, and 11th Street, NW. The residential population density of these two census block groups combined in Logan Circle is 117,852 per square mile. Washington, DC has a lot of growth potential. In addition to vacant land, there are numerous underdeveloped properties along the city’s major thoroughfares that are excellent candidates for increased residential and commercial density. DC should foster increased land use efficiency in more areas of the city, especially outside of the central core. DC should also set a goal to have at least 12,000 people living within a half-‐mile radius of high-‐capacity transit to leverage the significant cost of building and maintaining the heavy rail transit network. Numerous Metrorail stations within D.C. still fall well short of this very reasonable goal, such as the Deanwood, Anacostia, Congress Heights, Benning Road, Takoma, and Tenleytown stops, to name a few.5
5 2012 Neighborhood Profiles, Washington, DC Economic Partnership, www.wdcep.com/dc-‐profile/neighborhoods
Washington, D.C. Residential Population Density Analysis by Census Tract and Block Group – 2010 J. Otavio Thompson, Author. Email: [email protected] 3
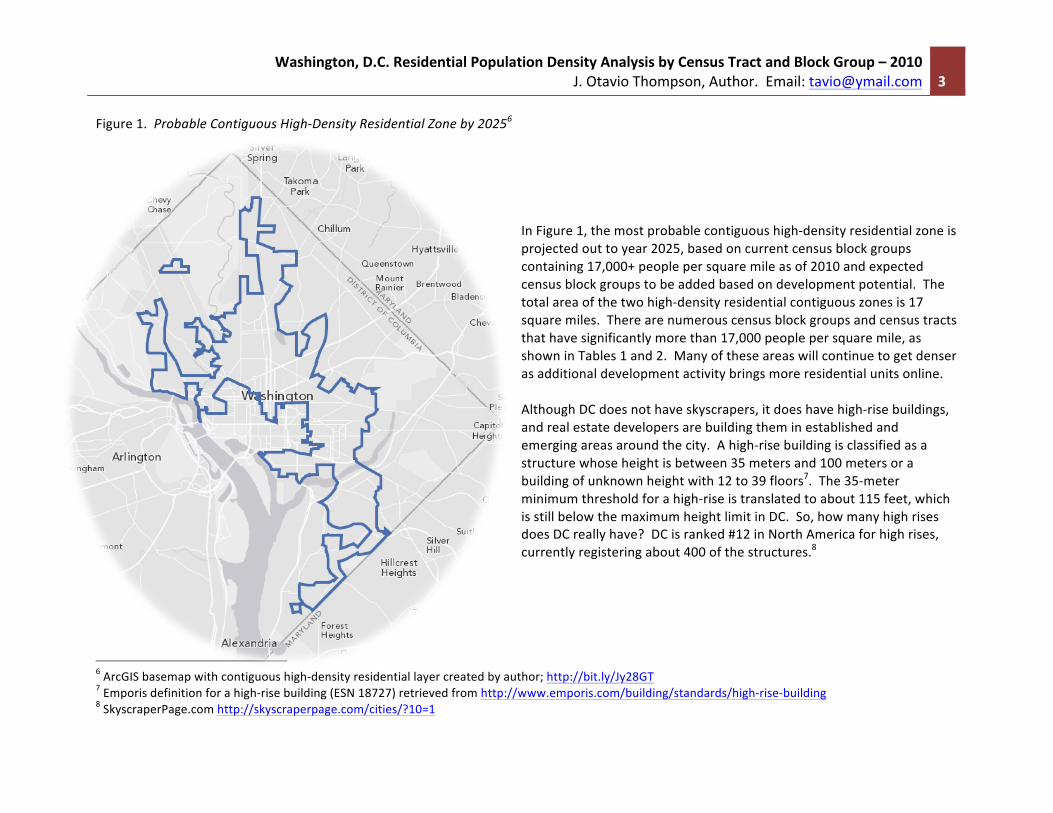
Figure 1. Probable Contiguous High-‐Density Residential Zone by 20256
In Figure 1, the most probable contiguous high-‐density residential zone is projected out to year 2025, based on current census block groups containing 17,000+ people per square mile as of 2010 and expected census block groups to be added based on development potential. The total area of the two high-‐density residential contiguous zones is 17 square miles. There are numerous census block groups and census tracts that have significantly more than 17,000 people per square mile, as shown in Tables 1 and 2. Many of these areas will continue to get denser as additional development activity brings more residential units online. Although DC does not have skyscrapers, it does have high-‐rise buildings, and real estate developers are building them in established and emerging areas around the city. A high-‐rise building is classified as a structure whose height is between 35 meters and 100 meters or a building of unknown height with 12 to 39 floors7. The 35-‐meter minimum threshold for a high-‐rise is translated to about 115 feet, which is still below the maximum height limit in DC. So, how many high rises does DC really have? DC is ranked #12 in North America for high rises, currently registering about 400 of the structures.8
6 ArcGIS basemap with contiguous high-‐density residential layer created by author; http://bit.ly/Jy28GT 7 Emporis definition for a high-‐rise building (ESN 18727) retrieved from http://www.emporis.com/building/standards/high-‐rise-‐building 8 SkyscraperPage.com http://skyscraperpage.com/cities/?10=1
Recommended