
Democratizing Innovation


Eric von Hippel
Democratizing Innovation
The MIT Press
Cambridge, Massachusetts
London, England
© 2005 Eric von Hippel
Exclusive rights to publish and sell this book in print form in English are licensed to
The MIT Press. All other rights are reserved by the author. An electronic version of
this book is available under a Creative Commons license.
MIT Press books may be purchased at special quantity discounts for business or sales
promotional use. For information, please email [email protected] or
write to Special Sales Department, The MIT Press, 5 Cambridge Center, Cambridge,
MA 02142.
Set in Stone sans and Stone serif by The MIT Press. Printed and bound in the United
States of America.
Library of Congress Cataloging-in-Publication Data
Hippel, Eric von.
Democratizing innovation / Eric von Hippel.
p. cm.
Includes bibliographical references and index.
ISBN 0-262-00274-4
1. Technological innovations—Economic aspects. 2. Diffusion of innovations.
3. Democracy. I. Title.
HC79.T4H558 2005
338'.064—dc22 2004061060
10 9 8 7 6 5 4 3 2

Dedicated to all who are building the information commons.

Contents
Acknowledgements ix
1 Introduction and Overview 1
2 Development of Products by Lead Users 19
3 Why Many Users Want Custom Products 33
4 Users’ Innovate-or-Buy Decisions 45
5 Users’ Low-Cost Innovation Niches 63
6 Why Users Often Freely Reveal Their Innovations 77
7 Innovation Communities 93
8 Adapting Policy to User Innovation 107
9 Democratizing Innovation 121
10 Application: Searching for Lead User Innovations 133
11 Application: Toolkits for User Innovation and Custom Design 147
12 Linking User Innovation to Other Phenomena and Fields 165
Notes 179
Bibliography 183
Index 197

Acknowledgements
Early in my research on the democratization of innovation I was very for-
tunate to gain five major academic mentors and friends. Nathan Rosenberg,
Richard Nelson, Zvi Griliches, Edwin Mansfield, and Ann Carter all pro-
vided crucial support as I adopted economics as the organizing framework
and toolset for my work. Later, I collaborated with a number of wonderful
co-authors, all of whom are friends as well: Stan Finkelstein, Nikolaus
Franke, Dietmar Harhoff, Joachim Henkel, Cornelius Herstatt, Ralph Katz,
Georg von Krogh, Karim Lakhani, Gary Lilien, Christian Luthje, Pamela
Morrison, William Riggs, John Roberts, Stephan Schrader, Mary Sonnack,
Stefan Thomke, Marcie Tyre, and Glen Urban. Other excellent research col-
laborators and friends of long standing include Carliss Baldwin, Sonali
Shah, Sarah Slaughter, and Lars Jeppesen.
At some point as interest in a topic grows, there is a transition from
dyadic academic relationships to a real research community. In my case, the
essential person in enabling that transition was my close friend and col-
league Dietmar Harhoff. He began to send wonderful Assistant Professors
(Habilitanden) over from his university, Ludwig Maximilians Universität in
Munich, to do collaborative research with me as MIT Visiting Scholars. They
worked on issues related to the democratization of innovation while at MIT
and then carried on when they returned to Europe. Now they are training
others in their turn.
I have also greatly benefited from close contacts with colleagues in
industry. As Director of the MIT Innovation Lab, I work together with
senior innovation managers in just a few companies to develop and try out
innovation tools in actual company settings. Close intellectual colleagues
and friends of many years standing in this sphere include Jim Euchner
from Pitney-Bowes, Mary Sonnack and Roger Lacey from 3M, John Wright
from IFF, Dave Richards from Nortel Networks, John Martin from Verizon,
Ben Hyde from the Apache Foundation, Brian Behlendorf from the Apache
Foundation and CollabNet, and Joan Churchill and Susan Hiestand from
Lead User Concepts. Thank you so much for the huge (and often humbling)
insights that your and our field experimentation has provided!
I am also eager to acknowledge and thank my family for the joy and
learning they experience and share with me. My wife Jessie is a professional
editor and edited my first book in a wonderful way. For this book, however,
time devoted to bringing up the children made a renewed editorial collab-
oration impossible. I hope the reader will not suffer unduly as a conse-
quence! My children Christiana Dagmar and Eric James have watched me
work on the book—indeed they could not avoid it as I often write at home.
I hope they have been drawing the lesson that academic research can be
really fun. Certainly, that is the lesson I drew from my father, Arthur von
Hippel. He wrote his books in his study upstairs when I was a child and
would often come down to the kitchen for a cup of coffee. In transit, he
would throw up his hands and say, to no one in particular, “Why do I
choose to work on such difficult problems?” And then he would look
deeply happy. Dad, I noticed the smile!
Finally my warmest thanks to my MIT colleagues and students and also
to MIT as an institution. MIT is a really inspiring place to work and learn
from others. We all understand the requirements for good research and
learning, and we all strive to contribute to a very supportive academic envi-
ronment. And, of course, new people are always showing up with new and
interesting ideas, so fun and learning are always being renewed!
x Acknowledgements

Democratizing Innovation

1 Introduction and Overview
When I say that innovation is being democratized, I mean that users of
products and services—both firms and individual consumers—are increas-
ingly able to innovate for themselves. User-centered innovation processes
offer great advantages over the manufacturer-centric innovation develop-
ment systems that have been the mainstay of commerce for hundreds of
years. Users that innovate can develop exactly what they want, rather than
relying on manufacturers to act as their (often very imperfect) agents.
Moreover, individual users do not have to develop everything they need on
their own: they can benefit from innovations developed and freely shared
by others.
The trend toward democratization of innovation applies to information
products such as software and also to physical products. As a quick illustra-
tion of the latter, consider the development of high-performance windsurf-
ing techniques and equipment in Hawaii by an informal user group.
High-performance windsurfing involves acrobatics such as jumps and flips
and turns in mid-air. Larry Stanley, a pioneer in high-performance wind-
surfing, described the development of a major innovation in technique and
equipment to Sonali Shah:
In 1978 Jürgen Honscheid came over from West Germany for the first Hawaiian
World Cup and discovered jumping, which was new to him, although Mike Horgan
and I were jumping in 1974 and 1975. There was a new enthusiasm for jumping and
we were all trying to outdo each other by jumping higher and higher. The problem
was that . . . the riders flew off in mid-air because there was no way to keep the board
with you—and as a result you hurt your feet, your legs, and the board.
Then I remembered the “Chip,” a small experimental board we had built with
footstraps, and thought “it’s dumb not to use this for jumping.” That’s when I first
started jumping with footstraps and discovering controlled flight. I could go so much
faster than I ever thought and when you hit a wave it was like a motorcycle rider
hitting a ramp; you just flew into the air. All of a sudden not only could you fly into
the air, but you could land the thing, and not only that, but you could change direc-
tion in the air!
The whole sport of high-performance windsurfing really started from that. As soon
as I did it, there were about ten of us who sailed all the time together and within one
or two days there were various boards out there that had footstraps of various kinds
on them, and we were all going fast and jumping waves and stuff. It just kind of
snowballed from there. (Shah 2000)
By 1998, more than a million people were engaged in windsurfing, and a
large fraction of the boards sold incorporated the user-developed innova-
tions for the high-performance sport.
The user-centered innovation process just illustrated is in sharp contrast
to the traditional model, in which products and services are developed by
manufacturers in a closed way, the manufacturers using patents, copyrights,
and other protections to prevent imitators from free riding on their inno-
vation investments. In this traditional model, a user’s only role is to have
needs, which manufacturers then identify and fill by designing and pro-
ducing new products. The manufacturer-centric model does fit some fields
and conditions. However, a growing body of empirical work shows that
users are the first to develop many and perhaps most new industrial and
consumer products. Further, the contribution of users is growing steadily
larger as a result of continuing advances in computer and communications
capabilities.
In this book I explain in detail how the emerging process of user-centric,
democratized innovation works. I also explain how innovation by users
provides a very necessary complement to and feedstock for manufacturer
innovation.
The ongoing shift of innovation to users has some very attractive qual-
ities. It is becoming progressively easier for many users to get precisely
what they want by designing it for themselves. And innovation by users
appears to increase social welfare. At the same time, the ongoing shift of
product-development activities from manufacturers to users is painful and
difficult for many manufacturers. Open, distributed innovation is “attack-
ing” a major structure of the social division of labor. Many firms and
industries must make fundamental changes to long-held business models
in order to adapt. Further, governmental policy and legislation sometimes
preferentially supports innovation by manufacturers. Considerations of
social welfare suggest that this must change. The workings of the intellec-
2 Chapter 1
tual property system are of special concern. But despite the difficulties, a
democratized and user-centric system of innovation appears well worth
striving for.
Users, as the term will be used in this book, are firms or individual con-
sumers that expect to benefit from using a product or a service. In contrast,
manufacturers expect to benefit from selling a product or a service. A firm
or an individual can have different relationships to different products or
innovations. For example, Boeing is a manufacturer of airplanes, but it is
also a user of machine tools. If we were examining innovations developed
by Boeing for the airplanes it sells, we would consider Boeing a manufac-
turer-innovator in those cases. But if we were considering innovations in
metal-forming machinery developed by Boeing for in-house use in build-
ing airplanes, we would categorize those as user-developed innovations
and would categorize Boeing as a user-innovator in those cases.
Innovation user and innovation manufacturer are the two general
“functional” relationships between innovator and innovation. Users are
unique in that they alone benefit directly from innovations. All others
(here lumped under the term “manufacturers”) must sell innovation-
related products or services to users, indirectly or directly, in order to profit
from innovations. Thus, in order to profit, inventors must sell or license
knowledge related to innovations, and manufacturers must sell products
or services incorporating innovations. Similarly, suppliers of innovation-
related materials or services—unless they have direct use for the innova-
tions—must sell the materials or services in order to profit from the
innovations.
The user and manufacturer categorization of relationships between
innovator and innovation can be extended to specific functions, attributes,
or features of products and services. When this is done, it may turn out
that different parties are associated with different attributes of a particular
product or service. For example, householders are the users of the switch-
ing attribute of a household electric light switch—they use it to turn lights
on and off. However, switches also have other attributes, such as “easy
wiring” qualities, that may be used only by the electricians who install
them. Therefore, if an electrician were to develop an improvement to the
installation attributes of a switch, it would be considered a user-developed
innovation.
A brief overview of the contents of the book follows.
Introduction and Overview 3
Development of Products by Lead Users (Chapter 2)
Empirical studies show that many users—from 10 percent to nearly 40 per-
cent—engage in developing or modifying products. About half of these
studies do not determine representative innovation frequencies; they were
designed for other purposes. Nonetheless, when taken together, the find-
ings make it very clear that users are doing a lot of product modification and
product development in many fields.
Studies of innovating users (both individuals and firms) show them to
have the characteristics of “lead users.” That is, they are ahead of the major-
ity of users in their populations with respect to an important market trend,
and they expect to gain relatively high benefits from a solution to the needs
they have encountered there. The correlations found between innovation
by users and lead user status are highly significant, and the effects are very
large.
Since lead users are at the leading edge of the market with respect to
important market trends, one can guess that many of the novel products
they develop for their own use will appeal to other users too and so might
provide the basis for products manufacturers would wish to commercial-
ize. This turns out to be the case. A number of studies have shown that
many of the innovations reported by lead users are judged to be
commercially attractive and/or have actually been commercialized by
manufacturers.
Research provides a firm grounding for these empirical findings. The
two defining characteristics of lead users and the likelihood that they will
develop new or modified products have been found to be highly corre-
lated (Morrison et al. 2004). In addition, it has been found that the higher
the intensity of lead user characteristics displayed by an innovator, the
greater the commercial attractiveness of the innovation that the lead user
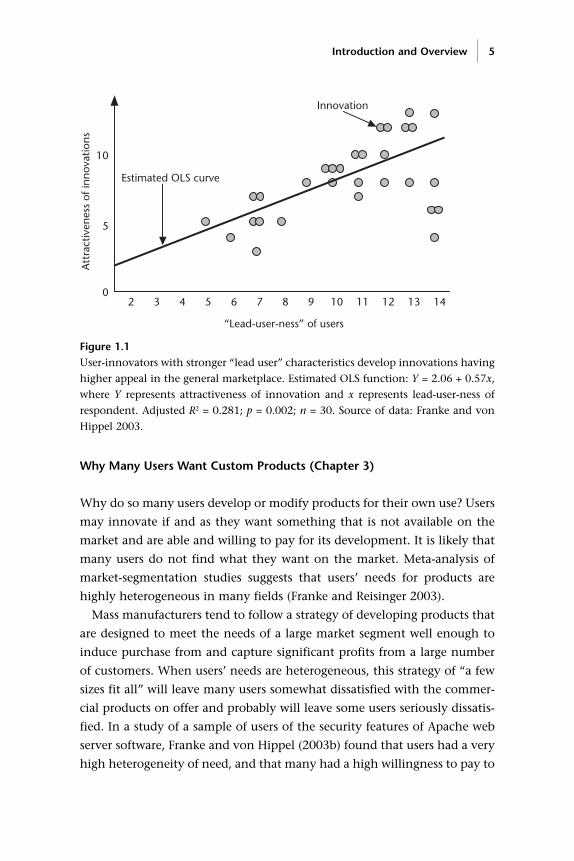
develops (Franke and von Hippel 2003a). In figure 1.1, the increased con-
centration of innovations toward the right indicates that the likelihood
of innovating is higher for users having higher lead user index values.
The rise in average innovation attractiveness as one moves from left to
right indicates that innovations developed by lead users tend to be more
commercially attractive. (Innovation attractiveness is the sum of the nov-
elty of the innovation and the expected future generality of market
demand.)
4 Chapter 1
Introduction and Overview 5
Why Many Users Want Custom Products (Chapter 3)
Why do so many users develop or modify products for their own use? Users
may innovate if and as they want something that is not available on the
market and are able and willing to pay for its development. It is likely that
many users do not find what they want on the market. Meta-analysis of
market-segmentation studies suggests that users’ needs for products are
highly heterogeneous in many fields (Franke and Reisinger 2003).
Mass manufacturers tend to follow a strategy of developing products that
are designed to meet the needs of a large market segment well enough to
induce purchase from and capture significant profits from a large number
of customers. When users’ needs are heterogeneous, this strategy of “a few
sizes fit all” will leave many users somewhat dissatisfied with the commer-
cial products on offer and probably will leave some users seriously dissatis-
fied. In a study of a sample of users of the security features of Apache web
server software, Franke and von Hippel (2003b) found that users had a very
high heterogeneity of need, and that many had a high willingness to pay to
2 3 4 5 6 7 8 9 10 11 12 13 14
10
5
0
Att
ract
iven
ess
of in
nova
tions
Innovation
Estimated OLS curve
“Lead-user-ness” of users
Figure 1.1 User-innovators with stronger “lead user” characteristics develop innovations having
higher appeal in the general marketplace. Estimated OLS function: Y = 2.06 + 0.57x,
where Y represents attractiveness of innovation and x represents lead-user-ness of
respondent. Adjusted R2 = 0.281; p = 0.002; n = 30. Source of data: Franke and von
Hippel 2003.
get precisely what they wanted. Nineteen percent of the users sampled actu-
ally innovated to tailor Apache more closely to their needs. Those who did
were found to be significantly more satisfied.
Users’ Innovate-or-Buy Decisions (Chapter 4)
Even if many users want “exactly right products” and are willing and able to
pay for their development, why do users often do this for themselves rather
than hire a custom manufacturer to develop a special just-right product for
them? After all, custom manufacturers specialize in developing products for
one or a few users. Since these firms are specialists, it is possible that they
could design and build custom products for individual users or user firms
faster, better, or cheaper than users could do this for themselves. Despite this
possibility, several factors can drive users to innovate rather than buy. Both
in the case of user firms and in the case of individual user-innovators, agency
costs play a major role. In the case of individual user-innovators, enjoyment
of the innovation process can also be important.
With respect to agency costs, consider that when a user develops its own
custom product that user can be trusted to act in its own best interests.
When a user hires a manufacturer to develop a custom product, the situa-
tion is more complex. The user is then a principal that has hired the cus-
tom manufacturer to act as its agent. If the interests of the principal and the
agent are not the same, there will be agency costs. In general terms, agency
costs are (1) costs incurred to monitor the agent to ensure that it (or he or
she) follows the interests of the principal, (2) the cost incurred by the agent
to commit itself not to act against the principal’s interest (the “bonding
cost”), and (3) costs associated with an outcome that does not fully serve
the interests of the principal (Jensen and Meckling 1976). In the specific
instance of product and service development, a major divergence of inter-
ests between user and custom manufacturer does exist: the user wants to get
precisely what it needs, to the extent that it can afford to do so. In contrast,
the custom manufacturer wants to lower its development costs by incorpo-
rating solution elements it already has or that it predicts others will want in
the future—even if by doing so it does not serve its present client’s needs as
well as it could.
A user wants to preserve its need specification because that specification
is chosen to make that user’s overall solution quality as high as possible at
6 Chapter 1
the desired price. For example, an individual user may specify a mountain-
climbing boot that will precisely fit his unique climbing technique and
allow him to climb Everest more easily. Any deviations in boot design will
require compensating modifications in the climber’s carefully practiced and
deeply ingrained climbing technique—a much more costly solution from
the user’s point of view. A custom boot manufacturer, in contrast, will have
a strong incentive to incorporate the materials and processes it has in stock
and expects to use in future even if this produces a boot that is not precisely
right for the present customer. For example, the manufacturer will not want
to learn a new way to bond boot components together even if that would
produce the best custom result for one client. The net result is that when
one or a few users want something special they will often get the best result
by innovating for themselves.
A small model of the innovate-or-buy decision follows. This model
shows in a quantitative way that user firms with unique needs will always
be better off developing new products for themselves. It also shows that
development by manufacturers can be the most economical option when n
or more user firms want the same thing. However, when the number of user
firms wanting the same thing falls between 1 and n, manufacturers may not
find it profitable to develop a new product for just a few users. In that case,
more than one user may invest in developing the same thing independ-
ently, owing to market failure. This results in a waste of resources from the
point of view of social welfare. The problem can be addressed by new insti-
tutional forms, such as the user innovation communities that will be stud-
ied later in this book.
Chapter 4 concludes by pointing out that an additional incentive can
drive individual user-innovators to innovate rather than buy: they may
value the process of innovating because of the enjoyment or learning that it
brings them. It might seem strange that user-innovators can enjoy product
development enough to want to do it themselves—after all, manufacturers
pay their product developers to do such work! On the other hand, it is also
clear that enjoyment of problem solving is a motivator for many individual
problem solvers in at least some fields. Consider for example the millions of
crossword-puzzle aficionados. Clearly, for these individuals enjoyment of
the problem-solving process rather than the solution is the goal. One can
easily test this by attempting to offer a puzzle solver a completed puzzle—
the very output he or she is working so hard to create. One will very likely
Introduction and Overview 7
be rejected with the rebuke that one should not spoil the fun! Pleasure as a
motivator can apply to the development of commercially useful innova-
tions as well. Studies of the motivations of volunteer contributors of code
to widely used software products have shown that these individuals too are
often strongly motivated to innovate by the joy and learning they find in
this work (Hertel et al. 2003; Lakhani and Wolf 2005).
Users’ Low-Cost Innovation Niches (Chapter 5)
An exploration of the basic processes of product and service development
show that users and manufacturers tend to develop different types of inno-
vations. This is due in part to information asymmetries: users and manufac-
turers tend to know different things. Product developers need two types of
information in order to succeed at their work: need and context-of-use infor-
mation (generated by users) and generic solution information (often initially
generated by manufacturers specializing in a particular type of solution).
Bringing these two types of information together is not easy. Both need
information and solution information are often very “sticky”—that is, costly
to move from the site where the information was generated to other sites. As
a result, users generally have a more accurate and more detailed model of
their needs than manufacturers have, while manufacturers have a better
model of the solution approach in which they specialize than the user has.
When information is sticky, innovators tend to rely largely on information
they already have in stock. One consequence of the information asymmetry
between users and manufacturers is that users tend to develop innovations
that are functionally novel, requiring a great deal of user-need information
and use-context information for their development. In contrast, manufac-
turers tend to develop innovations that are improvements on well-known
needs and that require a rich understanding of solution information for their
development. For example, firms that use inventory-management systems,
such as retailers, tend to be the developers of new approaches to inventory
management. In contrast, manufacturers of inventory-management systems
and equipment tend to develop improvements to the equipment used to
implement these user-devised approaches (Ogawa 1998).
If we extend the information-asymmetry argument one step further, we
see that information stickiness implies that information on hand will also
differ among individual users and manufacturers. The information assets of
8 Chapter 1
some particular user (or some particular manufacturer) will be closest to
what is required to develop a particular innovation, and so the cost of devel-
oping that innovation will be relatively low for that user or manufacturer.
The net result is that user innovation activities will be distributed across
many users according to their information endowments. With respect to
innovation, one user is by no means a perfect substitute for another.
Why Users Often Freely Reveal Their Innovations (Chapter 6)
The social efficiency of a system in which individual innovations are devel-
oped by individual users is increased if users somehow diffuse what they
have developed to others. Manufacturer-innovators partially achieve this
when they sell a product or a service on the open market (partially because
they diffuse the product incorporating the innovation, but often not all the
information that others would need to fully understand and replicate it). If
user-innovators do not somehow also diffuse what they have done, multi-
ple users with very similar needs will have to independently develop very
similar innovations—a poor use of resources from the viewpoint of social
welfare. Empirical research shows that users often do achieve widespread
diffusion by an unexpected means: they often “freely reveal” what they
have developed. When we say that an innovator freely reveals information
about a product or service it has developed, we mean that all intellectual
property rights to that information are voluntarily given up by the innova-
tor, and all interested parties are given access to it—the information
becomes a public good.
The empirical finding that users often freely reveal their innovations has
been a major surprise to innovation researchers. On the face of it, if a user-
innovator’s proprietary information has value to others, one would think
that the user would strive to prevent free diffusion rather than help others
to free ride on what it has developed at private cost. Nonetheless, it is now
very clear that individual users and user firms—and sometimes manufac-
turers—often freely reveal detailed information about their innovations.
The practices visible in “open source” software development were impor-
tant in bringing this phenomenon to general awareness. In these projects it
was clear policy that project contributors would routinely and systematically
freely reveal code they had developed at private expense (Raymond 1999).
However, free revealing of product innovations has a history that began
Introduction and Overview 9
long before the advent of open source software. Allen, in his 1983 study of
the eighteenth-century iron industry, was probably the first to consider the
phenomon systematically. Later, Nuvolari (2004) discussed free revealing in
the early history of mine pumping engines. Contemporary free revealing by
users has been documented by von Hippel and Finkelstein (1979) for med-
ical equipment, by Lim (2000) for semiconductor process equipment, by
Morrison, Roberts, and von Hippel (2000) for library information systems,
and by Franke and Shah (2003) for sporting equipment. Henkel (2003) has
documented free revealing among manufacturers in the case of embedded
Linux software.
Innovators often freely reveal because it is often the best or the only prac-
tical option available to them. Hiding an innovation as a trade secret is
unlikely to be successful for long: too many generally know similar things,
and some holders of the “secret” information stand to lose little or nothing
by freely revealing what they know. Studies find that innovators in many
fields view patents as having only limited value. Copyright protection and
copyright licensing are applicable only to “writings,” such as books, graphic
images, and computer software.
Active efforts by innovators to freely reveal—as opposed to sullen accept-
ance—are explicable because free revealing can provide innovators with sig-
nificant private benefits as well as losses or risks of loss. Users who freely
reveal what they have done often find that others then improve or suggest
improvements to the innovation, to mutual benefit (Raymond 1999). Freely
revealing users also may benefit from enhancement of reputation, from
positive network effects due to increased diffusion of their innovation, and
from other factors. Being the first to freely reveal a particular innovation
can also enhance the benefits received, and so there can actually be a rush
to reveal, much as scientists rush to publish in order to gain the benefits
associated with being the first to have made a particular advancement.
Innovation Communities (Chapter 7)
Innovation by users tends to be widely distributed rather than concentrated
among just a very few very innovative users. As a result, it is important for
user-innovators to find ways to combine and leverage their efforts. Users
achieve this by engaging in many forms of cooperation. Direct, informal
user-to-user cooperation (assisting others to innovate, answering questions,
10 Chapter 1
and so on) is common. Organized cooperation is also common, with users
joining together in networks and communities that provide useful struc-
tures and tools for their interactions and for the distribution of innovations.
Innovation communities can increase the speed and effectiveness with
which users and also manufacturers can develop and test and diffuse their
innovations. They also can greatly increase the ease with which innovators
can build larger systems from interlinkable modules created by community
participants.
Free and open source software projects are a relatively well-developed and
very successful form of Internet-based innovation community. However,
innovation communities are by no means restricted to software or even to
information products, and they can play a major role in the development
of physical products. Franke and Shah (2003) have documented the value
that user innovation communities can provide to user-innovators develop-
ing physical products in the field of sporting equipment. The analogy to
open source innovation communities is clear.
The collective or community effort to provide a public good—which is
what freely revealed innovations are—has traditionally been explored in
the literature on “collective action.” However, behaviors seen in extant
innovation communities fail to correspond to that literature at major
points. In essence, innovation communities appear to be more robust with
respect to recruiting and rewarding members than the literature would pre-
dict. Georg von Krogh and I attribute this to innovation contributors’
obtaining some private rewards that are not shared equally by free riders
(those who take without contributing). For example, a product that a user-
innovator develops and freely reveals might be perfectly suited to that
user-innovator’s requirements but less well suited to the requirements of
free riders. Innovation communities thus illustrate a “private-collective”
model of innovation incentive (von Hippel and von Krogh 2003).
Adapting Policy to User Innovation (Chapter 8)
Is innovation by users a “good thing?” Welfare economists answer such a
question by studying how a phenomenon or a change affects social welfare.
Henkel and von Hippel (2005) explored the social welfare implications of
user innovation. They found that, relative to a world in which only manu-
facturers innovate, social welfare is very probably increased by the presence
Introduction and Overview 11
of innovations freely revealed by users. This finding implies that policy
making should support user innovation, or at least should ensure that leg-
islation and regulations do not favor manufacturers at the expense of user-
innovators.
The transitions required of policy making to achieve neutrality with
respect to user innovation vs. manufacturer innovation are significant.
Consider the impact on open and distributed innovation of past and cur-
rent policy decisions. Research done in the past 30 years has convinced
many academics that intellectual property law is sometimes or often not
having its intended effect. Intellectual property law was intended to
increase the amount of innovation investment. Instead, it now appears that
there are economies of scope in both patenting and copyright that allow
firms to use these forms of intellectual property law in ways that are directly
opposed to the intent of policy makers and to the public welfare. Major
firms can invest to develop large portfolios of patents. They can then use
these to create “patent thickets”—dense networks of patent claims that give
them plausible grounds for threatening to sue across a wide range of intel-
lectual property. They may do this to prevent others from introducing a
superior innovation and/or to demand licenses from weaker competitors on
favorable terms (Shapiro 2001). Movie, publishing, and software firms can
use large collections of copyrighted work to a similar purpose (Benkler
2002). In view of the distributed nature of innovation by users, with each
tending to create a relatively small amount of intellectual property, users are
likely to be disadvantaged by such strategies.
It is also important to note that users (and manufacturers) tend to build
prototypes of their innovations economically by modifying products
already available on the market to serve a new purpose. Laws such as the
(US) Digital Millennium Copyright Act, intended to prevent consumers
from illegally copying protected works, also can have the unintended side
effect of preventing users from modifying products that they purchase
(Varian 2002). Both fairness and social welfare considerations suggest that
innovation-related policies should be made neutral with respect to the
sources of innovation.
It may be that current impediments to user innovation will be solved by
legislation or by policy making. However, beneficiaries of existing law and
policy will predictably resist change. Fortunately, a way to get around some
of these problems is in the hands of innovators themselves. Suppose many
12 Chapter 1
innovators in a particular field decide to freely reveal what they have devel-
oped, as they often have reason to do. In that case, users can collectively
create an information commons (a collection of information freely avail-
able to all) containing substitutes for some or a great deal of information
now held as private intellectual property. Then user-innovators can work
around the strictures of intellectual property law by simply using these
freely revealed substitutes (Lessig 2001). This is essentially what is happen-
ing in the field of software. For many problems, user-innovators in that field
now have a choice between proprietary, closed software provided by
Microsoft and other firms and open source software that they can legally
download from the Internet and legally modify to serve their own specific
needs.
Policy making that levels the playing field between users and manufac-
turers will force more rapid change onto manufacturers but will by no
means destroy them. Experience in fields where open and distributed inno-
vation processes are far advanced show how manufacturers can and do
adapt. Some, for example, learn to supply proprietary platform products
that offer user-innovators a framework upon which to develop and use their
improvements.
Democratizing Innovation (Chapter 9)
Users’ ability to innovate is improving radically and rapidly as a result of the
steadily improving quality of computer software and hardware, improved
access to easy-to-use tools and components for innovation, and access to a
steadily richer innovation commons. Today, user firms and even individual
hobbyists have access to sophisticated programming tools for software and
sophisticated CAD design tools for hardware and electronics. These infor-
mation-based tools can be run on a personal computer, and they are rapidly
coming down in price. As a consequence, innovation by users will continue
to grow even if the degree of heterogeneity of need and willingness to invest
in obtaining a precisely right product remains constant.
Equivalents of the innovation resources described above have long been
available within corporations to a few. Senior designers at firms have long
been supplied with engineers and designers under their direct control, and
with the resources needed to quickly construct and test prototype designs.
The same is true in other fields, including automotive design and clothing
Introduction and Overview 13
design: just think of the staffs of engineers and modelmakers supplied so
that top auto designers can quickly realize and test their designs.
But if, as we have seen, the information needed to innovate in important
ways is widely distributed, the traditional pattern of concentrating innova-
tion-support resources on a few individuals is hugely inefficient. High-cost
resources for innovation support cannot efficiently be allocated to “the
right people with the right information:” it is very difficult to know who
these people may be before they develop an innovation that turns out to
have general value. When the cost of high-quality resources for design and
prototyping becomes very low (the trend we have described), these
resources can be diffused very widely, and the allocation problem dimin-
ishes in significance. The net result is and will be to democratize the oppor-
tunity to create.
On a level playing field, users will be an increasingly important source of
innovation and will increasingly substitute for or complement manufactur-
ers’ innovation-related activities. In the case of information products, users
have the possibility of largely or completely doing without the services of
manufacturers. Open source software projects are object lessons that teach
us that users can create, produce, diffuse, provide user field support for,
update, and use complex products by and for themselves in the context of
user innovation communities. In physical product fields, product develop-
ment by users can evolve to the point of largely or totally supplanting
product development—but not product manufacturing—by manufacturers.
(The economies of scale associated with manufacturing and distributing
physical products give manufacturers an advantage over “do-it-yourself”
users in those activities.)
The evolving pattern of the locus of product development in kitesurfing
illustrates how users can displace manufacturers from the role of product
developer. In that industry, the collective product-design and testing work
of a user innovation community has clearly become superior in both qual-
ity and quantity relative to the levels of in-house development effort that
manufacturers of kitesurfing equipment can justify. Accordingly, manufac-
turers of such equipment are increasingly shifting away from product
design and focusing on producing product designs first developed and
tested by user innovation communities.
How can or should manufacturers adapt to users’ encroachment on ele-
ments of their traditional business activities? There are three general possi-
14 Chapter 1
bilities: (1) Produce user-developed innovations for general commercial sale
and/or offer custom manufacturing to specific users. (2) Sell kits of product-
design tools and/or “product platforms” to ease users’ innovation-related
tasks. (3) Sell products or services that are complementary to user-developed
innovations. Firms in fields where users are already very active in product
design are experimenting with all these possibilities.
Application: Searching for Lead User Innovations (Chapter 10)
Manufacturers design their innovation processes around the way they think
the process works. The vast majority of manufacturers still think that prod-
uct development and service development are always done by manufactur-
ers, and that their job is always to find a need and fill it rather than to
sometimes find and commercialize an innovation that lead users have
already developed. Accordingly, manufacturers have set up market-research
departments to explore the needs of users in the target market, product-
development groups to think up suitable products to address those needs,
and so forth. The needs and prototype solutions of lead users—if encoun-
tered at all—are typically rejected as outliers of no interest. Indeed, when
lead users’ innovations do enter a firm’s product line—and they have been
shown to be the actual source of many major innovations for many firms—
they typically arrive with a lag and by an unconventional and unsystematic
route. For example, a manufacturer may “discover” a lead user innovation
only when the innovating user firm contacts the manufacturer with a pro-
posal to produce its design in volume to supply its own in-house needs. Or
sales or service people employed by a manufacturer may spot a promising
prototype during a visit to a customer’s site.
Modification of firms’ innovation processes to systematically search for
and further develop innovations created by lead users can provide manu-
facturers with a better interface to the innovation process as it actually
works, and so provide better performance. A natural experiment conducted
at 3M illustrates this possibility. Annual sales of lead user product ideas gen-
erated by the average lead user project at 3M were conservatively forecast
by management to be more than 8 times the sales forecast for new products
developed in the traditional manner—$146 million versus $18 million per
year. In addition, lead user projects were found to generate ideas for new
product lines, while traditional market-research methods were found to
Introduction and Overview 15
produce ideas for incremental improvements to existing product lines. As a
consequence, 3M divisions funding lead user project ideas experienced their
highest rate of major product line generation in the past 50 years (Lilien et
al. 2002).
Application: Toolkits for User Innovation and Custom Design (Chapter 11)
Firms that understand the distributed innovation process and users’ roles
in it can change factors affecting lead user innovation and so affect its rate
and direction in ways they value. Toolkits for user innovation custom
design offer one way of doing this. This approach involves partitioning
product-development and service-development projects into solution-
information-intensive subtasks and need-information-intensive subtasks.
Need-intensive subtasks are then assigned to users along with a kit of tools
that enable them to effectively execute the tasks assigned to them. The
resulting co-location of sticky information and problem-solving activity
makes innovation within the solution space offered by a particular toolkit
cheaper for users. It accordingly attracts them to the toolkit and so influ-
ences what they develop and how they develop it. The custom semicon-
ductor industry was an early adopter of toolkits. In 2003, more than $15
billion worth of semiconductors were produced that had been designed
using this approach.
Manufacturers that adopt the toolkit approach to supporting and chan-
neling user innovation typically face major changes in their business mod-
els, and important changes in industry structure may also follow. For
example, as a result of the introduction of toolkits to the field of semicon-
ductor manufacture, custom semiconductor manufacturers—formerly
providers of both design and manufacturing services to customers—lost
much of the work of custom product design to customers. Many of these
manufacturers then became specialist silicon foundries, supplying produc-
tion services primarily. Manufacturers may or may not wish to make such
changes. However, experience in fields where toolkits have been deployed
shows that customers tend to prefer designing their own custom products
with the aid of a toolkit over traditional manufacturer-centric development
practices. As a consequence, the only real choice for manufacturers in a field
appropriate to the deployment of toolkits may be whether to lead or to fol-
low in the transition to toolkits.
16 Chapter 1
Linking User Innovation to Other Phenomena and Fields (Chapter 12)
In chapter 12 I discuss links between user innovation and some related
phenomena and literatures. With respect to phenomena, I point out the
relationship of user innovation to information communities, of which user
innovation communities are a subset. One open information community
is the online encyclopedia Wikipedia (www.wikipedia.org). Other such
communities include the many specialized Internet sites where individuals
with both common and rare medical conditions can find one another and
can find specialists in those conditions. Many of the advantages associated
with user innovation communities also apply to open information net-
works and communities. Analyses appropriate to information communi-
ties follow the same overall pattern as the analyses provided in this book
for innovation communities. However, they are also simpler, because in
open information communities there may be little or no proprietary infor-
mation being transacted and thus little or no risk of related losses for
participants.
Next I discuss links between user-centric innovation phenomena and
the literature on the economics of knowledge that have been forged by
Foray (2004) and Weber (2004). I also discuss how Porter’s 1991 work on
the competitive advantage of nations can be extended to incorporate find-
ings on nations’ lead users as product developers. Finally, I point out how
findings explained in this book link to and complement research on the
Social Construction of Technology (Pinch and Bijker 1987).
I conclude this introductory chapter by reemphasizing that user innova-
tion, free revealing, and user innovation communities will flourish under
many but not all conditions. What we know about manufacturer-centered
innovation is still valid; however, lead-user-centered innovation patterns
are increasingly important, and they present major new opportunities and
challenges for us all.
Introduction and Overview 17

2 Development of Products by Lead Users
The idea that novel products and services are developed by manufacturers
is deeply ingrained in both traditional expectations and scholarship. When
we as users of products complain about the shortcomings of an existing
product or wish for a new one, we commonly think that “they” should
develop it—not us. Even the conventional term for an individual end user,
“consumer,” implicitly suggests that users are not active in product and
service development. Nonetheless, there is now very strong empirical evi-
dence that product development and modification by both user firms and
users as individual consumers is frequent, pervasive, and important.
I begin this chapter by reviewing the evidence that many users indeed do
develop and modify products for their own use in many fields. I then show
that innovation is concentrated among lead users, and that lead users’ inno-
vations often become commercial products.
Many Users Innovate
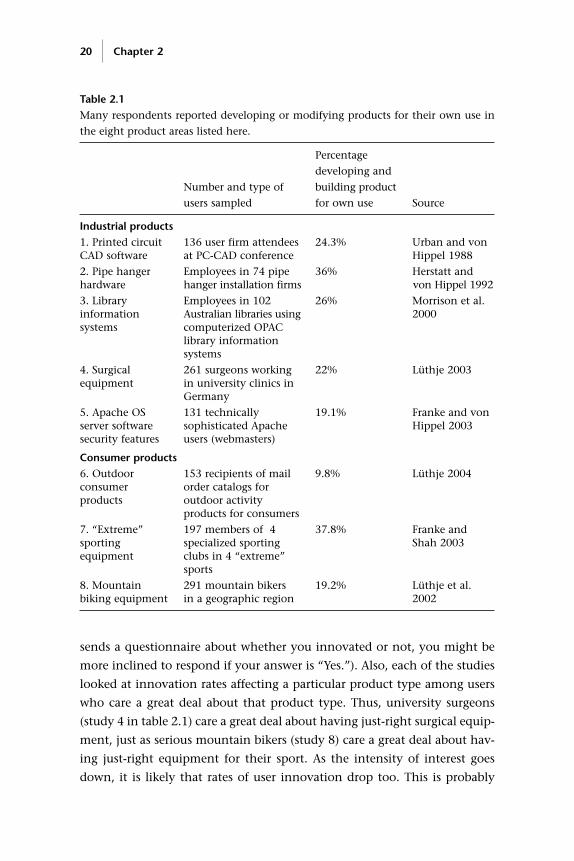
The evidence on user innovation frequency and pervasiveness is summa-
rized in table 2.1. We see here that the frequency with which user firms and
individual consumers develop or modify products for their own use range
from 10 percent to nearly 40 percent in fields studied to date. The matter
has been studied across a wide range of industrial product types where inno-
vating users are user firms, and also in various types of sporting equipment,
where innovating users are individual consumers.
The studies cited in table 2.1 clearly show that a lot of product develop-
ment and modification by users is going on. However, these findings should
not be taken to reflect innovation rates in overall populations of users. All of
the studies probably were affected by a response bias. (That is, if someone
sends a questionnaire about whether you innovated or not, you might be
more inclined to respond if your answer is “Yes.”). Also, each of the studies
looked at innovation rates affecting a particular product type among users
who care a great deal about that product type. Thus, university surgeons
(study 4 in table 2.1) care a great deal about having just-right surgical equip-
ment, just as serious mountain bikers (study 8) care a great deal about hav-
ing just-right equipment for their sport. As the intensity of interest goes
down, it is likely that rates of user innovation drop too. This is probably
20 Chapter 2
Table 2.1Many respondents reported developing or modifying products for their own use in
the eight product areas listed here.
Percentage
developing and
Number and type of building product
users sampled for own use Source
Industrial products1. Printed circuit 136 user firm attendees 24.3% Urban and vonCAD software at PC-CAD conference Hippel 1988
2. Pipe hanger Employees in 74 pipe 36% Herstatt and hardware hanger installation firms von Hippel 1992
3. Library Employees in 102 26% Morrison et al. information Australian libraries using 2000systems computerized OPAC
library information systems
4. Surgical 261 surgeons working 22% Lüthje 2003equipment in university clinics in
Germany
5. Apache OS 131 technically 19.1% Franke and von server software sophisticated Apache Hippel 2003security features users (webmasters)
Consumer products6. Outdoor 153 recipients of mail 9.8% Lüthje 2004consumer order catalogs for products outdoor activity
products for consumers
7. “Extreme” 197 members of 4 37.8% Franke and sporting specialized sporting Shah 2003equipment clubs in 4 “extreme”
sports
8. Mountain 291 mountain bikers 19.2% Lüthje et al. biking equipment in a geographic region 2002
what is going on in the case of the study of purchasers of outdoor consumer
products (study 6). All we are told about that sample of users of outdoor
consumer products is that they are recipients of one or more mail order
catalogs from suppliers of relatively general outdoor items—winter jackets,
sleeping bags, and so on. Despite the fact that these users were asked if they
have developed or modified any item in this broad category of goods (rather
than a very specific one such as a mountain bike), just 10 percent answered
in the affirmative. Of course, 10 percent or even 5 percent of a user popu-
lation numbering in the tens of millions worldwide is still a very large
number—so we again realize that many users are developing and modify-
ing products.
The cited studies also do not set an upper or a lower bound on the com-
mercial or technical importance of user-developed products and product
modifications that they report, and it is likely that most are of minor sig-
nificance. However, most innovations from any source are minor, so user-
innovators are no exception in this regard. Further, to say an innovation is
minor is not the same as saying it is trivial: minor innovations are cumula-
tively responsible for much or most technical progress. Hollander (1965)
found that about 80 percent of unit cost reductions in Rayon manufacture
were the cumulative result of minor technical changes. Knight (1963, VII,
pp. 2–3) measured performance advances in general-purpose digital com-
puters and found, similarly, that “these advances occur as the result of
equipment designers using their knowledge of electronics technology to
produce a multitude of small improvements that together produce signifi-
cant performance advances.”
Although most products and product modifications that users or others
develop will be minor, users are by no means restricted to developing minor
or incremental innovations. Qualitative observations have long indicated
that important process improvements are developed by users. Smith (1776,
pp. 11–13) pointed out the importance of “the invention of a great number
of machines which facilitate and abridge labor, and enable one man to do
the work of many.” He also noted that “a great part of the machines made
use of in those manufactures in which labor is most subdivided, were orig-
inally the invention of common workmen, who, being each of them
employed in some very simple operation, naturally turned their thoughts
towards finding out easier and readier methods of performing it.”
Rosenberg (1976) studied the history of the US machine tool industry and
Development of Products by Lead Users 21
found that important and basic machine types like lathes and milling
machines were first developed and built by user firms having a strong need
for them. Textile manufacturing firms, gun manufacturers and sewing
machine manufacturers were important early user-developers of machine
tools. Other studies show quantitatively that some of the most important
and novel products and processes have been developed by user firms and
by individual users. Enos (1962) reported that nearly all the most important
innovations in oil refining were developed by user firms. Freeman (1968)
found that the most widely licensed chemical production processes were
developed by user firms. Von Hippel (1988) found that users were the devel-
opers of about 80 percent of the most important scientific instrument inno-
vations, and also the developers of most of the major innovations in
semiconductor processing. Pavitt (1984) found that a considerable fraction
of invention by British firms was for in-house use. Shah (2000) found that
the most commercially important equipment innovations in four sporting
fields tended to be developed by individual users.
Lead User Theory
A second major finding of empirical research into innovation by users is
that most user-developed products and product modifications (and the
most commercially attractive ones) are developed by users with “lead user”
characteristics. Recall from chapter 1 that lead users are defined as members
of a user population having two distinguishing characteristics: (1) They are
at the leading edge of an important market trend(s), and so are currently
experiencing needs that will later be experienced by many users in that
market. (2) They anticipate relatively high benefits from obtaining a solu-
tion to their needs, and so may innovate.
The theory that led to defining “lead users” in terms of these two charac-
teristics was derived as follows (von Hippel 1986). First, the “ahead on an
important market trend” variable was included because of its assumed effect
on the commercial attractiveness of innovations developed by users resid-
ing at a leading-edge position in a market. Market needs are not static—they
evolve, and often they are driven by important underlying trends. If people
are distributed with respect to such trends as diffusion theory indicates,
then people at the leading edges of important trends will be experiencing
needs today (or this year) that the bulk of the market will experience tomor-
22 Chapter 2
row (or next year). And, if users develop and modify products to satisfy their
own needs, then the innovations that lead users develop should later be
attractive to many. The expected benefits variable and its link to innovation
likelihood was derived from studies of industrial product and process inno-
vations. These showed that the greater the benefit an entity expects to
obtain from a needed innovation, the greater will be that entity’s invest-
ment in obtaining a solution, where a solution is an innovation either
developed or purchased (Schmookler 1966; Mansfield 1968).
Empirical studies to date have confirmed lead user theory. Morrison,
Roberts, and Midgely (2004) studied the characteristics of innovating and
non-innovating users of computerized library information systems in a
sample of Australian libraries. They found that the two lead user character-
istics were distributed in a continuous, unimodal manner in that sample.
They also found that the two characteristics of lead users and the actual
development of innovations by users were highly correlated. Franke and
von Hippel (2003b) confirmed these findings in a study of innovating
and non-innovating users of Apache web server software. They also found
that the commercial attractiveness of innovations developed by users
increased along with the strength of those users’ lead user characteristics.
Evidence of Innovation by Lead Users
Several studies have found that user innovation is largely the province of
users that have lead user characteristics, and that products lead users
develop often form the basis for commercial products. These general find-
ings appear robust: the studies have used a variety of techniques and have
addressed a variety of markets and innovator types. Brief reviews of four
studies will convey the essence of what has been found.
Innovation in Industrial Product User Firms
In the first empirical study of lead users’ role in innovation, Urban and von
Hippel (1988) studied user innovation activity related to a type of software
used to design printed circuit boards. A major market trend to which
printed circuit computer-aided design software (PC-CAD) must respond is
the steady movement toward packing electronic circuitry more densely
onto circuit boards. Higher density means one that can shrink boards in
overall size and that enables the circuits they contain to operate faster—both
Development of Products by Lead Users 23
strongly desired attributes. Designing a board at the leading edge of what is
technically attainable in density at any particular time is a very demanding
task. It involves some combination of learning to make the printed circuit
wires narrower, learning how to add more layers of circuitry to a board, and
using smaller electronic components.
To explore the link between user innovation and needs at the leading
edge of the density trend, Urban and von Hippel collected a sample of 138
user-firm employees who had attended a trade show on the topic of PC-
CAD. To learn the position of each firm on the density trend, they asked
questions about the density of the boards that each PC-CAD user firm was
currently producing. To learn about each user’s likely expected benefits
from improvements to PC-CAD, they asked questions about how satisfied
each respondent was with their firm’s present PC-CAD capabilities. To
learn about users’ innovation activities, they asked questions about
whether each firm had modified or built its own PC-CAD software for its
own in-house use.
Users’ responses were cluster analyzed, and clear lead user (n = 38) and
non-lead-user (n = 98) clusters were found. Users in the lead user cluster were
those that made the densest boards on average and that also were dissatis-
fied with their PC-CAD capabilities. In other words, they were at the leading
edge of an important market trend, and they had a high incentive to inno-
vate to improve their capabilities. Strikingly, 87 percent of users in the lead
user cluster reported either developing or modifying the PC-CAD software
that they used. In contrast, only 1 percent of non-lead users reported this
type of innovation. Clearly, in this case user innovation was very strongly
concentrated in the lead user segment of the user population. A discrimi-
nant analysis on indicated that “build own system” was the most important
indicator of membership in the lead user cluster. The discriminant analysis
had 95.6 percent correct classification of cluster membership.
The commercial attractiveness of PC-CAD solutions developed by lead
users was high. This was tested by determining whether lead users and more
ordinary users preferred a new PC-CAD system concept containing features
developed by lead users over the best commercial PC-CAD system available
at the time of the study (as determined by a large PC-CAD system manu-
facturer’s competitive analysis) and two additional concepts. The concept
containing lead user features was significantly preferred at even twice the
price (p < 0.01).
24 Chapter 2
Innovation in Libraries
Morrison, Roberts, and von Hippel (2000) explored user modifications
made by Australian libraries to computerized information search systems
called Online Public Access systems (“OPACs”). Libraries might not seem
the most likely spot for technological innovators to lurk. However, com-
puter technologies and the Internet have had a major effect on how
libraries are run, and many libraries now have in-house programming
expertise. Computerized search methods for libraries were initially devel-
oped by advanced and technically sophisticated user institutions.
Development began in the United States in the 1970s with work by major
universities and the Library of Congress, with support provided by grants
from the federal government (Tedd 1994). Until roughly 1978, the only
such systems extant were those that had been developed by libraries for
their own use. In the late 1970s, the first commercial providers of com-
puterized search systems for libraries appeared in the United States, and by
1985 there were at least 48 OPAC vendors in the United States alone
(Matthews 1985). In Australia (site of the study sample), OPAC adoption
began about 8 years later than in the United States (Tedd 1994).
Morrison, Roberts, and I obtained responses from 102 Australian libraries
that were users of OPACs. We found that 26 percent of these had in fact
modified their OPAC hardware or software far beyond the user-adjustment
capabilities provided by the system manufacturers. The types of innova-
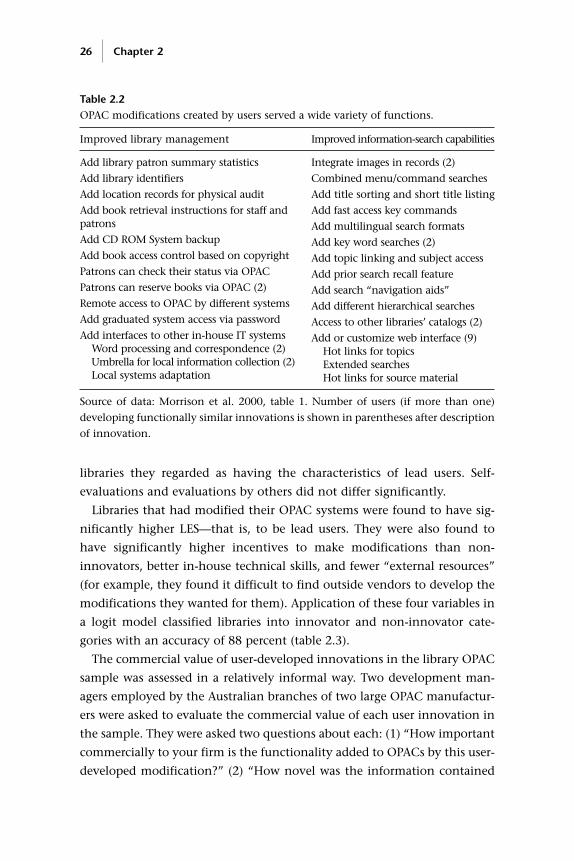
tions that the libraries developed varied widely according to local needs.
For example, the library that modified its OPAC to “add book retrieval
instructions for staff and patrons” (table 2.2) did so because its collection
of books was distributed in a complex way across a number of buildings—
making it difficult for staff and patrons to find books without precise direc-
tions. There was little duplication of innovations except in the case of
adding Internet search capabilities to OPACs. In that unusual case, nine
libraries went ahead and did the programming needed to add this impor-
tant feature in advance of its being offered by the manufacturers of their
systems.
The libraries in the sample were asked to rank themselves on a number
of characteristics, including “leading edge status” (LES). (Leading edge sta-
tus, a construct developed by Morrison, is related to and highly correlated
with the lead user construct (in this sample, ρ(LES, CLU)
= 0.904, p = 0.000).1
Self-evaluation bias was checked for by asking respondents to name other
Development of Products by Lead Users 25
libraries they regarded as having the characteristics of lead users. Self-
evaluations and evaluations by others did not differ significantly.
Libraries that had modified their OPAC systems were found to have sig-
nificantly higher LES—that is, to be lead users. They were also found to
have significantly higher incentives to make modifications than non-
innovators, better in-house technical skills, and fewer “external resources”
(for example, they found it difficult to find outside vendors to develop the
modifications they wanted for them). Application of these four variables in
a logit model classified libraries into innovator and non-innovator cate-
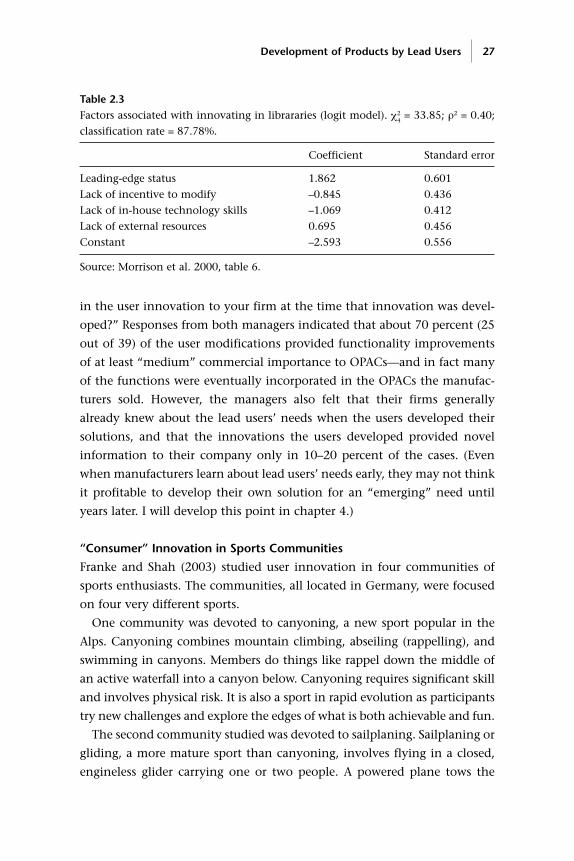
gories with an accuracy of 88 percent (table 2.3).
The commercial value of user-developed innovations in the library OPAC
sample was assessed in a relatively informal way. Two development man-
agers employed by the Australian branches of two large OPAC manufactur-
ers were asked to evaluate the commercial value of each user innovation in
the sample. They were asked two questions about each: (1) “How important
commercially to your firm is the functionality added to OPACs by this user-
developed modification?” (2) “How novel was the information contained
26 Chapter 2
Integrate images in records (2)
Combined menu/command searches
Add title sorting and short title listing
Add fast access key commands
Add multilingual search formats
Add key word searches (2)
Add topic linking and subject access
Add prior search recall feature
Add search “navigation aids”
Add different hierarchical searches
Access to other libraries’ catalogs (2)
Add or customize web interface (9)Hot links for topicsExtended searchesHot links for source material
Table 2.2OPAC modifications created by users served a wide variety of functions.
Improved library management Improved information-search capabilities
Add library patron summary statistics
Add library identifiers
Add location records for physical audit
Add book retrieval instructions for staff andpatrons
Add CD ROM System backup
Add book access control based on copyright
Patrons can check their status via OPAC
Patrons can reserve books via OPAC (2)
Remote access to OPAC by different systems
Add graduated system access via password
Add interfaces to other in-house IT systemsWord processing and correspondence (2)Umbrella for local information collection (2)Local systems adaptation
Source of data: Morrison et al. 2000, table 1. Number of users (if more than one)
developing functionally similar innovations is shown in parentheses after description
of innovation.
in the user innovation to your firm at the time that innovation was devel-
oped?” Responses from both managers indicated that about 70 percent (25
out of 39) of the user modifications provided functionality improvements
of at least “medium” commercial importance to OPACs—and in fact many
of the functions were eventually incorporated in the OPACs the manufac-
turers sold. However, the managers also felt that their firms generally
already knew about the lead users’ needs when the users developed their
solutions, and that the innovations the users developed provided novel
information to their company only in 10–20 percent of the cases. (Even
when manufacturers learn about lead users’ needs early, they may not think
it profitable to develop their own solution for an “emerging” need until
years later. I will develop this point in chapter 4.)
“Consumer” Innovation in Sports Communities
Franke and Shah (2003) studied user innovation in four communities of
sports enthusiasts. The communities, all located in Germany, were focused
on four very different sports.
One community was devoted to canyoning, a new sport popular in the
Alps. Canyoning combines mountain climbing, abseiling (rappelling), and
swimming in canyons. Members do things like rappel down the middle of
an active waterfall into a canyon below. Canyoning requires significant skill
and involves physical risk. It is also a sport in rapid evolution as participants
try new challenges and explore the edges of what is both achievable and fun.
The second community studied was devoted to sailplaning. Sailplaning or
gliding, a more mature sport than canyoning, involves flying in a closed,
engineless glider carrying one or two people. A powered plane tows the
Development of Products by Lead Users 27
Table 2.3Factors associated with innovating in librararies (logit model). χ2
4= 33.85; ρ2 = 0.40;
classification rate = 87.78%.
Coefficient Standard error
Leading-edge status 1.862 0.601
Lack of incentive to modify –0.845 0.436
Lack of in-house technology skills –1.069 0.412
Lack of external resources 0.695 0.456
Constant –2.593 0.556
Source: Morrison et al. 2000, table 6.
glider to a desired altitude by means of a rope; then the rope is dropped and
the engineless glider flies on its own, using thermal updrafts in the atmos-
phere to gain altitude as possible. The sailplaning community studied by
Franke and Shah consisted of students of technical universities in Germany
who shared an interest in sailplaning and in building their own sailplanes.
Boardercross was the focus of the third community. In this sport, six
snowboarders compete simultaneously in a downhill race. Racetracks vary,
but each is likely to incorporate tunnels, steep curves, water holes, and
jumps. The informal community studied consisted of semi-professional ath-
letes from all over the world who met in as many as ten competitions a year
in Europe, in North America, and in Japan.
The fourth community studied was a group of semi-professional cyclists
with various significant handicaps, such as cerebral palsy or an amputated
limb. Such individuals must often design or make improvements to their
equipment to accommodate their particular disabilities. These athletes
knew each other well from national and international competitions, train-
ing sessions, and seminars sponsored by the Deutscher Sportbund (German
National Sports Council).
A total of 197 respondents (a response rate of 37.8 percent) answered a ques-
tionnaire about innovation activities in their communities. Thirty-two per-
cent reported that they had developed or modified equipment they used for
their sport. The rate of innovation varied among the sports, the high being 41
percent of the sailplane enthusiasts reporting innovating and the low being
18 percent of the boardercross snowboarders reporting. (The complexity of
the equipment used in the various sports probably had something to do with
this variation: a sailplane has many more components than a snowboard.)
The innovations developed varied a great deal. In the sailplane commu-
nity, users developed innovations ranging from a rocket-assisted emergency
ejection system to improvements in cockpit ventilation. Snowboarders
invented such things as improved boots and bindings. Canyoners’ inven-
tions included very specialized solutions, such as a way to cut loose a trapped
rope by using a chemical etchant. With respect to commercial potential,
Franke and Shah found that 23 percent of the user-developed innovations
reported were or soon would be produced for sale by a manufacturer.
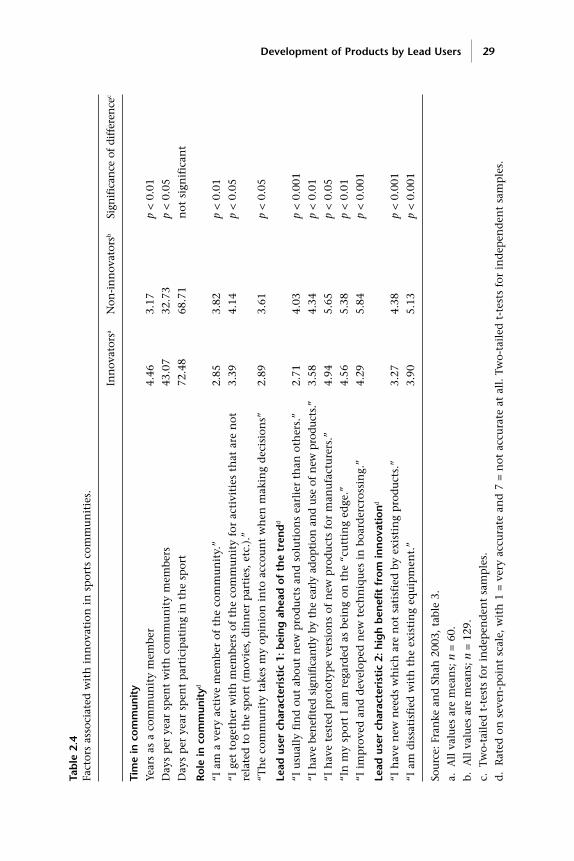
Franke and Shah found that users who innovated were significantly
higher on measures of the two lead user characteristics than users who did
not innovate (table 2.4). They also found that the innovators spent more
28 Chapter 2
Development of Products by Lead Users 29
Tab
le 2
.4Fa
ctor
s as
soci
ated
wit
h i
nn
ovat
ion
in
sp
orts
com
mu
nit
ies.
Inn
ovat
orsa
Non
-in
nov
ator
sbSi
gnif
ican
ce o
f di
ffer
ence
c
Tim
e in
com
mun
ity
Year
s as
a c
omm
un
ity
mem
ber
4.46
3.17
p<
0.01
Day
s p
er y
ear
spen
t w
ith
com
mu
nit
y m
embe
rs43
.07
32.7
3p
< 0.
05
Day
s p
er y
ear
spen
t p
arti
cip
atin
g in
th
e sp
ort
72.4
868
.71
not
sig
nif
ican
t
Rol
e in
com
mun
ityd
“I a
m a
ver
y ac
tive
mem
ber
of t
he
com
mu
nit
y.”
2.85
3.82
p<
0.01
“I g
et t
oget
her
wit
h m
embe
rs o
f th
e co
mm
un
ity
for
acti
viti
es t
hat
are
not
3.
394.
14p
< 0.
05re
late
d t
o th
e sp
ort
(mov
ies,
din
ner
par
ties
, et
c.).
”
“Th
e co
mm
un
ity
take
s m
y op
inio
n i
nto
acc
oun
t w
hen
mak
ing
dec
isio
ns”
2.89
3.61
p<
0.05
Lead
use
r ch
arac
teri
stic
1: b
ein
g a
hea
d o
f th
e tr
end
d
“I u
sual
ly f
ind
ou
t ab
out
new
pro
du
cts
and
sol
uti
ons
earl
ier
than
oth
ers.
”2.
714.
03p
< 0.
001
“I h
ave
ben
efit
ed s
ign
ific
antl
y by
th
e ea
rly
adop
tion
an
d us
e of
new
pro
duct
s.”
3.58
4.34
p<
0.01
“I h
ave
test
ed p
roto
typ
e ve
rsio
ns
of n
ew p
rod
uct
s fo
r m
anu
fact
ure
rs.”
4.94
5.65
p<
0.05
“In
my
spor
t I
am r
egar
ded
as
bein
g on
th
e “c
utt
ing
edge
.”4.
565.
38p
< 0.
01
“I i
mp
rove
d a
nd
dev
elop
ed n
ew t
ech
niq
ues
in
boa
rder
cros
sin
g.”
4.29
5.84
p<
0.00
1
Lead
use
r ch
arac
teri
stic
2: h
igh
ben
efit
fro
m in
nov
atio
nd
“I h
ave
new
nee
ds
wh
ich
are
not
sat
isfi
ed b
y ex
isti
ng
pro
du
cts.
”3.
274.
38p
< 0.
001
“I a
m d
issa
tisf
ied
wit
h t
he
exis
tin
g eq
uip
men
t.”
3.90
5.13
p<
0.00
1
Sou
rce:
Fra
nke
an
d S
hah
200
3, t
able
3.
a.A
ll v
alu
es a
re m
ean
s; n
= 60
.
b.A
ll v
alu
es a
re m
ean
s; n
= 12
9.
c.Tw
o-ta
iled
t-t
ests
for
in
dep
end
ent
sam
ple
s.
d.
Rat
ed o
n s
even
-poi
nt
scal
e, w
ith
1 =
ver
y ac
cura
te a
nd
7 =
not
acc
ura
te a
t al
l. T
wo-
tail
ed t
-tes
ts f
or i
nd
epen
den
t sa
mp
les.
time in sporting and community-related activities and felt they had a more
central role in the community.
Innovation among Hospital Surgeons
Lüthje (2003) explored innovations developed by surgeons working at uni-
versity clinics in Germany. Ten such clinics were chosen randomly, and 262
surgeons responded to Lüthje’s questionnaire—a response rate of 32.6 per-
cent. Of the university surgeons responding, 22 percent reported develop-
ing or improving some item(s) of medical equipment for use in their own
practices. Using a logit model to determine the influence of user character-
istics on innovation activity, Lüthje found that innovating surgeons tended
to be lead users (p < 0.01). He also found that solutions to problems encoun-
tered in their own surgical practices were the primary benefit that the inno-
vating surgeons expected to obtain from the solutions they developed (p <
0.01). In addition, he found that the level of technical knowledge the sur-
geon held was significantly correlated with innovation (p < 0.05). Also, per-
haps as one might expect in the field of medicine, the “contextual barrier”
of concerns about legal problems and liability risks was found to have a
strongly significant negative correlation with the likelihood of user inven-
tion by surgeons (p < 0.01).
With respect to the commercial value of the innovations the lead user
surgeons had developed, Lüthje reported that 48 percent of the innovations
developed by his lead user respondents were or soon would be marketed by
manufacturers of medical equipment.
Discussion
The studies reviewed in this chapter all found that user innovations in gen-
eral and commercially attractive ones in particular tended to be developed
by lead users. These studies were set in a range of fields, but all were focused
on hardware innovations or on information innovations such as new soft-
ware. It is therefore important to point out that, in many fields, innovation
in techniques is at least as important as equipment innovation. For example,
many novel surgical operations are performed with standard equipment
(such as scalpels), and many novel innovations in snowboarding are based
on existing, unmodified equipment. Technique-only innovations are also
likely to be the work of lead users, and indeed many of the equipment inno-
30 Chapter 2
vations documented in the studies reviewed here involved innovations in
technique as well as innovations in equipment.
Despite the strength of the findings, many interesting puzzles remain
that can be addressed by the further development of lead user theory. For
example, empirical studies of innovation by lead users are unlikely to have
sampled the world’s foremost lead users. Thus, in effect, the studies
reviewed here determined lead users to be those highest on lead user char-
acteristics that were within their samples. Perhaps other samples could have
been obtained in each of the fields studied containing users that were even
more “leading edge” with respect to relevant market trends. If so, why were
the samples of moderately leading-edge users showing user innovation if
user innovation is concentrated among “extreme” lead users? There are at
least three possible explanations. First, most of the studies of user innova-
tion probably included users reasonably close to the global leading edge in
their samples. Had the “top” users been included, perhaps the result would
have been that still more attractive user innovations would have been
found. Second, it may be that the needs of local user communities differ,
and so local lead users really may be the world’s lead users with respect to
their particular needs. Third, even if a sample contains lead users that are
not near the global top with respect to lead users’ characteristics, local lead
users might still have reasons to (re)develop innovations locally. For exam-
ple, it might be cheaper, faster, more interesting, or more enjoyable to inno-
vate than to search for a similar innovation that a “global top” lead user
might already have developed.
Development of Products by Lead Users 31

3 Why Many Users Want Custom Products
The high rates of user innovation documented in chapter 2 suggest that
many users may want custom products. Why should this be so? I will argue
that it is because many users have needs that differ in detail, and many also
have both sufficient willingness to pay and sufficient resources to obtain a
custom product that is just right for their individual needs. In this chapter, I
first present the case for heterogeneity of user needs. I then review a study
that explores users’ heterogeneity of need and willingness to pay for product
customization.
Heterogeneity of User Needs
If many individual users or user firms want something different in a prod-
uct type, it is said that heterogeneity of user need for that product type is
high. If users’ needs are highly heterogeneous, only small numbers of users
will tend to want exactly the same thing. In such a case it is unlikely that
mass-produced products will precisely suit the needs of many users. Mass
manufacturers tend to want to build products that will appeal to more users
rather than fewer, so as to spread their fixed costs of development and pro-
duction. If many users want something different, and if they have adequate
interest and resources to get exactly the product they need, they will be
driven either to develop it for themselves or to pay a custom manufacturer
to develop it for them.
Are users’ needs for new products (and services) often highly hetero-
geneous? A test of reason suggests that they are. An individual’s or a firm’s
need for a many products depends on detailed considerations regarding the
user’s initial state and resources, on the pathway the user must traverse to get
from the initial state to the preferred state, and on detailed considerations
regarding their preferred end state as well. These are likely to be different for
each individual user and for each user firm at some level of detail. This, in
turn, suggests that needs for many new products and services that are pre-
cisely right for each user will differ: that needs for those products will be
highly heterogeneous.
Suppose, for example, that you decide you need a new item of household
furnishing. Your house is already furnished with hundreds of items, big and
small, and the new item must “fit in” properly. In addition, your precise
needs for the new item are likely to be affected by your living situation, your
resources, and your preferences. For example: “We need a new couch that
Uncle Bill will like, that the kids can jump on, that matches the wallpaper I
adore, that reflects my love of coral reefs and overall good taste, and that we
can afford.” Many of these specific constraints are not results of current
whim and are not easy to change. Perhaps you can change the wallpaper,
but you are less likely to change Uncle Bill, your kids, your established tastes
with respect to a living environment, or your resource constraints.
The net result is that the most desired product characteristics might be
specific to each individual or firm. Of course, many will be willing to satis-
fice—make compromises—on many items because of limits on the money
or time they have available to get exactly what they want. Thus, a serious
mountain biker may be willing to simply buy almost any couch on sale
even if he or she is not fully happy with it. On the other hand, that same
biker may be totally unwilling to compromise about getting mountain bik-
ing equipment that is precisely right for his or her specific needs. In terms
of industrial products, NASA may insist on getting precisely right compo-
nents for the Space Shuttle if they affect mission safety, but may be willing
to satisfice on other items.
Evidence from Studies of User Innovation
Two studies of innovation by users provide indirect information on the
heterogeneity of user need. They provide descriptions of the functions of
the innovations developed by users in their samples. Inspection of these
descriptions shows a great deal of variation and few near-duplicates.
Different functionality, of course, implies that the developers of the prod-
ucts had different needs. In the 2000 study of user modifications of library
IT systems by Morrison, Roberts, and von Hippel, discussed earlier, only 14
of 39 innovations are functionally similar to any other innovations in the
34 Chapter 3
sample. If one type of functionality that was repeatedly developed (“web
interface”) is excluded, the overlap is even lower (see table 2.2). Other
responses by study participants add to this impression of high heterogene-
ity of need among users. Thirty percent of the respondents reported that
their library IT system had been highly customized by the manufacturer
during installation to meet their specific needs. In addition, 54 percent of
study respondents agreed with the statement “We would like to make addi-
tional improvements to our IT system functionality that can’t be made by
simply adjusting the standard, customer-accessible parameters provided
by the supplier.”
Similar moderate overlap in the characteristics of user innovations can be
seen in innovation descriptions provided in the study of mountain biking
by Lüthje, Herstatt, and von Hippel (2002). In that study sample, I estimate
that at most 10 of 43 innovations had functionality similar to that of
another sample member. This diversity makes sense: mountain biking,
which outsiders might assume is a single type of athletic activity, in fact has
many subspecialties.
As can be seen in table 3.1, the specializations of mountain bikers in the
our study sample involved very different mountain biking terrains, and
important variations in riding conditions and riding specializations. The
innovations users developed were appropriate to their own heterogeneous
riding activities and so were quite heterogeneous in function. Consider
three examples drawn from our study:
• I ride on elevated, skinny planks and ladders, do jumps, steep technical downhills,
obstacles and big drops. Solution devised: I needed sophisticated cycling armor and
protective clothing. So I designed arm and leg armor, chest protection, shorts, pants
and a jacket that enable me to try harder things with less fear of injury.
• I do back-country touring and needed a way to easily lift and carry a fully loaded
mountain bike on the sides of steep hills and mountains and dangle it over cliffs as
I climbed. Solution devised: I modified the top tube and the top of my seat post to
provide secure attachment points for a carrying strap, then I modified a very plush
and durable mountaineering sling to serve as the over-shoulder strap. Because the
strap sits up high, I only need to bend my knees a little bit to lift the bike onto my
shoulders, yet it is just high enough to keep the front wheel from hitting when I am
climbing a steep hill. Eventually, I came up with a quick-release lateral strap to keep
the main strap from sliding off my shoulder, but it will easily break away if I fall or
land in a fast river and need to ditch my bike.
• When riding on ice, my bike has no traction and I slip and fall. Solution devised:
I increased the traction of my tires by getting some metal studs used by the auto
Why Many Users Want Custom Products 35

36 Chapter 3
Tab
le 3
.1A
ctiv
ity
spec
iali
zati
ons
of i
nn
ovat
ing
mou
nta
in b
iker
s.
Nu
mbe
r of
N
um
ber
of
Nu
mbe
r of
Pref
erre
d te
rrai
nbi
kers
Ou
tsid
e co
ndi
tion
sbi
kers
Focu
s on
par
ticu
lar
ridi
ng
abili
ties
bike
rs
Fast
dow
nh
ill
trac
ks44
(39
.6%
)D
arkn
ess,
nig
ht
ridi
ng
45 (
40.5
%)
Jum
ps, d
rops
, stu
nts
, obs
tacl
es34
(30
.6%
)(s
teep
, dro
ps, f
ast)
Tech
nic
al s
ingl
e tr
acks
(u
p 68
(61
.3%
)Sn
ow, i
ce, c
old
60 (
54.1
%)
Tech
nic
al a
bilit
y/ba
lan
ce22
(19
.8%
)an
d do
wn
, roc
ky, j
um
ps)
Smoo
th s
ingl
e tr
acks
13
(11
.7%
)R
ain
, mu
d53
(47
.7%
)Fa
st d
esce
nts
/ d
own
hil
l34
(30
.6%
)(h
illy
, rol
lin
g, s
peed
, sa
nd,
har
dpac
k)
Urb
an a
nd
stre
ets
9 (8
.1%
)H
eat
15 (
13.5
%)
Endu
ran
ce9
(8.1
%)
No
spec
ial
terr
ain
pre
ferr
ed5
(4.5
%)
Hig
h a
ltit
ude
10 (
9.0%
)C
lim
bin
g17
(13
%)
No
extr
eme
outs
ide
con
diti
ons
29 (
26.1
%)
Spri
nt
3 (2
.7%
)
No
focu
s on
spe
cifi
c ri
din
g ab
ility
36 (
32.4
%)
Sou
rce:
Lü
thje
, Her
stat
t, a
nd
von
Hip
pel 2
002.
Th
is t
able
incl
ude
s th
e 11
1 u
sers
in t
he
stu
dy s
ampl
e w
ho
had
idea
s fo
r im
prov
emen
ts t
o m
oun
-
tain
bik
ing
equ
ipm
ent.
(O
f th
ese,
61
had
act
ual
ly g
one
on t
o bu
ild
the
equ
ipm
ent
they
en
visi
oned
.) M
any
of t
hes
e u
sers
rep
orte
d ex
peri
ence
in m
ore
than
on
e ca
tego
ry o
f ac
tivi
ty, s
o th
e su
m i
n e
ach
col
um
n i
s h
igh
er t
han
111
.
industry for winter tires. Then I selected some mountain biking tires with large
blocks of rubber in the tread pattern, drilled a hole in the center of each block and
inserted a stud in each hole.
Evidence from Studies of Market Segmentation
Empirical data on heterogeneity of demand for specific products and serv-
ices are sparse. Those most interested in studying the matter are generally
mass manufacturers of products and services for consumers—and they do
not make a practice of prospecting for heterogeneity. Instead, they are inter-
ested in finding areas where users’ needs are similar enough to represent
profitable markets for standard products produced in large volumes.
Manufacturers customarily seek such areas via market-segmentation studies
that partition markets into a very few segments—perhaps only three, four,
or five. Each segment identified consists of customers with relatively simi-
lar needs for a particular product (Punj and Stewart 1983; Wind 1978). For
example, toothpaste manufacturers may divide their markets into segments
such as boys and girls, adults interested in tooth whitening, and so on.
Since the 1970s, nearly all market-segmentation studies have been carried
out by means of cluster analysis (Green 1971; Green and Schaffer 1998). After
cluster analysis places each participant in the segment of the market most
closely matching his needs, a measure of within-segment need variation is
determined. This is the proportion of total variation that is within each clus-
ter, and it shows how much users’ needs deviate from the averages in “their”
respective segments. If within-segment variation is low, users within the seg-
ment will have fairly homogeneous needs, and so may be reasonably satisfied
with a standard product designed to serve all customers in their segment. If it
high, many users are likely to be dissatisfied—some seriously so.
Within-segment variation is seldom reported in published studies, but a
survey of market-segmentation studies published in top-tier journals did
find 15 studies reporting that statistic. These studies specified 5.5 clusters on
average, and had an average remaining within-cluster variance of 46 per-
cent (Franke and Reisinger 2003). Franke and von Hippel (2003b) found
similar results in an independent sample. In that study, an average of 3.7
market segments were specified and 54 percent of total variance was left as
within-segment variation after the completion of cluster analysis. These
data suggest that heterogeneity of need might be very substantial among
users in many product categories.1
Why Many Users Want Custom Products 37
A Study of Heterogeneity and Willingness To Pay
A need for a novel product not on the market must be accompanied by
adequate willingness to pay (and resources) if it is to be associated with the
actual development or purchase of a custom product. What is needed to
reliably establish the relationship among heterogeneity of demand, will-
ingness to pay, and custom product development or purchase is studies that
address all three factors in the same sample. My colleague Nikolaus Franke
and I conducted one such study in a population of users of web server soft-
ware, a product used primarily by industrial firms (Franke and von Hippel
2003b).
Franke and I looked in detail at users’ needs for security features in
Apache web server software, and at users’ willingness to pay for solutions
that precisely fit their needs. Apache web server software is open source soft-
ware that is explicitly designed to allow modification by anyone having
appropriate skills. Anyone may download open source software from the
Internet and use it without charge. Users are also explicitly granted the legal
right to study the software’s source code, to modify the software, and to dis-
tribute modified or unmodified versions to others. (See chapter 7 for a full
discussion of open source software.)
Apache web server software is used on web server computers connected
to the Internet. A web server’s function is to respond to requests from
Internet browsers for particular documents or content. A typical server waits
for clients’ requests, locates the requested resource, applies the requested
method to the resource, and sends the response back to the client. Web
server software began by offering relatively simple functionality. Over time,
however, Apache and other web server software programs have evolved
into the complicated front end for many of the technically demanding
applications that now run on the Internet. For example, web server soft-
ware is now used to handle security and authentication of users, to provide
e-commerce shopping carts, and gateways to databases. In the face of
strong competition from commercial competitors (including Microsoft
and Sun/Netscape), the Apache web server has become the most popular
web server software on the Internet, used by 67 percent of the many mil-
lions of World Wide Web sites extant in early 2004. It has also received
many industry awards for excellence.
Franke and I created a preliminary list of server security functions from
published and web-based sources. The preliminary list was evaluated and
38 Chapter 3
corrected by experts in web server security and Apache web server software.
We eventually ended up with a list of 45 security functions that some or
many users might need. Solutions to some were already incorporated in the
standard Apache code downloadable by users, others were available in addi-
tional modules, and a few were not yet addressed by any security module
generally available to the Apache community. (Security threats can emerge
quickly and become matters of great concern before a successful response is
developed and offered to the general community. A recent example is site
flooding, a form of attack in which vandals attempt to cause a website to
fail by flooding it with a very large number of simultaneous requests for a
response.)
Users of the security functions of web server software are the webmasters
employed by firms to make sure that their software is up to date and func-
tions properly. A major portion of a webmaster’s job is to ensure that the
software used is secure from attacks launched by those who wish illicit
access or simply want to cause the software to fail in some way. We collected
responses to our study questions from two samples of Apache webmasters:
webmasters who posted a question or an answer on a question at the
Apache Usenet Forum2 and webmasters who subscribed to a specialized
online Apache newsgroup.3 This stratified sample gave us an adequate rep-
resentation of webmasters who both did and did not have the technical
skills needed to modify Apache security software to better fit their needs:
subscribers to apache-modules.org tend to have a higher level of technical
skills on average than those posting to the Apache Usenet Forum. Data were
obtained by means of an Internet-based questionnaire.
The Heterogeneity of Users’ Needs
Franke and I found the security module needs of Apache users were very
heterogeneous indeed both among those that had the in-house capability
to write code to modify Apache and those that did not. The calibrated coef-
ficient of heterogeneity, Hc, was 0.98, indicating that there was essentially
no tendency of the users to cluster beyond chance. (We defined the “het-
erogeneity of need” in a group as the degree to which the needs of i indi-
viduals can be satisfied with j standard products which optimally meet their
needs. This means that heterogeneity of need is high when many standard
products are necessary to satisfy the needs of i individuals and low when the
needs can be satisfied by a few standard products. The higher the coefficient
Why Many Users Want Custom Products 39
the more heterogeneous are the needs of users in a sample. If the calibrated
heterogeneity coefficient Hc equals 1, there is no systematic tendency of the
users to cluster. If it is lower than 1, there is some tendency of the individ-
uals to cluster. A coefficient of 0 means that the needs of all individuals are
exactly the same.4)
Even this understates the heterogeneity. Responding Apache webmasters
went far beyond the 45 security-related functions of web server software
that we offered for their evaluation. In our questionnaire we offered an
open question asking users to list up to four additional needs they experi-
enced that were not covered by the standard list. Nearly 50 percent used the
opportunity to add additional functions. When duplicates were eliminated,
we found that 92 distinct additional security-related needs had been noted
by one or more webmaster users.5
High heterogeneity of need in our sample suggests that there should be a
high interest in obtaining modifications to Apache—and indeed, overall
satisfaction with the existing version was only moderate.
Willingness to Pay for Improvements
It is not enough to want a better-fitting custom product. One must also be will-
ing and able to pay to get what one wants. Those in the Apache sample who
did innovate were presumably willing to pay the price to do so. But how much
were the users in our sample—the innovators and the non-innovators—
willing to pay now for improvements? Estimating a user’s willingness to pay
(WTP) is known to be a difficult task. Franke and I used the contingent val-
uation method, in which respondents are directly asked how much they are
willing to pay for a product or service (Mitchell and Carson 1989). Results
obtained by that method often overestimate WTP significantly. Empirical
studies that compare expressed WTP with actual cash payments on average
showed actual spending behavior to be somewhat smaller than expressed
WTP in the case of private purchases (such as in our case). In contrast, they
generally find willingness to pay to be greatly overstated in the case of pub-
lic goods such as the removal of a road from a wilderness area.6
To compensate for the likely overstatement of expressed relative to actual
WTP in our study, Franke and I conservatively deflated respondents’ indi-
cated willingness to pay by 80 percent. (Although the product in question
was intended for private use, webmasters were talking about their willing-
ness to spend company money, not their own money.) We asked each user
40 Chapter 3
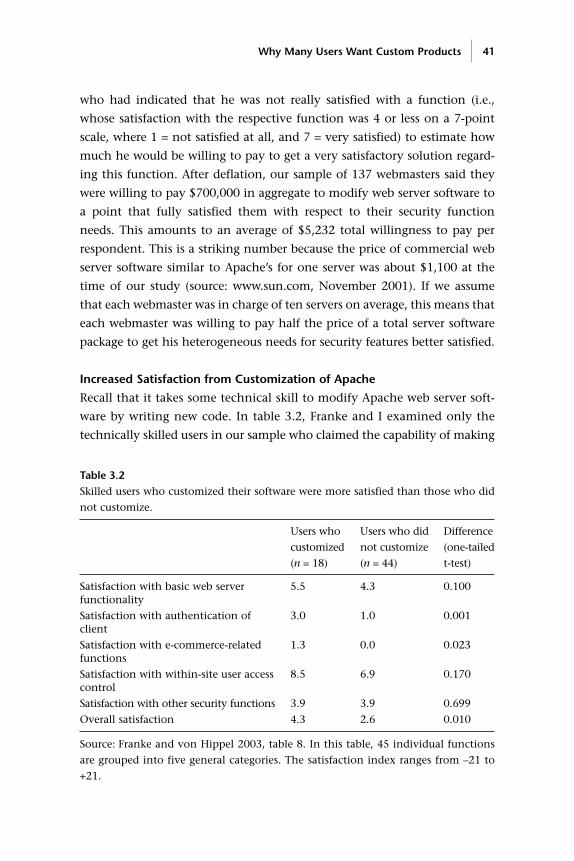
who had indicated that he was not really satisfied with a function (i.e.,
whose satisfaction with the respective function was 4 or less on a 7-point
scale, where 1 = not satisfied at all, and 7 = very satisfied) to estimate how
much he would be willing to pay to get a very satisfactory solution regard-
ing this function. After deflation, our sample of 137 webmasters said they
were willing to pay $700,000 in aggregate to modify web server software to
a point that fully satisfied them with respect to their security function
needs. This amounts to an average of $5,232 total willingness to pay per
respondent. This is a striking number because the price of commercial web
server software similar to Apache’s for one server was about $1,100 at the
time of our study (source: www.sun.com, November 2001). If we assume
that each webmaster was in charge of ten servers on average, this means that
each webmaster was willing to pay half the price of a total server software
package to get his heterogeneous needs for security features better satisfied.
Increased Satisfaction from Customization of Apache
Recall that it takes some technical skill to modify Apache web server soft-
ware by writing new code. In table 3.2, Franke and I examined only the
technically skilled users in our sample who claimed the capability of making
Why Many Users Want Custom Products 41
Table 3.2 Skilled users who customized their software were more satisfied than those who did
not customize.
Users who Users who did Difference
customized not customize (one-tailed
(n = 18) (n = 44) t-test)
Satisfaction with basic web server 5.5 4.3 0.100functionality
Satisfaction with authentication of 3.0 1.0 0.001client
Satisfaction with e-commerce-related 1.3 0.0 0.023functions
Satisfaction with within-site user access 8.5 6.9 0.170control
Satisfaction with other security functions 3.9 3.9 0.699
Overall satisfaction 4.3 2.6 0.010
Source: Franke and von Hippel 2003, table 8. In this table, 45 individual functions
are grouped into five general categories. The satisfaction index ranges from –21 to
+21.
modifications to Apache web server software. For these technically skilled
users, we found significantly higher satisfaction levels among those that
actually did customize their software—but even the users that made modi-
fications were not fully satisfied.
One might wonder why users with the ability to modify Apache closer to
their liking were not totally satisfied. The answer can be found in respon-
dents’ judgments regarding how much effort it would require to modify
Apache still more to their liking. We asked all respondents who indicated
dissatisfaction of level 4 or lower with a specific function of Apache how
much working time it would cost them to improve the function to the
point where they would judge it to be very satisfactory (to be at a satisfac-
tion level of 7). For the whole sample and all dissatisfactions, we obtained
a working time of 8,938 person-days necessary to get a very satisfactory
solution. This equals $78 of incremental benefit per incremental program-
mer working day ($716,758 divided by 8,938 days). This is clearly below the
regular wages a skilled programmer gets. Franke and I concluded from this
that skilled users do not improve their respective Apache versions to the
point where they are perfectly satisfied because the costs of doing so would
exceed the benefits.
Discussion
Heterogeneity of user need is likely to be high for many types of products.
Data are still scanty, but high heterogeneity of need is a very straightfor-
ward explanation for why there is so much customization by users: many
users have “custom” needs for products and services.
Those interested can easily enhance their intuitions about heterogenity of
user need and related innovation by users. User innovation appears to be
common enough so that one can find examples for oneself in a reasonably
small, casual sample. Readers therefore may find it possible (and enjoyable)
to do their own informal tests of the matter. My own version of such a test
is to ask the students in one of my MIT classes (typically about 50 students)
to think about a particular product that many use, such as a backpack. I first
ask them how satisfied they are with their backpack. Initially, most will say
“It’s OK.” But after some discussion and thinking, a few complaints will
slowly begin to surface (slowly, I think, because we all take some dissatis-
faction with our products as the unremarkable norm). “It doesn’t fit com-
42 Chapter 3

fortably” in this or that particular way. “When my lunch bag or thermos
leaks the books and papers I am carrying get wet—there should be a water-
proof partition.” “I carry large drawings to school rolled up in my backpack
with the ends sticking out. They are ruined if it rains and I have not taken
the precaution of wrapping them in plastic.” Next, I ask whether any
students have modified their backpacks to better meet their needs.
Interestingly enough, one or two typically have. Since backpacks are not
products of very high professional or hobby interest to most users, the pres-
ence of even some user innovation to adapt to individual users’ unmet
needs in such small, casual samples is an interesting intuition builder with
respect to the findings discussed in this chapter.
Why Many Users Want Custom Products 43

4 Users’ Innovate-or-Buy Decisions
Why does a user wanting a custom product sometimes innovate for
itself rather than buying from a manufacturer of custom products?
There is, after all, a choice—at least it would seem so. However, if a user
with the resources and willingness to pay does decide to buy, it may be
surprised to discover that it is not so easy to find a manufacturer willing
to make exactly what an individual user wants. Of course, we all know
that mass manufacturers with businesses built around providing stan-
dard products in large numbers will be reluctant to accommodate
special requests. Consumers know this too, and few will be so foolish as
to contact a major soup producer like Campbell’s with a request for a
special, “just-right” can of soup. But what about manufacturers that spe-
cialize in custom products? Isn’t it their business to respond to special
requests? To understand which way the innovate-or-buy choice will go,
one must consider both transaction costs and information asymmetries
specific to users and manufacturers. I will talk mainly about transaction
costs in this chapter and mainly about information asymmetries in
chapter 5.
I begin this chapter by discussing four specific and significant transaction
costs that affect users’ innovate-or-buy decisions. Next I review a case study
that illustrates these. Then, I use a simple quantitative model to further
explore when user firms will find it more cost-effective to develop a solu-
tion—a new product or service—for themselves rather than hiring a manu-
facturer to solve the problem for them. Finally, I point out that individual
users can sometimes be more inclined to innovate than one might expect
because they sometimes value the process of innovating as well as the novel
product or service that is created.
Users’ vs. Manufacturers’ Views of Innovation Opportunities
Three specific contributors to transaction costs—in addition to the “usual
suspects,” such as opportunism—often have important effects on users’
decisions whether to buy a custom product or to develop it for themselves.
These are (1) differences between users’ and manufacturers’ views regarding
what constitutes a desirable solution, (2) differences in innovation quality
signaling requirements between user and manufacturer innovators, and (3)
differences in legal requirements placed on user and manufacturer innova-
tors. The first two of these factors involve considerations of agency costs.
When a user hires a manufacturer to develop a custom product, the user is
a principal that has hired the custom manufacturer as to act as its agent.
When the interests of the principal and the agent are not the same, agency
costs will result. Recall from chapter 1 that agency costs are (1) costs
incurred to monitor the agent to ensure that it follows the interests of the
principal, (2) the cost incurred by the agent to commit itself not to act
against the principal’s interest (the “bonding cost”), and (3) costs associated
with an outcome that does not fully serve the interests of the principal
(Jensen and Meckling 1976). In the specific instance of product and service
development, agency considerations enter because a user’s and a manufac-
turer’s interests with respect to the development of a custom product often
differ significantly.
Preferences Regarding Solutions
Individual products and services are components of larger user solutions. A
user therefore wants a product that will make the best overall tradeoff
between solution quality and price. Sometimes the best overall tradeoff will
result in a willingness to pay a surprisingly large amount to get a solution
component precisely right. For example, an individual user may specify ten-
nis racket functionality that will fit her specific technique and relative
strengths and will be willing to pay a great deal for exactly that racket.
Deviations in racket functionality would require compensating modifica-
tions in her carefully practiced and deeply ingrained hitting technique—a
much more costly overall solution from the user’s point of view. In contrast,
a user will be much less concerned with precisely how the desired function-
ality is attained. For example, tennis players will typically be unconcerned
46 Chapter 4
about whether a tennis racket is made from metal, carbon fiber, plastic or
wood—or, for that matter, from mud—if it performs precisely as desired.
And, indeed, users have quickly shifted to new types of rackets over the
years as new materials promise a better fit to their particular functional
requirements.
Of course, the same thing is true in the case of products for industrial
users. For example, a firm with a need for a process machine may be will-
ing to pay a great deal for one that is precisely appropriate to the char-
acteristics of the input materials being processed, and to the skills of
employees who will operate the machine. Deviations in either matter
would require compensating modifications in material supply and
employee training—likely to be a much more costly overall solution from
the user’s point of view. In contrast, the user firm will be much less con-
cerned with precisely how the desired functionality is achieved by the
process machine, and will care only that it performs precisely as
specified.
Manufacturers faced with custom development requests from users make
similar calculations, but theirs revolve around attempting to conserve the
applicability of a low-cost (to them) solution. Manufacturers tend to spe-
cialize in and gain competitive advantage from their capabilities in one or
a few specific solution types. They then seek to find as many profitable
applications for those solutions types as possible. For example, a specialist
in fabricating custom products from carbon fiber might find it profitable to
make any kind of product—from airplane wings to tennis rackets—as long
as they are made from carbon fiber. In contrast, that same manufacturer
would have no competitive advantage in—and so no profit from making—
any of these same products from metal or wood.
Specializations in solution types can be very narrow indeed. For example,
thousands of manufacturers specialize in adhesive-based fastening solu-
tions, while other thousands specialize in mechanical fastening solutions
involving such things as metal screws and nails. Importantly, companies
that produce products and solution types that have close functional equiv-
alence from the user’s point of view can look very different from the point
of view of a solution supplier. For example, a manufacturer of standard or
custom adhesives needs chemists on staff with an expertise in chemical
formulation. It also needs chemistry labs and production equipment
designed to mix specialized batches of chemicals on a small scale, and it
Users’ Innovate-or-Buy Decisions 47
needs the equipment, expertise and regulatory approvals to package that
kind of product in a way that is convenient to the customer and also in line
with regulatory safeguards. In contrast, manufacturers specializing in stan-
dard or custom metal fastening solutions need none of these things. What
they need instead are mechanical design engineers, a machine shop to build
product prototypes and production tooling, specialized metal-forming pro-
duction equipment such as screw machines, and so on.
Users, having an investment only in a need specification and not in a
solution type, want the best functional solution to their problem, inde-
pendent of solution type used. Manufacturers, in contrast, want to sup-
ply custom solutions to users that utilize their existing expertise and
production capabilities. Thus, in the case of the two fastening technology
alternatives just described, users will prefer whatever solution approach
works best. In contrast, adhesives manufacturers will find it tremen-
dously more attractive to create a solution involving adhesive-based
fastening, and manufacturers specializing in mechanical fastening will
similarly strongly prefer to offer to develop solutions involving mechan-
ical fastening.
The difference between users’ incentives to get the best functional solu-
tion to their need and specialist manufacturers’ incentives to embed a spe-
cific solution type in the product to be developed are a major source of
agency costs in custom product development, because there is typically an
information asymmetry between user and manufacturer with respect to
what will be the best solution. Manufacturers tend to know more than users
about this and to have a strong incentive to provide biased information to
users in order to convince them that the solution type in which they spe-
cialize is the best one to use. Such biases will be difficult for users to detect
because, again, they are less expert than the suppliers in the various solu-
tion technologies that are candidates.
Theoretically, this agency cost would disappear if it were possible to fully
specify a contract (Aghion and Tirole 1994; Bessen 2004). But in product
development, contracting can be problematic. Information regarding char-
acteristics of solutions and needs is inescapably incomplete at the time of
contracting—users cannot fully specify what they want in advance of try-
ing out prototype solutions, and manufacturers are not fully sure how
planned solution approaches will work out before investing in customer-
specific development.
48 Chapter 4
Users’ Expectations
When users buy a product from manufacturers, they tend to expect a pack-
age of other services to come along with the product they receive.
However, when users develop a product for themselves, some of these are
not demanded or can be supplied in a less formal, less expensive way by
users for themselves. This set of implicit expectations can raise the cost to
a user of a custom solution bought from a manufacturer relative to a home-
developed solution.
Users typically expect a solution they have purchased to work correctly
and reliably “right out of the box.” In effect, a sharp line is drawn between
product development at the manufacturer’s site and routine, trouble-free
usage at the purchaser’s site. When the user builds a product for itself, how-
ever, both the development and the use functions are in the same organi-
zation and may explicitly be overlapped. Repeated tests and repeated repairs
and improvements during early use are then more likely to be understood
and tolerated as an acceptable part of the development process.
A related difference in expectations has to do with field support for a
product that has been purchased rather than developed in house. In the
case of a purchased custom product, users expect that manufacturers will
provide replacement parts and service if needed. Responding to this expec-
tation is costly for a custom manufacturer. It must keep a record of what it
has built for each particular user, and of any special parts incorporated in
that user’s products so that they can be built or purchased again if needed.
In contrast, if a user has developed a product for itself, it has people on site
who know details of its design. These employees will be capable of rebuild-
ing or repairing or redesigning the product ad hoc if and as the need arises.
(Of course, if these knowledgeable employees leave the user firm while the
product they designed is still in use, such informality can prove costly.)
Manufacturers also must invest in indirect quality signals that may not
have an effect on actual quality, but instead are designed to assure both the
specific user being served and the market in general that the product being
supplied is of high quality. These represent another element of agency costs
that user-innovators do not incur. When users develop an innovation for
themselves, they end up intimately knowing the actual quality of the solu-
tion they have developed, and knowing why and how it is appropriate to
their task. As an example, an engineer building a million-dollar process
Users’ Innovate-or-Buy Decisions 49
machine for in-house use might feel it perfectly acceptable to install a pre-
cisely right and very cheap computer controller made and prominently
labeled by Lego, a manufacturer of children’s toys. (Lego provides computer
controllers for some of its children’s building kit products.) But if that same
engineer saw a Lego controller in a million-dollar process machine his firm
was purchasing from a specialist high-end manufacturer, he might not
know enough about the design details to know that the Lego controller was
precisely right for the application. In that case, the engineer and his man-
agers might well regard the seemingly inappropriate brand name as an indi-
rect signal of bad quality.
Manufacturers are often so concerned about a reputation for quality that
they refuse to take shortcuts that a customer specifically requests and that
might make sense for a particular customer, lest others get wind of what was
done and take it as a negative signal about the general quality of the firm’s
products. For example, you may say to a maker of luxury custom cars: “I want
to have a custom car of your brand in my driveway—my friends will admire
it. But I only plan to drive it to the grocery store once in a while, so I only
want a cheap little engine. A luxury exterior combined with cheap parts is the
best solution for me in this application—just slap something together and
keep the price low.” The maker is likely to respond: “We understand your
need, but we cannot be associated with any product of low quality. Someone
else may look under the hood some day, and that would damage our reputa-
tion as a maker of fine cars. You must look elsewhere, or decide you are will-
ing to pay the price to keep one of our fine machines idle on your driveway.”
Differing Legal and Regulatory Requirements
Users that innovate do not generally face legal risk if the product they
develop fails and causes costs to themselves but not to others. In contrast,
manufacturers that develop and sell new products are regarded under US law
as also providing an implied warranty of “fitness for the intended use.” If a
product does not meet this criterion, and if a different, written warranty is
not in place, manufacturers can be found liable for negligence with respect
to providing a defective design and failure to warn buyers (Barnes and Ulin
1984). This simple difference can cause a large difference in exposure to lia-
bility by innovators and so can drive up the costs of manufacturer-provided
solutions relative to user-provided ones.
50 Chapter 4
For example, a user firm that builds a novel process controller to improve
its plant operations must pay its own actual costs if the self-built controller
fails and ruins expensive materials being processed. On the other hand, if a
controller manufacturer designed the novel controller product and sold it
to customers, and a failure then occurred and could be traced back to a fault
in the design, the controller manufacturer is potentially liable for actual
user costs and punitive damages. It may also incur significant reputational
losses if the unhappy user broadcasts its complaints. The logical response of
a controller manufacturer to this higher risk is to charge more and/or to be
much more careful with respect to running exhaustive, expensive, and
lengthy tests before releasing a new product. The resulting increase in cost
and delay for obtaining a manufacturer-developed product can tend to tip
users toward building their own, in-house solutions.
Net Result
A net result of the foregoing considerations is that manufacturers often find
that developing a custom product for only one or a few users will be unprof-
itable. In such cases, the transaction costs involved can make it cheaper for
users with appropriate capabilities to develop the product for themselves. In
larger markets, in contrast, fixed transaction costs will be spread over many
customers, and the economies of scale obtainable by producing for the
whole market may be substantial. In that case, it will likely be cheaper for
users to buy than to innovate. As a result, manufacturers, when contacted
by a user with a very specific request, will be keenly interested in how many
others are likely to want this solution or elements of it. If the answer is
“few,” a custom manufacturer will be unlikely to accept the project.
Of course, manufacturers have an incentive to make markets attractive
from their point of view. This can be done by deviating from precisely serv-
ing the needs of a specific custom client in order to create a solution that
will be “good enough” for that client but at the same time of more interest
to others. Manufacturers may do this openly by arranging meetings among
custom buyers with similar needs, and then urging the group to come up
with a common solution that all will find acceptable. “After all,” as the rep-
resentative will say, “it is clear that we cannot make a special product to suit
each user, so all of you must be prepared to make really difficult com-
promises!” More covertly, manufacturers may simply ignore some of the
Users’ Innovate-or-Buy Decisions 51
specific requests of the specific user client and make something that they
expect to be a more general solution instead.
The contrasting incentives of users and manufacturers with respect to gen-
erality of need being served—and also with respect to the solution choice
issue discussed earlier—can result in a very frustrating and cloudy interaction
in which each party hides its best information and attempts to manipulate
others to its own advantage. With respect to generality of need, sophisticated
users understand custom suppliers’ preference for a larger market and attempt
to argue convincingly that “everyone will want precisely what I am asking
you for.” Manufacturers, in turn, know users have this incentive and so will
generally prefer to develop custom products for which they themselves have
a reasonable understanding of demand. Users are also aware of manufactur-
ers’ strong preference for only producing products that embody their existing
solution expertise. To guard against the possibility that this incentive will pro-
duce biased advice, they may attempt to shop around among a number of
suppliers offering different solution types and/or develop internal expertise
on solution possibilities and/or attempt to write better contracts. All these
attempts to induce and guard against bias involve agency costs.
An Illustrative Case
A case study by Sarah Slaughter (1993) illustrates the impact of some of the
transaction costs discussed above related to users’ innovate-or-buy deci-
sions. Slaughter studied patterns of innovation in stressed-skin panels,
which are used in some housing construction. The aspects of the panels
studied were related to installation, and so the users of these features were
home builders rather than home owners. When Slaughter contrasted users’
costs of innovating versus buying, she found that it was always much
cheaper for the builder to develop a solution for itself at a construction site
than to ask a panel manufacturer to do so.
A stressed-skin panel can be visualized as a large 4-by-8-foot sandwich
consisting of two panels made of plywood with a layer of plastic foam glued
in between. The foam, about 4 inches thick, strongly bonds the two panels
together and also acts as a layer of thermal insulation. In 1989, manufac-
turing of stressed-skin panels was a relatively concentrated industry; the
four largest manufacturers collectively having a 77 percent share of the mar-
ket. The user industry was much less concentrated: the four largest con-
52 Chapter 4
structors of panelized housing together had only 1 percent of the market for
such housing in 1989.
In housing construction, stressed-skin panels are generally attached to
strong timber frames to form the outer shell of a house and to resist shear
loads (such as the force of the wind). To use the panels in this way, a num-
ber of subsidiary inventions are required. For example, one must find a
practical, long-lasting way to attach panels to each other and to the floors,
the roof, and the frame. Also, one has to find a new way to run pipes and
wires from place to place because there are no empty spaces in the walls to
put them—panel interiors are filled with foam.
Stressed-skin panels were introduced into housing construction after World
War II. From then till 1989, the time of Slaughter’s study, 34 innovations were
made in 12 functionally important areas to create a complete building system
for this type of construction. Slaughter studied the history of each of these
innovations and found that 82 percent had been developed by users of the
stressed-skin panels—residential builders—and only 18 percent by manufac-
turers of stressed-skin panels. Sometimes more than one user developed and
implemented different approaches to the same functional problem (table
4.1). Builders freely revealed their innovations rather than protecting them
for proprietary advantage. They were passed from builder to builder by word
of mouth, published in trade magazines, and diffused widely. All were repli-
cated at building sites for years before any commercial panel manufacturer
developed and sold a solution to accomplish the same function.
Histories of the user-developed improvements to stressed-skin panel con-
struction showed that the user-innovator construction firms did not engage
in planned R&D projects. Instead, each innovation was an immediate
response to a problem encountered in the course of a construction project.
Once a problem was encountered, the innovating builder typically devel-
oped and fabricated a solution at great speed, using skills, materials, and
equipment on hand at the construction site. Builders reported that the aver-
age time from discovery of the problem to installation of the completed
solution on the site was only half a day. The total cost of each innovation,
including time, equipment, and materials, averaged $153.
Example: Installing Wiring in a Stressed-Skin Panel
A builder was faced with the immediate problem of how to route wires
through the foam interior of panels to wall switches located in the middle of
Users’ Innovate-or-Buy Decisions 53
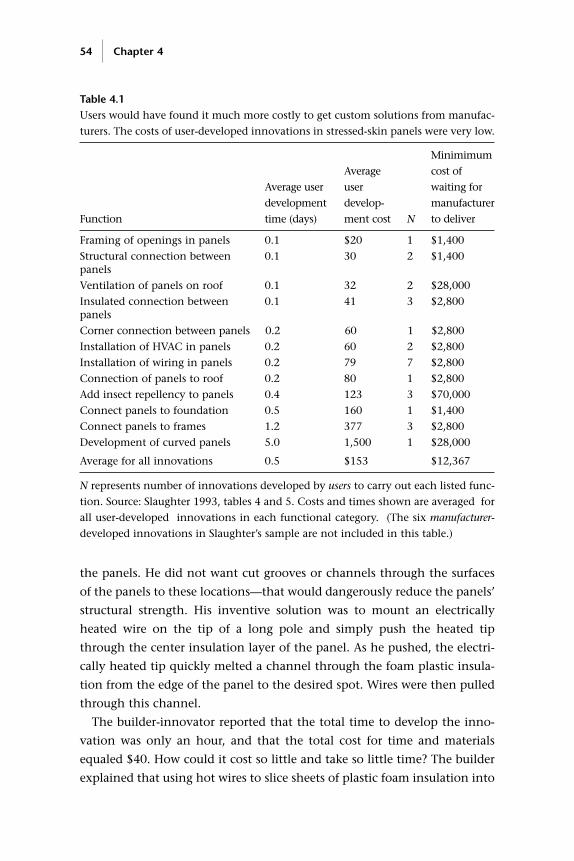
the panels. He did not want cut grooves or channels through the surfaces
of the panels to these locations—that would dangerously reduce the panels’
structural strength. His inventive solution was to mount an electrically
heated wire on the tip of a long pole and simply push the heated tip
through the center insulation layer of the panel. As he pushed, the electri-
cally heated tip quickly melted a channel through the foam plastic insula-
tion from the edge of the panel to the desired spot. Wires were then pulled
through this channel.
The builder-innovator reported that the total time to develop the inno-
vation was only an hour, and that the total cost for time and materials
equaled $40. How could it cost so little and take so little time? The builder
explained that using hot wires to slice sheets of plastic foam insulation into
54 Chapter 4
Table 4.1Users would have found it much more costly to get custom solutions from manufac-
turers. The costs of user-developed innovations in stressed-skin panels were very low.
Minimimum
Average cost of
Average user user waiting for
development develop- manufacturer
Function time (days) ment cost N to deliver
Framing of openings in panels 0.1 $20 1 $1,400
Structural connection between 0.1 30 2 $1,400panels
Ventilation of panels on roof 0.1 32 2 $28,000
Insulated connection between 0.1 41 3 $2,800panels
Corner connection between panels 0.2 60 1 $2,800
Installation of HVAC in panels 0.2 60 2 $2,800
Installation of wiring in panels 0.2 79 7 $2,800
Connection of panels to roof 0.2 80 1 $2,800
Add insect repellency to panels 0.4 123 3 $70,000
Connect panels to foundation 0.5 160 1 $1,400
Connect panels to frames 1.2 377 3 $2,800
Development of curved panels 5.0 1,500 1 $28,000
Average for all innovations 0.5 $153 $12,367
N represents number of innovations developed by users to carry out each listed func-
tion. Source: Slaughter 1993, tables 4 and 5. Costs and times shown are averaged for
all user-developed innovations in each functional category. (The six manufacturer-
developed innovations in Slaughter’s sample are not included in this table.)
pieces of a required length is a technique known to builders. His idea as to
how to modify the slicing technique to melt channels instead came to him
quickly. To test the idea, he immediately sent a worker to an electrical sup-
ply house to get some nichrome wire (a type of high-resistance wire often
used as an electrical heating element), attached the wire to a tip of a pole,
and tried the solution on a panel at the building site—and it worked!
This solution was described in detail in an article in a builder’s magazine
and was widely imitated. A panel manufacturer’s eventual response (after
the user solution had spread for a number of years) was to manufacture a
panel with a channel for wires pre-molded into the plastic foam interior of
the panel. This solution is only sometimes satisfactory. Builders often do
not want to locate switch boxes at the height of the premolded channel.
Also, sometimes construction workers will install some panels upside down
in error, and the preformed channels will then not be continuous between
one panel and the next. In such cases, the original, user-developed solution
is again resorted to.
Example: Creating a Curved Panel
A builder was constructing a custom house with large, curved windows.
Curved stressed-skin panels were needed to fill in the space above and
below these windows, but panel manufacturers only sold flat panels at that
time. The builder facing the problem could not simply buy standard flat
panels and bend them into curved ones at the construction site—completed
panels are rigid by design. So he bought plywood and plastic foam at a local
building supply house and slowly bent each panel component separately
over a curved frame quickly built at the construction site. He then bonded
all three elements together with glue to create strong curved panels that
would maintain their shape over time.
To determine whether users’ decisions to innovate rather than buy made
economic sense for them, Slaughter calculated, in a very conservative way,
what it would have cost users to buy a manufacturer-developed solution
embodied in a manufactured panel rather than build a solution for them-
selves. Her estimates included only the cost of the delay a user-builder
would incur while waiting for delivery of a panel incorporating a manufac-
turer’s solution. Delay in obtaining a solution to a problem encountered at
a construction site is costly for a builder, because the schedule of deliveries,
Users’ Innovate-or-Buy Decisions 55
subcontractors, and other activities must then be altered. For example, if
installation of a panel is delayed, one must also reschedule the arrival of the
subcontractor hired to run wires through it, the contractor hired to paint it,
and so on. Slaughter estimated the cost of delay to a builder at $280 per
crew per day of delay (Means 1989). To compute delay times, she assumed
that a manufacturer would always be willing to supply the special item a
user requested. She also assumed that no time elapsed while the manufac-
turer learned about the need, contracted to do the job, designed a solution,
and obtained needed regulatory approvals. She then asked panel manufac-
turers to estimate how long it would take them to simply construct a panel
with the solution needed and deliver it to the construction site. Delay times
computed in this manner ranged from 5 days for some innovations to 250
days for the longest-term one and averaged 44 days.
The conservative nature of this calculation is very clear. For example,
Slaughter points out that the regulatory requirements for building compo-
nents, not included, are in fact much more stringent for manufacturers
than for user-builders in the field of residential construction. Manufacturers
delivering products can be required to provide test data demonstrating
compliance with local building codes for each locality served. Testing new
products for compliance in a locality can take from a month to several
years, and explicit code approval often takes several additional years. In
contrast, a builder that innovates need only convince the local building
inspector that what he has done meets code or performance requirements—
often a much easier task (Ehrenkrantz Group 1979; Duke 1988).
Despite her very conservative method of calculation, Slaughter found
the costs to users of obtaining a builder solution to be at least 100 times the
actual costs of developing a solution for themselves (table 4.1). Clearly, users’
decisions to innovate rather than buy made economic sense in this case.
Modeling Users’ Innovate-or-Buy Decisions
In this section I summarize the core of the argument discussed in this
chapter via a simple quantitative model developed with Carliss Baldwin.
Our goal is to offer additional clarity by trading off the richness of the qual-
itative argument for simplicity.
Whether a user firm should innovate or buy is a variant of a well-known
problem: where one should place an activity in a supply chain. In any real-
56 Chapter 4
world case many complexities enter. In the model that follows, Baldwin and
I ignore most of these and consider a simple base case focused on the
impact of transaction costs on users’ innovate-or-buy considerations. The
model deals with manufacturing firms and user firms rather than individ-
ual users. We assume that user firms and manufacturer firms both will hire
designers from the same homogeneous pool if they elect to solve a user
problem. We also assume that both user firms and manufacturer firms will
incur the same costs to solve a specific user problem. For example, they will
have the same costs to monitor the performance of the designer employees
they hire. In this way we simplify our innovate-or-buy problem to one of
transaction costs only.
If there are no transaction costs (for example, no costs to write and
enforce a contract), then by Coase’s theorem a user will be indifferent
between making or buying a solution to its problem. But in the real world
there are transaction costs, and so a user will generally prefer to either make
or buy. Which, from the point of view of minimizing overall costs of obtain-
ing a problem solution, is the better choice under any given circumstances?
Let Vij be the value of a solution to problem j for user i. Let Nj be the num-
ber of users having problem j. Let Whj be the cost of solving problem j,
where W = hourly wage and hj = hours required to solve it. Let Pj be the price
charged by a manufacturer for a solution to problem j. Let T be fixed or
“setup” transaction costs, such as writing a general contract for buyers of a
solution to problem j. Let t be variable or “frictional” transaction costs, such
as tailoring the general contract to a specific customer.
To explore this problem we make two assumptions. First, we assume that
a user firm knows its own problems and the value of a solution to itself, Vij.
Second, we assume that a manufacturer knows the number of users having
each problem, Nj, and the value of solutions for each problem for all users,
Vij.
These assumptions are in line with real-world incentives of users and
manufacturers, although information stickiness generally prevents firms
from getting full information. That is, users have a high incentive to know
their own problems and the value to them of a solution. Manufacturers, in
turn, have an incentive to invest in understanding the nature of problems
faced by users in the target market, the number of users affected, and the
value that the users would attach to getting a solution in order to determine
the potential profitability of markets from their point of view.
Users’ Innovate-or-Buy Decisions 57
We first consider the user’s payoff for solving a problem for itself. A user
has no transaction costs in dealing with itself, so a user’s payoff for solving
problem j will be Vij – Whj. Therefore, a user will buy a solution from an
upstream manufacturer rather than develop one for itself if and only if
Pj ≤ Whj.
Next we consider payoffs to a manufacturer for solving problem j. In this
case, transaction costs such as those discussed in earlier sections will be
encountered. With respect to transaction costs assume first that t = 0 but T
> 0. Then, the manufacturer’s payoff for solving problem j will be Vij – Whj,
which needs to be positive in order for the manufacturer to find innovation
attractive:
Nj Pj – Whj – T > 0.
But, as we saw, Pj ≤ Whj if the user is to buy, so we may substitute Whj for Pj
in our inequality. Thus we obtain the following inequality as a condition for
the user to buy:
Nj(Whj) – Whj – T > 0,
or
Nj > (T / Whj) + 1.
In other words, Baldwin and I find that the absolute lower bound on N is
greater than 1. This means that a single user will always prefer to solve a
unique problem j for itself (except in Coase’s world, where T = 0, and the
user will be indifferent). If every problem is unique to a single user, users
will never choose to call on upstream manufacturers for solutions.
Now assume that T = 0 but t > 0. Then the condition for the user to buy
rather than to innovate for itself becomes
Nj(Whj – t) – Whj > 0,
or equivalently (provided Whj > t)
Nj > Whj / (Whj—t) > 1.
Again, users will not call on upstream manufacturers to solve problems
unique to one user.
The findings from the simplified model, then, are the following:
Problems unique to one user will always be solved efficiently by users hir-
ing designers to work for them in house. In contrast, problems affecting
more than a moderate number of users, n, which is a function of the trans-
58 Chapter 4
action costs, will be efficiently solved by the manufacturer hiring designers
to develop the needed new product or service and then selling that solution
to all users affected by the problem. However, given sufficient levels of T
and/or of t, problems affecting more than one but fewer than n users will
not be solved by a manufacturer, and so there will be a market failure:
Assuming an institutional framework consisting only of independent users
and manufacturers, multiple users will have to solve the same problem
independently.
As illustration, suppose that t = 0.25Whj and T = 10Whj. Then, combin-
ing the two expressions and solving for n yields
n = (11Whj/0.75Whj) = 14.66.
The condition for the user to buy the innovation rather than innovate itself
becomes Nj ≥ 15. For a number of users less than 15 but greater than 1, there
will be a wasteful multiplication of user effort: several users will invest in
developing the same innovation independently.
In a world that consists entirely of manufacturers and of users that do not
share the innovations they develop, the type of wasteful duplicative inno-
vation investment by users just described probably will occur often. As was
discussed earlier in this chapter, and as was illustrated by Slaughter’s study,
substantial transaction costs might well be the norm. In addition, low num-
bers of users having the same need—situations where Nj is low—might also
be the norm in the case of functionally novel innovations. Functionally
novel innovations, as I will show later, tend to be developed by lead users,
and lead users are by definition at the leading (low-Nj) edge of markets.
When the type of market failure discussed above does occur, users will
have an incentive to search for institutional forms with a lower T and/or a
lower t than is associated with assignment of the problem to an upstream
manufacturer. One such institutional form involves interdependent inno-
vation development among multiple users (for example, the institutional
form used successfully in open source software projects that I will discuss in
chapter 7). Baldwin and Clark (2003) show how this form can work to solve
the problem of wasteful user innovation investments that were identified in
our model. They show that, given modularity in the software’s architecture,
it will pay for users participating in open source software projects to gener-
ate and freely reveal some components of the needed innovation, benefit-
ing from the fact that other users are likely to develop and reveal other
Users’ Innovate-or-Buy Decisions 59
components of that innovation. At the limit, the wasteful duplication of
users’ innovative efforts noted above will be eliminated; each innovation
component will have been developed by only one user, but will be shared
by many.
Benefiting from the Innovation Process
Some individual users (not user firms) may decide to innovate for them-
selves rather than buy even if a traditional accounting evaluation would
show that they had made a major investment in time and materials for an
apparently minor reward in product functionality. The reason is that indi-
vidual users may gain major rewards from the process of innovating, in
addition to rewards from the product being developed. Make-or-buy evalu-
ations typically include factors such as the time and materials that must be
invested to develop a solution. These costs are then compared with the
likely benefits produced by the project’s “output”—the new product or serv-
ice created—to determine whether the project is worth doing. This was the
type of comparison made by Slaughter, for example, in assessing whether it
would be better for the users to make or to buy the stressed-skin panel inno-
vations in her sample. However, in the case of individual user-innovators,
this type of assessment can provide too narrow a perspective on what actu-
ally constitutes valuable project output. Specifically, there is evidence that
individuals sometimes greatly prize benefits derived from their participa-
tion in the process of innovation. The process, they say, can produce learn-
ing and enjoyment that is of high value to them.
In the introductory chapter, I pointed out that some recreational activi-
ties, such as solving crossword puzzles, are clearly engaged in for process
rewards only: very few individuals value the end “product” of a completed
puzzle. But process rewards have also been found to be important for inno-
vators that are producing outputs that they and others do value (Hertel,
Niedner, and Herrmann 2003; Lakhani and Wolf 2005). Lakhani and Wolf
studied a sample of individuals (n = 684, response rate = 34 percent) who
had written new software code and contributed it to an open source proj-
ect. They asked the programmers to list their three most important reasons
for doing this. Fifty-eight percent of respondents said that an important
motivation for writing their code was that they had a work need (33 per-
cent), or a non-work need (30 percent) or both (5 percent) for the code
60 Chapter 4
itself. That is, they valued the project’s “output” as this is traditionally
viewed. However, 45 percent said that one of their top three reasons for
writing code was intellectual stimulation, and 41 percent said one of their
top three reasons was to improve their own programming skills (Lakhani
and Wolf 2005, table 6). Elaborating on these responses, 61 percent of
respondents said that their participation in the open source project was
their most creative experience or was as creative as their most creative expe-
rience. Also, more than 60 percent said that “if there were one more hour
in the day” they would always or often dedicate it to programming.
Csikszentmihalyi (1975, 1990, 1996) systematically studied the charac-
teristics of tasks that individuals find intrinsically rewarding, such as rock
climbing. He found that a level of challenge somewhere between boredom
and fear is important, and also that the experience of “flow” gained when
one is fully engaged in a task is intrinsically rewarding. Amabile (1996) pro-
poses that intrinsic motivation is a key determining factor in creativity. She
defines a creative task as one that is heuristic in nature (with no predeter-
mined path to solution), and defines a creative outcome as a novel and
appropriate (useful) response to such a task. Both conditions certainly can
apply to the task of developing a product or a service.
In sum, to the extent that individual user-innovators benefit from the
process of developing or modifying a product as well as from the product
actually developed, they are likely to innovate even when the benefits
expected from the product itself are relatively low. (Employees of a firm
may wish to experience this type of intrinsic reward in their work as well,
but managers and commercial constraints may give them less of an oppor-
tunity to do so. Indeed, “control over my own work” is cited by many pro-
grammers as a reason that they enjoy creating code as volunteers on open
source projects more than they enjoy coding for their employers for pay.)
Users’ Innovate-or-Buy Decisions 61

5 Users’ Low-Cost Innovation Niches
The Problem-Solving Process
Product and service development is at its core a problem-solving process.
Research into the nature of problem solving shows it to consist of trial and
error, directed by some amount of insight as to the direction in which a
solution might lie (Baron 1988). Trial and error has also been found to be
prominent in the problem-solving work of product and process develop-
ment (Marples 1961; Allen 1966; von Hippel and Tyre 1995; Thomke 1998,
2003).
Trial-and-error problem solving can be envisioned as a four-phase cycle
that is typically repeated many times during the development of a new
product or service. Problem solvers first conceive of a problem and a related
solution based on their best knowledge and insight. Next, they build a phys-
ical or virtual prototype of both the possible solution they have envisioned
and the intended use environment. Third, they run the experiment—that is,
they operate their prototyped solution and see what happens. Fourth and
finally, they analyze the result to understand what happened in the trial
and to assess the “error information” that they gained. (In the trial-and-error
formulation of the learning process, error is the new information or learn-
ing derived from an experiment by an experimenter: it is the aspect(s) of the
outcome that the experimenter did not predict.) Developers then use
the new learning to modify and improve the solution under development
before building and running a new trial (figure 5.1).
Trial-and-error experimentation can be informal or formal; the underly-
ing principles are the same. As an example on the informal side, consider a
user experiencing a need and then developing what eventually turns out to
be a new product: the skateboard. In phase 1 of the cycle, the user combines
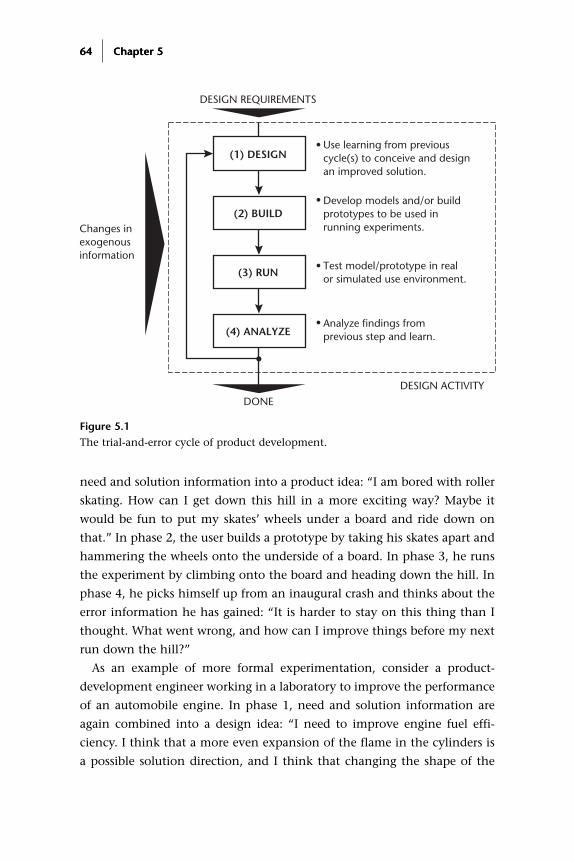
need and solution information into a product idea: “I am bored with roller
skating. How can I get down this hill in a more exciting way? Maybe it
would be fun to put my skates’ wheels under a board and ride down on
that.” In phase 2, the user builds a prototype by taking his skates apart and
hammering the wheels onto the underside of a board. In phase 3, he runs
the experiment by climbing onto the board and heading down the hill. In
phase 4, he picks himself up from an inaugural crash and thinks about the
error information he has gained: “It is harder to stay on this thing than I
thought. What went wrong, and how can I improve things before my next
run down the hill?”
As an example of more formal experimentation, consider a product-
development engineer working in a laboratory to improve the performance
of an automobile engine. In phase 1, need and solution information are
again combined into a design idea: “I need to improve engine fuel effi-
ciency. I think that a more even expansion of the flame in the cylinders is
a possible solution direction, and I think that changing the shape of the
64 Chapter 5
(2) BUILD
(3) RUN
(4) ANALYZE
(1) DESIGN
DONE
DESIGN REQUIREMENTS
DESIGN ACTIVITY
Changes in exogenous information
Use learning from previouscycle(s) to conceive and design an improved solution.
•
Develop models and/or build prototypes to be used in running experiments.
•
Test model/prototype in real or simulated use environment.
•
Analyze findings from previous step and learn.
•
Figure 5.1 The trial-and-error cycle of product development.
64 Chapter 5
spark plug electrodes will improve this.” In phase 2, the engineer builds
a spark plug incorporating her new idea. In phase 3, she inserts the new
spark plug into a lab test engine equipped with the elaborate instrumenta-
tion needed to measure the very rapid propagation of a flame in the cylin-
ders of an auto engine and runs the test. In phase 4, she feeds the data into
a computer and analyzes the results. She asks: “Did the change in spark plug
design change the flame front as expected? Did it change fuel efficiency?
How can I use what I have learned from this trial to improve things for the
next one?”
In addition to the difference in formality, there is another important dif-
ference between these two examples. In the first example, the skateboard
user was conducting trial and error with a full prototype of the intended
product in a real use environment—his own. In the second example, the
experimental spark plug might have been a full prototype of a real product,
but it probably consisted only of that portion of a real spark plug that actu-
ally extends into a combustion chamber. Also, only aspects of the use envi-
ronment were involved in the lab experiment. That is, the test engine was
not a real auto engine, and it was not being operated in a real car traveling
over real roads.
Experimentation is often carried out using simplified versions—models—
of the product being designed and its intended use environment. These
models can be physical (as in the example just given), or they can be virtual
(as in the case of thought experiments or computer simulations). In a com-
puter simulation, both the product and the environment are represented in
digital form, and their interaction is tested entirely within a computer. For
example, one might make a digital model of an automobile and a crash bar-
rier. One could then use a computer to simulate the crash of the model car
into the model barrier. One would analyze the results by calculating the
effects of that crash on the structure of the car.
The value of using models rather than the real thing in experimentation
is twofold. First, it can reduce the cost of an experiment—it can be much
cheaper to crash a simulated BMW than a real one. Second, it can make
experimental results clearer by making them simpler or otherwise different
than real life. If one is trying to test the effect of a small change on car
safety, for example, it can be helpful to remove everything not related to
that change from the experiment. For example, if one is testing the way a
particular wheel suspension structure deforms in a crash, one does not have
Users’ Low-Cost Innovation Niches 65
to know (or spend time computing) how a taillight lens will react in the
crash. Also, in a real crash things happen only once and happen very fast.
In a virtual crash executed by computer, on the other hand, one can repeat
the crash sequence over and over, and can stretch time out or compress it
exactly as one likes to better understand what is happening (Thomke 2003).
Users and others experimenting with real prototypes in real use environ-
ments can also modify things to make tests simpler and clearer. A restaurant
chef, for example, can make slight variations in just a small part of a recipe
each time a customer calls for it, in order to better understand what is
happening and make improvements. Similarly, a process machine user can
experiment with only a small portion of machine functioning over and
over to test changes and detect errors.
Sometimes designers will test a real experimental object in a real experi-
mental context only after experimenting with several generations of mod-
els that isolate different aspects of the real and/or encompass increasing
amounts of the complexity of the real. Developers of pharmaceuticals, for
example, might begin by testing a candidate drug molecule against just the
purified enzyme or receptor it is intended to affect, then test it again and
again against successively more complex models of the human organism
(tissue cultures, animal models, etc.) before finally seeking to test its effect
on real human patients during clinical trials (Thomke, von Hippel, and
Franke 1998).
Sticky Information
Any experiment is only as accurate as the information that is used as inputs.
If inputs are not accurate, outcomes will not be accurate: “garbage in,
garbage out.”
The goal of product development and service development is to create a
solution that will satisfy needs of real users within real contexts of use. The
more complete and accurate the information on these factors, the higher
the fidelity of the models being tested. If information could be transferred
costlessly from place to place, the quality of the information available to
problem solvers would or could be independent of location. But if infor-
mation is costly to transfer, things are different. User-innovators, for exam-
ple, will then have better information about their needs and their use
context than will manufacturers. After all, they create and live in that type
66 Chapter 5
of information in full fidelity! Manufacturer-innovators, on the other hand,
must transfer that information to themselves at some cost, and are unlikely
to be able to obtain it in full fidelity at any cost. However, manufacturers
might well have a higher-fidelity model of the solution types in which they
specialize than users have.
It turns out that much information needed by product and service
designers is “sticky.” In any particular instance, the stickiness of a unit of
information is defined as the incremental expenditure required to transfer
that unit of information to a specified location in a form usable by a speci-
fied information seeker. When this expenditure is low, information sticki-
ness is low; when it is high, stickiness is high (von Hippel 1994). That
information is often sticky has been shown by studying the costs of trans-
ferring information regarding fully developed process technology from one
location to another with full cooperation on both sides. Even under these
favorable conditions, costs have been found to be high—leading one to
conclude that the costs of transferring information during product and
service development are likely to be at least as high. Teece (1977), for exam-
ple, studied 26 international technology-transfer projects and found that
the costs of information transfer ranged from 2 percent to 59 percent of
total project costs and averaged 19 percent—a considerable fraction.
Mansfield et al. (1982) also studied a number of projects involving tech-
nology transfer to overseas plants, and also found technology-transfer costs
averaging about 20 percent of total project costs. Winter and Suzlanski
(2001) explored replication of well-known organizational routines at new
sites and found the process difficult and costly.
Why is information transfer so costly? The term “stickiness” refers only to
a consequence, not to a cause. Information stickiness can result from causes
ranging from attributes of the information itself to access fees charged by an
information owner. Consider tacitness—a lack of explicit encoding. Polanyi
(1958, pp. 49–53) noted that many human skills are tacit because “the aim
of a skilful performance is achieved by the observance of a set of rules which
are not known as such to the person following them.” For example, swim-
mers are probably not aware of the rules they employ to keep afloat (e.g., in
exhaling, they do not completely empty their lungs), nor are medical
experts generally aware of the rules they follow in order to reach a diagno-
sis of a disease. “Indeed,” Polanyi says, “even in modern industries the inde-
finable knowledge is still an essential part of technology.” Information that
Users’ Low-Cost Innovation Niches 67
is tacit is also sticky because it cannot be transferred at low cost. As Polanyi
points out, “an art which cannot be specified in detail cannot be transmit-
ted by prescription, since no prescription for it exists. It can be passed on
only by example from master to apprentice. . . .” Apprenticeship is a rela-
tively costly mode of transfer.
Another cause of information stickiness is related to absorptive capacity.
A firm’s or an individual’s capacity to absorb new, outside technical infor-
mation is largely a function of prior related knowledge (Cohen and
Levinthal 1990). Thus, a firm knowing nothing about circuit design but
seeking to apply an advanced technique for circuit engineering may be
unable to apply it without first learning more basic information. The stick-
iness of the information about the advanced technique for the firm in
question is therefore higher than it would be for a firm that already knows
that basic information. (Recall that the stickiness of a unit of information
is defined as the incremental expenditure required to transfer a unit of
information to a specified site in a form usable by a specific information
seeker.)
Total information stickiness associated with solving a specific problem is
also determined by the amount of information required by a problem solver.
Sometimes a great deal is required, for two reasons. First, as Rosenberg (1976,
1982) and Nelson (1982, 1990) point out, much technological knowledge
deals with the specific and the particular. Second, one does not know in
advance of problem solving which particular items will be important.
An example from a study by von Hippel and Tyre (1995) illustrates both
points nicely. Tyre and I studied how and why novel production machines
failed when they were first introduced into factory use. One of the
machines studied was an automated machine used by a computer manu-
facturing firm to place large integrated circuits onto computer circuit
boards. The user firm had asked an outside group to develop what was
needed, and that group had developed and delivered a robot arm coupled
to a machine-vision system. The arm, guided by the vision system, was
designed to pick up integrated circuits and place them on a circuit board
at precise locations.
Upon being installed in the factory, the new component-placing machine
failed many times as a result of its developers’ lack of some bit of informa-
tion about the need or use environment. For example, one day machine
operators reported that the machine was malfunctioning—again—and they
68 Chapter 5
did not know why. Investigation traced the problem to the machine-vision
system. This system used a small TV camera to locate specific metalized pat-
terns on the surface of each circuit board being processed. To function, the
system needed to “see” these metalized patterns clearly against the back-
ground color of the board’s surface. The vision system developed by the
machine-development group had functioned properly in their lab when
tested with sample boards from the user factory. However, the field investi-
gation showed that in the factory it failed when boards that were light yel-
low in color were being processed.
The fact that some of the boards being processed were sometimes light
yellow was a surprise to the machine developers. The factory personnel who
had set the specifications for the machine knew that the boards they
processed varied in color; however, they had not volunteered the informa-
tion, because they did not know that the developers would be interested.
Early in the machine-development process, they had simply provided sam-
ples of boards used in the factory to the machine-development group. And,
as it happened, these samples were green. On the basis of the samples,
developers had then (implicitly) assumed that all boards processed in the
field were green. It had not occurred to them to ask users “How much vari-
ation in board color do you generally experience?” Thus, they had designed
the vision system to work successfully with boards that were green.
In the case of this field failure, the item of information needed to under-
stand or predict this problem was known to the users and could easily have
been provided to the machine developers—had the developers thought to
ask and/or had users thought to volunteer it. But in the actual evolution of
events this was not done. The important point is that this omission was not
due to poor practice; it was due to the huge amount of information about
the need and the use environment that was potentially relevant to problem
solvers. Note that the use environment and the novel machine contain
many highly specific attributes that could potentially interact to cause field
problems. Note also that the property of the board causing this particular
type of failure was very narrow and specific. That is, the problem was not
that the board had physical properties, nor that it had a color. The problem
was precisely that some boards were yellow, and a particular shade of yellow
at that. Since a circuit board, like most other components, has many attrib-
utes in addition to color (shape, size, weight, chemical composition, reso-
nant frequency, dielectric constant, flexibility, and so on), it is likely that
Users’ Low-Cost Innovation Niches 69
problem solvers seeking to learn everything they might need to know about
the use and the use environment would have to collect a very large (perhaps
unfeasibly large) number of very specific items of information.
Next, consider that the information items the problem solver will actu-
ally need (of the many that exist) are contingent on the solution path taken
by the engineer designing the product. In the example, the problem caused
by the yellow color of the circuit board was contingent on the design solu-
tion to the component-placing problem selected by the engineer during the
development process. That is, the color of the circuit boards in the user fac-
tory became an item the problem solvers needed to know only when engi-
neers, in the course of their development of the component placer, decided
to use a vision system in the component-placing machine they were design-
ing, and the fact that the boards were yellow became relevant only when
the engineers chose a video camera and lighting that could not distinguish
the metalized patterns on the board against a yellow background. Clearly,
it can be costly to transfer the many items of information that a product or
service developer might require—even if each individual item has low stick-
iness—from one site to another.
How Information Asymmetries Affect User Innovation vs. Manufacturer
Innovation
An important consequence of information stickiness is that it results in
information asymmetries that cannot be erased easily or cheaply. Different
users and manufacturers will have different stocks of information, and may
find it costly to acquire information they need but do not have. As a result,
each innovator will tend to develop innovations that draw on the sticky
information it already has, because that is the cheapest course of action
(Arora and Gambardella 1994; von Hippel 1994). In the specific case of
product development, this means that users as a class will tend to develop
innovations that draw heavily on their own information about need and
context of use. Similarly, manufacturers as a class will tend to develop inno-
vations that draw heavily on the types of solution information in which
they specialize.
This effect is visible in studies of innovation. Riggs and von Hippel (1994)
studied the types of innovations made by users and manufacturers that
improved the functioning of two major types of scientific instruments.
70 Chapter 5
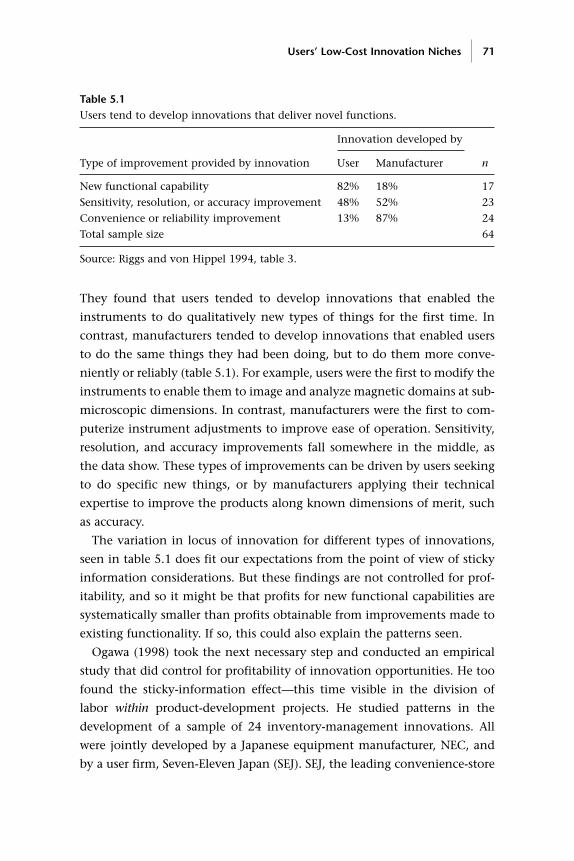
They found that users tended to develop innovations that enabled the
instruments to do qualitatively new types of things for the first time. In
contrast, manufacturers tended to develop innovations that enabled users
to do the same things they had been doing, but to do them more conve-
niently or reliably (table 5.1). For example, users were the first to modify the
instruments to enable them to image and analyze magnetic domains at sub-
microscopic dimensions. In contrast, manufacturers were the first to com-
puterize instrument adjustments to improve ease of operation. Sensitivity,
resolution, and accuracy improvements fall somewhere in the middle, as
the data show. These types of improvements can be driven by users seeking
to do specific new things, or by manufacturers applying their technical
expertise to improve the products along known dimensions of merit, such
as accuracy.
The variation in locus of innovation for different types of innovations,
seen in table 5.1 does fit our expectations from the point of view of sticky
information considerations. But these findings are not controlled for prof-
itability, and so it might be that profits for new functional capabilities are
systematically smaller than profits obtainable from improvements made to
existing functionality. If so, this could also explain the patterns seen.
Ogawa (1998) took the next necessary step and conducted an empirical
study that did control for profitability of innovation opportunities. He too
found the sticky-information effect—this time visible in the division of
labor within product-development projects. He studied patterns in the
development of a sample of 24 inventory-management innovations. All
were jointly developed by a Japanese equipment manufacturer, NEC, and
by a user firm, Seven-Eleven Japan (SEJ). SEJ, the leading convenience-store
Users’ Low-Cost Innovation Niches 71
Table 5.1Users tend to develop innovations that deliver novel functions.
Innovation developed by
Type of improvement provided by innovation User Manufacturer n
New functional capability 82% 18% 17
Sensitivity, resolution, or accuracy improvement 48% 52% 23
Convenience or reliability improvement 13% 87% 24
Total sample size 64
Source: Riggs and von Hippel 1994, table 3.
company in Japan, is known for its inventory management. Using innova-
tive methods and equipment, it is able to turn over its inventory as many
as 30 times a year, versus 12 times a year for competitors (Kotabe 1995). An
example of such an innovation jointly developed by SEJ and NEC is just-in-
time reordering, for which SEJ created the procedures and NEC the hand-
held equipment to aid store clerks in carrying out their newly designed
tasks. Equipment sales to SEJ are important to NEC: SEJ has thousands of
stores in Japan.
The 24 innovations studied by Ogawa varied in the amount of sticky need
information each required from users (having to do with store inventory-
management practices) and the amount of sticky solution information
required from manufacturers (having to do with new equipment technolo-
gies). Each also varied in terms of the profit expectations of both user and
manufacturer. Ogawa determined how much of the design for each was
done by the user firm and how much by the manufacturer firm. Controlling
for profit expectations, he found that increases in the stickiness of user
information were associated with a significant increase in the amount of
need-related design undertaken by the user (Kendall correlation coefficient
= 0.5784, P < 0.01). Conversely he found that increased stickiness of tech-
nology-related information was associated in a significant reduction in the
amount of technology design done by the user (Kendall correlation coeffi-
cients = 0.4789, P < 0.05). In other words, need-intensive tasks within
product-development projects will tend to be done by users, while solution-
intensive ones will tend to be done by manufacturers.
Low-Cost Innovation Niches
Just as there are information asymmetries between users and manufacturers
as classes, there are also information asymmetries among individual user
firms and individuals, and among individual manufacturers as well. A study
of mountain biking by Lüthje, Herstatt, and von Hippel (2002) shows that
information held locally by individual user-innovators strongly affects the
type of innovations they develop.
Mountain biking involves bicycling on rough terrain such as mountain
trails. It may also involve various other extreme conditions, such as bicy-
cling on snow and ice and in the dark (van der Plas and Kelly 1998).
Mountain biking began in the early 1970s when some young cyclists started
72 Chapter 5
to use their bicycles off-road. Existing commercial bikes were not suited to
this type of rough use, so early users put together their own bikes. They used
strong bike frames, balloon tires, and powerful drum brakes designed for
motorcycles. They called their creations “clunkers” (Penning 1998;
Buenstorf 2002).
Commercial manufacture of mountain bikes began about 1975, when
some of the early users of mountain bikes began to also build bikes for oth-
ers. A tiny cottage industry developed, and by 1976 a half-dozen small
assemblers existed in Marin County, California. In 1982, a small firm
named Specialized, an importer of bikes and bike parts that supplied parts
to the Marin County mountain bike assemblers, took the next step and
brought the first mass-produced mountain bike to market. Major bike man-
ufacturers then followed and started to produce mountain bikes and sell
them at regular bike shops across the United States. By the mid 1980s the
mountain bike was fully integrated in the mainstream bike market, and it
has since grown to significant size. In 2000, about $58 billion (65 percent)
of total retail sales in the US bicycle market were generated in the mountain
bike category (National Sporting Goods Association 2002).
Mountain biking enthusiasts did not stop their innovation activities after
the introduction of commercially manufactured mountain bikes. They kept
pushing mountain biking into more extreme environmental conditions,
and they continued to develop new sports techniques involving mountain
bikes (Mountain Bike 1996). Thus, some began jumping their bikes from
house roofs and water towers and developing other forms of acrobatics. As
they did so, they steadily discovered needs for improvements to their equip-
ment. Many responded by developing and building the improvements they
needed for themselves.
Our sample of mountain bikers came from the area that bikers call the
North Shore of the Americas, ranging from British Columbia to Washington
State. Expert mountain bikers told us that this was a current “hot spot”
where new riding styles were being developed and where the sport was
being pushed toward new limits. We used a questionnaire to collect data
from members of North Shore mountain biking clubs and from contribu-
tors to the mailing lists of two North Shore online mountain biking forums.
Information was obtained from 291 mountain bikers. Nineteen percent of
bikers responding to the questionnaire reported developing and building a
new or modified item of mountain biking equipment for their own use. The
Users’ Low-Cost Innovation Niches 73
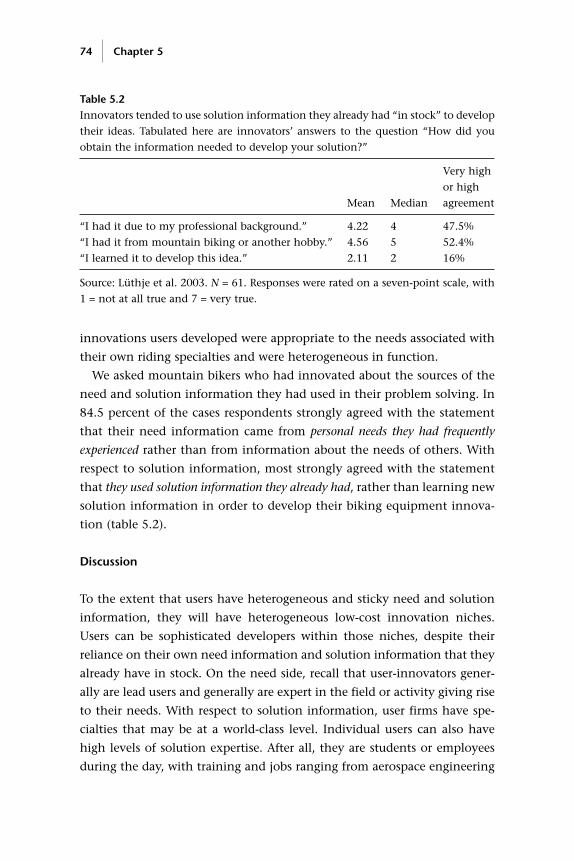
innovations users developed were appropriate to the needs associated with
their own riding specialties and were heterogeneous in function.
We asked mountain bikers who had innovated about the sources of the
need and solution information they had used in their problem solving. In
84.5 percent of the cases respondents strongly agreed with the statement
that their need information came from personal needs they had frequently
experienced rather than from information about the needs of others. With
respect to solution information, most strongly agreed with the statement
that they used solution information they already had, rather than learning new
solution information in order to develop their biking equipment innova-
tion (table 5.2).
Discussion
To the extent that users have heterogeneous and sticky need and solution
information, they will have heterogeneous low-cost innovation niches.
Users can be sophisticated developers within those niches, despite their
reliance on their own need information and solution information that they
already have in stock. On the need side, recall that user-innovators gener-
ally are lead users and generally are expert in the field or activity giving rise
to their needs. With respect to solution information, user firms have spe-
cialties that may be at a world-class level. Individual users can also have
high levels of solution expertise. After all, they are students or employees
during the day, with training and jobs ranging from aerospace engineering
74 Chapter 5
Table 5.2Innovators tended to use solution information they already had “in stock” to develop
their ideas. Tabulated here are innovators’ answers to the question “How did you
obtain the information needed to develop your solution?”
Very high
or high
Mean Median agreement
“I had it due to my professional background.” 4.22 4 47.5%
“I had it from mountain biking or another hobby.” 4.56 5 52.4%
“I learned it to develop this idea.” 2.11 2 16%
Source: Lüthje et al. 2003. N = 61. Responses were rated on a seven-point scale, with
1 = not at all true and 7 = very true.
to orthopedic surgery. Thus, mountain bikers might not want to learn
orthopedic surgery to improve their biking equipment, but if they already
are expert in that field they could easily draw on what they know for rele-
vant solution information. Consider the following example drawn from the
study of mountain biking discussed earlier:
I’m a human movement scientist working in ergonomics and biomechanics. I used
my medical experience for my design. I calculated a frame design suitable for differ-
ent riding conditions (downhill, climb). I did a CAD frame design on Catia and con-
ceived a spring or air coil that can be set to two different heights. I plan to build the
bike next year.
Users’ low-cost innovation niches can be narrow because their develop-
ment “labs” for such experimentation often consist largely of their individ-
ual use environment and customary activities. Consider, for example, the
low-cost innovation niches of individual mountain bikers. Serious moun-
tain bikers generally specialize in a particular type of mountain biking activ-
ity. Repeated specialized play and practice leads to improvement in related
specialized skills. This, in turn, may lead to a discovery of a problem in
existing mountain biking equipment and a responsive innovation. Thus, an
innovating user in our mountain biking study reported the following:
“When doing tricks that require me to take my feet off the bike pedals in
mid-air, the pedals often spin, making it hard to put my feet back onto
them accurately before landing.” Such a problem is encountered only when
a user has gained a high level of skill in the very specific specialty of jump-
ing and performing tricks in mid-air. Once the problem has been encoun-
tered and recognized, however, the skilled specialist user can re-evoke the
same problematic conditions at will during ordinary practice. The result is
the creation of a low-cost laboratory for testing and comparing different
solutions to that problem. The user is benefiting from enjoyment of his
chosen activity and is developing something new via learning by doing at
the same time.
In sharp contrast, if that same user decides to stray outside his chosen
activity in order to develop innovations of interest to others with needs
that are different from his own, the cost properly assignable to innovation
will rise. To gain an equivalent-quality context for innovation, such a user
must invest in developing personal skill related to the new innovation
topic. Only in this way will he gain an equivalently deep understanding of
the problems relevant to practitioners of that skill, and acquire a “field
Users’ Low-Cost Innovation Niches 75
laboratory” appropriate to developing and testing possible solutions to
those new problems.
Of course, these same considerations apply to user firms as well as to
individual users. A firm that is in the business of polishing marble floors is
a user of marble polishing equipment and techniques. It will have a low-
cost learning laboratory with respect to improvements in these because it
can conduct trial-and-error learning in that “lab” during the course of its
customary business activities. Innovation costs can be very low because
innovation activities are paid for in part by rewards unrelated to the novel
equipment or technique being developed. The firm is polishing while
innovating—and is getting paid for that work (Foray 2004). The low cost
innovation niche of the marble polishing firm may be narrow. For exam-
ple, it is unlikely to have any special advantage with respect to innovations
in the polishing of wood floors, which requires different equipment and
techniques.
76 Chapter 5
6 Why Users Often Freely Reveal Their Innovations
Products, services, and processes developed by users become more valuable
to society if they are somehow diffused to others that can also benefit from
them. If user innovations are not diffused, multiple users with very similar
needs will have to invest to (re)develop very similar innovations, which
would be a poor use of resources from the social welfare point of view.
Empirical research shows that new and modified products developed by
users often do diffuse widely—and they do this by an unexpected means:
user-innovators themselves often voluntarily publicly reveal what they
have developed for all to examine, imitate, or modify without any payment
to the innovator.
In this chapter, I first review evidence that free revealing is frequent. Next,
I discuss the case for free revealing from an innovators’ perspective, and
argue that it often can be the best practical route for users to increase profit
from their innovations. Finally, I discuss the implications of free revealing
for innovation theory.
Evidence of Free Revealing
When my colleagues and I say that an innovator “freely reveals” proprietary
information, we mean that all intellectual property rights to that informa-
tion are voluntarily given up by that innovator and all parties are given
equal access to it—the information becomes a public good (Harhoff,
Henkel, and von Hippel 2003). For example, placement of non-patented
information in a publicly accessible site such as a journal or public website
would be free revealing as we define it. Free revealing as so defined does not
mean that recipients necessarily acquire and utilize the revealed informa-
tion at no cost to themselves. Recipients may, for example, have to pay for
a subscription to a journal or for a field trip to an innovation site to acquire
the information being freely revealed. Also, some may have to obtain com-
plementary information or other assets in order to fully understand that
information or put it to use. However, if the possessor of the information
does not profit from any such expenditures made by its adopters, the infor-
mation itself is still freely revealed, according to our definition. This defini-
tion of free revealing is rather extreme in that revealing with some small
constraints, as is sometimes done, would achieve largely the same economic
effect. Still, it is useful to discover that innovations are often freely revealed
even in terms of this stringent definition.
Routine and intentional free revealing among profit-seeking firms was
first described by Allen (1983). He noticed the phenomenon, which he
called collective invention, in historical records from the nineteenth-
century English iron industry. In that industry, ore was processed into iron
by means of large furnaces heated to very high temperatures. Two attributes
of the furnaces used had been steadily improved during the period
1850–1875: chimney height had been increased and the temperature of the
combustion air pumped into the furnace during operation had been raised.
These two technical changes significantly and progressively improved the
energy efficiency of iron production—a very important matter for produc-
ers. Allen noted the surprising fact that employees of competing firms
publicly revealed information on their furnace design improvements and
related performance data in meetings of professional societies and in pub-
lished material.
After Allen’s initial observation, a number of other authors searched for
free revealing among profit-seeking firms and frequently found it. Nuvolari
(2004) studied a topic and time similar to that studied by Allen and found
a similar pattern of free revealing in the case of improvements made to
steam engines used to pump out mines in the 1800s. At that time, mining
activities were severely hampered by water that tended to flood into mines
of any depth, and so an early and important application of steam engines
was for the removal of water from mines. Nuvolari explored the technical
history of steam engines used to drain copper and tin mines in England’s
Cornwall District. Here, patented steam engines developed by James Watt
were widely deployed in the 1700s. After the expiration of the Watt patent,
an engineer named Richard Trevithick developed a new type of high-
pressure engine in 1812. Instead of patenting his invention, he made his
78 Chapter 6
design available to all for use without charge. The engine soon became the
basic design used in Cornwall. Many mine engineers improved Trevithick’s
design further and published what they had done in a monthly journal,
Leans Engine Reporter. This journal had been founded by a group of mine
managers with the explicit intention of aiding the rapid diffusion of best
practices among these competing firms.
Free revealing has also been documented in the case of more recent indus-
trial equipment innovations developed by users. Lim (2000) reports that
IBM was first to develop a process to manufacture semiconductors that
incorporated copper interconnections among circuit elements instead of the
traditionally used aluminum ones. After some delay, IBM revealed increas-
ing amounts of proprietary process information to rival users and to equip-
ment suppliers. Widespread free revealing was also found in the case
of automated clinical chemistry analyzers developed by the Technicon
Corporation for use in medical diagnosis. After commercial introduction of
the basic analyzer, many users developed major improvements to both the
analyzer and to the clinical tests processed on that equipment. These users,
generally medical personnel, freely revealed their improvements via publi-
cation, and at company-sponsored seminars (von Hippel and Finkelstein
1979). Mishina (1989) found free, or at least selective no-cost revealing in
the lithographic equipment industry. He reported that innovating equip-
ment users would sometimes reveal what they had done to machine manu-
facturers. Morrison, Roberts, and I, in our study of library IT search software
(discussed in chapter 2 above), found that innovating users freely revealed
56 percent of the software modifications they had developed. Reasons given
for not revealing the remainder had nothing to do with considerations of
intellectual property protection. Rather, users who did not share said they
had no convenient users’ group forum for doing so, and/or they thought
their innovation was too specialized to be of interest to others.
Innovating users of sports equipment also have been found to freely reveal
their new products and product modifications. Franke and Shah (2003), in
their study of four communities of serious sports enthusiasts described in
chapter 2, found that innovating users uniformly agreed with the statement
that they shared their innovation with their entire community free of
charge—and strongly disagreed with the statement that they sold their inno-
vations (p < 0.001, t-test for dependent samples). Interestingly, two of the
four communities they studied engaged in activities involving significant
Why Users Often Freely Reveal Innovations 79
competition among community members. Innovators in these two com-
munities reported high but significantly less willingness to share, as one
might expect in view of the potentially higher level of competitive loss free
revealing would entail.
Contributors to the many open source software projects extant (more than
83,000 were listed on SourceForge.net in 2004) also routinely make the new
code they have written public. Well-known open source software products
include the Linux operating system software and the Apache web server
computer software. Some conditions are attached to open source code licens-
ing to ensure that the code remains available to all as an information com-
mons. Because of these added protections, open source code does not quite
fit the definition of free revealing given earlier in this chapter. (The licensing
of open source software will be discussed in detail in chapter 7.)
Henkel (2003) showed that free revealing is sometimes practiced by
directly competing manufacturers. He studied manufacturers that were
competitors and that had all built improvements and extensions to a type
of software known as embedded Linux. (Such software is “embedded in”
and used to operate equipment ranging from cameras to chemical plants.)
He found that these manufacturers freely revealed improvements to the
common software platform that they all shared and, with a lag, also
revealed much of the equipment-specific code they had written.
The Practical Case for Free Revealing
The “private investment model” of innovation assumes that innovation
will be supported by private investment if and as innovators can make
attractive profits from doing so. In this model, any free revealing or uncom-
pensated “spillover” of proprietary knowledge developed by private invest-
ment will reduce the innovator’s profits. It is therefore assumed that
innovators will strive to avoid spillovers of innovation-related information.
From the perspective of this model, then, free revealing is a major surprise:
it seems to make no sense that innovators would intentionally give away
information for free that they had invested money to develop.
In this subsection I offer an explanation for the puzzle by pointing out
that free revealing is often the best practical option available to user inno-
vators. Harhoff, Henkel, and von Hippel (2003) found that it is in practice
very difficult for most innovators to protect their innovations from direct
80 Chapter 6
or approximate imitation. This means that the practical choice is typically
not the one posited by the private investment model: should innovators
voluntarily freely reveal their innovations, or should they protect them?
Instead, the real choice facing user innovators often is whether to volun-
tarily freely reveal or to arrive at the same end state, perhaps with a bit of a
lag, via involuntary spillovers. The practical case for voluntary free reveal-
ing is further strengthened because it can be accomplished at low cost, and
often yields private benefits to the innovators. When benefits from free
revealing exceed the benefits that are practically obtainable from holding an
innovation secret or licensing it, free revealing should be the preferred
course of action for a profit-seeking firm or individual.
Others Often Know Something Close to “Your” Secret
Innovators seeking to protect innovations they have developed as their
intellectual property must establish some kind of monopoly control over
the innovation-related information. In practice, this can be done either by
effectively hiding the information as a trade secret, or by getting effective
legal protection by patents or copyrights. (Trademarks also fall under the
heading of intellectual property, but we do not consider those here.) In
addition, however, it must be the case that others do not know substitute
information that skirts these protections and that they are willing to reveal.
If multiple individuals or firms have substitutable information, they are
likely to vary with respect to the competitive circumstances they face. A spe-
cific innovator’s ability to protect “its” innovation as proprietary property
will then be determined for all holders of such information by the decision
of the one having the least to lose by free revealing. If one or more infor-
mation holders expect no loss or even a gain from a decision to freely
reveal, then the secret will probably be revealed despite other innovators’
best efforts to avoid this fate.
Commonly, firms and individuals have information that would be valu-
able to those seeking to imitate a particular innovation. This is because
innovators and imitators seldom need access to a specific version of an
innovation. Indeed, engineers seldom even want to see a solution exactly as
their competitors have designed it: specific circumstances differ even
among close competitors, and solutions must in any case be adapted to
each adopter’s precise circumstances. What an engineer does want to
extract from the work of others is the principles and the general outline of
Why Users Often Freely Reveal Innovations 81
a possible improvement, rather than the easily redevelopable details. This
information is likely to be available from many sources.
For example, suppose you are a system developer at a bank and you are
tasked with improving in-house software for checking customers’ credit
online. On the face of it, it might seem that you would gain most by study-
ing the details of the systems that competing banks have developed to han-
dle that same task. It is certainly true that competing banks may face market
conditions very similar to your bank, and they may well not want to reveal
the valuable innovations they have developed to a competitor. However, the
situation is still by no means bleak for an imitator. There are also many non-
bank users of online credit checking systems in the world—probably mil-
lions. Some will have innovated and be willing to reveal what they have
done, and some of these will have the information you need. The likelihood
that the information you seek will be freely revealed by some individual or
firm is further enhanced by the fact that your search for novel basic improve-
ments may profitably extend far beyond the specific application of online
credit checking. Other fields will also have information on components of the
solution you need. For example, many applications in addition to online
credit checking use software components designed to determine whether
persons seeking information are authorized to receive it. Any can potentially
be a provider of information for this element of your improved system.
A finding by Lakhani and von Hippel (2003) illustrates the possibility that
many firms and individuals may have similar information. Lakhani and
von Hippel studied Apache help-line websites. These sites enable users hav-
ing problems with Apache software to post questions, and others to respond
with answers. The authors asked those who provided answers how many
other help-line participants they thought also knew a solution to specific
and often obscure problems they had answered on the Apache online
forum. Information providers generally were of the opinion that some or
many other help-line participants also knew a solution, and could have pro-
vided an answer if they themselves had not done so (table 6.1).
Even in the unlikely event that a secret is held by one individual, that
information holder will not find it easy to keep a secret for long. Mansfield
(1985) studied 100 American firms and found that “information concern-
ing development decisions is generally in the hands of rivals within about
12 to 18 months, on the average, and information concerning the detailed
nature and operation of a new product or process generally leaks out within
82 Chapter 6
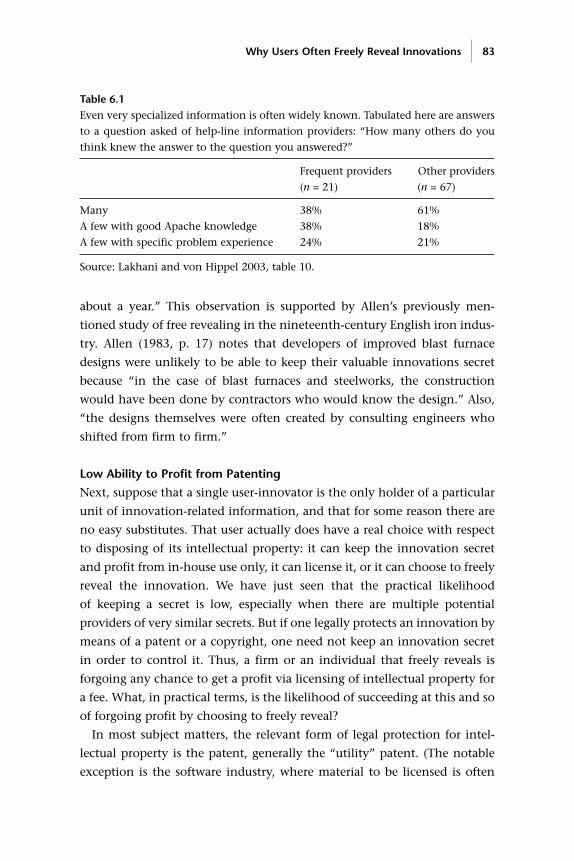
about a year.” This observation is supported by Allen’s previously men-
tioned study of free revealing in the nineteenth-century English iron indus-
try. Allen (1983, p. 17) notes that developers of improved blast furnace
designs were unlikely to be able to keep their valuable innovations secret
because “in the case of blast furnaces and steelworks, the construction
would have been done by contractors who would know the design.” Also,
“the designs themselves were often created by consulting engineers who
shifted from firm to firm.”
Low Ability to Profit from Patenting
Next, suppose that a single user-innovator is the only holder of a particular
unit of innovation-related information, and that for some reason there are
no easy substitutes. That user actually does have a real choice with respect
to disposing of its intellectual property: it can keep the innovation secret
and profit from in-house use only, it can license it, or it can choose to freely
reveal the innovation. We have just seen that the practical likelihood
of keeping a secret is low, especially when there are multiple potential
providers of very similar secrets. But if one legally protects an innovation by
means of a patent or a copyright, one need not keep an innovation secret
in order to control it. Thus, a firm or an individual that freely reveals is
forgoing any chance to get a profit via licensing of intellectual property for
a fee. What, in practical terms, is the likelihood of succeeding at this and so
of forgoing profit by choosing to freely reveal?
In most subject matters, the relevant form of legal protection for intel-
lectual property is the patent, generally the “utility” patent. (The notable
exception is the software industry, where material to be licensed is often
Why Users Often Freely Reveal Innovations 83
Table 6.1Even very specialized information is often widely known. Tabulated here are answers
to a question asked of help-line information providers: “How many others do you
think knew the answer to the question you answered?”
Frequent providers Other providers
(n = 21) (n = 67)
Many 38% 61%
A few with good Apache knowledge 38% 18%
A few with specific problem experience 24% 21%
Source: Lakhani and von Hippel 2003, table 10.
protected by copyright.) In the United States, utility patents may be granted
for inventions related to composition of matter and/or a method and/or a
use. They may not be granted for ideas per se, mathematical formulas, laws
of nature, and anything repugnant to morals and public policy. Within sub-
ject matters potentially protectable by patent, protection will be granted
only when the intellectual property claimed meets additional criteria of use-
fulness, novelty, and non-obviousness to those skilled in the relevant art.
(The tests for whether these criteria have been met are based on judgement.
When a low threshold is used, patents are easier to get, and vice-versa (Hall
and Harhoff 2004).)
The real-world value of patent protection has been studied for more than
40 years. Various researchers have found that, with a few exceptions, inno-
vators do not think that patents are very useful either for excluding imita-
tors or for capturing royalties in most industries. (Fields generally cited as
exceptions are pharmaceuticals, chemicals, and chemical processes, where
patents do enable markets for technical information (Arora et al. 2001).)
Most respondents also say that the availability of patent protection does not
induce them to invest more in research and development than they would
if patent protection did not exist. Taylor and Silberston (1973) reported that
24 of 32 firms said that only 5 percent or less of their R&D expenditures
were dependent on the availability of patent protection. Levin et al. (1987)
surveyed 650 R&D executives in 130 different industries and found that all
except respondents from the chemical and pharmaceutical industries
judged patents to be “relatively ineffective.” Similar findings have been
reported by Mansfield (1968, 1985), by Cohen et al. (2000, 2002), by
Arundel (2001), and by Sattler (2003).
Despite recent governmental efforts to strengthen patent enforcement, a
comparison of survey results indicates only a modest increase between 1983
and 1994 in large firms’ evaluations of patents’ effectiveness in protecting
innovations or promoting innovation investments. Of course, there are
notable exceptions: some firms, including IBM and TI, report significant
income from the licensing of their patented technologies.
Obtaining a patent typically costs thousands of dollars, and it can take
years (Harhoff, Henkel, and von Hippel 2003). This makes patents especially
impractical for many individual user-innovators, and also for small and
medium-size firms of limited means. As a stark example, it is hard to imag-
ine that an individual user who has developed an innovation in sports
84 Chapter 6
equipment would find it appealing to invest in a patent and in follow-on
efforts to find a licensee and enforce payment. The few that do attempt this,
as Shah (2000) has shown, seldom gain any return from licensees as pay-
ment for their time and expenditures.
Copyright is a low-cost and immediate form of legal protection that
applies to original writings and images ranging from software code to
movies. Authors do not have to apply for copyright protection; it “follows
the author’s pen across the page.” Licensing of copyrighted works is com-
mon, and it is widely practiced by commercial software firms. When one
buys a copy of a non-custom software product, one is typically buying only
a license to use the software, not buying the intellectual property itself.
However, copyright protection is also limited in an important way. Only the
specific original writing itself is protected, not the underlying invention
or ideas. As a consequence, copyright protections can be circumvented.
For example, those who wish to imitate the function of a copyrighted soft-
ware program can do so by writing new software code to implement that
function.
Given the above, we may conclude that in practice little profit is being sac-
rificed by many user-innovator firms or individuals that choose to forgo the
possibility of legally protecting their innovations in favor of free revealing.
Positive Incentives for Free Revealing
As was noted earlier, when we say that an innovator “freely reveals” pro-
prietary information we mean that all existing and potential intellectual
property rights to that information are voluntarily given up by that inno-
vator and that all interested parties are given access to it—the information
becomes a public good. These conditions can often be met at a very low
cost. For example, an innovator can simply post information about the
innovation on a website without publicity, so those potentially interested
must discover it. Or a firm that has developed a novel process machine can
agree to give a factory tour to any firm or individual that thinks to ask for
one, without attempting to publicize the invention or the availability of
such tours in any way. However, it is clear that many innovators go beyond
basic, low-cost forms of free revealing. They spend significant money and
time to ensure that their innovations are seen in a favorable light, and that
information about them is effectively and widely diffused. Writers of com-
puter code may work hard to eliminate all bugs and to document their code
Why Users Often Freely Reveal Innovations 85
in a way that is very easy for potential adopters to understand before freely
revealing it. Plant owners may repaint their plant, announce the availabil-
ity of tours at a general industry meeting, and then provide a free lunch for
their visitors.
Innovators’ active efforts to diffuse information about their innovations
suggest that there are positive, private rewards to be obtained from free
revealing. A number of authors have considered what these might be. Allen
(1983) proposed that reputation gained for a firm or for its managers might
offset a reduction in profits for the firm caused by free revealing. Raymond
(1999) and Lerner and Tirole (2002) elaborated on this idea when explain-
ing free revealing by contributors to open source software development
projects. Free revealing of high-quality code, they noted, can increase a pro-
grammer’s reputation with his peers. This benefit can lead to other benefits,
such as an increase in the programmer’s value on the job market. Allen has
argued that free revealing might have effects that actually increase a firm’s
profits if the revealed innovation is to some degree specific to assets owned
by the innovator (see also Hirschleifer 1971).
Free revealing may also increase an innovator’s profit in other ways.
When an innovating user freely reveals an innovation, the direct result is to
increase the diffusion of that innovation relative to what it would be if the
innovation were either licensed at a fee or held secret. The innovating user
may then benefit from the increase in diffusion via a number of effects.
Among these are network effects. (The classic illustration of a network effect
is that the value of each telephone goes up as more are sold, because the
value of a phone is strongly affected by the number of others who can be
contacted in the network.) In addition, and very importantly, an innova-
tion that is freely revealed and adopted by others can become an informal
standard that may preempt the development and/or commercialization of
other versions of the innovation. If, as Allen suggested, the innovation that
is revealed is designed in a way that is especially appropriate to conditions
unique to the innovator, this can result in creating a permanent source of
advantage for that innovator.
Being first to reveal a certain type of innovation increases a user firm’s
chances of having its innovation widely adopted, other things being equal.
This may induce innovators to race to reveal first. Firms engaged in a patent
race may disclose information voluntarily if the profits from success do not
go only to the winner of the race. If being second quickly is preferable to
86 Chapter 6
being first relatively late, there will be an incentive for voluntary revealing
in order to accelerate the race (de Fraja 1993).
Incentives to freely reveal have been most deeply explored in the specific
case of open source software projects. Students of the open source software
development process report that innovating users have a number of
motives for freely revealing their code to open source project managers and
open source code users in general. If they freely reveal, others can debug
and improve upon the modules they have contributed, to everyone’s ben-
efit. They are also motivated to have their improvement incorporated into
the standard version of the open source software that is generally distrib-
uted by the volunteer open source user organization, because it will then
be updated and maintained without further effort on the innovator’s part.
This volunteer organization is the functional equivalent of a manufacturer
with respect to inducing manufacturer improvements, because a user-
developed improvement will be assured of inclusion in new “official” soft-
ware releases only if it is approved and adopted by the coordinating user
group. Innovating users also report being motivated to freely reveal their
code under a free or open source license by a number of additional factors.
These include giving support to open code and “giving back” to those
whose freely revealed code has been of value to them (Lakhani and Wolf
2005).
By freely revealing information about an innovative product or process, a
user makes it possible for manufacturers to learn about that innovation.
Manufacturers may then improve upon it and/or offer it at a price lower
than users’ in-house production costs (Harhoff et al. 2003). When the
improved version is offered for sale to the general market, the original user-
innovator (and other users) can buy it and gain from in-house use of the
improvements. For example, consider that manufacturers often convert
user-developed innovations (“home-builts”) into a much more robust and
reliable form when preparing them for sale on the commercial market. Also,
manufacturers offer related services, such as field maintenance and repair
programs, that innovating users must otherwise provide for themselves.
A variation of this argument applies to the free revealing among compet-
ing manufacturers documented by Henkel (2003). Competing developers
of embedded Linux systems were creating software that was specifically
designed to run the hardware products of their specific clients. Each manu-
facturer could freely reveal this equipment-specific code without fear of
Why Users Often Freely Reveal Innovations 87
direct competitive repercussions: it was applicable mainly to specific prod-
ucts made by a manufacturer’s client, and it was less valuable to others. At
the same time, all would jointly benefit from free revealing of improve-
ments to the underlying embedded Linux code base, upon which they all
build their proprietary products. After all, the competitive advantages of
all their products depended on this code base’s being equal to or better than
the proprietary software code used by other manufacturers of similar prod-
ucts. Additionally, Linux software was a complement to hardware that
many of the manufacturers in Henkel’s sample also sold. Improved Linux
software would likely increase sales of their complementary hardware prod-
ucts. (Complement suppliers’ incentives to innovate have been modeled by
Harhoff (1996).)
Free Revealing and Reuse
Of course, free revealing is of value only if others (re)use what has been
revealed. It can be difficult to track what visitors to an information com-
mons take away and reuse, and there is as yet very little empirical infor-
mation on this important matter. Valuable forms of reuse range from the
gaining of general ideas of development paths to pursue or avoid to
the adoption of specific designs. For example, those who download soft-
ware code from an open source project repository can use it to learn about
approaches to solving a particular software problem and/or they may reuse
portions of the downloaded code by inserting it directly into a software pro-
gram of their own. Von Krogh et al. (2004) studied the latter type of code
reuse in open source software and found it very extensive. Indeed, they
report that most of the lines of software code in the projects they studied
were taken from the commons of other open source software projects and
software libraries and reused.
In the case of academic publications, we see evidence that free revealing
does increase reuse—a matter of great importance to academics. A citation
is an indicator that information contained in an article has been reused:
the article has been read by the citing author and found useful enough to
draw to readers’ attention. Recent empirical studies are finding that articles
to which readers have open access—articles available for free download
from an author’s website, for example—are cited significantly more often
than are equivalent articles that are available only from libraries or from
88 Chapter 6
publishers’ fee-based websites. Antelman (2004) finds an increase in cita-
tions ranging from 45 percent in philosophy to 91 percent in mathematics.
She notes that “scholars in diverse disciplines are adopting open-access
practices at a surprisingly high rate and are being rewarded for it, as
reflected in [citations].”
Implications for Theory
We have seen that in practice free revealing may often be the best practical
course of action for innovators. How can we tie these observations back to
theory, and perhaps improve theory as a result? At present there are two
major models that characterize how innovation gets rewarded. The private
investment model is based on the assumption that innovation will be sup-
ported by private investors expecting to make a profit. To encourage private
investment in innovation, society grants innovators some limited rights to
the innovations they generate via patents, copyrights, and trade secrecy
laws. These rights are intended to assist innovators in getting private returns
from their innovation-related investments. At the same time, the monop-
oly control that society grants to innovators and the private profits they
reap create a loss to society relative to the free and unfettered use by all of
the knowledge that the innovators have created. Society elects to suffer this
social loss in order to increase innovators’ incentives to invest in the
creation of new knowledge (Arrow 1962; Dam 1995).
The second major model for inducing innovation is termed the collec-
tive action model. It applies to the provision of public goods, where a
public good is defined by its non-excludability and non-rivalry: if any user
consumes it, it cannot be feasibly withheld from other users, and all con-
sume it on the same terms (Olson 1967). The collective action model
assumes that innovators are required to relinquish control of knowledge or
other assets they have developed to a project and so make them a public
good. This requirement enables collective action projects to avoid the
social loss associated with the restricted access to knowledge of the private
investment model. At the same time, it creates problems with respect to
recruiting and motivating potential contributors. Since contributions to a
collective action project are a public good, users of that good have the
option of waiting for others to contribute and then free riding on what
they have done (Olson 1967).
Why Users Often Freely Reveal Innovations 89
The literature on collective action deals with the problem of recruiting
contributors to a task in a number of ways. Oliver and Marwell (1988) and
Taylor and Singleton (1993) predict that the description of a project’s goals
and the nature of recruiting efforts should matter a great deal. Other
researchers argue that the creation and deployment of selective incentives
for contributors is essential to the success of collective action projects. For
example, projects may grant special credentials to especially productive
project members (Friedman and McAdam 1992; Oliver 1980). The impor-
tance of selective incentives suggests that small groups will be most
successful at executing collective action projects. In small groups, selective
incentives can be carefully tailored for each group member and individual
contributions can be more effectively monitored (Olson 1967; Ostrom
1998).
Interestingly, successful open source software projects do not appear to
follow any of the guidelines for successful collective action projects just
described. With respect to project recruitment, goal statements provided by
successful open source software projects vary from technical and narrow to
ideological and broad, and from precise to vague and emergent (for exam-
ples, see goal statements posted by projects hosted on Sourceforge.net).1
Further, such projects may engage in no active recruiting beyond simply
posting their intended goals and access address on a general public website
customarily used for this purpose (for examples, see the Freshmeat.net
website). Also, projects have shown by example that they can be success-
ful even if large groups—perhaps thousands—of contributors are involved.
Finally, open source software projects seem to expend no effort to discour-
age free riding. Anyone is free to download code or seek help from project
websites, and no apparent form of moral pressure is applied to make a
compensating contribution (e.g., “If you benefit from this code, please also
contribute . . .”).
What can explain these deviations from expected practice? What, in
other words, can explain free revealing of privately funded innovations and
enthusiastic participation in projects to produce a public good? From the
theoretical perspective, Georg von Krogh and I think the answer involves
revisiting and easing some of the basic assumptions and constraints con-
ventionally applied to the private investment and collective action models
of innovation. Both, in an effort to offer “clean” and simple models for
research, have excluded from consideration a very rich and fertile middle
90 Chapter 6
ground where incentives for private investment and collective action can
coexist, and where a “private-collective” innovation model can flourish.
More specifically, a private-collective model of innovation occupies the
middle ground between the private investment model and the collective
action model by:
• Eliminating the assumption in private investment models that free reveal-
ing of innovations developed with private funds will represent a loss of pri-
vate profit for the innovator and so will not be engaged in voluntarily.
Instead the private-collective model proposes that under common condi-
tions free revealing of proprietary innovations may increase rather than
decrease innovators’ private profit.
• Eliminating the assumption in collective action models that a free rider
obtains benefits from the completed public good that are equal to those a
contributor obtains. Instead, the private-collective model proposes that
contributors to a public good can inherently obtain greater private benefits
than free riders. These provide incentives for participation in collective
action projects that need not be managed by project personnel (von Hippel
and von Krogh 2003).
In summation: Innovations developed at private cost are often revealed
freely, and this behavior makes economic sense for participants under com-
monly encountered conditions. A private-collective model of innovation
incentives can explain why and when knowledge created by private fund-
ing may be offered freely to all. When the conditions are met, society
appears to have the best of both worlds—new knowledge is created by
private funding and then freely revealed to all.
Why Users Often Freely Reveal Innovations 91

7 Innovation Communities
It is now clear that users often innovate, and that they often freely reveal
their innovations. But what about informal cooperation among users?
What about organized cooperation in development of innovations and
other matters? The answer is that both flourish among user-innovators.
Informal user-to-user cooperation, such as assisting others to innovate, is
common. Organized cooperation in which users interact within communi-
ties, is also common. Innovation communities are often stocked with use-
ful tools and infrastructure that increase the speed and effectiveness with
which users can develop and test and diffuse their innovations.
In this chapter, I first show that user innovation is a widely distributed
process and so can be usefully drawn together by innovation communities.
I next explore the valuable functions such communities can provide. I
illustrate with a discussion of free and open source software projects, a very
successful form of innovation community in the field of software develop-
ment. Finally, I point out that innovation communities are by no means
restricted to the development of information products such as software,
and illustrate with the case of a user innovation community specializing
in the development of techniques and equipment used in the sport of
kitesurfing.
User Innovation Is Widely Distributed
When users’ needs are heterogeneous and when the information drawn on
by innovators is sticky, it is likely that product-development activities will
be widely distributed among users, rather than produced by just a few pro-
lific user-innovators. It should also be the case that different users will tend
to develop different innovations. As was shown in chapter 5, individual
users and user firms tend to develop innovations that serve their particular
needs, and that fall within their individual “low-cost innovation niches.”
For example, a mountain biker who specializes in jumping from high plat-
forms and who is also an orthopedic surgeon will tend to develop innova-
tions that draw on both of these types of information: he might create
a seat suspension that reduces shock to bikers’ spines upon landing from a
jump. Another mountain biker specializing in the same activity but with
a different background—say aeronautical engineering—is likely to draw on
this different information to come up with a different innovation. From the
perspective of Fleming (2001), who has studied innovations as consisting of
novel combinations of pre-existing elements, such innovators are using
their membership in two distinct communities to combine previously
disparate elements. Baldwin and Clark (2003) and Henkel (2004a) explore
this type of situation in theoretical terms.
The underlying logic echoes that offered by Eric Raymond regarding
“Linus’s Law” in software debugging. In software, discovering and repair-
ing subtle code errors or bugs can be very costly (Brooks 1979). However,
Raymond argued, the same task can be greatly reduced in cost and also
made faster and more effective when it is opened up to a large community
of software users that each may have the information needed to identify
and fix some bugs. Under these conditions, Raymond says, “given a large
enough beta tester and co-developer base, almost every problem will be
characterized quickly and the fix obvious to someone. Or, less formally,
‘given enough eyeballs, all bugs are shallow.’” He explains: “More users
find more bugs because adding more users adds more ways of stressing the
program. . . . Each [user] approaches the task of bug characterization with
a slightly different perceptual set and analytical toolkit, a different angle
on the problem. So adding more beta-testers . . . increases the probability
that someone’s toolkit will be matched to the problem in such a way that
the bug is shallow to that person.” (1999, pp. 41–44)
The analogy to distributed user innovation is, of course, that each user
has a different set of innovation-related needs and other assets in place
which makes a particular type of innovation low-cost (“shallow”) to that
user. The assets of some user will then generally be found to be a just-right
fit to many innovation development problems. (Note that this argument
does not mean that all innovations will be cheaply done by users, or even
94 Chapter 7
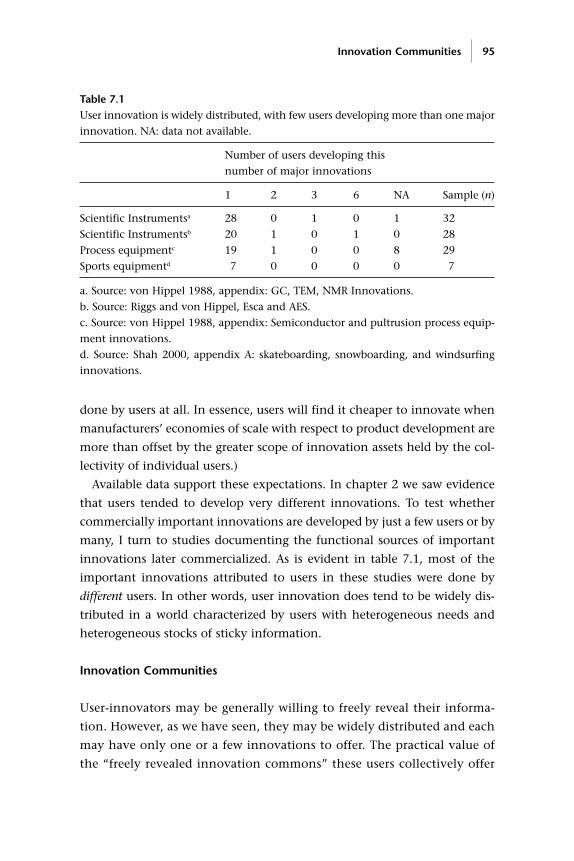
done by users at all. In essence, users will find it cheaper to innovate when
manufacturers’ economies of scale with respect to product development are
more than offset by the greater scope of innovation assets held by the col-
lectivity of individual users.)
Available data support these expectations. In chapter 2 we saw evidence
that users tended to develop very different innovations. To test whether
commercially important innovations are developed by just a few users or by
many, I turn to studies documenting the functional sources of important
innovations later commercialized. As is evident in table 7.1, most of the
important innovations attributed to users in these studies were done by
different users. In other words, user innovation does tend to be widely dis-
tributed in a world characterized by users with heterogeneous needs and
heterogeneous stocks of sticky information.
Innovation Communities
User-innovators may be generally willing to freely reveal their informa-
tion. However, as we have seen, they may be widely distributed and each
may have only one or a few innovations to offer. The practical value of
the “freely revealed innovation commons” these users collectively offer
Innovation Communities 95
Table 7.1User innovation is widely distributed, with few users developing more than one major
innovation. NA: data not available.
Number of users developing this
number of major innovations
1 2 3 6 NA Sample (n)
Scientific Instrumentsa 28 0 1 0 1 32
Scientific Instrumentsb 20 1 0 1 0 28
Process equipmentc 19 1 0 0 8 29
Sports equipmentd 7 0 0 0 0 7
a. Source: von Hippel 1988, appendix: GC, TEM, NMR Innovations.
b. Source: Riggs and von Hippel, Esca and AES.
c. Source: von Hippel 1988, appendix: Semiconductor and pultrusion process equip-
ment innovations.
d. Source: Shah 2000, appendix A: skateboarding, snowboarding, and windsurfing
innovations.
will be increased if their information is somehow made conveniently
accessible. This is one of the important functions of “innovation
communities.”
I define “innovation communities” as meaning nodes consisting of indi-
viduals or firms interconnected by information transfer links which may
involve face-to-face, electronic, or other communication. These can, but
need not, exist within the boundaries of a membership group. They often
do, but need not, incorporate the qualities of communities for participants,
where “communities” is defined as meaning“networks of interpersonal ties
that provide sociability, support, information, a sense of belonging, and
social identity” (Wellman et al. 2002, p. 4).1
Innovation communities can have users and/or manufacturers as mem-
bers and contributors. They can flourish when at least some innovate and
voluntarily reveal their innovations, and when others find the information
revealed to be of interest. In previous chapters, we saw that these conditions
do commonly exist with respect to user-developed innovations: users inno-
vate in many fields, users often freely reveal, and the information revealed
is often used by manufacturers to create commercial products—a clear indi-
cation many users, too, find this information of interest.
Innovation communities are often specialized, serving as collection
points and repositories for information related to narrow categories of inno-
vations. They may consist only of information repositories or directories in
the form of physical or virtual publications. For example, userinnova-
tion.mit.edu is a specialized website where researchers can post articles on
their findings and ideas related to innovation by users. Contributors and
non-contributors can freely access and browse the site as a convenient way
to find such information.
Innovation communities also can offer additional important functions to
participants. Chat rooms and email lists with public postings can be pro-
vided so that contributors can exchange ideas and provide mutual assis-
tance. Tools to help users develop, evaluate, and integrate their work can
also be provided to community members—and such tools are often devel-
oped by community members themselves.
All the community functionality just mentioned and more is visible in
communities that develop free and open source software programs. The
emergence of this particular type of innovation community has also done
a great deal to bring the general phenomenon to academic and public
96 Chapter 7
notice, and so I will describe them in some detail. I first discuss the history
and nature of free and open source software itself (the product). Next I out-
line key characteristics of the free and open source software development
projects typically used to create and maintain such software (the
community-based development process).
Open Source Software
In the early days of computer programming, commercial “packaged” soft-
ware was a rarity—if you wanted a particular program for a particular pur-
pose, you typically wrote the code yourself or hired someone to write it for
you. Much of the software of the 1960s and the 1970s was developed in aca-
demic and corporate laboratories by scientists and engineers. These indi-
viduals found it a normal part of their research culture to freely give and
exchange software they had written, to modify and build on one another’s
software, and to freely share their modifications. This communal behavior
became a central feature of “hacker culture.” (In communities of open
source programmers, “hacker” is a positive term that is applied to talented
and dedicated programmers.2)
In 1969, the Defense Advanced Research Projects Agency, a part of the
US Department of Defense, established the ARPANET, the first transconti-
nental high-speed computer network. This network eventually grew to link
hundreds of universities, defense contractors, and research laboratories.
Later succeeded by the Internet, it also allowed hackers to exchange soft-
ware code and other information widely, easily, and cheaply—and also
enabled them to spread hacker norms of behavior.
The communal hacker culture was very strongly present among a group
of programmers—software hackers—housed at MIT’s Artificial Intelligence
Laboratory in the 1960s and the 1970s (Levy 1984). In the 1980s this
group received a major jolt when MIT licensed some of the code created
by its hacker employees to a commercial firm. This firm, in accordance
with normal commercial practice, then promptly restricted access to the
“source code”3 of that software, and so prevented non-company person-
nel—including the MIT hackers who had been instrumental in develop-
ing it—from continuing to use it as a platform for further learning and
development.
Richard Stallman, a brilliant programmer in MIT’s Artificial Intelligence
Laboratory, was especially distressed by the loss of access to communally
Innovation Communities 97
developed source code. He also was offended by a general trend in the soft-
ware world toward development of proprietary software packages and the
release of software in forms that could not be studied or modified by oth-
ers. Stallman viewed these practices as morally wrong impingements on the
rights of software users to freely learn and create. In 1985, in response, he
founded the Free Software Foundation and set about to develop and diffuse
a legal mechanism that could preserve free access for all to the software
developed by software hackers. Stallman’s pioneering idea was to use the
existing mechanism of copyright law to this end. Software authors inter-
ested in preserving the status of their software as “free” software could use
their own copyright to grant licenses on terms that would guarantee a num-
ber of rights to all future users. They could do this by simply affixing a stan-
dard license to their software that conveyed these rights. The basic license
developed by Stallman to implement this seminal idea was the General
Public License or GPL (sometimes referred to as copyleft, in a play on the
word “copyright”). Basic rights transferred to those possessing a copy of free
software include the right to use it at no cost, the right to study its source
code, the right to modify it, and the right to distribute modified or unmod-
ified versions to others at no cost. Licenses conveying similar rights were
developed by others, and a number of such licenses are currently used in
the open source field. Free and open source software licenses do not grant
users the full rights associated with free revealing as that term was defined
earlier. Those who obtain the software under a license such as the GPL are
restricted from certain practices. For example, they cannot incorporate GPL
software into proprietary software that they then sell.4 Indeed, contributors
of code to open source software projects are very concerned with enforcing
such restrictions in order to ensure that their code remains accessible to all
(O’Mahony 2003).
The idea of free software did not immediately become mainstream, and
industry was especially suspicious of it. In 1998, Bruce Perens and Eric
Raymond agreed that a significant part of the problem resided in Stallman’s
term “free” software, which might understandably have an ominous ring to
the ears of businesspeople. Accordingly, they, along with other prominent
hackers, founded the open source software movement (Perens 1999). Open
source software uses the licensing practices pioneered by the free software
movement. It differs from that movement primarily on philosophical
grounds, preferring to emphasize the practical benefits of its licensing prac-
98 Chapter 7
tices over issues regarding the moral importance of granting users the free-
doms offered by both free and open source software. The term “open
source” is now generally used by both practitioners and scholars to refer to
free or open source software, and that is the term I use in this book.
Open source software has emerged as a major cultural and economic phe-
nomenon. The number of open source software projects has been growing
rapidly. In mid 2004, a single major infrastructure provider and repository
for open source software projects, Sourceforge.net,5 hosted 83,000 projects
and had more than 870,000 registered users. A significant amount of soft-
ware developed by commercial firms is also being released under open
source licenses.
Open Source Software Development Projects
Software can be termed “open source” independent of how or by whom it
has been developed: the term denotes only the type of license under which
it is made available. However, the fact that open source software is freely
accessible to all has created some typical open source software develop-
ment practices that differ greatly from commercial software development
models—and that look very much like the “hacker culture” behaviors
described above.
Because commercial software vendors typically wish to sell the code they
develop, they sharply restrict access to the source code of their software
products to firm employees and contractors. The consequence of this
restriction is that only insiders have the information required to modify
and improve that proprietary code further (Meyer and Lopez 1995; Young,
Smith, and Grimm 1996; Conner and Prahalad 1996). In sharp contrast, all
are offered free access to the source code of open source software if that code
is distributed by its authors. In early hacker days, this freedom to learn and
use and modify software was exercised by informal sharing and co-
development of code—often by the physical sharing and exchange of com-
puter tapes and disks on which the code was recorded. In current Internet
days, rapid technological advances in computer hardware and software and
networking technologies have made it much easier to create and sustain a
communal development style on ever-larger scales. Also, implementing
new projects is becoming progressively easier as effective project design
becomes better understood, and as prepackaged infrastructural support for
such projects becomes available on the Web.
Innovation Communities 99
Today, an open source software development project is typically initi-
ated by an individual or a small group seeking a solution to an individual’s
or a firm’s need. Raymond (1999, p. 32) suggests that “every good work of
software starts by scratching a developer’s personal itch” and that “too
often software developers spend their days grinding away for pay at pro-
grams they neither need nor love. But not in the (open source) world. . . .”
A project’s initiators also generally become the project’s “owners” or
“maintainers” who take on responsibility for project management.6 Early
on, this individual or group generally develops a first, rough version of the
code that outlines the functionality envisioned. The source code for this
initial version is then made freely available to all via downloading from an
Internet website established by the project. The project founders also set
up infrastructure for the project that those interested in using or further
developing the code can use to seek help, provide information or provide
new open source code for others to discuss and test. In the case of projects
that are successful in attracting interest, others do download and use and
“play with” the code—and some of these do go on to create new and mod-
ified code. Most then post what they have done on the project website for
use and critique by any who are interested. New and modified code that is
deemed to be of sufficient quality and of general interest by the project
maintainers is then added to the authorized version of the code. In many
projects the privilege of adding to the authorized code is restricted to only
a few trusted developers. These few then serve as gatekeepers for code writ-
ten by contributors who do not have such access (von Krogh and Spaeth
2002).
Critical tools and infrastructure available to open source software project
participants includes email lists for specialized purposes that are open to all.
Thus, there is a list where code users can report software failures (“bugs”)
that they encounter during field use of the software. There is also a list
where those developing the code can share ideas about what would be good
next steps for the project, good features to add, etc. All of these lists are
open to all and are also publicly archived, so anyone can go back and learn
what opinions were and are on a particular topic. Also, programmers con-
tributing to open source software projects tend to have essential tools, such
as specific software languages, in common. These are generally not specific
to a single project, but are available on the web. Basic toolkits held in com-
mon by all contributors tends to greatly ease interactions. Also, open source
100 Chapter 7
software projects have version-control software that allows contributors to
insert new code contributions into the existing project code base and test
them to see if the new code causes malfunctions in existing code. If so, the
tool allows easy reversion to the status quo ante. This makes “try it and see”
testing much more practical, because much less is at risk if a new contribu-
tion inadvertently breaks the code. Toolkits used in open source projects
have been evolved through practice and are steadily being improved by
user-innovators. Individual projects can now start up using standard infra-
structure sets offered by sites such as Sourceforge.net.
Two brief case histories will help to further convey the flavor of open
source software development.
Apache Web Server Software
Apache web server software is used on web server computers that host web
pages and provide appropriate content as requested by Internet browsers.
Such7 computers are a key element of the Internet-based World Wide Web
infrastructure.
The web server software that evolved into Apache was developed by
University of Illinois undergraduate Rob McCool for, and while working at,
the National Center for Supercomputing Applications (NCSA). The source
code as developed and periodically modified by McCool was posted on the
web so that users at other sites could download it, use it, modify it, and
develop it further. When McCool departed NCSA in mid 1994, a small
group of webmasters who had adopted his web server software for their own
sites decided to take on the task of continued development. A core group of
eight users gathered all documentation and bug fixes and issued a consoli-
dated patch. This “patchy” web server software evolved over time into
Apache. Extensive user feedback and modification yielded Apache 1.0,
released on December 1, 1995.
In 4 years, after many modifications and improvements contributed by
many users, Apache became the most popular web server software on the
Internet, garnering many industry awards for excellence. Despite strong
competition from commercial software developers such as Microsoft and
Netscape, it is currently used by over 60 percent of the world’s millions of
websites. Modification and updating of Apache by users and others contin-
ues, with the release of new versions being coordinated by a central group
of 22 volunteers.
Innovation Communities 101
Fetchmail—An Internet Email Utility Program
Fetchmail is an Internet email utility program that “fetches” email from cen-
tral servers to a local computer. The open source project to develop, main-
tain, and improve this program was led by Eric Raymond (1999).
Raymond first began to puzzle about the email delivery problem in 1993
because he was personally dissatisfied with then-existing solutions. “What
I wanted,” Raymond recalled (1999, p. 31), “was for my mail to be delivered
on snark, my home system, so that I would be notified when it arrived
and could handle it using all my local tools.” Raymond decided to try and
develop a better solution. He began by searching databases in the open
source world for an existing, well-coded utility that he could use as a devel-
opment base. He knew it would be efficient to build on others’ related work
if possible, and in the world of open source software (then generally called
free software) this practice is understood and valued. Raymond explored
several candidate open source programs, and settled on one in small-scale
use called “popclient.” He developed a number of improvements to the pro-
gram and proposed them to the then maintainer of popclient. It turned out
that this individual had lost interest in working further on the program,
and so his response to Raymond’s suggestions was to offer his role to
Raymond so that he could evolve the popclient further as he chose.
Raymond accepted the role of popclient’s maintainer, and over the next
months he improved the program significantly in conjunction with advice
and suggestions from other users. He carefully cultivated his more active
beta list of popclient users by regularly communicating with them via mes-
sages posted on an public electronic bulletin board set up for that purpose.
Many responded by volunteering information on bugs they had found and
perhaps fixed, and by offering improvements they had developed for their
own use. The quality of these suggestions was often high because “contri-
butions are received not from a random sample, but from people who are
interested enough to use the software, learn about how it works, attempt
to find solutions to the problems they encounter, and actually produce an
apparently reasonable fix. Anyone who passes all these filters is highly
likely to have something useful to contribute.” (ibid., p. 42)
Eventually, Raymond arrived at an innovative design that he knew
worked well because he and his beta list of co-developers had used it, tested
it and improved it every day. Popclient (now renamed fetchmail) became
standard software used by millions users. Raymond continues to lead the
102 Chapter 7
group of volunteers that maintain and improve the software as new user
needs and conditions dictate.
Development of Physical Products by Innovation Communities
User innovation communities are by no means restricted to the develop-
ment of information products like software. They also are active in the
development of physical products, and in very similar ways. Just as in the
case of communities devoted to information product, communities devoted
to physical products can range from simple information exchange sites to
sites well furnished with tools and infrastructure. Within sports, Franke and
Shah’s study illustrates relatively simple community infrastructure. Thus,
the boardercross community they studied consisted of semi-professional
athletes from all over the world who meet in up to 10 competitions a year
in Europe, North America, and Japan. Franke and Shah report that com-
munity members knew one another well, and spent a considerable amount
of time together. They also assisted one another in developing and modify-
ing equipment for their sport. However, the community had no specialized
sets of tools to support joint innovation development.
More complex communities devoted to the development of physical
products often look similar to open source software development commu-
nities in terms of tools and infrastructure. As an example, consider the
recent formation of a community dedicated to the development and dif-
fusion of information regarding novel kitesurfing equipment. Kitesurfing
is a water sport in which the user stands on a special board, somewhat like
a surfboard, and is pulled along by holding onto a large, steerable kite.
Equipment and technique have evolved to the point that kites can be
guided both with and against the wind by a skilled kitesurfer, and can lift
rider and board many meters into the air for tens of seconds at a time.
Designing kites for kitesurfing is a sophisticated undertaking, involving
low-speed aerodynamical considerations that are not yet well understood.
Early kites for kitesurfing were developed and built by user-enthusiasts who
were inventing both kitesurfing techniques and kitesurfing equipment
interdependently. In about 2001, Saul Griffith, an MIT PhD student with a
long-time interest in kitesurfing and kite development, decided that kite-
surfing would benefit from better online community interaction.
Accordingly, he created a site for the worldwide community of user-
Innovation Communities 103
innovators in kitesurfing (www.zeroprestige.com). Griffith began by posting
patterns for kites he had designed on the site and added helpful hints and
tools for kite construction and use. Others were invited to download this
information for free and to contribute their own if they wished. Soon other
innovators started to post their own kite designs, improved construction
advice for novices, and sophisticated design tools such as aerodynamics
modeling software and rapid prototyping software. Some kitesurfers con-
tributing innovations to the site had top-level technical skills; at least one
was a skilled aerodynamicist employed by an aerospace firm.
Note that physical products are information products during the design
stage. In earlier days, information about an evolving design was encoded
on large sheets of paper, called blueprints, that could be copied and
shared. The information on blueprints could be understood and assessed
by fellow designers, and could also be used by machinists to create the
actual physical products represented. Today, designs for new products are
commonly encoded in computer-aided design (CAD) files. These files can
be created and seen as two-dimensional and three-dimensional renderings
by designers. The designs they contain can also be subjected to automated
analysis by various engineering tools to determine, for example, whether
they can stand up to stresses to which they will be subjected. CAD files can
then be downloaded to computer-controlled fabrication machinery that
will actually build the component parts of the design.
The example of the kitesurfing group’s methods of sharing design infor-
mation illustrates the close relationship between information and physi-
cal products. Initially, users in the group exchanged design ideas by means
of simple sketches transferred over the Internet. Then group members
learned that computerized cutters used by sail lofts to cut sails from large
pieces of cloth are suited to cutting cloth for surfing kites. They also
learned that sail lofts were interested in their business. Accordingly, inno-
vation group members began to exchange designs in the form of CAD files
compatible with sail lofts’ cutting equipment. When a user was satisfied
with a design, he would transmit the CAD file to a local sail loft for cut-
ting. The pieces were then sewn together by the user or sent to a sewing
facility for assembly. The total time required to convert an information
product into a physical one was less than a week, and the total cost of a
finished kite made in this way was a few hundred dollars—much less than
the price of a commercial kite.
104 Chapter 7
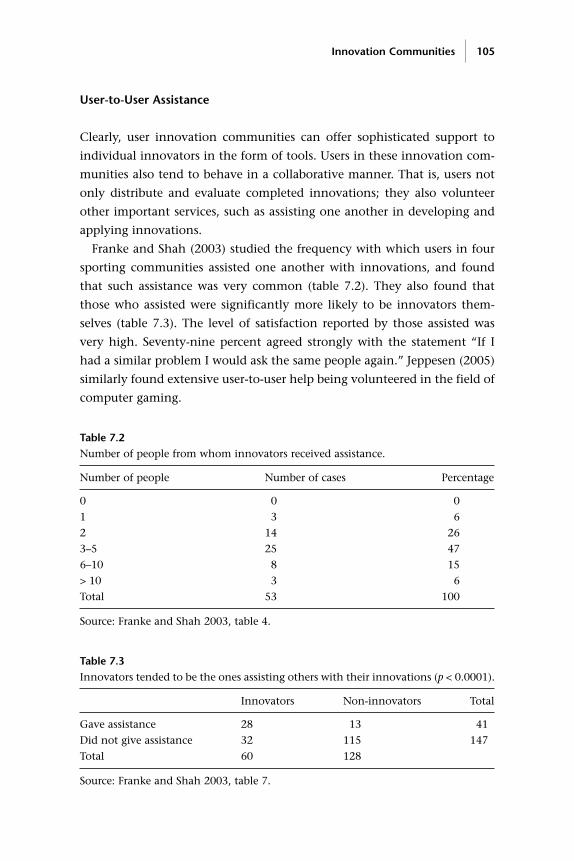
User-to-User Assistance
Clearly, user innovation communities can offer sophisticated support to
individual innovators in the form of tools. Users in these innovation com-
munities also tend to behave in a collaborative manner. That is, users not
only distribute and evaluate completed innovations; they also volunteer
other important services, such as assisting one another in developing and
applying innovations.
Franke and Shah (2003) studied the frequency with which users in four
sporting communities assisted one another with innovations, and found
that such assistance was very common (table 7.2). They also found that
those who assisted were significantly more likely to be innovators them-
selves (table 7.3). The level of satisfaction reported by those assisted was
very high. Seventy-nine percent agreed strongly with the statement “If I
had a similar problem I would ask the same people again.” Jeppesen (2005)
similarly found extensive user-to-user help being volunteered in the field of
computer gaming.
Innovation Communities 105
Table 7.2 Number of people from whom innovators received assistance.
Number of people Number of cases Percentage
0 0 0
1 3 6
2 14 26
3–5 25 47
6–10 8 15
> 10 3 6
Total 53 100
Source: Franke and Shah 2003, table 4.
Table 7.3
Innovators tended to be the ones assisting others with their innovations (p < 0.0001).
Innovators Non-innovators Total
Gave assistance 28 13 41
Did not give assistance 32 115 147
Total 60 128
Source: Franke and Shah 2003, table 7.

Such helping activity is clearly important to the value contributed by
innovation communities to community participants. Why people might
voluntarily offer assistance is a subject of analysis. The answers are not fully
in, but the mysteries lessen as the research progresses. An answer that
appears to be emerging is that there are private benefits to assistance
providers, just as there are for those who freely reveal innovations (Lakhani
and von Hippel 2003). In other words, provision of free assistance may be
explicable in terms of the private-collective model of innovation-related
incentives discussed earlier.
106 Chapter 7
8 Adapting Policy to User Innovation
Government policy makers generally wish to encourage activities that
increase social welfare, and to discourage activities that reduce it. Therefore,
it is important to ask about the social welfare effects of innovation by users.
Henkel and von Hippel (2005) explored this matter and concluded that
social welfare is likely to be higher in a world in which both users and man-
ufacturers innovate than in a world in which only manufacturers innovate.
In this chapter, I first explain that innovation by users complements
manufacturer innovation and can also be a source of success-enhancing
new product ideas for manufacturers. Next, I note that innovation by users
does not exhibit several welfare-reducing effects associated with innovation
by manufacturers. Finally, I evaluate the effects of public policies on user
innovation, and suggest modifications to those that—typically uninten-
tionally—discriminate against innovation by users.
Social Welfare Effects of User Innovation
Social welfare functions are used in welfare economics to provide a measure
of the material welfare of society, using economic variables as inputs. A
social welfare function can be designed to express many social goals, rang-
ing from population life expectancies to income distributions. Much of the
literature on product diversity, innovation, and social welfare evaluates the
impact of economic phenomena and policy on social welfare from the per-
spective of total income of a society without regard to how that income is
distributed. We will take that viewpoint here.
User Innovation Improves Manufacturers’ Success Rates
It is striking that most new products developed and introduced to the
market by manufacturers are commercial failures. Mansfield and Wagner
(1975) found the overall probability of success for new industrial products
to be only 27 percent. Elrod and Kelman (1987) found an overall proba-
bility of success of 26 percent for consumer products. Balachandra and
Friar (1997), Poolton and Barclay (1998), and Redmond (1995) found sim-
ilarly high failure rates in new products commercialized. Although there
clearly is some recycling of knowledge from failed projects to successful
ones, much of the investment in product development is highly specific.
This high failure rate therefore represents a huge inefficiency in the con-
version of R&D investment to useful output, and a corresponding reduc-
tion in social welfare.
Research indicates that the major reason for the commercial failure of
manufacturer-developed products is poor understanding of users’ needs by
manufacturer-innovators. The landmark SAPPHO study showed this in a
very clear and convincing way. This study was based on a sample of 31
product pairs. Members of each pair were selected to address the same func-
tion and market. (For example, one pair consisted of two “roundness
meters,” each developed by a separate company.) One member of each pair
was a commercial success (which showed that there was a market for the
product type); the other was a commercial failure. The development process
for each successful and failing product was then studied in detail. The pri-
mary factor found to distinguish success from failure was that a deeper
understanding of the market and the need was associated with successful
projects (Achilladelis et al. 1971; Rothwell et al. 1974). A study by Mansfield
and Wagner (1975) came to the same conclusion. More recent studies of
information stickiness and the resulting asymmetries of information held
by users and manufacturers, discussed in chapter 3, support the reason-
ableness of this general finding. Users are the generators of information
regarding their needs. The decline in accuracy and completeness of need
information after transfer from user to manufacturer is likely to be substan-
tial because important elements of this information are likely to be sticky
(von Hippel 1994; Ogawa 1998).
Innovations developed by users can improve manufacturers’ information
on users’ needs and so improve their new product introduction success
rates. Recall from previous chapters that innovation by users is concen-
trated among lead users. These lead users tend, as we have seen, to develop
functionally novel products and product modifications addressing their
own needs at the leading edge of markets where potential sales are both
108 Chapter 8
small and uncertain. Manufacturers, in contrast, have poorer information
on users’ needs and use contexts, and will prefer to manufacture innova-
tions for larger, more certain markets. In the short term, therefore, user
innovations will tend to complement rather than substitute for products
developed by manufacturers. In the longer term, the market as a whole
catches up to the needs that motivated the lead user developments, and
manufacturers will begin to find production of similar innovations to be
commercially attractive. At that point, innovations by lead users can pro-
vide very useful information to manufacturers that they would not other-
wise have.
As lead users develop and test their solutions in their own use environ-
ments, they learn more about the real nature of their needs. They then often
freely reveal information about their innovations. Other users then may
adopt the innovations, comment on them, modify and improve them, and
freely reveal what they have done in turn. All of this freely revealed activ-
ity by lead users offers manufacturers a great deal of useful information
about both needs embodied in solutions and about markets. Given access
to a user-developed prototype, manufacturers no longer need to understand
users’ needs very accurately and richly. Instead they have the much easier
task of replicating the function of user prototypes that users have already
demonstrated are responsive to their needs. For example, a manufacturer
seeking to commercialize a new type of surgical equipment and coming
upon prototype equipment developed by surgeons need not understand
precisely why the innovators want this product or even precisely how it is
used; the manufacturer need only understand that many surgeons appear
willing to pay for it and then reproduce the important features of the user-
developed prototypes in a commercial product.
Observation of innovation by lead users and adoption by follow-on users
also can give manufacturers a better understanding of the size of the poten-
tial market. Projections of product sales have been shown to be much more
accurate when they are based on actual customer behavior than when they
are based on potential buyers’ pre-use expectations. Monitoring of field use
of user-built prototypes and of their adoption by other users can give man-
ufacturers rich data on precisely these matters and so should improve
manufacturer’s commercial success. In net, user innovation helps to reduce
information asymmetries between users and manufacturers and so increases
the efficiency of the innovation process.
Adapting Policy to User Innovation 109
User Innovation and Provisioning Biases
The economic literature on the impact of innovation on social welfare gen-
erally seeks to understand effects that might induce society to create too
many product variations (overprovisioning) or too few (underprovisioning)
from the viewpoint of net social economic income (Chamberlin 1950).
Greater variety of products available for purchase is assumed to be desirable,
in that it enables consumers to get more precisely what they want and/or to
own a more diverse array of products. However, increased product diversity
comes at a cost: smaller quantities of each product will be produced on aver-
age. This in turn means that development-related and production-related
economies of scale are likely to be less. The basic tradeoff between variety
and cost is what creates the possibility of overprovisioning or underprovi-
sioning product variety. Innovations such as flexible manufacturing may
reduce fixed costs associated with increased diversity and so shift the opti-
mal degree of diversity upward. Nonetheless, the conflict still persists.
Henkel and I studied the welfare impact of adding users as a source of
innovation to existing analyses of product diversity, innovation, and social
welfare. Existing models uniformly contained the assumption that new
products and services were supplied to the economy by manufacturers only.
We found that the addition of innovation by users to these analyses largely
avoids the welfare-reducing biases that had been identified. For example,
consider “business stealing” (Spence 1976). This term refers to the fact that
commercial manufacturers benefit by diverting business from their competi-
tors. Since they do not take this negative externality into account, their pri-
vate gain from introducing new products exceeds society’s total gain, tilting
the balance toward overprovision of variety. In contrast, a freely revealed
user innovation may also reduce incumbents’ business, but not to the inno-
vator’s benefit. Hence, innovation incentives are not socially excessive.
Freely revealed innovations by users are also likely to reduce deadweight
loss caused by pricing of products above their marginal costs. (Deadweight
loss is a reduction in social welfare that occurs when goods are sold at a
price above their marginal cost of production.) When users make informa-
tion about their innovations available for free, and if the marginal cost of
revealing that information is zero, an imitator only has to bear the cost of
adoption. This is statically efficient. The availability of free user innovations
can also induce sellers of competing commercial offerings to reduce their
prices, thus indirectly leading to another reduction in dead-weight loss.
110 Chapter 8
Reducing prices toward marginal costs can also reduce incentives to over-
provision variety (Tirole 1988).
Henkel and I also explored a few special situations where social welfare
might be reduced by the availability of freely revealed user innovations. One
of these was the effect of reduced pricing power on manufacturers that cre-
ate “platform” products. Often, a manufacturer of such a product will want
to sell the platform—a razor, an ink-jet printer, a video-game player—at a
low margin or a loss, and then price necessary add-ons (razor blades, ink
cartridges, video games) at a much higher margin. If the possibility of freely
revealed add-ons developed by users makes development of a platform
unprofitable for a manufacturer, social welfare can thereby be reduced.
However, it is only the razor-vs.-blade pricing scheme that may become
unprofitable. Indeed, if the manufacturer makes positive margins on the
platform, then the availability of user-developed add-ons can have a posi-
tive effect: it can increase the value of the platform to users, and so allow
manufacturers to charge higher margins on it and/or sell more units.
Jeppesen (2004) finds that this is in fact the outcome when users introduce
free game modifications (called mods) operating on proprietary game soft-
ware platform products (called engines) sold by game manufacturers. Even
though the game manufacturers also sell mods commercially that compete
with free user mods, many provide active support for the development and
diffusion of user mods built on their proprietary game engines, because
they find that the net result is increased sales and profits.
Public Policy Choices
If innovation by users is welfare enhancing and is also significant in
amount and value, then it makes sense to consider the effects of public pol-
icy on user innovation. An important first step would be to collect better
data. Currently, much innovation by users—which may in aggregate turn
out to be a very large fraction of total economic investment in innovation—
goes uncounted or undercounted. Thus, innovation effort that is volun-
teered by users, as is the case with many contributions to open source
software, is currently not recorded by governmental statistical offices. This
is also the case for user innovation that is integrated with product and serv-
ice production. For example, much process innovation by manufacturers
occurs on the factory floor as they produce goods and simultaneously learn
Adapting Policy to User Innovation 111
how to improve their production processes. Similarly, many important
innovations developed by surgeons are woven into learning by doing as
they deliver services to patients.
Next, it will be important to review innovation-related public policies to
identify and correct biases with respect to sources of innovation. On a level
playing field, users will become a steadily more important source of inno-
vation, and will increasingly substitute for or complement manufacturers’
innovation-related activities. Transitions required of policy making to sup-
port this ongoing evolution are important but far from painless. To illus-
trate, we next review issues related to the protection intellectual property,
related to policies restricting product modifications, related to source-
biased subsidies for R&D, and related to control over innovation diffusion
channels.
Intellectual Property
Earlier, when we explored why users might freely reveal their innovations,
we concluded that it was often their best practical choice in view of how
intellectual property law actually functions (or, often, does not function) to
protect innovations today. For example, recall from chapter 6 that most
innovators do not judge patents to be very effective, and that the availabil-
ity of patent grant protection does not appear to increase innovation invest-
ments in most fields. Recall also that patent protection is costly to obtain,
and thus of little value to developers of minor innovations—with most
innovations being minor. We also saw that in practice it was often difficult
for innovators to protect their innovations via trade secrecy: it is hard to
keep a secret when many others know similar things, and when some of
these information holders will lose little or nothing from freely revealing
what they know.
These findings show that the characteristics of present-day intellectual
property regimes as actually experienced by innovators are far from the
expectations of theorists and policy makers. The fundamental reason that
societies elect to grant intellectual property rights to innovators is to
increase private investment in innovation. At the same time, economists
have long known that there will be social welfare losses associated with
these grants: owners of intellectual property will generally restrict the use of
their legally protected information in order to increase private profits. In
other words, intellectual property rights are thought to be good for innova-
112 Chapter 8
tion and bad for competition. The consensus view has long been that the
good outweighs the bad, but Foray (2004) explains that this consensus is
now breaking down. Some—not all—are beginning to think that intellec-
tual property rights are bad for innovation too in many cases.
The need to grant private intellectual property rights to achieve socially
desirable levels of innovation is being questioned in the light of apparent
counterexamples. Thus, as we saw earlier, open source software commu-
nities do not allow contributing innovators to use their intellectual prop-
erty rights to control the use of their code. Instead, contributors use their
authors’ copyright to assign their code to a common pool to which all—
contributors and non-contributors alike—are granted equal access.
Despite this regime, innovation seems to be flourishing. Why? As we saw
in our earlier discussions of why innovators might freely reveal their inno-
vations, researchers now understand that significant private rewards to
innovation can exist independent of intellectual property rights grants.
As a general principle, intellectual property rights grants should not be
offered if and when developers would seek protection but would innovate
without it.
The debate rages. Gallini and Scotchmer (2002) assert that “intellectual
property is the foundation of the modern information economy” and that
“it fuels the software, lifesciences and computer industries, and pervades
most other products we consume.” They also conclude that the positive or
negative effect of intellectual property rights on innovation depends cen-
trally on “the ease with which innovators can enter into agreements for
rearranging and exercising those rights.” This is precisely the rub from the
point of view of those who urge that present intellectual property regimes
be reconsidered: it is becoming increasingly clear that in practice rearrang-
ing and exercising intellectual property rights is often difficult rather than
easy. It is also becoming clear that the protections afforded by existing intel-
lectual property law can be strategically deployed to achieve private advan-
tage at the expense of general innovative progress (Foray 2004).
Consider an effect first pointed out by Merges and Nelson (1990) and fur-
ther explored as the “tragedy of the anticommons” by Heller (1998) and
Heller and Eisenberg (1998). A resource such as innovation-related informa-
tion is prone to underuse—a tragedy of the anticommons—when multiple
owners each have a right to exclude others and no one has an effective priv-
ilege of use. The nature of the patent grant can lead to precisely this type of
Adapting Policy to User Innovation 113
situation. Patent law is so arranged that an owner of a patent is not granted
the right to practice its invention—it is only granted the right to exclude
others from practicing it. For example, suppose you invent and patent the
chair. I then follow by inventing and patenting the rocking chair—imple-
mented by building rockers onto a chair covered by your patent. In this sit-
uation I cannot manufacture a rocking chair without getting a license from
you for the use of your chair patent, and you cannot build rocking chairs
either without a license to my rocker patent. If we cannot agree on licensing
terms, no one will have the right to build rocking chairs.
In theory and in a world of costless transactions, people could avoid
tragedies of the anticommons by licensing or trading their intellectual
property rights. In practice the situation can be very different. Heller and
Eisenberg point specifically to the field of biomedical research, and argue
that conditions for anticommons effects do exist there. In that field, patents
are routinely allowed on small but important elements of larger research
problems, and upstream research is increasingly likely to be private. “Each
upstream patent,” Heller and Eisenberg note, “allows its owner to set up
another tollbooth on the road to product development, adding to the cost
and slowing the pace of downstream biomedical innovation.”
A second type of strategic behavior based on patent rights involves invest-
ing in large portfolios of patents to create “patent thickets”—dense net-
works of patent claims across a wide field (Merges and Nelson 1990; Hall
and Ham Ziedonis 2001; Shapiro 2001; Bessen 2003). Patent thickets create
plausible grounds for patent infringement suits across a wide field. Owners
of patent thickets can use the threat of such suits to discourage others from
investing research dollars in areas of technical advance relevant to their
products. Note that this use of patents is precisely opposite to policy mak-
ers’ intentions to stimulate innovation by providing ways for innovators to
assert intellectual property rights. Indeed, Bessen and Hunt (2004) have
found in the field of software that, on average, as firm’s investments in
patent protection go up, their investments in research and development
actually go down. If this relationship proves causal, there is a reasonable
explanation from the viewpoint of private profit: corporations that can use
a patent thicket to deter others’ research in a field might well decide that
there is less need to do research of their own.
Similar innovation-retarding strategies can be applied by owners of large
collections of copyrighted work in the movie, publishing, and software
114 Chapter 8
fields. Copyright owners can prevent others from building new works on
characters (e.g. Mickey Mouse) that are already familiar to customers. The
result is that owners of large portfolios of copyrighted work can gain an
advantage over those with no or small portfolios in the creation of deriva-
tive works. Indeed, Benkler (2002) argues that institutional changes
strengthening intellectual property protection tend to foster concentration
of information production in general. Lessig (2001) and Boldrin and Levine
(2002) arrive at a similarly negative valuation of overly strong and lengthy
copyright protection.
These types of innovation-discouraging effects can affect innovation by
users especially strongly. The distributed innovation system we have docu-
mented consists of users each of whom might have only a few innovations
and a small amount of intellectual property. Such innovators are clearly
hurt differentially by a system that gives advantage to the owners of large
shares of the intellectual property in a field.
What can be done? A solution approach open to policy makers is to
change intellectual property law so as to level the playing field. But owners
of large amounts of intellectual property protected under the present sys-
tem are often politically powerful, so this type of solution will be difficult
to achieve.
Fortunately, an alternative solution approach may be available to inno-
vators themselves. Suppose that many elect to contribute the intellectual
property they individually develop to a commons in a particular field. If the
commons then grows to contain reasonable substitutes for much of the pro-
prietary intellectual property relevant to the field, the relative advantage
accruing to large holders of this information will diminish and perhaps
even disappear. At the same time and for the same reason, the barriers that
privately held stocks of intellectual property currently may raise to further
intellectual advance will also diminish. Lessig supports this possibility with
his creation and publication of standard “Creative Commons” licenses on
the website creativecommons.org. Authors interested in contributing their
work to the commons, perhaps with some restrictions, can easily find and
adopt an appropriate license at that site.
Reaching agreement on conditions for the formation of an intellectual
commons can be difficult. Maurer (2005) makes this clear in his cautionary
tale of the struggle and eventual failure to create a commons for data on
human mutations. However, success is possible. For example, an extensive
Adapting Policy to User Innovation 115
intellectual commons of software code is contained and maintained in the
many open source software projects that now exist.
Interesting examples also exist regarding on the impact a commons can
have on the value of intellectual property innovators seek to hold apart
from it. Weber (2004) recounts the following anecdote: In 1988, Linux
developers were building new graphical interfaces for their open source soft-
ware. One of the most promising of these, KDE, was offered under the
General Public License. However, Matthias Ettrich, its developer, had built
KDE using a proprietary graphical library called Qt. He felt at the time that
this could be an acceptable solution because Qt was of good quality and
Troll Tech, owner of Qt, licensed Qt at no charge under some circumstances.
However, Troll Tech did require a developer’s fee be paid under other cir-
cumstances, and some Linux developers were concerned about having code
not licensed under the GPL as part of their code. They tried to convince
Troll Tech to change the Qt license so that it would be under the GPL when
used in free software. But Troll Tech, as was fully within its rights, refused
to do this. Linux developers then, as was fully within their rights, began to
develop open source alternatives to Qt that could be licensed under the
GPL. As those projects moved toward success, Troll Tech recognized that Qt
might be surpassed and effectively shut out of the Linux market. In 2000
the company therefore decided to license Qt under the GPL.
Similar actions can keep conditions for free access to materials held
within a commons from degrading and being lost over time. Chris Hanson,
a Principal Research Scientist at MIT, illustrates this with an anecdote
regarding an open source software component called ipfilter. The author of
ipfilter attempted to “lock” the program by changing licensing terms of his
program to disallow the distribution of modified versions. His reasoning
was that Ipfilter, a network-security filter, must be as bug-free as possible,
and that this could best be ensured by his controlling access. His actions
ignited a flame war in which the author was generally argued to be selfish
and overreaching. His program, then an essential piece of BSD operating
systems, was replaced by newly written code in some systems within the
year. The author, Hanson notes, has since changed his licensing terms back
to a standard BSD-style (unrestricted) license.
We will learn over time whether and how widely the practice of creating
and defending intellectual commons diffuses across fields. There obviously
can be cases where it will continue to make sense for innovators, and for
116 Chapter 8
society as well, to protect innovations as private intellectual property.
However, it is likely that many user innovations are kept private not so
much out of rational motives as because of a general, not-thought-through
attitude that “we do not give away our intellectual property,” or because the
administrative cost of revealing is assumed to be higher than the benefits.
Firms and society can benefit by rethinking the benefits of free revealing
and (re)developing policies regarding what is best kept private and what is
best freely revealed.
Constraints on Product Modification
Users often develop prototypes of new products by buying existing com-
mercial products and modifying them. Current efforts by manufacturers
to build technologies into the products they sell that restrict the way these
products are used can undercut users’ traditional freedom to modify what
they purchase. This in turn can raise the costs of innovation development
by users and so lessen the amount of user innovation that is done. For
example, makers of ink-jet printers often follow a razor-and-blade strategy,
selling printers at low margins and the ink cartridges used in them at high
margins. To preserve this strategy, printer manufacturers want to prevent
users from refilling ink cartridges with low-cost ink and using them again.
Accordingly, they may add technical modifications to their cartridges to
prevent them from functioning if users have refilled them. This manufac-
turer strategy can potentially cut off both refilling by the economically
minded and modifications by user-innovators that might involve refilling
(Varian 2002). Some users, for example, have refilled cartridges with spe-
cial inks not sold by printer manufacturers in order to adapt ink-jet print-
ing to the printing of very high-quality photographs. Others have refilled
cartridges with food colorings instead of inks in order to develop tech-
niques for printing images on cakes. Each of these applications might
have been retarded or prevented by technical measures against cartridge
refilling.
The Digital Millennium Copyright Act, a legislative initiative intended to
prevent product copying, may negatively affect users’ abilities to change
and improve the products they own. Specifically, the DMCA makes it a
crime to circumvent anti-piracy measures built into most commercial soft-
ware. It also outlaws the manufacture, sale, or distribution of code-cracking
devices used to illegally copy software. Unfortunately, code cracking is also
Adapting Policy to User Innovation 117
a needed step for modification of commercial software products by user-
innovators. Policy makers should be aware of “collateral damage” that may
be inflicted on user innovation by legislation aimed at other targets, as is
likely in this case.
Control over Distribution Channels
Users that innovate and wish to freely diffuse innovation-related informa-
tion are able to do so cheaply in large part because of steady advances in
Internet distribution capabilities. Controls placed on such infrastructural
factors can threaten and maybe even totally disable distributed innovation
systems such as the user innovation systems documented in this book. For
example, information products developed by users are commonly distrib-
uted over the Internet by peer-to-peer sharing networks. A firm that owns
both a channel and content (e.g., a cable network) may have a strong incen-
tive to shut out or discriminate against content developed by users or oth-
ers in favor of its own content. The transition from the chaotic, fertile early
days of radio in the United States when many voices were heard, to an era
in which the spectrum was dominated by a few major networks—a transi-
tion pushed by major firms and enforced by governmental policy making—
provides a sobering example of what could happen (Lessig 2001). It will be
important for policy makers to be aware of this kind of incentive problem
and address it—in this case perhaps by mandating that ownership of con-
tent and ownership of channel be separated, as has long been the case for
other types of common carriers.
R&D Subsidies and Tax Credits
In many countries, manufacturing firms are rewarded for their innovative
activity by R&D subsidies and tax credits. Such measures can make eco-
nomic sense if average social returns to innovation are significantly higher
than average private returns, as has been found by Mansfield et al. (1977)
and others. However, important innovative activities carried out by users
are often not similarly rewarded, because they tend to not be documentable
as formal R&D activities. As we have seen, users tend to develop innova-
tions in the course of “doing” in their normal use environments. Bresnahan
and Greenstein (1996a) make a similar point. They investigate the role of
“co-invention” in the move by users from mainframe to client-server archi-
tecture.1 By “co-invention” Bresnahan and Greenstein mean organizational
118 Chapter 8
changes and innovations developed and implemented by users that are
required to take full advantage of a new invention. They point out the high
importance that co-invention has for realizing social returns from innova-
tion. They consider the federal government’s support for creating “national
information infrastructures” insufficient or misallocated, since they view
co-invention is the bottleneck for social returns and likely the highest value
locus for invention.
Efforts to level the playing field for user innovation and manufacturer
innovation could, of course, also go in the direction of lessening R&D subsi-
dies or tax credits for all rather than attempting to increase user-innovators’
access to subsidies. However, if directing subsidies to user-innovators seems
desirable, social welfare will be best served if policy makers link them to free
revealing by user-innovators as well as or instead of tying them to users’ pri-
vate investments in the development of products for exclusive in-house use.
Otherwise, duplication of effort by users interested in the same innovation
will reduce potential welfare gains.
In sum, the welfare-enhancing effects found for freely revealed user inno-
vations suggest that policy makers should consider conditions required for
user innovation when creating policy and legislation. Leveling the playing
field for user-innovators and manufacturer-innovators will doubtless force
more rapid change onto manufacturers. However, as will be seen in the next
chapter, manufacturers can adapt to a world in which user innovation is at
center stage.
Adapting Policy to User Innovation 119

9 Democratizing Innovation
We have learned that lead users sometimes develop and modify products
for themselves and often freely reveal what they have done. We have also
seen that many users can be interested in adopting the solutions that lead
users have developed. Taken together, these findings offer the basis for user-
centered innovation systems that can entirely supplant manufacturer-based
innovation systems under some conditions and complement them under
most. User-centered innovation is steadily increasing in importance as com-
puting and communication technologies improve.
I begin this chapter with a discussion of the ongoing democratization of
innovation. I then describe some of the patterns in user-centered innova-
tion that are emerging. Finally, I discuss how manufacturers can find ways
to profitably participate in emerging, user-centered innovation processes.
The Trend toward Democratization
Users’ abilities to develop high-quality new products and services for them-
selves are improving radically and rapidly. Steady improvements in com-
puter software and hardware are making it possible to develop increasingly
capable and steadily cheaper tools for innovation that require less and less
skill and training to use. In addition, improving tools for communication
are making it easier for user innovators to gain access to the rich libraries of
modifiable innovations and innovation components that have been placed
into the public domain. The net result is that rates of user innovation will
increase even if users’ heterogeneity of need and willingness to pay for
“exactly right” products remain constant.
The radical nature of the change that is occurring in design capabilities
available to even individual users is perhaps difficult for those without
personal innovation experience to appreciate. An anecdote from my own
experience may help as illustration. When I was a child and designed new
products that I wanted to build and use, the ratio of not-too-pleasurable (for
me) effort required to actually build a prototype relative to the very pleas-
urable effort of inventing it and use-testing it was huge. (That is, in terms
of the design, build, test, evaluate cycle illustrated in figure 5.1, the effort
devoted to the “build” element of the cycle was very large and the rate of
iteration and learning via trial and error was very low.)
In my case it was especially frustrating to try to build anything sophisti-
cated from mechanical parts. I did not have a machine shop in which I
could make good parts from scratch, and it often was difficult to find or buy
the components I needed. As a consequence, I had to try to assemble an
approximation of my ideas out of vacuum cleaner parts and other bits of
metal and plastic and rubber that I could buy or that were lying around.
Sometimes I failed at this and had to drop an exciting project. For example,
I found no way to make the combustion chamber I needed to build a large
pulse-jet engine for my bicycle (in retrospect, perhaps a lucky thing!). Even
when I succeeded, the result was typically “unaesthetic”: the gap between
the elegant design in my mind and the crude prototype that I could realize
was discouragingly large.
Today, in sharp contrast, user firms and increasingly even individual hob-
byists have access to sophisticated design tools for fields ranging from soft-
ware to electronics to musical composition. All these information-based
tools can be run on a personal computer and are rapidly coming down in
price. With relatively little training and practice, they enable users to design
new products and services—and music and art—at a satisfyingly sophisti-
cated level. Then, if what has been created is an information product, such
as software or music, the design is the actual product—software you can use
or music you can play.
If one is designing a physical product, it is possible to create a design and
even conduct some performance testing by computer simulation. After
that, constructing a real physical prototype is still not easy. However, today
users do have ready access to kits that offer basic electronic and mechani-
cal building blocks at an affordable price, and physical product proto-
typing is becoming steadily easier as computer-driven 3-D parts printers
continue to go up in sophistication while dropping in price. Very excit-
ingly, even today home-built prototypes need not be poorly fashioned
122 Chapter 9
items that will fall apart with a touch in the wrong place—the solution
components now available to users are often as good as those available to
professional designers.
Functional equivalents of the resources for innovation just described have
long been available within corporations to a lucky few. Senior designers at
firms have long been supported by engineers and designers under their
direct control, and also with other resources needed to quickly construct
and test prototype designs. When I took a job as R&D manager at a start-up
firm after college, I was astounded at the difference professional-quality
resources made to both the speed and the joy of innovation. Product devel-
opment under these conditions meant that the proportion of one’s effort
that could be focused on the design and test portions of the innovation
cycle rather than on prototype building was much higher, and the rate of
progress was much faster.
The same story can be told in fields from machine design to clothing
design: just think of the staffs of seamstresses and models supplied by cloth-
ing manufacturers to their “top designers” so that these few can quickly
realize and test many variations on their designs. In contrast, think of the
time and effort that equally talented designers without such staff assistance
must engage in to stitch together even a single high-quality garment proto-
type on their own.
But, as we learned in chapter 7, the capability and the information
needed to innovate in important ways are in fact widely distributed. Given
this finding, we can see that the traditional pattern of concentrating inno-
vation-support resources on just a few pre-selected potential innovators is
hugely inefficient. High-cost resources for innovation support cannot be
allocated to “the right people,” because one does not know who they are
until they develop an important innovation. When the cost of high-quality
resources for design and prototyping becomes very low—which is the trend
we have described—these resources can be diffused widely, and the alloca-
tion problem then diminishes in significance. The net result is and will be
to democratize the opportunity to create.
Democratization of the opportunity to create is important beyond giving
more users the ability to make exactly right products for themselves. As we
saw in a previous chapter, the joy and the learning associated with creativ-
ity and membership in creative communities are also important, and these
experiences too are made more widely available as innovation is democra-
Democratizing Innovation 123
tized. The aforementioned Chris Hanson, a Principal Research Scientist at
MIT and a maintainer in the Debian Linux community, speaks eloquently
of this in his description of the joy and value he finds from his participa-
tion in an open source software community:
Creation is unbelievably addictive. And programming, at least for skilled program-
mers, is highly creative. So good programmers are compelled to program to feed the
addiction. (Just ask my wife!) Creative programming takes time, and careful attention
to the details. Programming is all about expressing intent, and in any large program
there are many areas in which the programmer’s intent is unclear. Clarification
requires insight, and acquiring insight is the primary creative act in programming.
But insight takes time and often requires extensive conversation with one’s peers.
Free-software programmers are relatively unconstrained by time. Community stan-
dards encourage deep understanding, because programmers know that understand-
ing is essential to proper function. They are also programming for themselves, and
naturally they want the resulting programs to be as good as they can be. For many, a
free software project is the only context in which they can write a program that
expresses their own vision, rather than implementing someone else’s design, or hack-
ing together something that the marketing department insists on. No wonder pro-
grammers are willing to do this in their spare time. This is a place where creativity
thrives.
Creativity also plays a role in the programming community: programming, like
architecture, has both an expressive and a functional component. Unlike architec-
ture, though, the expressive component of a program is inaccessible to non-pro-
grammers. A close analogy is to appreciate the artistic expression of a novel when you
don’t know the language in which it is written, or even if you know the language but
are not fluent. This means that creative programmers want to associate with one
another: only their peers are able to truly appreciate their art. Part of this is that pro-
grammers want to earn respect by showing others their talents. But it’s also impor-
tant that people want to share the beauty of what they have found. This sharing is
another act that helps build community and friendship.
Adapting to User-Centered Innovation—Like It or Not
User-centered innovation systems involving free revealing can sometimes
supplant product development carried out by manufacturers. This outcome
seems reasonable when manufacturers can obtain field-tested user designs
at no cost. As an illustration, consider kitesurfing (previously discussed in
chapter 7). The recent evolution of this field nicely shows how manufac-
turer-based product design may not be able to survive when challenged by
a user innovation community that freely reveals leading-edge designs devel-
124 Chapter 9
oped by users. In such a case, manufacturers may be obliged to retreat to
manufacturing only, specializing in modifying user-developed designs for
producibility and manufacturing these in volume.
Recall that equipment for kitesurfing was initially developed and built by
user-enthusiasts who were inventing both kitesurfing techniques and
kitesurfing equipment interdependently. Around 1999, the first of several
small manufacturers began to design and sell kitesurfing equipment com-
mercially. The market for kitesurfing equipment then began to grow very
rapidly. In 2001 about 5,000 kite-and-board sets were sold worldwide. In
2002 the number was about 30,000, and in 2003 it was about 70,000. With
a basic kite-and-board set selling for about $1,500, total sales in 2003
exceeded $100 million. (Many additional kites, home-made by users, are not
included in this calculation.) As of 2003, about 40 percent of the commer-
cial market was held by a US firm called Robbie Naish (Naishkites.com).
Recall also that in 2001 Saul Griffith, an MIT graduate student, estab-
lished an Internet site called Zeroprestige.com as a home for a community
of kitesurfing users and user-innovators. In 2003, the general consensus of
both site participants and manufacturers was that the kite designs devel-
oped by users and freely revealed on Zeroprestige.com were at least as
advanced as those developed by the leading manufacturers. There was also
a consensus that the level of engineering design tools and aggregate rate of
experimentation by kite users participating on the Zeroprestige.com site
was superior to that within any kite manufacturer. Indeed, this collective
user effort was probably superior in quality and quantity to the product-
development work carried out by all manufacturers in the industry taken
together.
In late 2003, a perhaps predictable event occurred: a kite manufacturer
began downloading users’ designs from Zeroprestige.com and producing
them for commercial sale. This firm had no internal kitesurfing product-
development effort and offered no royalties to user-innovators—who
sought none. It also sold its products at prices much lower than those
charged by companies that both developed and manufactured kites.
It is not clear that manufacturers of kitesurfing equipment adhering to
the traditional developer-manufacturer model can—or should—survive this
new and powerful combination of freely revealed collaborative design and
prototyping effort by a user innovation community combined with volume
production by a specialist manufacturer. In effect, free revealing of product
Democratizing Innovation 125
designs by users offsets manufacturers’ economies of scale in design with
user communities’ economies of scope. These economies arise from the het-
erogeneity in information and resources found in a user community.
Manufacturers’ Roles in User-Centered Innovation
Users are not required to incorporate manufacturers in their product-
development and product-diffusion activities. Indeed, as open source soft-
ware projects clearly show, horizontal innovation communities consisting
entirely of users can develop, diffuse, maintain, and consume software and
other information products by and for themselves—no manufacturer is
required. Freedom from manufacturer involvement is possible because
information products can be “produced” and distributed by users essen-
tially for free on the web (Kollock 1999). In contrast, production and diffu-
sion of physical products involves activities with significant economies of
scale. For this reason, while product development and early diffusion of
copies of physical products developed by users can be carried out by users
themselves and within user innovation communities, mass production and
general diffusion of physical products incorporating user innovations are
usually carried out by manufacturing firms.
For information products, general distribution is carried out within and
beyond the user community by the community itself; no manufacturer is
required:
Innovating lead users ➔ All users.
For physical products, general distribution typically requires manufacturers:
Innovating lead users ➔ Manufacturer ➔ All users.
In light of this situation, how can, should, or will manufacturers of products,
services, and processes play profitable roles in user-centered innovation sys-
tems? Behlendorf (1999), Hecker (1999) and Raymond (1999) explore what
might be possible in the specific context of open source software. More gen-
erally, many are experimenting with three possibilities: (1) Manufacturers
may produce user-developed innovations for general commercial sale and/or
offer a custom manufacturing service to specific users. (2) Manufacturers
may sell kits of product-design tools and/or “product platforms” to ease
users’ innovation-related tasks. (3) Manufacturers may sell products or serv-
ices that are complementary to user-developed innovations.
126 Chapter 9
Producing User-Developed Products
Firms can make a profitable business from identifying and mass producing
user-developed innovations or developing and building new products based
on ideas drawn from such innovations. They can gain advantages over com-
petitors by learning to do this better than other manufacturers. They may,
for example, learn to identify commercially promising user innovations
more effectively that other firms. Firms using lead user search techniques
such as those we will describe in chapter 10 are beginning to do this sys-
tematically rather than accidentally—surely an improvement. Effectively
transferring user-developed innovations to mass manufacture is seldom as
simple as producing a product based on a design by a single lead user. Often,
a manufacturer combines features developed by several independent lead
users to create an attractive commercial offering. This is a skill that a com-
pany can learn better than others in order to gain a competitive advantage.
The decision as to whether or when to take the plunge and commercial-
ize a lead user innovation(s) is also not typically straightforward, and com-
panies can improve their skills at inviting in the relevant information and
making such assessments. As was discussed previously, manufacturers often
do not understand emerging user needs and markets nearly as well as lead
users do. Lead users therefore may engage in entrepreneurial activities, such
as “selling” the potential of an idea to potential manufacturers and even
lining up financing for a manufacturer when they think it very important
to rapidly get widespread diffusion of a user-developed product. Lettl,
Herstatt, and Gemünden (2004), who studied the commercialization of
major advances in surgical equipment, found innovating users commonly
engaging in these activities. It is also possible, of course, for innovating lead
users to become manufacturers and produce the products they developed
for general commercial sale. This has been shown to occur fairly frequently
in the field of sporting goods (Shah 2000; Shah and Tripsas 2004; Hienerth
2004).
Manufacturers can also elect to provide custom production or “foundry”
services to users, differentiating themselves by producing users’ designs
faster, better, and/or cheaper than competitors. This type of business model
is already advanced in many fields. Custom machine shops specialize in
manufacturing mechanical parts to order; electronic assembly shops pro-
duce custom electronic products, chemical manufacturers offer “toll” man-
ufacturing of custom products designed by others, and so on. Suppliers of
Democratizing Innovation 127
custom integrated circuits offer an especially good example of custom man-
ufacture of products designed by users. More than $15 billion worth of cus-
tom integrated circuits were produced in 2002, and the cumulative average
growth rate of that market segment was 29 percent. Users benefit from
designing their own circuits by getting exactly what they want more
quickly than manufacturer-based engineers could supply what they need,
and manufacturers benefit from producing the custom designs for users
(Thomke and von Hippel 2002).
Supplying Toolkits and/or Platform Products to Users
Users interested in designing their own products want to do it efficiently.
Manufacturers can therefore attract them to kits of design tools that ease
their product-development tasks and to products that can serve as “plat-
forms” upon which to develop and operate user-developed modifications.
Some are supplying users with proprietary sets of design tools only. Cadence,
a supplier of design tools for corporate and even individual users interested
in designing their own custom semiconductor chips, is an example of this.
Other manufacturers, including Harley-Davidson in the case of motorcycles
and Microsoft in the case of its Excel spreadsheet software, sell platform
products intentionally designed for post-sale modification by users.
Some firms that sell platform products or design tools to users have
learned to systematically incorporate valuable innovations that users may
develop back into their commercial products. In effect, this second strategy
can often be pursued jointly with the manufacturing strategy described
above. Consider, for example, StataCorp of College Station, Texas.
StataCorp produces and sells Stata, a proprietary software program designed
for statistics. It sells the basic system bundled with a number of families of
statistical tests and with design tools that enable users to develop new tests
for operation on the Stata platform. Advanced customers, many of them
statisticians and social science researchers, find this capability very impor-
tant to their work and do develop their own tests. Many then freely reveal
tests they have developed on Internet websites set up by the users them-
selves. Other users then visit these sites to download and use, and perhaps
to test, comment on, and improve these tests, much as users do in open
source software communities.
StataCorp personnel monitor the activity at user sites, and note the new
tests that are of interest to many users. They then bring the most popular
128 Chapter 9
tests into their product portfolio as Stata modules. To do this, they rewrite
the user’s software code while adhering to the principles pioneered by the
user-innovator. They then subject the module to extensive validation test-
ing—a very important matter for statisticians. The net result is a symbiotic
relationship. User-innovators are publicly credited by Stata for their ideas,
and benefit by having their modules professionally tested. StataCorp gains
a new commercial test module, rewritten and sold under its own copyright.
Add-ons developed by users that are freely revealed will increase StataCorp’s
profits more than will equivalent add-ons developed and sold by manufac-
turers (Jokisch 2001). Similar strategies are pursued by manufacturers of
simulator software (Henkel and Thies 2003).
Note, however, that StataCorp, in order to protect its proprietary posi-
tion, does not reveal the core of its software program to users, and does not
allow any user to modify it. This creates problems for those users who need
to make modifications to the core in order to solve particular problems they
encounter. Users with problems of this nature and users especially
concerned about price have the option of turning to non-proprietary free
statistical software packages available on the web, such as the “R” project
(www.r-project.org). These alternatives are developed and supported by
user communities and are available as open source software. The eventual
effect of open source software alternatives on the viability of the business
models of commercial vendors such as StataCorp and its competitors
remains to be seen.
A very similar pattern exists in the online gaming industry. Vendors of
early online computer games were surprised to discover that sophisticated
users were deciphering their closed source code in order to modify the
games to be more to their liking. Some of these “mods” attracted large fol-
lowings, and some game vendors were both impressed and supportive.
Manufacturers also discovered that the net effect of user-developed mods
was positive for them: mods actually increased the sales of their basic soft-
ware, because users had to buy the vendors’ proprietary software engine
code in order to play the mods. Accordingly, a number of vendors began to
actively support user-developers by supplying them with design tools to
make it easier for them to build mods on their proprietary engine platforms
(Jeppesen and Molin 2003).
Both manufacturers and users involved with online gaming are experi-
menting with the possibilities of user-manufacturer symbiosis in a number
Democratizing Innovation 129
of additional ways. For example, some vendors are experimenting with cre-
ating company-supported distribution channels through which users—who
then become vendors—can sell their mods rather than simply offering
them as free downloads (Jeppesen 2004). At the same time, some user com-
munities are working in the opposite direction by joining together to
develop open source software engines for video games. If the latter effort is
successful, it will offer mod developers a platform and design tools that are
entirely non-proprietary for the first time. As in the case of statistical soft-
ware, the eventual outcomes of all these experiments are not yet clear.
As a final example of a strategy in which manufacturers offer a platform
to support user innovation of value to them, consider General Electric’s
innovation pattern with respect to the magnetic-resonance imaging
machines it sells for medical use. Michael Harsh (GE’s Director of R&D in
the division that produces MRI machines) and his colleagues realized that
nearly all the major, commercially important improvements to these
machines are developed by leading-edge users rather than by GE or by com-
peting machine producers. They also knew that commercialization of user-
developed improvements would be easier and faster for GE if the users had
developed their innovations using a GE MRI machine as a platform rather
than a competitor’s machine. Since MRI machines are expensive, GE devel-
oped a policy of selectively supplying machines at a very low price to
scientists GE managers judged most likely to develop important improve-
ments. These machines are supplied with restrictive interlocks removed so
that the users can easily modify them. In exchange for this research sup-
port, the medical researchers give GE preferred access to innovations they
develop. Over the years, supported researchers have provided a steady flow
of significant improvements that have been first commercialized by GE.
Managers consider the policy a major source of GE’s commercial success in
the MRI field.
Providing Complementary Products or Services
Many user innovations require or benefit from complementary products or
services, and manufacturers can often supply these at a profit. For example,
IBM profits from user innovation in open source software by selling the
complement of computer hardware. Specifically, it sells computer servers
with open source software pre-installed, and as the popularity of that soft-
ware goes up, so do server sales and profits. A firm named Red Hat distrib-
130 Chapter 9
utes a version of the open source software computer operating system
Linux, and also sells the complementary service of Linux technical support
to users. Opportunities to provide profitable complements are not neces-
sarily obvious at first glance, and providers often reap benefits without
being aware of the user innovation for which they are providing a comple-
ment. Hospital emergency rooms, for example, certainly gain considerable
business from providing medical care to the users and user-developers of
physically demanding sports, but may not be aware of this.
Discussion
All the examples above explore how manufacturers can integrate them-
selves into a user-centered innovation system. However, manufacturers will
not always find user innovations based on or related to their products to be
in their interest. For example, manufacturers may be concerned about legal
liabilities and costs sometimes associated with “unauthorized user tinker-
ing.” For example, an automaker might legitimately worry about the user-
programmed engine controller chips that racing aficionados and others
often install to change their cars’ performance. The result can be findings of
eventual commercial value as users explore new performance regimes that
manufacturers’ engineers might not have considered. However, if users
choose to override manufacturers’ programming to increase engine per-
formance, there is also a clear risk of increased warrantee costs for manu-
facturers if engines fail as a consequence (Mollick 2004).
We have seen that manufacturers can often find ways to profit from user
innovation. It is also the case, however, that user innovators and user inno-
vation communities can provide many of these same functions for them-
selves. For example, StataCorp is successfully selling a proprietary statistical
software package. User-developed alternatives exist on the web that are
developed and maintained by user-innovators and can be downloaded at
no charge. Which ownership model will prove more robust under what cir-
cumstances remains to be seen. Ultimately, since users are the customers,
they get to choose.
Democratizing Innovation 131

10 Application: Searching for Lead User Innovations
Users and manufacturers can apply the insights developed in this book to
improve their innovation processes. In this chapter, I illustrate by showing
how firms can profit by systematically searching for innovations developed
by lead users. I first explain how this can be done. I then present findings
of a study conducted at 3M to assess the effectiveness of lead user idea-
generation techniques. Finally, I briefly review other studies reporting sys-
tematic searches for lead users by manufacturers, and the results obtained.
Searching for Lead Users
Product-development processes traditionally used by manufacturers start
with market researchers who study customers in their target markets to
learn about unsatisfied needs. Next, the need information they uncover is
transferred to in-house product developers who are charged with develop-
ing a responsive product. In other words, the approach is to find a user need
and to fill it by means of in-house product development.
These traditional processes cannot easily be adapted to systematic search-
ing for lead user innovations. The focus on target-market customers means
that lead users are regarded as outliers of no interest. Also, traditional
market-research analyses focus on collecting and analyzing need informa-
tion and not on possible solutions that users may have developed. For
example, if a user says “I have developed this new product to make task X
more convenient,” market-research analyses typically will note that more
convenience is wanted but not record the user-developed solution. After all,
product development is the province of in-house engineers!
We are therefore left with a question: How can manufacturers build a
product-development process that systematically searches for and evaluates
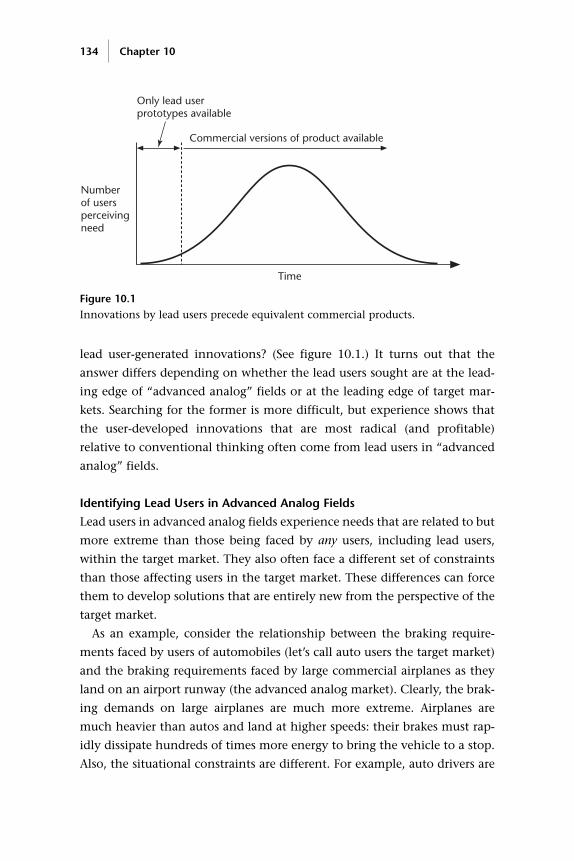
lead user-generated innovations? (See figure 10.1.) It turns out that the
answer differs depending on whether the lead users sought are at the lead-
ing edge of “advanced analog” fields or at the leading edge of target mar-
kets. Searching for the former is more difficult, but experience shows that
the user-developed innovations that are most radical (and profitable)
relative to conventional thinking often come from lead users in “advanced
analog” fields.
Identifying Lead Users in Advanced Analog Fields
Lead users in advanced analog fields experience needs that are related to but
more extreme than those being faced by any users, including lead users,
within the target market. They also often face a different set of constraints
than those affecting users in the target market. These differences can force
them to develop solutions that are entirely new from the perspective of the
target market.
As an example, consider the relationship between the braking require-
ments faced by users of automobiles (let’s call auto users the target market)
and the braking requirements faced by large commercial airplanes as they
land on an airport runway (the advanced analog market). Clearly, the brak-
ing demands on large airplanes are much more extreme. Airplanes are
much heavier than autos and land at higher speeds: their brakes must rap-
idly dissipate hundreds of times more energy to bring the vehicle to a stop.
Also, the situational constraints are different. For example, auto drivers are
134 Chapter 10
Only lead userprototypes available
Time
Commercial versions of product available
Numberof usersperceivingneed
Figure 10.1 Innovations by lead users precede equivalent commercial products.
often assisted in braking in winter by the application of salt or sand to icy
roads. These aids cannot be applied in the case of aircraft: salt would dam-
age aircraft bodies, and sand would be inhaled into jet engines and damage
them.
The result of the more extreme demands and additional constraints
placed on solutions to aircraft braking was the development of antilock
braking systems (ABS) for aircraft. Auto firms conducting searches for valu-
able lead user innovations regarding auto braking were able to learn about
this out-of-field innovation and adapt if for use in autos—where it is com-
mon today. Before the development of ABS for autos, an automobile firm
could have learned about the underlying concept by studying the practices
of users with a strong need for controlling skidding while braking such as
stock car auto racing teams. These lead users had learned to manually
“pump” their brakes to help control this problem. However, auto company
engineers were able to learn much more by studying the automated solu-
tions developed in the “advanced analog” field of aerospace.1
Finding lead users in advanced analog markets can be difficult because
discovering the relevance of a particular analog can itself be a creative act.
One approach that has proven effective is to ask the more easily identified
lead users in target markets for nominations. These lead users tend to know
about useful advanced analogs, because they have been struggling with
their leading-edge problems for a long time, and often have searched
beyond the target market for information.
Networking from innovators to more advanced innovators in this way is
called pyramiding (von Hippel, Thomke, and Sonnack 1999). Pyramiding is
a modified version of the “snowballing” technique sometimes used by soci-
ologists to identify members of a group or accumulate samples of rare
respondents (Bijker 1995). Snowballing relies on the fact that people with
rare interests or attributes tend to know others like themselves. Pyramiding
modifies this idea by assuming that people with a strong interest in a topic
or field can direct an enquiring researcher to people more expert than them-
selves. Experiments have shown that pyramiding can identify high-quality
informants much more efficiently than can mass-screening techniques
under many conditions (von Hippel, Franke, and Prugl 2005). Pyramiding
was made into a practical industrial process by Mary Sonnack, a Division
Scientist at 3M, and Joan Churchill, a psychologist specializing in the devel-
opment of industrial training programs.
Searching for Lead User Innovations 135
Identifying Lead Users in Target Markets
In general it is easier to identify users at the leading edge of target markets
than it is to identify users in advanced analog fields. Screening for users
with lead user characteristics can be used. When the desired type of lead
user is so rare as to make screening impractical—often the case—pyramid-
ing can be applied. In addition, manufacturers can take advantage of the
fact that users at the leading edge of a target market often congregate at spe-
cialized sites or events that manufacturers can readily identify. At such sites,
users may freely reveal what they have done and may learn from others
about how to improve their own practices still further. Manufacturers inter-
ested in learning from these lead users can easily visit the sites and listen in.
For example, sports equipment companies can go to sporting meets where
lead users are known to compete, observe user innovations in action, and
compare notes.
Essentially the same thing can be done at virtual sites. For example, recall
the practices of StataCorp, a supplier of statistical software. Stata sells a set
of standard statistical tests and also a language and tools that statisticians
can use to design new tests to serve their own evolving needs. Some Stata
users (statisticians) took the initiative to set up a few specialized websites,
unaffiliated with StataCorp, where they post their innovations for others to
download, use, comment on, and improve. StataCorp personnel visit these
sites, learn about the user innovations, and observe which tests seem to be
of interest to many users. They then develop proprietary versions of the
more generally useful tests as commercial products.
When specialized rendezvous sites for lead users don’t exist in a particu-
lar field, manufacturers may be able to create them. Technicon Corporation,
for example, set up a series of seminars at which innovating users of their
medical equipment got together and exchanged information on their inno-
vations. Technicon engineers were free to listen in, and the innovations
developed by these users were the sources of most of Technicon’s important
new product improvements (von Hippel and Finkelstein 1979).
The 3M Experiment
To test whether lead users in advanced analog fields can in fact generate
information that leads to commercially valuable new products, Lilien,
Morrison, Searls, Sonnack, and von Hippel (2002) studied a natural experi-
136 Chapter 10
ment at 3M. That firm was carrying out both lead user projects and tradi-
tional market research-based idea-generation projects in the same divisions
at the same time, and in sufficient numbers to make statistical comparisons
of outcomes possible.
Methods
3M first began using the lead user method in one division in 1996. By May
2000, when data collection began, five divisions of 3M had completed
seven lead user (LU) idea-generation projects and had funded further devel-
opment of the product concepts generated by five of these. These same five
divisions also had 42 contemporaneously funded projects that used “find a
need and fill it” idea-generation methodologies that were traditional prac-
tice at 3M. We used these two samples of funded ideas to compare the
performance of lead user idea-generation projects with traditional idea-
generation projects. Although 3M cooperated in the study and permitted
access to company records and to members of the product-development
teams, the firm did not offer a controlled experimental setting. Rather, we
as researchers were required to account for any naturally occurring differ-
ences after the fact.
Our study methodology required a pre-post/test-control situation, with at
least quasi-random assignments to treatment cells (Cook and Campbell
1979). In other words, our goal was to compare samples of development
projects in 3M divisions that differed with respect to their use of lead user
idea-generation methods, but that were as similar as possible in other
respects. Identifying, understanding, and controlling for the many poten-
tial sources of difference that could affect the natural experiment involved
careful field explorations. Thus, possible differences between project
staffing and performance incentives applied to LU and non-LU idea-gener-
ation projects were assessed. We looked for (and did not find) differences in
the capabilities or motivation of LU and non-LU project team members
with respect to achieving a major new product advance. 3M managers also
said that there was no difference in these matters, and a content analysis of
formal annual performance goals set for the individual LU and non-LU
team members in a division that allowed access to these data supported
their views.
We also found no major differences in the innovation opportunities
teams faced. They also looked for Hawthorne or placebo effects that might
Searching for Lead User Innovations 137
affect the project teams differentially, and found none. (The Hawthorne
effect can be described as “I do better because extra attention is being paid
to me or to my performance.” The placebo effect can be described as “I
expect this process will work and will strive to get the results I have been
told are likely.”) We concluded that the 3M samples of funded LU and
non-LU idea-generation projects, though not satisfying the random
assignment criterion for experimental design, appeared to satisfy rough
equivalence criteria in test and control conditions associated with natural
or quasi-experimentation. Data were collected by interviews and by survey
instruments.
With respect to the intended difference under study—the use of lead user
methods within projects—all lead user teams employed an identical lead
user process taught to them with identical coaching materials and with
coaching provided by members of the same small set of internal 3M
coaches. Each lead user team consisted of three or four members of the
marketing and technical departments of the 3M division conducting the
project. Teams began by identifying important market trends. Then, they
engaged in pyramiding to identify lead users with respect to each trend
both within the target market and in advanced analog markets.
Information from a number of innovating lead users was then combined by
the team to create a new product concept and business plan—an “LU idea”
(von Hippel, Thomke, and Sonnack 1999).
Non-lead-user idea-generation projects were conducted in accordance
with traditional 3M practices. I refer to these as non-LU idea generation
methods and to teams using them as non-LU teams. Non-LU teams were
similar to lead user teams in terms of size and make-up. They used data
sources for idea generation that varied from project to project. Market
data collected by outside organizations were sometimes used, as were data
from focus groups with major customers and from customer panels, and
information from lab personnel. Non-LU teams collected market informa-
tion from target markets users but not from lead users.
Findings
Our research compared all funded product concepts generated by LU and
non-LU methods from February 1999 to May 2000 in each of the five 3M
divisions that had funded one or more lead-user-developed product con-
cepts. During that time, five ideas generated by lead user projects were
138 Chapter 10
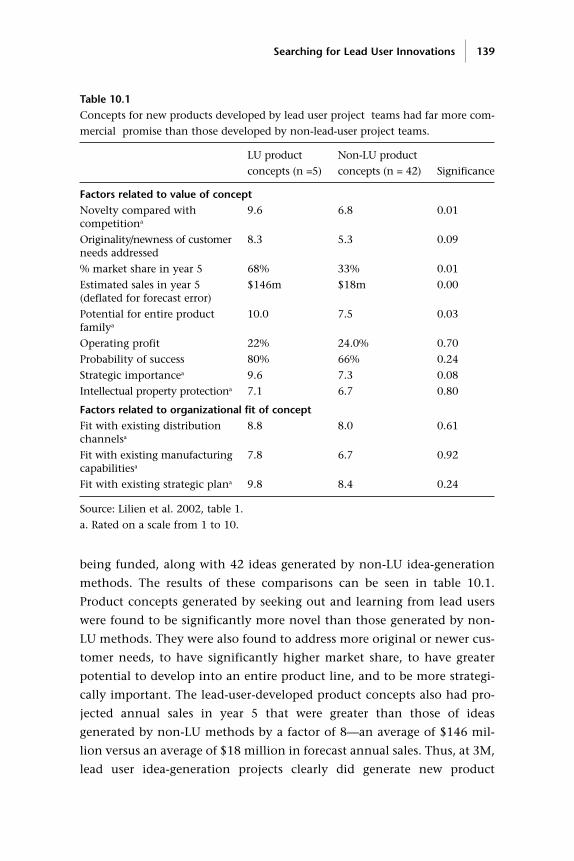
being funded, along with 42 ideas generated by non-LU idea-generation
methods. The results of these comparisons can be seen in table 10.1.
Product concepts generated by seeking out and learning from lead users
were found to be significantly more novel than those generated by non-
LU methods. They were also found to address more original or newer cus-
tomer needs, to have significantly higher market share, to have greater
potential to develop into an entire product line, and to be more strategi-
cally important. The lead-user-developed product concepts also had pro-
jected annual sales in year 5 that were greater than those of ideas
generated by non-LU methods by a factor of 8—an average of $146 mil-
lion versus an average of $18 million in forecast annual sales. Thus, at 3M,
lead user idea-generation projects clearly did generate new product
Searching for Lead User Innovations 139
Table 10.1Concepts for new products developed by lead user project teams had far more com-
mercial promise than those developed by non-lead-user project teams.
LU product Non-LU product
concepts (n =5) concepts (n = 42) Significance
Factors related to value of conceptNovelty compared with 9.6 6.8 0.01competitiona
Originality/newness of customer 8.3 5.3 0.09needs addressed
% market share in year 5 68% 33% 0.01
Estimated sales in year 5 $146m $18m 0.00(deflated for forecast error)
Potential for entire product 10.0 7.5 0.03familya
Operating profit 22% 24.0% 0.70
Probability of success 80% 66% 0.24
Strategic importancea 9.6 7.3 0.08
Intellectual property protectiona 7.1 6.7 0.80
Factors related to organizational fit of conceptFit with existing distribution 8.8 8.0 0.61channelsa
Fit with existing manufacturing 7.8 6.7 0.92capabilitiesa
Fit with existing strategic plana 9.8 8.4 0.24
Source: Lilien et al. 2002, table 1.
a. Rated on a scale from 1 to 10.
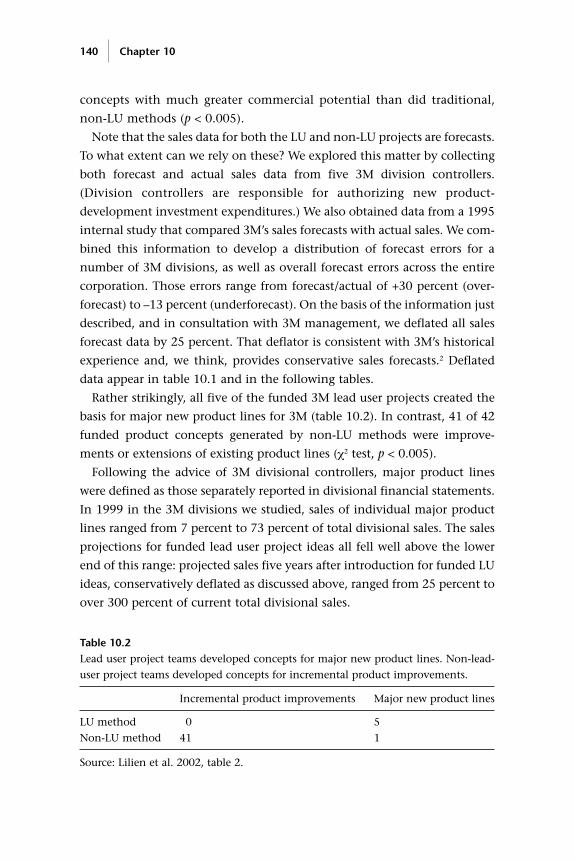
concepts with much greater commercial potential than did traditional,
non-LU methods (p < 0.005).
Note that the sales data for both the LU and non-LU projects are forecasts.
To what extent can we rely on these? We explored this matter by collecting
both forecast and actual sales data from five 3M division controllers.
(Division controllers are responsible for authorizing new product-
development investment expenditures.) We also obtained data from a 1995
internal study that compared 3M’s sales forecasts with actual sales. We com-
bined this information to develop a distribution of forecast errors for a
number of 3M divisions, as well as overall forecast errors across the entire
corporation. Those errors range from forecast/actual of +30 percent (over-
forecast) to –13 percent (underforecast). On the basis of the information just
described, and in consultation with 3M management, we deflated all sales
forecast data by 25 percent. That deflator is consistent with 3M’s historical
experience and, we think, provides conservative sales forecasts.2 Deflated
data appear in table 10.1 and in the following tables.
Rather strikingly, all five of the funded 3M lead user projects created the
basis for major new product lines for 3M (table 10.2). In contrast, 41 of 42
funded product concepts generated by non-LU methods were improve-
ments or extensions of existing product lines (χ2 test, p < 0.005).
Following the advice of 3M divisional controllers, major product lines
were defined as those separately reported in divisional financial statements.
In 1999 in the 3M divisions we studied, sales of individual major product
lines ranged from 7 percent to 73 percent of total divisional sales. The sales
projections for funded lead user project ideas all fell well above the lower
end of this range: projected sales five years after introduction for funded LU
ideas, conservatively deflated as discussed above, ranged from 25 percent to
over 300 percent of current total divisional sales.
140 Chapter 10
Table 10.2Lead user project teams developed concepts for major new product lines. Non-lead-
user project teams developed concepts for incremental product improvements.
Incremental product improvements Major new product lines
LU method 0 5
Non-LU method 41 1
Source: Lilien et al. 2002, table 2.
To illustrate what the major product line innovations that the LU process
teams generated at 3M were like, I briefly describe four (one is not described
for 3M proprietary reasons):
• A new approach to the prevention of infections associated with surgical
operations. The new approach replaced the traditional “one size fits all”
approach to infection prevention with a portfolio of patient-specific meas-
ures based on each patient’s individual biological susceptibilities. This inno-
vation involved new product lines plus related business and strategy
innovations made by the team to bring this new approach to market suc-
cessfully and profitably.
• Electronic test and communication equipment for telephone field repair
workers that pioneered the inclusion of audio, video, and remote data
access capabilities. These capabilities enabled physically isolated workers to
carry out their problem-solving work as a virtual team with co-workers for
the first time.
• A new approach, implemented via novel equipment, to the application of
commercial graphics films that cut the time of application from 48 hours to
less than 1 hour. (Commercial graphics films are used, for example, to cover
entire truck trailers, buses, and other vehicles with advertising or decorative
graphics.) The LU team’s solutions involved technical innovations plus
related channel and business model changes to help diffuse the innovation
rapidly.
• A new approach to protecting fragile items in shipping cartons that
replaces packaging materials such as foamed plastic. The new product lines
implementing the approach were more environmentally friendly and much
faster and more convenient for both shippers and package recipients than
other products and methods on the market.
Lilien, Morrison, Searls, Sonnack, and I also explored to see whether the
major product lines generated by the lead user projects had characteristics
similar to those of the major product lines that had been developed at 3M
in the past, including Scotch Tape. To determine this we collected data on
all major new product lines introduced to the market between 1950 and
2000 by the five 3M divisions that had executed one or more lead user stud-
ies. (The year 1950 was as far back as we could go and still find company
employees who could provide some data about the innovation histories of
Searching for Lead User Innovations 141
these major products lines.) Examples from our 1950–2000 sample include
the following:
• Scotch Tape: A line of transparent mending tapes that was first of its type
and a major success in many household and commercial applications.
• Disposable patient drapes for operating room use: A pioneering line of
disposable products for the medical field now sold in many variations.
• Box sealing tapes: The first type of tape strong enough to reliably seal cor-
rugated shipping boxes, it replaced stapling in most “corrugated shipper”
applications.
• Commercial graphics films: Plastic films capable of withstanding outdoor
environments that could be printed upon and adhered to large surfaces on
vehicles such as the sides of trailer trucks. This product line changed the
entire approach to outdoor signage.
Table 10.3 provides profiles of the five LU major product lines and the 16
non-LU major product lines for which we were able to collect data. As can
be seen, innovations generated with inputs from lead users are similar in
many ways to the major innovations developed by 3M in the past.
Discussion
The performance comparison between lead user and “find a need and fill it”
idea-generation projects at 3M showed remarkably strong advantages asso-
ciated with searching for ideas among lead users in advanced analog fields
with needs similar to, but even more extreme than, needs encountered in
the intended target market. The direction of this outcome is supported by
findings from three other real-world industrial applications of lead user
idea-generation methods that studied lead users in the target market but
not in advanced analog markets. I briefly describe these three studies next.
They each appear to have generated primarily next-generation products—
valuable for firms, but not the basis for radically new major product lines.
• Recall that Urban and von Hippel (1988) tested the relative commercial
attractiveness of product concepts developed in the field of computer-aided
systems for the design of printed circuit boards (PC-CAD). One of the con-
cepts they tested contained novel features proposed by lead users that had
innovated in the PC-CAD field in order to serve in-house need. The attrac-
tiveness of the “lead user concept” was then evaluated by a sample of 173
142 Chapter 10
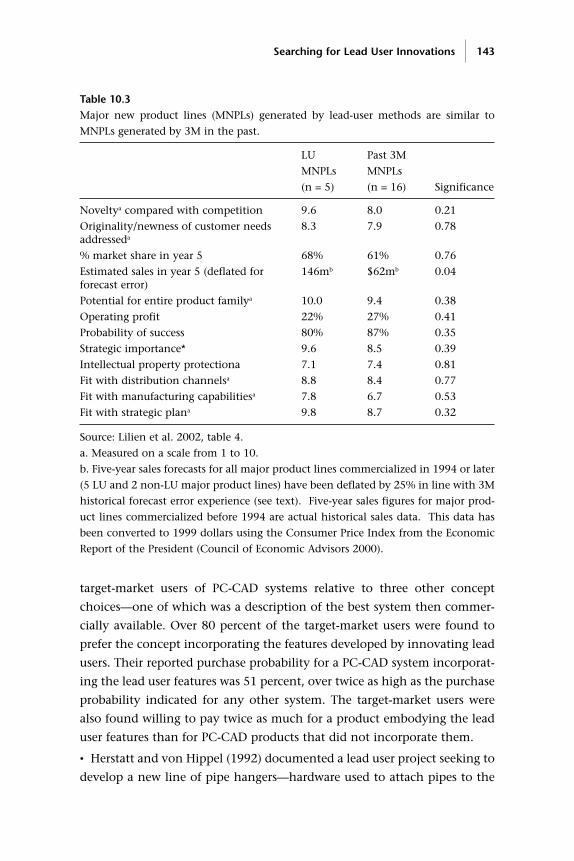
target-market users of PC-CAD systems relative to three other concept
choices—one of which was a description of the best system then commer-
cially available. Over 80 percent of the target-market users were found to
prefer the concept incorporating the features developed by innovating lead
users. Their reported purchase probability for a PC-CAD system incorporat-
ing the lead user features was 51 percent, over twice as high as the purchase
probability indicated for any other system. The target-market users were
also found willing to pay twice as much for a product embodying the lead
user features than for PC-CAD products that did not incorporate them.
• Herstatt and von Hippel (1992) documented a lead user project seeking to
develop a new line of pipe hangers—hardware used to attach pipes to the
Searching for Lead User Innovations 143
Table 10.3Major new product lines (MNPLs) generated by lead-user methods are similar to
MNPLs generated by 3M in the past.
LU Past 3M
MNPLs MNPLs
(n = 5) (n = 16) Significance
Noveltya compared with competition 9.6 8.0 0.21
Originality/newness of customer needs 8.3 7.9 0.78addresseda
% market share in year 5 68% 61% 0.76
Estimated sales in year 5 (deflated for 146mb $62mb 0.04forecast error)
Potential for entire product familya 10.0 9.4 0.38
Operating profit 22% 27% 0.41
Probability of success 80% 87% 0.35
Strategic importance* 9.6 8.5 0.39
Intellectual property protectiona 7.1 7.4 0.81
Fit with distribution channelsa 8.8 8.4 0.77
Fit with manufacturing capabilitiesa 7.8 6.7 0.53
Fit with strategic plana 9.8 8.7 0.32
Source: Lilien et al. 2002, table 4.
a. Measured on a scale from 1 to 10.
b. Five-year sales forecasts for all major product lines commercialized in 1994 or later
(5 LU and 2 non-LU major product lines) have been deflated by 25% in line with 3M
historical forecast error experience (see text). Five-year sales figures for major prod-
uct lines commercialized before 1994 are actual historical sales data. This data has
been converted to 1999 dollars using the Consumer Price Index from the Economic
Report of the President (Council of Economic Advisors 2000).
ceilings of commercial buildings. Hilti, a major manufacturer of construc-
tion-related equipment and products, conducted the project. The firm
introduced a new line of pipe hanger products based on the lead user con-
cept and a post-study evaluation has shown that this line has become a
major commercial success for Hilti.
• Olson and Bakke (2001) report on two lead user studies carried out by
Cinet, a leading IT systems integrator in Norway, for the firm’s two major
product areas, desktop personal computers, and Symfoni application
GroupWare. These projects were very successful, with most of the ideas
incorporated into next-generation products having been collected from
lead users.
Active search for lead users that have innovated enables manufacturers to
more rapidly commercialize lead user innovations. One might think that an
alternative approach would be to identify lead users before they have inno-
vated. Alert manufacturers could then make some prior arrangements to get
preferred access to promising user-developed innovations by, for example,
purchasing promising lead user organizations. I myself think that such ver-
tical integration approaches are not practical. As was shown earlier, the
character and attractiveness of innovations lead users may develop is based
in part on the particular situations faced by and information stocks held by
individual lead users. User innovation is therefore likely to be a widely dis-
tributed phenomenon, and it would be difficult to predict in advance
which users are most likely to develop very valuable innovations.
How do we square these findings with the arguments, put forth by
Christensen (1997), by Slater and Narver (1998), and by others, that firms
are likely to miss radical or disruptive innovations if they pay close atten-
tion to requests from their customers? Christensen (1997, p. 59, n. 21)
writes: “The research of Eric von Hippel, frequently cited as evidence of the
value of listening to customers, indicates that customers originate a large
majority of new product ideas. . . . The [Christensen] value network frame-
work would predict that the innovations toward which the customers in
von Hippel’s study led their suppliers would have been sustaining innova-
tions. We would expect disruptive innovations to have come from other
sources.”
Unfortunately, the above contains a basic misunderstanding of my
research findings. My findings, and related findings by others as well, deal
with innovations by lead users, not customers, and lead users are a much
144 Chapter 10
broader category than customers of a specific firm. Lead users that generate
innovations of interest to manufacturers can reside, as we have seen, at
the leading edges of target markets, and also in advanced analog markets.
The innovations that some lead users develop are certainly disruptive from
the viewpoint of some manufacturers—but the lead users are unlikely to
care about this. After all, they are developing products to serve their own
needs. Tim Berners-Lee, for example, developed the World Wide Web as a
lead user working at CERN—a user of that software. The World Wide Web
was certainly disruptive to the business models of many firms, but this was
not Berners-Lee’s concern. Lead users typically have no reason to lead, mis-
lead, or even contact manufacturers that might eventually benefit from or
be disrupted by their innovations. Indeed, the likely absence of a preexist-
ing customer relationship is the reason that manufacturing firms must
search for lead user innovations outside their customer lists—as 3M did in
its lead user idea generation studies. “Listening to the voice of the cus-
tomer” is not the same thing as seeking out and learning from lead users
(Danneels 2004).
That basic misunderstanding aside, I do agree with Christensen and oth-
ers that a manufacturer may well receive mainly requests for sustaining
innovations from its customers. As was discussed in chapter 4, manufactur-
ers have an incentive to develop innovations that utilize their existing
capabilities—that are “sustaining” for them. Customers know this and,
when considering switching to a new technology, are unlikely to request it
from a manufacturer that would consider it to be disruptive: they know
that such a manufacturer is unlikely to respond positively. The net result
is that manufacturers’ inputs from their existing customers may indeed be
biased towards requests for sustaining innovations.
I conclude this chapter by reminding the reader that studies of the
sources of innovation show clearly that users will tend to develop some
types of innovations but not all. It therefore makes sense for manufacturers
to partition their product-development strategies and portfolios accord-
ingly. They may wish, for example, to move away from actual new product
development and search for lead users’ innovations in the case of func-
tionally novel products. At the same time manufacturers may decide to con-
tinue to develop products that do not require high-fidelity models of need
information and use environments to get right. One notable category of
innovations with this characteristic is dimension-of-merit improvements to
Searching for Lead User Innovations 145
existing products. Sometimes users state their needs for improved products
in terms of dimensions on which improvements are desired—dimensions of
merit. As an example, consider that users may say “I want a computer that
is as fast and cheap as possible.” Similarly, users of medical imaging equip-
ment may say “I want an image that is of as high a resolution as is techni-
cally possible.” If manufacturers (or users) cannot get to the end point
desired by these users right away, they will instead progressively introduce
new product generations that move along the dimension of merit as rapidly
and well as they can. Their rate of progress is determined by the rate at
which solution technologies improve over time. This means that sticky solu-
tion information rather than sticky need information is central to develop-
ment of dimension-of-merit improvements. Manufacturers will tend to
have the information they need to develop dimension of merit innovations
internally.
146 Chapter 10
11 Application: Toolkits for User Innovation and Custom Design
An improved understanding of the relative innovation capabilities of users
and manufacturers can enable designs for more effective joint innovation
processes. Toolkits for user innovation and custom design illustrate this pos-
sibility. In this new innovation process design, manufacturers actually aban-
don their efforts to understand users’ needs accurately and in detail. Instead,
they outsource only need-related innovation tasks to their users, who are
equipped with appropriate toolkits. This process change differs from the
lead user search processes discussed earlier in an interesting way. Lead user
searchs identify existing innovations, but do nothing to change the condi-
tions affecting user-innovators at the time a new product or service is being
developed. Toolkits for users, in contrast, do change the conditions poten-
tial innovators face. By making innovation cheaper and quicker for users,
they can increase the volume of user innovation. They also can channel
innovative effort into directions supported by toolkits.
In this chapter, I first explore why toolkits are useful. Next, I describe how
to create an appropriate setting for toolkits and how toolkits function in
detail. Finally, I discuss the conditions under which toolkits are likely to be
of most value.
Benefits from Toolkits
Toolkits for user innovation and design are integrated sets of product-
design, prototyping, and design-testing tools intended for use by end users.
The goal of a toolkit is to enable non-specialist users to design high-quality,
producible custom products that exactly meet their needs. Toolkits often
contain “user-friendly” features that guide users as they work. They are spe-
cific to a type of product or service and a specific production system. For
example, a toolkit provided to customers interested in designing their own,
custom digital semiconductor chips is tailored precisely for that purpose—
it cannot be used to design other types of products. Users apply a toolkit in
conjunction with their rich understanding of their own needs to create a
preliminary design, simulate or prototype it, evaluate its functioning in
their own use environment, and then iteratively improve it until they are
satisfied.
A variety of manufacturers have found it profitable to shift the tasks of cus-
tom product design to their customers along with appropriate toolkits for
innovation. Results to date in the custom semiconductor field show devel-
opment time cut by 2/3 or more for products of equivalent complexity and
development costs cut significantly as well via the use of toolkits. In 2000,
more than $15 billion worth of custom integrated circuits were sold that had
been designed with the aid of toolkits—often by circuit users—and produced
in the “silicon foundries” of custom semiconductor manufacturers such as
LSI (Thomke and von Hippel 2002). International Flavors and Fragrances
(IFF), a global supplier of specialty flavors to the food industry, has built a
toolkit that enables its customers to modify flavors for themselves, which IFF
then manufactures. In the materials field, GE provides customers with Web-
based tools for designing better plastic products. In software, a number of
consumer product companies provide toolkits that allow people to add cus-
tom-designed modules to their standard products. For example, Westwood
Studios provides its customers with toolkits that enable them to design
important elements of their own video games (Jeppesen 2005).
The primary function of toolkits for user design is to co-locate product-
development and service-development tasks with the sticky information
needed to execute them. Need-intensive tasks involved in developing a par-
ticular type of product or service are assigned to users, along with the tools
needed to carry those tasks out. At the same time, solution-intensive tasks
are assigned to manufacturers.
As was discussed in chapter 5, problem solving in general, and product
and service development in particular, is carried out via repeated cycles of
learning by trial and error. When each cycle of a trial-and-error process
requires access to sticky information located at more than one site, co-
location of problem-solving activity with sticky information is achieved by
repeatedly shifting problem solving to the relevant sticky information sites
as product development proceeds.
148 Chapter 11
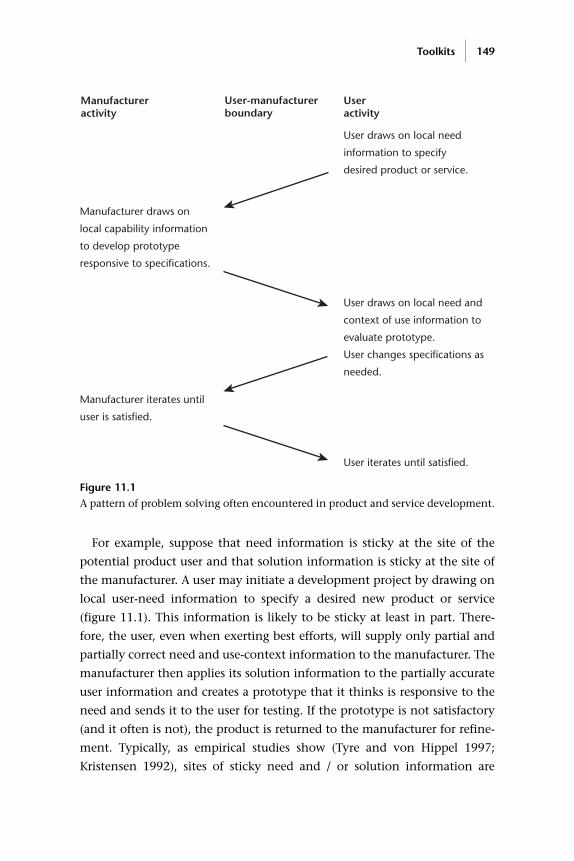
For example, suppose that need information is sticky at the site of the
potential product user and that solution information is sticky at the site of
the manufacturer. A user may initiate a development project by drawing on
local user-need information to specify a desired new product or service
(figure 11.1). This information is likely to be sticky at least in part. There-
fore, the user, even when exerting best efforts, will supply only partial and
partially correct need and use-context information to the manufacturer. The
manufacturer then applies its solution information to the partially accurate
user information and creates a prototype that it thinks is responsive to the
need and sends it to the user for testing. If the prototype is not satisfactory
(and it often is not), the product is returned to the manufacturer for refine-
ment. Typically, as empirical studies show (Tyre and von Hippel 1997;
Kristensen 1992), sites of sticky need and / or solution information are
Toolkits 149
Manufacturer activity
User activity
User iterates until satisfied.
User draws on local need
information to specify
desired product or service.
User draws on local need and
context of use information to
evaluate prototype.
User changes specifications as
needed.
Manufacturer draws on
local capability information
to develop prototype
responsive to specifications.
Manufacturer iterates until
user is satisfied.
User-manufacturer boundary
Figure 11.1 A pattern of problem solving often encountered in product and service development.
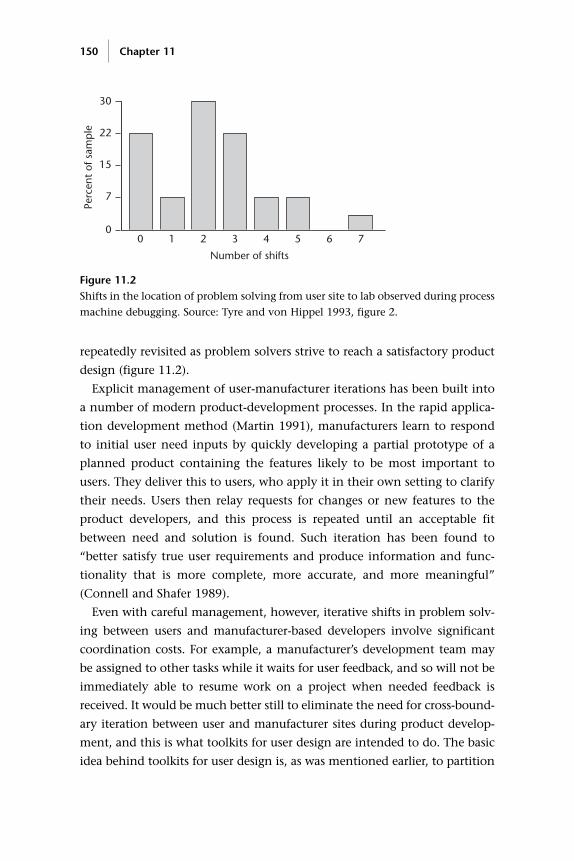
repeatedly revisited as problem solvers strive to reach a satisfactory product
design (figure 11.2).
Explicit management of user-manufacturer iterations has been built into
a number of modern product-development processes. In the rapid applica-
tion development method (Martin 1991), manufacturers learn to respond
to initial user need inputs by quickly developing a partial prototype of a
planned product containing the features likely to be most important to
users. They deliver this to users, who apply it in their own setting to clarify
their needs. Users then relay requests for changes or new features to the
product developers, and this process is repeated until an acceptable fit
between need and solution is found. Such iteration has been found to
“better satisfy true user requirements and produce information and func-
tionality that is more complete, more accurate, and more meaningful”
(Connell and Shafer 1989).
Even with careful management, however, iterative shifts in problem solv-
ing between users and manufacturer-based developers involve significant
coordination costs. For example, a manufacturer’s development team may
be assigned to other tasks while it waits for user feedback, and so will not be
immediately able to resume work on a project when needed feedback is
received. It would be much better still to eliminate the need for cross-bound-
ary iteration between user and manufacturer sites during product develop-
ment, and this is what toolkits for user design are intended to do. The basic
idea behind toolkits for user design is, as was mentioned earlier, to partition
150 Chapter 11
0 1 2 3 4 5 6
7
0
22
7
15
30
Number of shifts
Perc
ent
of s
amp
le
Figure 11.2 Shifts in the location of problem solving from user site to lab observed during process
machine debugging. Source: Tyre and von Hippel 1993, figure 2.
an overall product-development task into subproblems, each drawing on
only one locus of sticky information. Then, each task is assigned to the party
already having the sticky information needed to solve it. In this approach,
both the user and the manufacturer still engage in iterative, trial-and-error
problem solving to solve the problems assigned to them. But this iteration is
internal to each party—no costly and time-consuming cross-boundary itera-
tion between user and manufacturer is required (von Hippel 1998, 2001;
Thomke and von Hippel 2002; von Hippel and Katz 2002).
To appreciate the major advantage in problem-solving speed and effi-
ciency that concentrating problem solving within a single locus can create,
consider a familiar example: the contrast between conducting financial
strategy development with and without “user-operated” financial spread-
sheet software:
• Before the development of easy-to-use financial spreadsheet programs
such as Lotus 1-2-3 and Microsoft Excel, a firm’s chief financial officer
might have carried out a financial strategy development exercise as follows.
First, the CFO would have asked an assistant to develop an analysis incor-
porating a list of assumptions. A few hours or days might elapse before the
result was delivered. Then the CFO would use her rich understanding of the
firm and its goals to study the analysis. She would typically almost imme-
diately spot some implications of the patterns developed, and would then
ask for additional analyses to explore these implications. The assistant
would take the new instructions and go back to work while the CFO
switched to another task. When the assistant returned, the cycle would
repeat until a satisfactory outcome was found.
• After the development of financial spreadsheet programs, a CFO might
begin an analysis by asking an assistant to load up a spreadsheet with corpo-
rate data. The CFO would then “play with” the data, trying out various ideas
and possibilities and “what if” scenarios. The cycle time between trials would
be reduced from days or hours to minutes. The CFO’s full, rich information
would be applied immediately to the effects of each trial. Unexpected pat-
terns—suggestive to the CFO but often meaningless to a less knowledgeable
assistant—would be immediately identified and explored further.
It is generally acknowledged that spreadsheet software that enables expert
users to “do it themselves” has led to better outcomes that are achieved
faster (Levy 1984; Schrage 2000). The advantages are similar in the case of
Toolkits 151
product and service development. Learning by doing via trial and error still
occurs, of course, but the cycle time is much faster because the complete
cycle of need-related learning is carried out at a single (user) site earlier in
the development process.
Repartitioning of Development Tasks
To create the setting for a toolkit, one must partition the tasks of product
development to concentrate need-related information in some and solu-
tion-related information in others. This can involve fundamental changes
to the underlying architecture of a product or service. As illustration, I first
discuss the repartioning of the tasks involved in custom semiconductor
chip development. Then, I show how the same principles can be applied in
the less technical context of custom food design.
Traditionally, fully customized integrated circuits were developed in an
iterative process like that illustrated in figure 11.1. The process began with a
user specifying the functions that the custom chip was to perform to a man-
ufacturer of integrated circuits. The chip would then be designed by manu-
facturer employees, and an (expensive) prototype would be produced and
sent to the user. Testing by the user would typically reveal faults in the chip
and/or in the initial specification, responsive changes would be made, a
new prototype would be built. This cycle would continue until the user was
satisfied. In this traditional manufacturer-centered development process,
manufacturers’ development engineers typically incorporated need-related
information into the design of both the fundamental elements of a circuit—
such as transistors, and the electrical “wiring” that interconnected those
elements into a functioning circuit.
The brilliant insight that allowed custom design of integrated circuits to
be partitioned into solution-related and need-related subtasks was made by
Mead and Conway (1980). They determined that the design of a digital
chip’s fundamental elements, such as its transistors, could be made standard
for all circuits. This subtask required rich access to the manufacturer’s sticky
solution information regarding how semiconductors are fabricated, but did
not require detailed information on users’ specific needs. It could therefore
be assigned to manufacturer-based chip-design and chip-fabrication engi-
neers. It was also observed that the subtask of interconnecting standard
circuit elements into a functioning integrated circuit required only sticky,
152 Chapter 11
need-related information about a chip’s function—for example, whether it
was to function as a microprocessor for a calculator or as a voice chip for a
robotic dog. This subtask was therefore assigned to users along with a toolkit
that enabled them to do it properly. In sum, this new type of chip, called a
gate array, had a novel architecture created specifically to separate the
problem-solving tasks requiring access to a manufacturer’s sticky solution
information from those requiring access to users’ sticky need information.
The same basic principle can be illustrated in a less technical context:
food design. In this field, manufacturer-based designers have traditionally
undertaken the entire job of developing a novel food, and so they have
freely blended need-specific design into any or all of the recipe-design ele-
ments wherever convenient. For example, manufacturer-based developers
might find it convenient to create a novel cake by both designing a novel
flavor and texture for the cake body, and designing a complementary
novel flavor and texture into the frosting. However, it is possible to reparti-
tion these same tasks so that only a few draw on need-related information,
and these can then be more easily transferred to users.
The architecture of the pizza pie illustrates how this can be done. Many
aspects of the design of a pizza, such as the dough and the sauce, have been
made standard. User choice has been restricted to a single task: the design
of toppings. In other words, all need-related information that is unique to
a particular user has been linked to the toppings-design task only. Transfer
of this single design task to users can still potentially offer creative individ-
uals a very large design space to play in (although pizza shops typically
restrict it sharply). Any edible ingredient one can think of, from eye of newt
to edible flowers, is a potential topping component. But the fact that need-
related information has been concentrated within only a single product-
design task makes it much easier to transfer design freedom to the user.
The Functionality of Toolkits
If a manufacturer outsources need-intensive design tasks to users, it must
also make sure that users have the information they need to carry out those
tasks effectively. This can be done via a toolkit for user innovation. Toolkits
are not new as a general concept—every manufacturer equips its own engi-
neers with a set of tools suitable for developing the type of products or serv-
ices it wishes to produce. Toolkits for users also are not new—many users
Toolkits 153
have personal collections of tools that they have assembled to help them
create new items or modify standard ones. For example, some users have
woodworking tools ranging from saws to glue which can be used to create
or modify furniture—in very novel or very standard ways. Others may have
a kit of software tools needed to create or modify software. What is new,
however, is integrated toolkits enabling users to create and test designs for
custom products or services that can then be produced “as is” by manufac-
turers.
Present practice dictates that a high-quality toolkit for user innovation
will have five important attributes. (1) It will enable users to carry out com-
plete cycles of trial-and-error learning. (2) It will offer users a solution space
that encompasses the designs they want to create. (3) It will be user friendly
in the sense of being operable with little specialized training. (4) It will con-
tain libraries of commonly used modules that users can incorporate into
custom designs. (5) It will ensure that custom products and services
designed by users will be producible on a manufacturer’s’ production equip-
ment without modification by the manufacturer.
Learning through Trial and Error
It is crucial that user toolkits for innovation enable users to go through
complete trial-and-error cycles as they create their designs. Recall that trial-
and-error problem solving is essential to product development. For exam-
ple, suppose that a user is designing a new custom telephone answering
system for her firm, using a software-based computer-telephony integration
(CTI) design toolkit provided by a vendor. Suppose also that the user
decides to include a new rule to “route all calls of X nature to Joe” in her
design. A properly designed toolkit would allow her to temporarily place
the new rule into the telephone system software, so that she could actually
try it out (via a real test or a simulation) and see what happened. She might
discover that the solution worked perfectly. Or she might find that the new
rule caused some unexpected form of trouble—for example, Joe might be
flooded with too many calls—in which case it would be “back to the draw-
ing board” for another design and another trial.
In the same way, toolkits for innovation in the semiconductor design
field allow users to design a circuit that they think will meet their needs and
then test the design by “running” it in the form of a computer simulation.
This quickly reveals errors that the user can then quickly and cheaply fix
154 Chapter 11
using toolkit-supplied diagnostic and design tools. For example, a user
might discover by testing a simulated circuit design that a switch needed to
adjust the circuit had been forgotten and make that discovery simply by try-
ing to make a needed adjustment. The user could then quickly and cheaply
design in the needed switch without major cost or delay.
One can appreciate the importance of giving the user the capability for
trial-and-error learning by doing in a toolkit by thinking about the conse-
quences of not having it. When users are not supplied with toolkits that
enable them to draw on their local, sticky information and engage in trial-
and-error learning, they must actually order a product and have it built to
learn about design errors—typically a very costly and unsatisfactory way to
proceed. For example, automobile manufacturers allow customers to select
a range of options for their cars, but they do not offer the customer a way
to learn during the design process and before buying. The cost to the cus-
tomer is unexpected learning that comes too late: “That wide-tire option
did look great in the picture. But now that the car has been delivered, I
discover that I don’t like the effect on handling. Worse, I find that my car
is too wide to fit into my garage!”
Similar disasters are often encountered by purchasers of custom comput-
ers. Many custom computer manufacturers offer a website that allows users
to “design your own computer online.” However, these websites do not
allow users to engage in trial-and-error design. Instead, they simply allow
users to select computer components such as processor chips and disk
drives from lists of available options. Once these selections have been made,
the design transaction is complete and the computer is built and shipped.
The user has no way to test the functional effects of these choices before
purchase and first field use—followed by celebration or regret.
In contrast, a sophisticated toolkit for user innovation would allow the
user to conduct trial-and-error tests to evaluate the effects of initial choices
made and to improve on them. For example, a computer design site could
add this capability by enabling users to actually test and evaluate the hard-
ware configuration they specify on their own programs and computing
tasks before buying. To do this, the site might, for example, provide access
to a remote computer able to simulate the operation of the computer that
the user has specified, and provide performance diagnostics and related
choices in terms meaningful to the user (e.g., “If you add option x at cost y,
the time it takes to complete your task will decrease by z seconds”). The user
Toolkits 155
could then modify or confirm initial design choices according to trade-off
preferences only he or she knows.
Appropriate Solution Spaces
Economical production of custom products and services is achievable only
when a custom design falls within the pre-existing capability and degrees of
freedom built into a particular manufacturer’s production system. My col-
leagues and I call this the solution space offered by that system. A solution
space may vary from very large to small, and if the output of a toolkit is tied
to a particular production system, then the design freedom that a toolkit
can offer a user will be accordingly large or small. For example, the solution
space offered by the production process of a manufacturer of custom inte-
grated circuits offers a huge solution space to users—it will produce any
combination of logic elements interconnected in any way that a user-
designer might desire, with the result that the user can invent anything
from a novel type of computer processor to a novel silicon organism within
that space. However, note that the semiconductor production process also
has stringent limits. It will only implement product designs expressed in
terms of semiconductor logic—it will not implement designs for bicycles or
houses. Also, even within the arena of semiconductors, it will only be able
to produce semiconductors that fit within a certain range with respect to
size and other properties. Another example of a production system offering
a very large solution space to designers—and, potentially to user-designers
via toolkits—is the automated machining center. Such a device can basically
fashion any shape out of any machinable material that can be created by
any combination of basic machining operations such as drilling and
milling. As a consequence, toolkits for innovation intended to create
designs that can be produced by automated machining centers can offer
users access to that very large solution space.
Large solution spaces can typically be made available to user-designers
when production systems and associated toolkits allow users to manipulate
and combine relatively basic and general-purpose building blocks and oper-
ations, as in the examples above. In contrast, small solution spaces typically
result when users are only allowed to combine a relatively few pre-designed
options. Thus, users who want to design their own custom automobiles are
restricted to a relatively small solution space: they can only make choices
from lists of options regarding such things as engines, transmissions, and
156 Chapter 11
paint colors. Similarly, purchasers of eyeglasses are restricted to combining
“any frame from this list” of pre-designed frames, with “any lens type from
that list” of pre-designed options.
The reason producers of custom products or services enforce constraints
on the solution space that user-designers may use is that custom products
can be produced at reasonable prices only when custom user designs can be
implemented by simply making low-cost adjustments to the production
process. This condition is met within the solution space on offer. However,
responding to requests that fall outside that space will require small or large
additional investments by the manufacturer. For example, a producer of
integrated circuits may have to invest many millions of dollars and rework
an entire production process in order to respond to a customer’s request for
a larger chip that falls outside the solution space associated with its present
production equipment.
User-Friendly Tools
User toolkits for innovation are most effective and successful when they are
made “user friendly” by enabling users to use the skills they already have
and to work in their own customary and well-practiced design language.
This means that users don’t have to learn the—typically different—design
skills and language customarily used by manufacturer-based designers, and
so they will require much less training to use the toolkit effectively.
For example, in the case of custom integrated circuit design, the users of
toolkits are typically electrical engineers who are designing electronic sys-
tems that will incorporate custom semiconductor chips. The digital design
language normally used by electrical engineers is Boolean algebra.
Therefore, user-friendly toolkits for custom semiconductor design are pro-
vided that allow toolkit users to design in this language. That is, users can
create a design, test how it works, and make improvements using only their
own, customary design language. At the conclusion of the design process,
the toolkit then translates the user’s logical design into the design inputs
required by the semiconductor manufacturer’s production system.
A design toolkit based on a language and skills and tools familiar to the
user is only possible to the extent that the user has familiarity with some
appropriate and reasonably complete language and set of skills and tools.
Interestingly, this is the case more frequently than one might initially sup-
pose, at least in terms of the function that a user wants a product or service
Toolkits 157
to perform—because functionality is the face that the product or a service
presents to the user. (Indeed, an expert user of a product or service may be
much more familiar with that functional face than manufacturer-based
experts.) Thus, the user of a custom semiconductor is the expert in what
he or she wants that custom chip to do, and is skilled at making complex
tradeoffs among familiar functional elements to achieve a desired end: “If
I increase chip clock speed, I can reduce the size of my cache memory
and. . . .”
As a less technical example, consider the matter of designing a custom
hairstyle. There is certainly a great deal of information known to hairstylists
that even an expert user may not know, such as how to achieve a certain
look by means of layer cutting, or how to achieve a certain streaked color
pattern by selectively dying some strands of hair. However, an expert user is
often very well practiced at the skill of examining the shape of his or her
face and hairstyle as reflected in a mirror, and visualizing specific improve-
ments that might be desirable in matters such as curls, shape, or color. In
addition, the user will be very familiar with the nature and functioning of
everyday tools used to shape hair, such as scissors and combs.
A user-friendly toolkit for hairstyling innovation can be built upon these
familiar skills and tools. For example, a user can be invited to sit in front of
a computer monitor, and study an image of her face and hairstyle as cap-
tured by a video camera. Then, she can select from a palette of colors and
color patterns offered on the screen, can superimpose the effect on her exist-
ing hairstyle, can examine it, and can repeatedly modify it in a process of
trial-and-error learning. Similarly, the user can select and manipulate images
of familiar tools, such as combs and scissors, to alter the image of the length
and shape of her own hairstyle as projected on the computer screen, can
study and further modify the result achieved, and so forth. Note that the
user’s new design can be as radically new as is desired, because the toolkit
gives the user access to the most basic hairstyling variables and tools such as
hair color and scissors. When the user is satisfied, the completed design can
be translated into technical hairstyling instructions in the language of a
hairstyling specialist—the intended production system in this instance.
In general, steady improvements in computer hardware and software are
enabling toolkit designers to provide information to users in increasingly
friendly ways. In earlier days, information was often provided to users in
the form of specification sheets or books. The user was then required to
158 Chapter 11
know when a particular bit of information was relevant to a development
project, find the book, and look it up. Today, a large range of potentially
needed information can be embedded in a computerized toolkit, which is
programmed to offer the user items of information only if and as a devel-
opment being worked on makes them relevant.
Module Libraries
Custom designs seldom are novel in all their parts. Therefore, a library of
standard modules will be a valuable part of a toolkit for user innovation.
Provision of such standard modules enables users to focus their creative
work on those aspects of their product or service designs that cannot be
implemented via pre-designed options. For example, architects will find it
very useful to have access to a library of standard components, such as a
range of standard structural support columns with pre-analyzed structural
characteristics, that they can incorporate into their novel building designs.
Similarly, users who want to design custom hairstyles will often find it help-
ful to begin by selecting a hairstyle from a toolkit library. The goal is to
select a style that has some elements of the desired look. Users can then pro-
ceed to develop their own desired style by adding to and subtracting from
that starting point.
Translating Users’ Designs for Production
The “language” of a toolkit for user innovation must be convertible with-
out error into the language of the intended production system at the con-
clusion of the user’s design work. If it is not, the entire purpose of the toolkit
will be lost—because a manufacturer receiving a user design will essentially
have to do the design work over again. Error-free translation need not
emerge as a major problem—for example, it was never a major problem dur-
ing the development of toolkits for integrated circuit design, because both
chip designers and chip producers already used a language based on digital
logic. In contrast, in some fields, translating from the design language pre-
ferred by users to the language required by intended production systems
can be the central problem in toolkit design. As an illustration, consider a
recent toolkit test project managed by Ernie Gum, the Director of Food
Product Development for the USA FoodServices Division of Nestlé.
One major business of Nestlé FoodServices is producing custom food
products, such as custom Mexican sauces, for major restaurant chains.
Toolkits 159
Custom foods of this type have traditionally been developed by or modified
by the chains’ executive chefs, using what are in effect design and produc-
tion toolkits taught by culinary schools: recipe development procedures
based on food ingredients available to individuals and restaurants, and
processed with restaurant-style equipment. After using their traditional
toolkits to develop or modify a recipe for a new menu item, executive chefs
call in Nestlé Foodservices or another custom food producer and ask that
firm to manufacture the product they have designed—and this is where the
language translation problem rears its head.
There is no error-free way to translate a recipe expressed in the language
of a traditional restaurant-style culinary toolkit into the language required
by a food-manufacturing facility. Food factories must use ingredients that
can be obtained in quantity at consistent quality. These are not the same as,
and may not taste quite the same as, the ingredients used by the executive
chef during recipe development. Also, food factories use volume production
equipment, such as huge-steam-heated retorts. Such equipment is very dif-
ferent from restaurant-style stoves and pots and pans, and it often cannot
reproduce the cooking conditions created by the executive chef on a stove-
top—for example, very rapid heating. Therefore, food-production factories
cannot simply produce a recipe developed by or modified by an executive
chef “as is” under factory conditions—it will not taste the same.
As a consequence, even though an executive chef creates a prototype
product using a traditional chef’s toolkit, food manufacturers find most of
that information—the information about ingredients and processing con-
ditions—useless because it cannot be straightforwardly translated into
factory-relevant terms. The only information that can be salvaged is the
information about taste and texture contained in the prototype. And so,
production chefs carefully examine and taste the customer’s custom food
prototype, then try to make something that tastes the same using factory
ingredients and methods. But an executive chef’s taste buds are not neces-
sarily the same as production chef taste buds, and so the initial factory ver-
sion—and the second and the third—is typically not what the customer
wants. So the producer must create variation after variation until the
customer is finally satisfied.
To solve the translation problem, Gum created a novel toolkit of pre-
processed food ingredients to be used by executive chefs during food devel-
opment. Each ingredient in the toolkit was the Nestlé factory version of an
160 Chapter 11
ingredient traditionally used by chefs during recipe development: That is, it
was an ingredient commercially available to Nestlé that had been processed
as an independent ingredient on Nestlé factory equipment. Thus, a toolkit
designed for developing Mexican sauces would contain a chili puree ingre-
dient processed on industrial equipment identical to that used to produce
food in commercial-size lots. (Each ingredient in such a toolkit also con-
tains traces of materials that will interact during production—for example,
traces of tomato are included in the chili puree—so that the taste effects of
such interactions will also be apparent to toolkit users.)
Chefs interested in using the Nestlé toolkit to prototype a novel Mexican
sauce would receive a set of 20–30 ingredients, each in a separate plastic
pouch. They would also be given instructions for the proper use of these
ingredients. Toolkit users would then find that each component differs
slightly from the fresh components he or she is used to. But such differences
are discovered immediately through direct experience. The chef can then
adjust ingredients and proportions to move to the desired final taste and
texture that is desired. When a recipe based on toolkit components is fin-
ished, it can be immediately and precisely reproduced by Nestlé factories—
because now the executive chef is using the same language as the factory.
In the Nestlé case, field testing by Food Product Development Department
researchers showed that adding the error-free translation feature to toolkit-
based design by users reduced the time of custom food development from
26 weeks to 3 weeks by eliminating repeated redesign and refinement inter-
actions between Nestlé and purchasers of its custom food products.
Discussion
A toolkit’s success in the market is significantly correlated with that toolkit’s
quality and with industry conditions. Thus, Prügl and Franke (2005) stud-
ied the success of 100 toolkits offered in a single industry: computer gam-
ing. They found that success, evaluated by independent experts, was
significantly correlated with the quality of execution of the attributes of
toolkits that have been discussed in this chapter. That is, success was found
to be significantly affected by the quality of trial-and-error learning enabled
by a toolkit, by the quality of fit of the solution space offered to users’
design problems, by the user friendliness of the tools provided, and by the
quality of module libraries offered with the toolkit. Schreier and Franke
Toolkits 161
(2004) also obtained information on the importance of toolkit quality in a
study of the value that users placed on consumer products (scarves, T shirts,
cell phone covers) customized with a simple, manufacturer-supplied
toolkit. They found user willingness to pay for custom designs, as measured
by Vickrey auctions, was significantly negatively affected by the difficulty
of creating custom designs with a toolkit. In contrast, willingness to pay was
significantly positively affected by enjoyment experienced in using a
toolkit.
With respect to industry and market conditions, the toolkit-for-user
innovation approach to product design is likely to be most appealing to
toolkit suppliers when the heterogeneous needs of many users can be
addressed by a standard solution approach encoded in a toolkit. This is
because it can be costly to encode all the solution and production infor-
mation relevant to users’ design decisions. For example, a toolkit for
custom semiconductor design must contain information about the semi-
conductor production process needed to ensure that product designs cre-
ated by users are in fact producible. Encoding such information is a
one-time cost, so it makes the best economic sense for solution approaches
that many will want to use.
Toolkits for user innovation are not an appropriate solution for all prod-
uct needs, even when heterogeneous needs can be addressed by a common
solution approach. Specifically, toolkits will not be the preferred approach
when the product being designed requires the highest achievable per-
formance. Toolkits incorporate automated design rules that cannot, at
least at present, translate designs into products or software as skillfully as
a human designer can. For example, a design for a gate array generated
with a toolkit will typically take up more physical space on a silicon chip
than would a fully custom-developed design of similar complexity. Even
when toolkits are on offer, therefore, manufacturers may continue to
design certain products (those with difficult technical demands) while cus-
tomers take over the design of others (those involving complex or rapidly
evolving user needs).
Toolkits can be designed to offer a range of capabilities to users. At the
high end, with toolkits such as those used to design custom integrated cir-
cuits, users can truly innovate, creating anything implementable in digital
electronics, from a dishwasher controller to a novel supercomputer or form
of artificial life. At the low end, the product configurators commonly
162 Chapter 11
offered by manufacturers of mass-customized products enable, for example,
a watch purchaser to create a custom watch by selecting from lists of pre-
designed faces, hands, cases, and straps. (Mass-customized production
systems can manufacture a range of product variations in single-unit quan-
tities at near mass-production costs (Pine 1993). In the United States, pro-
duction systems used by these manufacturers are generally based on
computerized production equipment.)
The design freedom provided by toolkits for user innovation may not be
of interest to all or even to most users in a market characterized by hetero-
geneous needs. A user must have a great enough need for something differ-
ent to offset the costs of putting a toolkit to use for that approach to be of
interest. Toolkits may therefore be offered only to a subset of users. In the
case of software, toolkits may be provided to all users along with a standard,
default version of the product or service, because the cost of delivering the
extra software is essentially zero. In such a case, the toolkit’s capability will
simply lie unused in the background unless and until a user has sufficient
incentive to evoke and employ it.
Provision of toolkits to customers can be a complement to lead user idea-
generation methods for manufacturers. Some users choosing to employ a
toolkit to design a product precisely right for their own needs will be lead
users, whose present strong need foreshadows a general need in the market.
Manufacturers can find it valuable to identify and acquire the generally use-
ful improvements made by lead users of toolkits, and then supply these to
the general market. For this reason, manufacturers may find it valuable
implement toolkits for innovation even if the portion of the target market
that can directly use them is relatively small.
Toolkits can affect existing business models in a field in ways that may or
may not be to manufacturers’ competitive advantage in the longer run. For
example, consider that many manufacturers of products and services profit
from both their design capabilities and their production capabilities. A
switch to user-based customization via toolkits can affect their ability to do
this over the long term. Thus, a manufacturer that is early in introducing a
toolkit approach to custom product or service design may initially gain an
advantage by tying that toolkit to its particular production facility.
However, when toolkits are made available to customer designers, this tie
often weakens over time. Customers and independent tool developers can
eventually learn to design toolkits applicable to the processes of several
Toolkits 163
manufacturers. Indeed, this is precisely what has happened in the custom
integrated circuit industry. The toolkits revealed to users by the initial inno-
vator, LSI, and later by rival producers were producer-specific. Over time,
however, Cadance and other specialist toolkit supply firms emerged and
developed toolkits that could be used to make designs producible by a
number of vendors. The end result is that manufacturers that previously
benefited from selling their product-design skills and their production skills
can be eventually forced by the shifting of design tasks to customers via
toolkits to a position of benefiting from their production skills only.
Manufacturers that think long-term disadvantages may accrue from a
switch to toolkits for user innovation and design will not necessarily have
the luxury of declining to introduce toolkits. If any manufacturer intro-
duces a high-quality toolkit into a field favoring its use, customers will tend
to migrate to it, forcing competitors to follow. Therefore, a firm’s only real
choice in a field where conditions are favorable to the introduction of tool-
kits may be whether to lead or to follow.
164 Chapter 11
12 Linking User Innovation to Other Phenomena and Fields
This final chapter is devoted to describing links between user-centered inno-
vation and other phenomena and literatures. Of course, innovation writ
large is related to anything and everything, so the phenomena and the liter-
atures I will discuss here are only those hanging closest on the intellectual
tree. My goal is to enable interested readers to migrate to further branches as
they wish, assisted by the provision of a few important references. With
respect to phenomena, I will first point out the relationship of user innova-
tion to information communities—of which user innovation communities
are a subset. With respect to related fields, I begin by linking user-centric
innovation phenomena explored in this book to the literature on the eco-
nomics of knowledge, and to the competitive advantage of nations. Next I
link it to research on the sociology of technology. Finally, I point out how
findings regarding user innovation could—but do not yet—link to and com-
plement the way that product development is taught to managers.
Information Communities
Many of the considerations I have discussed with respect to user innovation
communities apply to information communities as well—a much more gen-
eral category of which user innovation communities are a subset. I define
information communities as communities or networks of individuals
and/or organizations that rendezvous around an information commons, a
collection of information that is open to all on equal terms.
In close analogy to our discussions of innovation communities, I propose
that commons-based information communities or networks will form when
the following conditions hold: (1) Some have information that is not gen-
erally known. (2) Some are willing to freely reveal what they know. (3) Some
beyond the information source have uses for what is revealed. On an intu-
itive basis, one can immediately see that these conditions are often met. Of
course, people and firms know different things. Of course there are many
things that one would not be averse to freely revealing; and of course others
would often be interested in what is freely revealed. After all, as individuals
we all regularly freely reveal information not generally known to people
who ask, and presumably these people value at least some of the informa-
tion we provide.
The economics of information communities can be much simpler than
that of the user innovation communities discussed earlier, because valu-
able proprietary information is often not at center stage. When the service
provided by information communities is to offer non-proprietary “con-
tent” in a more convenient and accessible form, one need consider only
the costs and benefits associated with information diffusion. One need not
also consider potential losses associated with the free revealing of propri-
etary innovation-related information.
It is likely that information communities are getting steadily more per-
vasive for the same reasons that user innovation communities are: the
costs of diffusing information are getting steadily lower as computing and
communication technologies improve. As a result, information communi-
ties may have a rapidly increasing impact on the economy and on the
landscape of industry. They are and will be especially empowering to frag-
mented groups, whose members may for the first time gain low-cost access
to a great deal of rich and fresh information of mutual interest. As is the
case for user innovation networks, information networks can actually store
content that participants freely reveal and make it available for free down-
loading. (Wikipedia is an example of this.) And/or, information networks
can function to link information seekers and information holders rather
than actually storing information. In the latter case, participants post to
the network, hoping that someone with the requested information will
spot their request and provide an answer (Lakhani and von Hippel 2003).
Prominent examples can be found in the medical field in the form of spe-
cialized websites where patients with relatively rare conditions can for the
first time find each other and also find specialists in those conditions.
Patients and specialists who participate in these groups can both provide
and get access to information that previously was scattered and for most
practical purposes inaccessible.
166 Chapter 12
Just as is the case in user innovation groups, open information commu-
nities are developing rapidly, and the behaviors and infrastructure needed
for success are being increasingly learned and codified. These communities
are by no means restricted to user-participants. Thus, both patients and
doctors frequently participate in medical information communities. Also,
information communities can be run by profit-making firms and/or on a
non-profit basis for and by information providers and users themselves—
just as we earlier saw was the case with innovation communities. Firms and
users are developing many versions of open information communities
and testing them in the market. As an example of a commercially sup-
ported information commons, consider e-Bay, where information is freely
revealed by many under a structure provided by a commercial firm. The
commercial firm then extracts a profit from commissions on transactions
consummated between information providers and information seekers. As
an example of an information community supported by users themselves,
again consider Internet sites specializing in specific diseases—for example,
childrenfacingillness.com.
Information communities can have major effects on established ways of
doing business. For example, markets become more efficient as the infor-
mation provided to transaction participants improves. Thus, product and
service manufacturers benefit from good information on the perceptions
and preferences of potential buyers. Similarly, product and service pur-
chasers benefit from good information on the characteristics of the various
offerings in the market. Traditionally, firms have collected information on
users’ needs and on products’ characteristics by means of face-to-face inter-
viewing and (in the case of mass markets) questionnaires. Similar informa-
tion of high quality now can be collected nearly without cost and can be
posted on special Internet sites by users themselves and/or by for-profit
enterprises. Dellarocas, Awad, and Zhang (2004) show that volunteered
online movie reviews provide information that is just as accurate as that
collected by surveys of representative samples of respondents. This emerg-
ing new approach to data aggregation will clearly affect the established
business models of firms specializing in information collection, with web-
sites like www.ciao.co.uk illustrating new possibilities. If the quality of
information available to transaction participants goes up and the informa-
tion price is low, transaction quality should go up. With the aid of online
product-evaluation sites, it is likely that consumers will be able to apply
Other Phenomena and Fields 167
much better information even to small buying decisions, such as the choice
of a restaurant for tonight’s dinner.
What Paul David and colleagues call “open science” is a type of informa-
tion community that is closely related to the innovation communities dis-
cussed earlier (David 1992; Dasgupta and David 1994; David 1998). Free
revealing of findings is, of course, a characteristic of modern science.
Academic scientists publish regularly and so freely reveal information that
may have high proprietary value. This raises the same question explored in
the case of innovation communities: Why, in view of the potential of free
ridership, do scientists freely reveal the information they have developed at
private cost? The answer overlaps with but also differs from the answers
provided in the case of free revealing of proprietary innovations by inno-
vation users. With respect to similarities, sociologists of science have found
that reputation among peers is important to scientists, and that priority in
the discovery of new knowledge is a major component of reputation.
Because of the importance of priority, scientists generally rush their research
projects to completion and then rush to freely reveal their new findings.
This dynamic creates a great advantage from the point of view of social wel-
fare (Merton 1973).
With respect to major differences, it is public policy in many countries to
subsidize research with public funds. These policies are based on the
assumption that only inadequate amounts of scientific research can be
drawn forth by reputational inducements alone. Recall that, in contrast,
innovations developed and freely revealed by innovation users are not sub-
sidized from any source. Users, unlike “scientists,” by definition have a per-
sonal or corporate use for the innovation-related knowledge they generate.
This additional source of private reward may explain why user innovation
communities can flourish without subsidy.
The Economics of Knowledge
In this field, Foray (2004) provides a rich road map regarding the econom-
ics of knowledge and the central role played by users. Foray argues that the
radical changes in information and communication technologies (ICT) are
creating major changes in the economics of knowledge production and dis-
tribution. Economists have traditionally reduced knowledge production to
the function of research and development, defined as the activity specifi-
168 Chapter 12
cally devoted to invention and innovation. Starting with Machlup (1962),
economists also have identified the knowledge-based economy as consist-
ing of specialized sectors focused on activities related to communication,
education, the media, and computing and information-related services.
Foray argues that these simplifications, although providing a rationale for a
way to measure knowledge-generation activities, were never appropriate
and now are totally misleading.
Knowledge generation, Foray says, is now a major activity across all indus-
trial sectors and is by no means restricted to R&D laboratories: we are in the
age of the knowledge economy. He makes a central distinction between
R&D that is conducted in laboratories remote from doing, and learning by
doing at the site of production. He argues that both are important, and have
complementary advantages and drawbacks. Laboratory research can ignore
some of the complexities involved in production in search of basic under-
standing. Learning by doing has the contrasting advantage of being in the
full fidelity of the real production process. The drawback to learning by
doing, however, is that one is attempting to do two things at once—pro-
ducing and learning—and this can force compromises onto both.
Foray positions users at the heart of knowledge production. He says that
one major challenge for management is to capture the knowledge being
generated by users “on line” during the process of doing and producing, and
to integrate it with knowledge created “off line” in laboratories. He discusses
implications of the distributed nature of knowledge production among users
and others, and notes that the increased capabilities of information and
communication technologies tend to reduce innovators’ ability to control
the knowledge they create. He proposes that the most effective knowledge-
management policies and practices will be biased toward knowledge sharing.
Weber (2004, pp. 72–73) explores similar ideas in the specific context of
open source software. “The conventional language of industrial-era eco-
nomics,” he notes, “identifies producers and consumers, supply and
demand. The open source process scrambles these categories. Open source
software users are not consumers in the conventional sense. . . . Users inte-
grate into the production process itself in a profound way.” Weber’s central
thesis is that the open source process is a new way of organizing production:
One solution is the familiar economy that depends upon a blend of exclusive prop-
erty rights, divisions of labor, reduction of transaction costs, and the management of
principal-agent problems. The success of open source demonstrates the importance
Other Phenomena and Fields 169
of a fundamentally different solution, built on top of an unconventional under-
standing of property rights configured around distribution. . . . And it relies on a set
of organizational structures to coordinate behavior around the problem of managing
distributed innovation, which is different from the division of labor. (ibid., p. 224)
Weber details the property-rights regime used by open source projects,
and also the nature of open source innovation communities and incentives
acting on participants. He then argues that this new mode of production
can extend beyond the development of open source software, to an extent
and a degree that are not yet understood:
One important direction in which the open source experiment points is toward mov-
ing beyond the discussion of transaction as a key determinant of institutional design.
. . . The elegant analytics of transaction cost economics do very interesting work in
explaining how divisions of labor evolve through outsourcing of particular functions
(the decision to buy rather than make something). But the open source process adds
another element. The notion of open-sourcing as a strategic organizational decision
can be seen as an efficiency choice around distributed innovation, just as outsourc-
ing was an efficiency choice around transactions costs. . . . As information about
what users want and need to do becomes more fine-grained, more individually
differentiated, and harder to communicate, the incentives grow to shift the locus of
innovation closer to them by empowering them with freely modifiable tools. (ibid.,
pp. 265–267)
National Competitive Advantage
Understanding national innovation systems and the competitive advantage
of a nation’s firms is an important matter for national policy makers (Nelson
1993). Can what we have learned in this book shed any light on their con-
cerns? Porter (1991), assessing national competitive advantage through the
intellectual lens of competitive strategy, concludes that one of four major
factors determining the competitive advantage of nations is demand condi-
tions. “A nation’s firms,” he argues, “gain competitive advantage if domestic
buyers are, or are among, the world’s most sophisticated and demanding
buyers for the product or service. Such buyers provide a window into the
most advanced buyer needs. . . . Buyers are demanding where home product
needs are especially stringent or challenging because of local circumstances.”
For example: “The continental United States has been intensely drilled, and
wells are being drilled in increasingly difficult and marginal fields. The pres-
sure has been unusually great for American oil field equipment suppliers to
perfect techniques that minimize the cost of difficult drilling and ensure full
170 Chapter 12
recovery from each field. This has pushed them to advance the state of the
art and sustain strong international positions.” (ibid., pp. 89–90)
Porter also argues that early domestic demand is also important:
“Provided it anticipates buyer needs in other nations, early local demand
for a product or service in a nation helps local firms to move sooner than
foreign rivals to become established in an industry. They get the jump in
building large-scale facilities and accumulating experience. . . . Only if
home demand is anticipatory of international need will home demand con-
tribute to advantage.” (ibid., p. 95)
From my perspective, Porter is making the case for the value of a nation’s
domestic lead users to national competitive advantage. However, he is also
assuming that it is manufacturers that innovate in response to advanced or
stringent user demand. On the basis of the findings reported on in this
book, I would modify this assumption by noting that, often, domestic
manufacturers’ links to innovating lead users have the impacts on national
competitive advantage that he describes—but that the lead users’ input to
favored domestic firms would include innovations as well as needs.
Domestic lead users make a difference to national competitive advantage,
Porter argues, because “local firms often enjoy some natural advantages in
serving their home market compared to foreign firms, a result of proximity
as well as language, regulation, and cultural affinities (even, frequently, if
foreign firms are staffed with local nationals).” Porter continues: “Preferred
access to a large domestic customer base can be a spur to investment by
local firms. Home demand may be perceived as more certain and easier to
forecast, while foreign demand is seen as uncertain even if firms think they
have the ability to fill it.” (ibid., p. 93)
What new insights and research questions can the work of this book con-
tribute to this analysis of national competitive advantage? On the one
hand, I certainly see the pattern Porter describes in some studies of lead user
innovation. For example, early in the history of the US semiconductor
industry, AT&T, the inventor of the transistor and an early innovator, devel-
oped a number of novel types of production equipment as a user organiza-
tion. AT&T engineers went to local machine shops to have these machines
produced in volume to meet AT&T’s in-house production needs. A side
effect of this procurement strategy was to put many of these previously
undistinguished firms into the business of producing advanced semi-
conductor equipment to the world (von Hippel 1977, 1988).
Other Phenomena and Fields 171
On the other hand, the findings of this book suggest that the “natural
advantages” Porter proposes that domestic manufacturers will have with
respect to filling the needs of local lead users may be eroding in the Internet
age. As has been seen in the case of open source software, and by extension
in the cases of other information-based products, users are capable of devel-
oping complex products in a coordinated way without geographic proxim-
ity. Participants in a particular open source project, for example, may come
from a number of countries and may never meet face to face. In the case of
physical products, the emergence of a pattern of user-based design followed
by “foundry-style” production may also reduce the importance of propin-
quity between innovating lead users and manufacturers. As in the cases of
integrated circuits and kitesurfing discussed earlier in this book, users can
transmit CAD product-design information files from anywhere to any suit-
ably equipped manufacturer for production. Probably only in the case of
physical products where the interaction between product and production
methods are not clear will geography continue to matter deeply in the age
of the Internet. Nations may be able to create comparative advantages for
domestic manufacturers with respect to profiting from innovation by lead
users; however, they cannot assume that such advantages will continue to
exist simply because of propinquity.
The Sociology of Technical Communities
Relevant elements of this field include studies in the sociology of technol-
ogy in general and studies of the sociology of open source software com-
munities in particular. Historical accounts of the evolution of a technology
have often taken a linear view of their subject. In the linear view, a tech-
nology such as aerodynamics and related technological artifacts such as
the airplane start at point A and then naturally evolve to end point B. In
other words, it is implicitly assumed that the airplane will evolve from the
artifact of wood and fabric and wire developed by the Wright brothers
to the characteristics we associate with aircraft today. Nothing much to
explain about that.
In the Social Construction of Technology (SCOT) model of technological
evolution (Pinch and Bijker 1987), the direction in which an artifact (a
product, for example) evolves depends very much on the meanings that dif-
ferent “groups with a problem” construct for it. These meanings, in turn,
172 Chapter 12
affect which of the many possible variations of a product are developed,
how they evolve, and whether and how they eventually die. Groups that
construct the meanings of a product centrally include, but are not restricted
to, product users. For example, in the case of the bicycle, some relevant
groups were users of various types—people who wanted to travel from place
to place via bicycle, people who wanted to race bicycles, etc. Relevant non-
user groups included “anticyclists,” who had a negative view of the bicycle
in its early days and wanted it to fail (Bijker 1995).
When one takes the views of all relevant groups into account, one gets
a much richer view of the “socially constructed” evolution of a technology.
As a relatively recent example, consider the supersonic transport plane
(SST) planned in the United States during the 1970s. Airlines, and poten-
tial passengers were “groups with a problem” who presumably wanted the
technology for different reasons. Other relevant groups with a problem
included people who expected to be negatively affected by the sonic boom
the SST would cause, people who were concerned about the pollution its
engines would cause in the stratosphere, and people who had other rea-
sons for opposing or supporting the SST. Proposed designs evolved in an
attempt to satisfy the various contending interest groups. Eventually it
became clear that the SST designers could not arrive at a generally accept-
able compromise solution and so the project failed (Horwich 1982).
Pinch and Kline (1996, pp. 774–775) elaborated on the original SCOT
model by pointing out that the way a product is interpreted is not restricted
to the design stage of a technology, but also can continue during the prod-
uct’s use. They illustrated with the case of the automobile:
. . . although [automobile] manufacturers may have ascribed a particular meaning to
the artifact they were not able to control how that artifact was used once it got into
the hands of the users. Users precisely as users can embed new meanings into the
technology. This happened with the adaptation of the car into rural life. As early as
1903, farm families started to define the car as more than a transportation device.
In particular, they saw it as a general source of power. George Schmidt, a Kansas
farmer, advised readers of the Rural New Yorker in 1903 to “block up the hind axle
and run a belt over the one wheel of the automobile and around the wheel on a
[corn] sheller, grinder, saw, pump, or any other machine that the engine is capable
of running, and see how the farmer can save money and be in style with any city
man.” T. A. Pottinger, an Illinois farm man, wrote in Wallace’s Farmer in 1909 that
“the ideal farm car should have a detachable backseat, which could turn the vehicle
into a small truck.”
Other Phenomena and Fields 173
Of course, user innovations and modifications are involved in these cases
along with users’ reinterpretation of product uses. Kline and Pinch report
that manufacturers adopted some of the rural users’ innovations, generally
after a lag. For example, a car that could also serve as a small truck was even-
tually offered as a commercial product.
Research on communities of practice offers another link between studies
of user innovation and sociology (Brown and Duguid 1991; Wenger 1998).
The focus of this research is on the functioning of specialist communities.
Researchers find that experts in a field spontaneously form interest groups
that communicate to exchange their views and learnings on how to carry
out and improve the practices of their profession. Members of communities
of practice exchange help in informal ways that seem similar to the prac-
tices described above as characteristic of open source software projects and
communities of sports innovators.
Research on brand communities is still another related research thread
(Muniz and O’Guinn 2001). Brand communities form around commercial
brands and products (e.g., Lego construction toys) and even around prod-
ucts discontinued by their manufacturers e.g., Apple’s Newton personal
digital assistant). Brand communities can be intensely meaningful to par-
ticipants and can involve user innovation. In Newton groups, for example,
users develop new applications and exchange information about how to
repair aging equipment (Muniz and Schau 2004). In Lego communities,
lead users develop new products, new building techniques, and new offline
and online multiplayer building projects that later prove to be of interest to
the manufacturer (Antorini 2005).
The Management of Product Development
Finally, I turn to links between user-centered innovation and teaching on
the management of product development. Information on lead users as a
source of new product ideas now appears in most marketing textbooks.
There also should be a link to other elements of user-centered innovation
processes in the literature on product-development management—but
there really isn’t much of one yet. Although much of the research on user
innovation cited in this book is going on in schools of management and
business economics, little of this information has moved into teaching
related to the product-development process as of yet.
174 Chapter 12
Clearly, it would be useful to provide managers of both user firms and
manufacturing firms with a better understanding of the management of
user-centered innovation. It is a curious fact that even managers of firms
that have built major product lines upon user-developed innovations may
hold the manufacturer-centric view that “we developed that.” For example,
an early study of innovation in scientific instruments documented that
nearly 80 percent of the major improvements commercialized by instru-
ment manufacturers had been developed by users (von Hippel 1976). When
I later discussed this finding with managers in instrument firms, most of
them were astonished. They insisted that all the innovations in the study
sample had been developed within manufacturing firms. They could be
convinced otherwise only when supplied with actual publications by user-
scientists describing user-built prototypes of those instrument improve-
ments—prototypes developed from 5 to 7 years before any instrument firm
had sold a functionally equivalent commercial product.
My inquiries into why managers in this field and others held—and largely
still hold—such contrary-to-fact beliefs identified several contributing fac-
tors. First, manufacturers seldom track where the major new products and
product improvements they sell actually came from. Managers see no need
to set up a tracking system, because the conventional wisdom is clear:
“Everyone knows new products are developed by manufacturers such as
ourselves based on user needs identified by market research.” Further, the
manufacturing firms have market-research and product-development
departments in place, and innovations are somehow being produced. Thus,
it is easy to conclude that the manufacturers’ innovation processes must be
working as expected.
In fact, however, important, functionally novel innovations are often
brought into manufacturers by informal channels. Product-development
engineers may attend conferences and learn about important user innova-
tions, salesmen and technical service personnel discover user-modified
equipment on field visits, and so on. Once the basic innovation-related
information is in house, the operating principles of a user’s prototype will
often be adopted, but the detailed design of the device will be changed and
improved for production. After a while, the user’s prototype, if remembered
at all, will begin to look quite primitive to the firm’s engineers relative to
the much better product they have designed. Finally, when sales begin, the
firm’s advertising will urge customers to buy “our wonderful new product.”
Other Phenomena and Fields 175
The net result is understandable: the user roots of many new commercial
products, never widely known in manufacturing firms, are forgotten. And
when it is time to develop the next innovation, management again turns
to the conventional methods that “worked so well for us last time.”
Eventually, information about new user innovations will again arrive by
pathways unnoticed and unmanaged—and with an unnecessary lag.
To improve matters, managers must learn when it is appropriate to follow
user-centered and manufacturer-centered innovation process paradigms
and how user-centered innovation can best be managed when it is the
method of choice. Managers in user firms and in manufacturing firms need
tools with which to understand the innovate-or-buy decisions they face—to
understand which product needs or which service needs users (rather than
manufacturers) should invest in developing. Managers in user firms also
need to learn how their firms can best carry out development work in their
low-cost innovation niches: how they can best deploy their information-
related advantages of being actual users and residing in the context of use
to cheaply learn by doing. Managers in manufacturing firms will want to
learn how they can best play a profitable role in user-centered innovation
patterns when these play a role in the markets they serve.
Innovating users may also want to learn whether and how to diffuse
their innovations by becoming manufacturers. This may be a fairly com-
mon practice in some fields. Shah (2000) found that users of sports equip-
ment sometimes became manufacturers by a very natural process. The
users would demonstrate the performance and value of their innovations
as they used them in public sporting events. Some of the participants in
the meets would then ask “Can you make one of those for me too?”
Informal hobby-level production would then sometimes become the basis
of a major company. Lettl, Herstatt, and Gemunden (2004) report on case
histories in which user-innovators became heavily involved in promoting
the commercialization of important innovations in surgical equipment.
These innovations tended to be developed by surgeons, who then often
made major efforts to induce manufacturers to commercialize them.
Hienerth (2004) documents how user-innovators in “rodeo kayaking”
build their own boats, discover that kayak manufacturers (even those
established by a previous generation of user-innovators) are unwilling to
manufacture what they want, and so are driven to become manufacturers
themselves.
176 Chapter 12
Managers must learn that no single locus of innovation is the “right” one
for either user firms or manufacturer firms. The locus of innovation varies
between user firms and manufacturing firms according to market-related
and information-related conditions. These conditions may well vary pre-
dictably over product life cycles. Utterback and Abernathy (1975) proposed
that innovation by users is likely to be more important in the early stages of
such cycles. Early in the life of a new product, there is a “fluid” stage in
which the nature and the use of a product are unclear. Here, Utterback and
Abernathy say, users play a big part in sorting the matter out, in part through
innovation. Later, a dominant product design will emerge—a shared sense of
exactly what a particular product is, what features and components it should
include, and how it should function. (We all know, for example, that a car
has four wheels and moves along the ground in directions determined by a
steering wheel.) After that time, if the market for the product grows, inno-
vation will shift from product to process as firms shift from the problem of
what to produce to the problem of how to produce a well-understood prod-
uct in ever greater volumes. From a lead user innovation perspective, of
course, both functionally novel products and functionally novel processes
are likely to be developed by users—in the first case users of the product, and
in the second by manufacturing firms that use the process.
In Conclusion
In this book I have explored how and why users, individually and in firms
and in communities, develop and freely reveal innovations. I have also
argued that there is a general trend toward a open and distributed innova-
tion process driven by steadily better and cheaper computing and commu-
nications. The net result is an ongoing shift toward the democratization of
innovation. This welfare-enhancing shift is forcing major changes in user
and manufacturer innovation practices, and is creating the need for change
in government policies. It also, as I noted at the start of the book, presents
major new opportunities for us all.
Other Phenomena and Fields 177

Notes
Chapter 2
1. LES contains four types of measures. Three (“benefits recognized early,” “high ben-
efits expected,” and “direct elicitation of the construct”) contain the core components
of the lead user construct. The fourth (“applications generation”) is a measure of a
number of innovation-related activities in which users might engage: they “suggest
new applications,” they “pioneer those applications,” and (because they have needs or
problems earlier than their peers) they may be “used as a test site” (Morrison, Midgely,
and Roberts 2004).
Chapter 3
1. Cluster analysis does not specify the “right” number of clusters—it simply seg-
ments a sample into smaller and smaller clusters until the analyst calls a halt.
Determining an appropriate number of clusters within a sample can be done in dif-
ferent ways. Of course, it always possible to say that “I only want to deal with three
market segments, so I will stop my analysis when my sample has been segmented
into three clusters.” More commonly, analysts will examine the increase of squared
error sums of each step, and generally will view the optimal number of clusters as
having been reached when the plot shows a sudden “elbow” (Myers 1996). Since this
technique does not incorporate information on remaining within-cluster hetero-
geneity, it can lead to solutions with a large amount of within-cluster variance. The
“cubic clustering criterion” (CCC) partially addresses this concern by measuring the
within-cluster homogeneity relative to the between-cluster heterogeneity. It suggests
choosing the number of clusters where this value peaks (Milligan and Cooper 1985).
However, this method appears to be rarely used: Ketchen and Shook (1996) found it
used in only 5 of 45 segmentation studies they examined.
2. http://groups-beta.google.com/group/comp.infosystems.www.servers.unix
3. http://modules.apache.org/
4. To measure heterogeneity, Franke and I analyzed the extent to which j standards,
varying from [1; i], meet the needs of the i individuals in our sample. Conceptually,
we first locate a product in multi-dimensional need space (dimensions = 45 in the
case of our present study) that minimizes the distances to each individual’s needs.
(This step is analogous to the Ward’s method in cluster analysis that also minimizes
within cluster variation; see Punj and Stewart 1983.) The “error” is then measured as
the sum of squared Euclidean distances. We then repeated these steps to determine
the error for two optimally positioned products, three products, and so on up to a
number equaling I – 1. The sum of squared errors for all cases is then a simple coef-
ficient that measures how much the needs of i individuals can be satisfied with j stan-
dard products. The “coefficient of heterogeneity” just specified is sensitive both to
the (average) distance between the needs and for the configuration of the needs: when
the needs tend to form clusters the heterogeneity coefficient is lower than if they are
evenly spread. To make the coefficient comparable across different populations, we
calibrate it using a bootstrapping technique (Efron 1979) involving dividing the coef-
ficient by the expected value (this value is generated by averaging the heterogeneity
of many random distributions of heterogeneity of the same kind). The average ran-
dom heterogeneity coefficient is then an appropriate value for calibration purposes:
it assumes that there is no systematic relationship between the needs of the individ-
uals or between the need dimensions.
5. Conceptually, it can be possible to generate “one perfect product” for everyone—
in which case heterogeneity of demand is zero—by simply creating all the features
wanted by anyone (45 + 92 features in the case of this study), and incorporating them
in the “one perfect product.” Users could then select the features they want from a
menu contained in the one perfect product to tailor it to their own tastes. Doing this
is at least conceptually possible in the case of software, but less so in the case of a
physical product for two reasons: (1) delivering all possible physical options to every-
one who buys the product would be expensive for physical goods (while costing
nothing extra in the case of information products); (2) some options are mutually
exclusive (an automobile cannot be both red and green at the same time).
6. The difference between actual willingness to pay and expressed willingness to pay
is much lower for private goods (our case) than for public goods. In the case of pri-
vate goods, Loomis et al. (1996) found the expressed willingness to pay for art prints
to be twice the actual WTP. Willis and Powe (1998) found that among visitors to a
castle the expressed WTP was 60 percent lower than the actual WTP. In the case of
public goods, Brown et al. (1996), in a study of willingness to pay for removal of a
road from a wilderness area, found the expressed WTP to be 4–6 times the actual
WTP. Lindsey and Knaap (1999), in a study of WTP for a public urban greenway,
found the expressed WTP to be 2-10 times the actual WPT. Neil et al. (1994) found
the expressed WTP for conserving an original painting in the desert to be 9 times the
actual WTP. Seip and Strand (1992) found that less than 10 percent of those who
expressed interest in paying to join an environmental organization actually joined.
180 Notes to p. 40
Chapter 6
1. As a specific example of a project with an emergent goal, consider the beginnings
of the Linux open source software project. In 1991, Linus Torvalds, a student in
Finland, wanted a Unix operating system that could be run on his PC, which was
equipped with a 386 processor. Minix was the only software available at that time but
it was commercial, closed source, and it traded at US$150. Torvalds found this too
expensive, and started development of a Posix-compatible operating system, later
known as Linux. Torvalds did not immediately publicize a very broad and ambitious
goal, nor did he attempt to recruit contributors. He simply expressed his private moti-
vation in a message he posted on July 3, 1991, to the USENET newsgroup
comp.os.minix (Wayner 2000): Hello netlanders, Due to a project I’m working on (in
minix), I’m interested in the posix standard definition. [Posix is a standard for UNIX
designers. A software using POSIX is compatible with other UNIX-based software.]
Could somebody please point me to a (preferably) machine-readable format of the latest
posix-rules? Ftp-sites would be nice. In response, Torvalds got several return messages
with Posix rules and people expressing a general interest in the project. By the early
1992, several skilled programmers contributed to Linux and the number of users
increased by the day. Today, Linux is the largest open source development project
extant in terms of number of developers.
Chapter 7
1. When they do not incorporate these qualities, they would be more properly
referred to as networks—but communities is the term commonly used, and I follow
that practice here.
2. hacker n. [originally, someone who makes furniture with an axe] 1. A person who
enjoys exploring the details of programmable systems and how to stretch their capa-
bilities, as opposed to most users, who prefer to learn only the minimum necessary.
2. One who programs enthusiastically (even obsessively) or who enjoys programming
rather than just theorizing about programming. 3. A person capable of appreciating
hack value. 4. A person who is good at programming quickly. . . . 8. [deprecated] A
malicious meddler who tries to discover sensitive information by poking around.
Hence password hacker, network hacker. The correct term for this sense is cracker(Raymond 1996).
3. Source code is a sequence of instructions to be executed by a computer to accom-
plish a program’s purpose. Programmers write computer software in the form of
source code, and also document that source code with brief written explanations of
the purpose and design of each section of their program. To convert a program into
a form that can actually operate a computer, source code is translated into machine
code using a software tool called a compiler. The compiling process removes program
documentation and creates a binary version of the program—a sequence of computer
Notes to pp. 90–97 181
instructions consisting only of strings of ones and zeros. Binary code is very difficult
for programmers to read and interpret. Therefore, programmers or firms that wish to
prevent others from understanding and modifying their code will release only binary
versions of the software. In contrast, programmers or firms that wish to enable oth-
ers to understand and update and modify their software will provide them with its
source code. (Moerke 2000, Simon 1996).
4. See www.gnu.org/licenses/licenses.html#GPL
5. http://www.sourceforge.net
6. “The owner(s) [or ‘maintainers’] of an open source software project are those who
have the exclusive right, recognized by the community at large, to redistribute modi-
fied versions. . . . According to standard open source licenses, all parties are equal in
the evolutionary game. But in practice there is a very well-recognized distinction
between ‘official’ patches [changes to the software], approved and integrated into the
evolving software by the publicly recognized maintainers, and ‘rogue’ patches by
third parties. Rogue patches are unusual and generally not trusted.” (Raymond 1999,
p. 89)
Chapter 8
1. See also Bresnahan and Greenstein 1996b; Bresnahan and Saloner 1997; Saloner
and Steinmueller 1996.
Chapter 10
1. ABS braking is intended to keep a vehicle’s wheels turning during braking. ABS
works by automatically and rapidly “pumping” the brakes. The result is that the
wheels continue to revolve rather than “locking up,” and the operator continues to
have control over steering.
2. In the general literature, Armstrong’s (2001) review on forecast bias for new prod-
uct introduction indicates that sales forecasts are generally optimistic, but that that
upward bias decreases as the magnitude of the sales forecast increases. Coller and
Yohn (1998) review the literature on bias in accuracy of management earnings fore-
casts and find that little systematic bias occurs. Tull’s (1967) model calculates $15 mil-
lion in revenue as a level above which forecasts actually become pessimistic on
average. We think it reasonable to apply the same deflator to LU vs. non-LU project
sales projections. Even if LU project personnel were for some reason more likely to be
optimistic with respect to such projections than non-LU project personnel, that
would not significantly affect our findings. Over 60 percent of the total dollar value
of sales forecasts made for LU projects were actually made by personnel not associ-
ated with those projects (outside consulting firms or business analysts from other
divisions).
182 Notes to pp. 97–140
Bibliography
Achilladelis, B., A. B. Robertson, and P. Jervis. 1971. Project SAPPHO. Centre for the
Study of Industrial Innovation, London.
Aghion, P., and J. Tirole. 1994. “The Management of Innovation.” Quarterly Journal of
Economics 109: 1185–1209.
Allen, R. C. 1983. “Collective Invention.” Journal of Economic Behavior and
Organization 4, no. 1: 1–24.
Allen, T. J. 1966. “Studies of the Problem-Solving Process in Engineering Design.”
IEEE Transactions on Engineering Management 13, no. 2: 72–83.
Amabile, T. M. 1996. Creativity in Context. Westview.
Antelman, Kristin. 2004. “Do Open Access Articles Have a Greater Research Impact?”
College and Research Libraries 65, no. 5: 372–382.
Antorini, Y. M. 2005. The Making of a Lead User. Working paper, Copenhagen
Business School.
Armstrong, J. S., ed. 2001. Principles of Forecasting. Kluwer.
Arora, A., A. Fosfuri, and A. Gambardella. 2001. Markets for Technology. MIT Press.
Arora, A., and A. Gambardella. 1994. “The Changing Technology of Technological
Change.” Research Policy 23, no. 5: 523–532.
Arrow, K. 1962. “Economic Welfare and the Allocation of Resources for Inventions.”
In R. R. Nelson, ed., The Rate and Direction of Inventive Activity. Princeton University
Press.
Arundel, A. 2001. “The Relative Effectiveness of Patents and Secrecy for
Appropriation.” Research Policy 30, no. 4: 611–624.
Balachandra, R., and J. H. Friar. 1997. “Factors for Success in R&D Projects and New
Product Introduction: A Contextual Framework.” IEEE Transactions on Engineering
Management 44, no. 3: 276–287.
Baldwin, C. Y., and K. B. Clark. 2003. Does Code Architecture Mitigate Free Riding in
the Open Source Development Model? Working paper, Harvard Business School.
Barnes, B., and D. Ulin. 1984. “Liability for New Products.” AWWA Journal, February:
44–47.
Baron, J. 1988. Thinking and Deciding. Cambridge University Press.
Behlendorf, B. 1999. “Open Source as a Business Strategy.” In C. Dibona, S. Ockman,
and M. Stone, eds., Open Sources. O’Reilly.
Benkler, Y. 2002. “Intellectual Property and the Organization of Information
Production.” International Review of Law and Economics 22, no. 1: 81–107.
Bessen, J. 2003. Patent Thickets. Working paper, Research on Innovation and Boston
University School of Law.
Bessen, J. 2004. Open Source Software. Working paper, Research on Innovation.
Bessen, J., and R. M. Hunt. 2004. An Empirical Look at Software Patents. Working
paper, Federal Reserve Bank of Philadelphia.
Bijker, Wiebe. 1995. Of Bicycles, Bakelites and Bulbs. MIT Press.
Boldrin, M., and D. Levine. 2002. “The Case against Intellectual Property.” AEA Papers
and Proceedings, May: 209–212.
Bresnahan, T. F., and S. Greenstein. 1996a. “Technical Progress and Co-Invention in
Computing and in the Uses of Computers.” Brookings Papers on Economic Activity.
Microeconomics 1996: 1–77.
Bresnahan, T. F., and S. Greenstein. 1996b. “The Competitive Crash in Large-Scale
Commercial Computing.” In R. Landau, T. Taylor, and G. Wright, eds., The Mosaic of
Economic Growth. Stanford University Press.
Bresnahan, T. F., and G. Saloner. 1997. “‘Large Firms’ Demand for Computer Products
and Services: Market Models, Inertia, and Enabling Strategic Change.” In D. B. Yoffie,
ed., Competing in the Age of Digital Convergence. Harvard Business School Press.
Brooks, P. F., Jr. 1979. The Mythical Man-Month. Addison-Wesley.
Brown, J. S., and P. Duguid. 1991. “Organizational Learning and Communities-of-
Practice: Toward a Unified View of Working, Learning, and Innovation.” Organization
Science 2, no. 1: 40–57.
Brown, T. C., P. A. Champ, R. C. Bishop, and D. W. McCollum. 1996. “Which
Response Format Reveals the Truth about Donations to a Public Good.” Land
Economics 72, no. 2: 152–166.
Buenstorf, G. 2002. “Designing Clunkers: Demand-Side Innovation and the Early
History of Mountain Bike.” In J. S. Metcalfe and U. Cantner, eds., Change, Transforma-
tion and Development. Physica.
184 Bibliography
Chamberlin, E. H. 1950. “Product Heterogeneity and Public Policy.” American
Economic Review 40, no. 2: 85–92.
Christensen, C. M. 1997. The Innovator’s Dilemma. Harvard Business School Press.
Cohen, W. M., A. Goto, A. Nagata, R. R. Nelson, and J. P. Walsh. 2002. “R&D
Spillovers, Patents and the Incentives to Innovate in Japan and the United States.”
Research Policy 31 (8–9): 1349–1367.
Cohen, W. M., and D. A. Levinthal. 1990. “The Implications of Spillovers for R&D
Investment and Welfare: A New Perspective.” Administrative Science Quarterly 35:
128–152.
Cohen, W. M., R. R. Nelson, and J. P. Walsh. 2000. Protecting Their Intellectual Assets.
Working paper, National Bureau of Economic Research.
Coller, M., and T. L. Yohn. 1998. “Management Forecasts: What Do We Know?”
Financial Analysts Journal 54, no. 1: 58–62.
Connell, J. L., and L. B. Shafer. 1989. Structured Rapid Prototyping. Prentice-Hall.
Conner, K. R., and C. K. Prahalad. 1996. “A Resource-Based Theory of the Firm:
Knowledge versus Opportunism.” Organization Science 7, no. 5: 477–501.
Cook, T. D., and D. T. Campbell. 1979. Quasi-Experimentation. Houghton Mifflin.
Csikszentmihalyi, M. 1975. Beyond Boredom and Anxiety. Jossey-Bass.
Csikszentmihalyi, M. 1990. Flow. Harper and Row.
Csikszentmihalyi, M. 1996. Creativity. HarperCollins.
Dam, K. W. 1995. “Some Economic Considerations in the Intellectual Property
Protection of Software.” Journal of Legal Studies 24, no. 2: 321–377.
Danneels, Erwin. 2004. “Disruptive Technology Reconsidered: A Critique and
Research Agenda.” Journal of Product Innovation Management 21: 246–258.
Dasgupta, P., and P. A. David. 1994. “Toward a New Economics of Science.” Policy
Research 23: 487–521.
David, P. A. 1992. “Knowledge, Property, and the System Dynamics of Technological
Change.” Proceedings of the World Bank Annual Conference on Development Economics
1992: 215–247.
David, P. A. 1998. Knowledge Spillovers, Technology Transfers, and the Economic
Rationale for Public Support of Exploratory Research in Science. Background paper
for European Committee for Future Accelerators.
de Fraja, G. 1993. “Strategic Spillovers in Patent Races.” International Journal of
Industrial Organization 11, no. 1: 139–146.
Bibliography 185
Dellarocas, C., N. F. Awad, and X. (M. ) Zhang. 2004. Exploring the Value of Online
Reviews to Organizations. Working paper, MIT Sloan School of Management.
Duke, R. 1988. Local Building Codes and the Use of Cost-Saving Methods. US Federal
Trade Commission, Bureau of Economics.
Efron, B. 1979. “Bootstrap Methods: Another Look at the Jackknife.” Annals of
Statistics 7: 1–26.
Ehrenkrantz Group. 1979. A Study of Existing Processes for the Introduction of New
Products and Technology in the Building Industry. US Institute of Building Sciences.
Elrod, T., and A. P. Kelman. 1987. Reliability of New Product Evaluation as of 1968
and 1981. Working paper, Owen Graduate School of Management, Vanderbilt
University.
Enos, J. L. 1962. Petroleum Progress and Profits. MIT Press.
Fleming, L. 2001. “Recombinant Uncertainty in Technological Search.” Management
Science 47, no. 1: 117–132.
Foray, D. 2004. Economics of Knowledge. MIT Press.
Franke, N., and H. Reisinger. 2003. Remaining within Cluster Variance. Working
paper, Vienna Business University.
Franke, N., and S. Shah. 2003. “How Communities Support Innovative Activities: An
Exploration of Assistance and Sharing Among End-Users.” Research Policy 32, no. 1:
157–178.
Franke, N., and E. von Hippel. 2003a. Finding Commercially Attractive User
Innovations. Working paper, MIT Sloan School of Management.
Franke, N., and E. von Hippel. 2003b. “Satisfying Heterogeneous User Needs via
Innovation Toolkits: The Case of Apache Security Software.” Research Policy 32, no. 7:
1199–1215.
Freeman, C. 1968. “Chemical Process Plant: Innovation and the World Market.”
National Institute Economic Review 45, August: 29–57.
Friedman, D., and D. McAdam. 1992. “Collective Identity and Activism: Networks,
Choices, and the Life of a Social Movement.” In A. D. Morris and C. McClurg, eds.,
Frontiers in Social Movement Theory. Yale University Press.
Gallini, N., and S. Scotchmer. 2002. “Intellectual Property: When Is It the Best
Incentive System?” In A. Jaffe, J. Lerner, and S. Stern, eds., Innovation Policy and the
Economy, volume 2. MIT Press.
Green, P. E. 1971. “A New Approach to Market Segmentation.” Business Horizons 20,
February: 61–73.
186 Bibliography
Green, P. E., and C. M. Schaffer. 1998. “Cluster-Based Market Segmentation: Some
Further Comparisons of Alternative Approaches.” Journal of the Market Research Society
40, no. 2: 155–163.
Hall, B. H., and R. Ham Ziedonis. 2001. “The Patent Paradox Revisited: An Empirical
Study of Patenting in the US Semiconductor Industry, 1979–1995.” RAND Journal of
Economics 32, no. 1: 101–128.
Hall, B. H., and D. Harhoff. 2004. “Post-Grant Reviews in the US Patent System:
Design Choices and Expected Impact.” Berkeley Law Technology Journal, in press.
Harhoff, D. 1996. “Strategic Spillovers and Incentives for Research and
Development.” Management Science 42, no. 6: 907–925.
Harhoff, D., J. Henkel, and E. von Hippel. 2003. “Profiting from Voluntary
Information Spillovers: How Users Benefit by Freely Revealing Their Innovations.”
Research Policy 32, no. 10: 1753–1769.
Hecker, F. 1999. “Setting Up Shop: The Business of Open Source Software.” IEEE
Software 16, no. 1: 45–51.
Heller, M. A. 1998. “The Tragedy of the Anticommons: Property in the Transition
from Marx to Markets.” Harvard Law Review 111: 621–688.
Heller, M. A., and R. S. Eisenberg. 1998. “Can Patents Deter Innovation? The
Anticommons in Biomedical Research.” Science Magazine 280 (5364): 698–701.
Henkel, J. 2003. “Software Development in Embedded Linux: Informal Collaboration
of Competing Firms.” In W. Uhr, W. Esswein, and E. Schoop, eds., Proceedings der 6.
Internationalen Tagung Wirtschaftsinformatik 2003, volume 2. Physica.
Henkel, J. 2004a. The Jukebox Mode of Innovation. Discussion paper, CEPR.
Henkel, J. 2004b. Patterns of Free Revealing. Working paper, University of Munich.
Henkel, J., and S. Thies. 2003. “Customization and Innovation: User Innovation
Toolkits for Simulator Software.” In Proceedings of the 2003 Congress on Mass
Customization and Personalization (MCPC 2003), Munich.
Henkel, J., and E. von Hippel. 2005. “Welfare Implications of User Innovation.”
Journal of Technology Transfer 30, no. 1/2: 73–87.
Herstatt, C., and E. von Hippel. 1992. “From Experience: Developing New Product
Concepts via the Lead User Method.” Journal of Product Innovation Management 9, no.
3: 213–222.
Hertel, G., S. Niedner, and S. Herrmann. 2003. “Motivation of Software Developers in
Open Source Projects: An Internet-Based Survey of Contributors to the Linux Kernel.”
Research Policy 32, no. 7: 1159–1177.
Bibliography 187
Hienerth, C. 2004. “The Commercialization of User Innovations: Sixteen Cases in an
Extreme Sporting Industry.” In Proceedings of the 26th R&D Management
Conference, Sesimbra, Portugal.
Hirschleifer, J. 1971. “The Private and Social Value of Information and the Reward to
Inventive Activity.” American Economic Review 61, no. 4: 561–574.
Hollander, S. 1965. The Sources of Increased Efficiency. MIT Press.
Horwich, M. 1982. Clipped Wings. MIT Press.
Hunt, R. M., and J. Bessen. 2004. “The Software Patent Experiment.” Business Review,
Federal Reserve Bank of Philadelphia Q3: 22–32.
Jensen, M. C., and W. H. Meckling. 1976. “Theory of the Firm: Managerial Behavior,
Agency Costs, and Ownership Structure.” Journal of Financial Economics 3, no. 4:
305–360.
Jeppesen, L. B. 2004. Profiting from Innovative User Communities. Working paper,
Department of Industrial Economics and Strategy, Copenhagen Business School.
Jeppesen, L. B. 2005. “User Toolkits for Innovation: Users Support Each Other.”
Journal of Product Innovation Management, forthcoming.
Jeppesen, L. B., and M. J. Molin. 2003. “Consumers as Co-developers: Learning and
Innovation Outside the Firm.” Technology Analysis and Strategic Management 15, no. 3:
363–84.
Jokisch, M. 2001. Open Source Software-Entwicklung: Eine Analyse des
Geschäftsmodells der STATA Corp. Master’s thesis, University of Munich.
Ketchen, D. J., Jr., and C. L. Shook. 1996. “The Application of Cluster Analysis in
Strategic Management Research: An Analysis and Critique.” Strategic Management
Journal 17, no. 6: 441–459.
Knight, K. E. 1963. A Study of Technological Innovation: The Evolution of Digital
Computers. PhD dissertation, Carnegie Institute of Technology.
Kollock, P. 1999. “The Economies of Online Cooperation: Gifts and Public Goods in
Cyberspace.” In M. A. Smith and P. Kollock, eds., Communities in Cyberspace.
Routledge.
Kotabe, M. 1995. “The Return of 7-Eleven . . . from Japan: The Vanguard Program.”
Columbia Journal of World Business 30, no. 4: 70–81.
Kristensen, P. S. 1992. “Flying Prototypes: Production Departments’ Direct
Interaction with External Customers.” International Journal of Operations and
Production Management 12, no. 2: 195–211.
Lakhani, K. 2005. Distributed Coordination Practices in Free and Open Source
Communities. PhD thesis, Massachusetts Institute of Technology.
188 Bibliography
Lakhani, K. R., and E. von Hippel. 2003. “How Open Source Software Works: ‘Free’
User-to-User Assistance.” Research Policy 32, no. 6: 923–943.
Lakhani, K. R., and B. Wolf. 2005. “Why Hackers Do What They Do: Understanding
Motivation and Effort in Free/Open Source Software Projects.” In J. Feller, B.
Fitzgerald, S. Hissam, and K. R. Lakhani, eds., Perspectives on Free and Open Source
Software. MIT Press.
Lerner, J., and J. Tirole. 2002. “Some Simple Economics of Open Source.” Journal of
Industrial Economics 50, no. 2: 197–234.
Lessig, L. 2001. The Future of Ideas. Random House.
Lettl, C., C. Herstatt and H. Gemünden. 2004. The Entrepreneurial Role of Innovative
Users. Working paper, Technical University, Berlin.
Levin, R. C., A. Klevorick, R. R. Nelson, and S. G. Winter. 1987. “Appropriating the
Returns from Industrial Research and Development.” Brookings Papers on Economic
Activity 3: 783–820.
Levy, S. 1984. Hackers. Doubleday.
Lilien, G. L., P. D. Morrison, K. Searls, M. Sonnack, and E. von Hippel. 2002.
“Performance Assessment of the Lead User Idea-Generation Process for New Product
Development.” Management Science 48, no. 8: 1042–1059.
Lim, K. 2000. The Many Faces of Absorptive Capacity. Working paper, MIT Sloan
School of Management.
Lindsey, G., and G. Knaap. 1999. “Willingness to Pay for Urban Greenway Projects.”
Journal of the American Planning Association 65, no. 3: 297–313.
Loomis, J., T. Brown, B. Lucero, and G. Peterson. 1996. “Improving Validity Exper-
iments of Contingent Valuation Methods: Results of Efforts to Reduce the Disparity
of Hypothetical and Actual Willingness to Pay.” Land Economics 72, no. 4: 450–461.
Lüthje, C. 2003. “Customers as Co-Inventors: An Empirical Analysis of the
Antecedents of Customer-Driven Innovations in the Field of Medical Equipment.” In
Proceedings of the 32th EMAC Conference, Glasgow.
Lüthje, C. 2004. “Characteristics of Innovating Users in a Consumer Goods Field: An
Empirical Study of Sport-Related Product Consumers.” Technovation 24, no. 9:
683–695.
Lüthje, C., C. Herstatt, and E. von Hippel. 2002. The Dominant Role of Local
Information in User Innovation: The Case of Mountain Biking. Working Paper, MIT
Sloan School of Management.
Machlup, F. 1962. Knowledge Production and Distribution in the United States. Princeton
University Press.
Bibliography 189
Mansfield, E. 1968. Industrial Research and Technological Innovation. Norton.
Mansfield, E. 1985. “How Rapidly Does New Industrial Technology Leak Out?”
Journal of Industrial Economics 34: 217–223.
Mansfield, E., J. Rapoport, A. Romeo, S. Wagner and G. Beardsley. 1977. “Social and
Private Rates of Return from Industrial Innovations.” Quarterly Journal of Economics
91, no. 2: 221–240.
Mansfield, E., A. Romeo, M. Schwartz, D. Teece, S. Wagner and P. Brach. 1982.
Technology Transfer, Productivity, and Economic Policy. Norton.
Mansfield, E., and S. Wagner. 1975. “Organizational and Strategic Factors Associated
With Probabilities of Success in Industrial R&D.” Journal of Business 48, no. 2:
179–198.
Marples, D. L. 1961. “The Decisions of Engineering Design.” IRE Transactions on
Engineering Management, June: 55–71.
Martin, J. 1991. Rapid Application Development. Macmillan.
Matthews, J. 1985. Public Access to Online Catalogs, second edition. Neal-Schuman.
Maurer, S. 2005. “Inside the Anticommons: Academic Scientists’ Struggle to
Commercialize Human Mutations Data, 1999–2001.” Research Policy, forthcoming.
Mead, C., and L. Conway. 1980. Introduction to VLSI Systems. Addison-Wesley.
Means, R. S. 1989. Building Construction Cost Data 1989. R. S. Means.
Merges, R., and R. R. Nelson. 1990. “On the Complex Economics of Patent Scope.”
Columbia Law Review 90: 839–916.
Merton, R. K. 1973. The Sociology of Science. University of Chicago Press.
Meyer, M. H., and L. Lopez. 1995. “Technology Strategy in a Software Products
Company.” Journal of Product Innovation Management 12, no. 4: 194–306.
Milligan, G. W., and M. C. Cooper. 1985. “An Examination of Procedures for
Determining the Number of Clusters in a Data Set.” Psychometrica 45: 159–179.
Mishina, K. 1989. Essays on Technological Evolution. PhD thesis, Harvard University.
Mitchell, R. C., and R. T. Carson. 1989. Using Surveys to Value Public Goods. Resources
for the Future.
Moerke, K. A. 2000. “Free Speech to a Machine.” Minnesota Law Review 84, no. 4:
1007–1008.
Mollick, E. 2004. Innovations from the Underground: Towards a Theory of Parasitic
Innovation. Master’s thesis, Massachusetts Institute of Technology.
Mountain Bike. 1996. Mountain Biking Skills. Rodale.
190 Bibliography
Morrison, P. D., J. H. Roberts, and D. F. Midgley. 2004. “The Nature of Lead Users and
Measurement of Leading Edge Status.” Research Policy 33, no. 2: 351–362.
Morrison, P. D., J. H. Roberts, and E. von Hippel. 2000. “Determinants of User
Innovation and Innovation Sharing in a Local Market.” Management Science 46, no.
12: 1513–1527.
Muñiz, A. M., Jr., and T. C. O’Guinn. 2001. “Brand Community.” Journal of Consumer
Research 27: 412–432.
Muñiz, A. M., Jr., and H. J. Schau. 2004. When the Consumer Becomes the Marketer.
Working paper, DePaul University.
Myers, J. H. 1996. Segmentation and Positioning for Strategic Marketing Decisions.
American Marketing Association.
National Sporting Goods Association. 2002. Sporting Goods Market in 2001.
Neil, H., R. Cummings, P. Ganderton, G. Harrison, and G. McGuckin. 1994.
“Hypothetical Surveys and Real Economic Commitments.” Land Economics 70:
145–154.
Nelson, R. R. 1982. “The Role of Knowledge in R&D Efficiency.” Quarterly Journal of
Economics 97, no. 3: 453–470.
Nelson, R. R. 1990. What Is Public and What Is Private About Technology? Working
paper, Consortium on Competitiveness and Cooperation, University of California,
Berkeley.
Nelson, R. R. 1993. National Innovation Systems: A Comparative Analysis. Oxford
University Press.
Nuvolari, A. 2004. “Collective Invention during the British Industrial Revolution:
The Case of the Cornish Pumping Engine.” Cambridge Journal of Economics 28, no. 3:
347–363.
Ogawa, S. 1998. “Does Sticky Information Affect the Locus of Innovation? Evidence
from the Japanese Convenience-Store Industry.” Research Policy 26, no. 7–8: 777–790.
Oliver, P. E. 1980. “Rewards and Punishment as Selective Incentives for Collective
Action: Theoretical Investigations.” American Journal of Sociology 85: 1356–1375.
Oliver, P. E., and G. Marwell. 1988. “The Paradox of Group Size in Collective Action:
A Theory of the Critical Mass II.” American Sociological Review 53, no. 1: 1–18.
Olson, E. L., and G. Bakke. 2001. “Implementing the Lead User Method in a High
Technology Firm: A Longitudinal Study of Intentions versus Actions.” Journal of
Product Innovation Management 18, no. 2: 388–395.
Olson, M. 1967. The Logic of Collective Action. Harvard University Press.
Bibliography 191
O’Mahony, S. 2003. “Guarding the Commons: How Open Source Contributors
Protect Their Work.” Research Policy 32, no. 7: 1179–1198.
Ostrom, E. 1998. “A Behavioral Approach to the Rational Choice Theory of Collective
Action.” American Political Science Review 92, no. 1: 1–22.
Pavitt, K. 1984. “Sectoral Patterns of Technical Change: Towards a Taxonomy and a
Theory.” Research Policy 13 (6): 343–373.
Penning, C. 1998. Bike History. Delius & Klasing.
Perens, B. 1999. “The Open Source Definition.” In C. DiBona, S. Ockman, and M.
Stone, eds., Opensources. O’Reilly.
Pinch, T., and R. Kline. 1996. “Users as Agents of Technological Change. The Social
Construction of the Automobile in Rural America.” Technology and Culture 37:
763–795.
Pinch, T. J., and W. E. Bijker. 1987. “The Social Construction of Facts and Artifacts.”
In W. Bijker, T. Hughes, and T. Pinch, eds., The Social Construction of Technological
Systems. The MIT Press.
Pine, J. B. II. 1993. Mass Customization. Harvard Business School Press.
Polanyi, M. 1958. Personal Knowledge. University of Chicago Press.
Poolton, J., and I. Barclay. 1998. “New Product Development: From Past Research to
Future Applications.” Industrial Marketing Management 27: 197–212.
Porter, M. E. 1991. Competitive Advantage of Nations. Free Press.
Prügl, R., and N. Franke. 2005. Factors Impacting the Success of Toolkits for User
Innovation and Design. Working paper, Vienna University of Economics.
Punj, G., and D. W. Stewart. 1983. “Cluster Analysis in Marketing Research: Review
and Suggestions for Application.” Journal of Marketing Research 20, May: 134–148.
Raymond, E., ed. 1996. The New Hacker’s Dictionary, third edition. MIT Press.
Raymond, E. 1999. The Cathedral and the Bazaar. O’Reilly.
Redmond, W. H. 1995. “An Ecological Perspective on New Product Failure: The
Effects of Competitive Overcrowding.” Journal of Product Innovation Management 12:
200–213.
Riggs, W., and E. von Hippel. 1994. “Incentives to Innovate and the Sources of
Innovation: The Case of Scientific Instruments.” Research Policy 23, no. 4: 459–469.
Rogers, E. M. 1994. Diffusion of Innovation, fourth edition. Free Press.
Rosenberg, N. 1976. Perspectives on Technology. Cambridge University Press.
Rosenberg, N. 1982. Inside the Black Box. Cambridge University Press.
192 Bibliography
Rothwell, R., C. Freeman, A. Horsley, V. T. P. Jervis, A. B. Roberts, and J. Townsend.
1974. “SAPPHO Updated: Project SAPPHO Phase II.” Research Policy 3, no. 3: 258–291.
Saloner, G., and W. E. Steinmueller. 1996. Demand for Computer Products and
Services in Large European Organizations. Research paper, Stanford Graduate School
of Business.
Sattler, H. 2003. “Appropriability of Product Innovations: An Empirical Analysis for
Germany.” International Journal of Technology Management 26, no. 5–6: S. 502–516.
Schmookler, J. 1966. Invention and Economic Growth. Harvard University Press.
Schrage, M. 2000. Serious Play. Harvard Business School Press.
Schreier, M., and N. Franke. 2004. Value Creation by Self-Design. Working paper,
Vienna University of Economics.
Seip, K., and J. Strand. 1992. “Willingness to Pay for Environmental Goods in
Norway: A Contingent Valuation Study with Real Payment.” Environmental and
Resource Economics 2: 91–106.
Shah, S. 2000. Sources and Patterns of Innovation in a Consumer Products Field.
Working paper, MIT Sloan School of Management.
Shah, S., and M. Tripsas. 2004. When Do User-Innovators Start Firms? Working paper,
University of Illinois.
Shapiro, C. 2001. “Navigating the Patent Thicket: Cross Licenses, Patent Pools, and
Standard Setting.” In A. Jaffe, J. Lerner, and S. Stern, eds., Innovation Policy and the
Economy, volume 1. MIT Press.
Simon, E. 1996. “Innovation and Intellectual Property Protection: The Software
Industry Perspective.” Columbia Journal of World Business 31, no. 1: 30–37.
Slater, Stanley F., and Narver, John C. 1998. “Customer-Led and Market-Oriented:
Let’s Not Confuse the Two.” Strategic Management Journal 19, no. 1:1001–1006.
Slaughter, S. 1993. “Innovation and Learning during Implementation: A Comparison
of User and Manufacturer Innovations.” Research Policy 22, no. 1: 81–95.
Smith, A. 1776. An Inquiry into the Nature and Causes of the Wealth of Nations. Modern
Library edition. Random House, 1937.
Spence, M. 1976. “Product Differentiation and Welfare.” American Economic Review
66, no. 2, Papers and Proceedings: 407–414.
Taylor, C. T., and Z. A. Silberston. 1973. The Economic Impact of the Patent System.
Cambridge University Press.
Taylor, M., and S. Singleton. 1993. “The Communal Resource: Transaction Costs and
the Solution of Collective Action Problems.” Politics and Society 21, no. 2: 195–215.
Bibliography 193
Tedd, L. A. 1994. “OPACs through the Ages.” Library Review 43, no. 4: 27–37.
Teece, D. J. 1977. “Technology Transfer by Multinational Firms: The Resource Cost of
Transferring Technological Know-How.” Economic Journal 87: 242–261.
Thomke, S. H. 1998. “Managing Experimentation in the Design of New Products.”
Management Science 44, no. 6: 743–762.
Thomke, S. H. 2003. Experimentation Matters. Harvard Business School Press.
Thomke, S. H., and E. von Hippel. 2002. “Customers as Innovators: A New Way to
Create Value.” Harvard Business Review 80, no. 4: 74–81.
Thomke, S. H., E. von Hippel, and R. Franke. 1998. “Modes of Experimentation: An
Innovation Process—and Competitive—Variable.” Research Policy 27, no. 3: 315–332.
Tirole, J. 1988. The Theory of Industrial Organization. MIT Press.
Tull, D. 1967. “The Relationship of Actual and Predicted Sales and Profits in New
Product Introductions.” Journal of Business 40: 233–250.
Tyre, M., and E. von Hippel. 1997. “Locating Adaptive Learning: The Situated Nature
of Adaptive Learning in Organizations.” Organization Science 8, no. 1: 71–83.
Urban, G. L., and E. von Hippel. 1988. “Lead User Analyses for the Development of
New Industrial Products.” Management Science 34, no. 5: 569–82.
Utterback, J. M., and W. J. Abernathy. 1975. “A Dynamic Model of Process and
Product Innovation.” Omega 3, no. 6: 639–656.
van der Plas, R., and C. Kelly. 1998. The Original Mountain Bike Book. MBI.
Varian, H. R. 2002. “New Chips Can Keep a Tight Rein on Consumers.” New York
Times, July 4.
von Hippel, E. 1976. “The Dominant Role of Users in the Scientific Instrument
Innovation Process.” Research Policy 5, no. 3: 212–39.
von Hippel, E. 1977. “Transferring Process Equipment Innovations from User-
Innovators to Equipment Manufacturing Firms.” R&D Management 8, no. 1:13–22.
von Hippel, E. 1986. “Lead Users: A Source of Novel Product Concepts.” Management
Science 32, no. 7: 791–805.
von Hippel, E. 1988. The Sources of Innovation. Oxford University Press.
von Hippel, E. 1994. “Sticky Information and the Locus of Problem Solving:
Implications for Innovation.” Management Science 40, no. 4: 429–439.
von Hippel, E. 1998. “Economics of Product Development by Users: The Impact of
Sticky Local Information.” Management Science 44, no. 5: 629–644.
194 Bibliography
von Hippel, E. 2001. “Perspective: User Toolkits for Innovation.” Journal of Product
Innovation Management 18: 247–257.
von Hippel, E., and S. N. Finkelstein. 1979. “Analysis of Innovation in Automated
Clinical Chemistry Analyzers.” Science and Public Policy 6, no. 1: 24–37.
von Hippel, E., N. Franke, and R. Prügl. 2005. Screening vs. Pyramiding. Working
paper, MIT Sloan School of Management.
von Hippel, E., and R. Katz. 2002. “Shifting Innovation to Users via Toolkits.”
Management Science 48, no. 7: 821–833.
von Hippel, E., S. H. Thomke, and M. Sonnack. 1999. “Creating Breakthroughs at
3M.” Harvard Business Review 77, no. 5: 47–57.
von Hippel, E., and M. Tyre. 1995. “How ‘Learning by Doing’ is Done: Problem
Identification in Novel Process Equipment.” Research Policy 24, no. 1: 1–12.
von Hippel, E., and G. von Krogh. 2003. “Open Source Software and the “Private-
Collective” Innovation Model: Issues for Organization Science.” Organization Science
14, no. 2: 209–223.
von Krogh, G., and S. Spaeth. 2002. Joining, Specialization, and Innovation in Open
Source Software Development. Working paper, University of St. Gallen.
von Krogh, G., S. Haefliger and S. Spaeth. 2004. The Practice of Knowledge Reuse in
Open Source Software. Working paper, University of St. Gallen.
Wellman, B., J. Boase, and W. Chen. 2002. The Networked Nature of Community On
and Off the Internet. Working paper, Centre for Urban and Community Studies,
University of Toronto.
Wenger, E. 1998. Communities of Practice. Cambridge University Press.
Wayner, P. 2000. Free for All. Harper Business.
Weber, S. 2004. The Success of Open Source. Harvard University Press.
Willis, K. G., and N. A. Powe. 1998. “Contingent Valuation and Real Economic
Commitments: A Private Good Experiment.” Journal of Environmental Planning and
Management 41, no. 5: 611–619.
Wind, Y. 1978. “Issues and Advances in Segmentation Research.” Journal of Marketing
Research 15, August: 317–337.
Winter, S. G., and G. Szulanski. 2001. “Replication as Strategy.” Organization Science
12, no. 6: 730–743.
Young, G., K. G. Smith, and C. M. Grimm. 1996. “Austrian and Industrial
Organization Perspectives on Firm Level Competitive Activity and Performance.”
Organization Science 7, no. 3: 243–254.
Bibliography 195


Index
Abernathy, W., 177
Achilladelis, B., 108
Agency costs, 6, 46–50
Aghion, P., 48
Allen, R., 10, 78, 83, 86
Allen, T., 63
Amabile, T., 61
Antelman, K., 89
Antorini, Y., 174
Apache web server software, 5, 6,19, 23,
38–42, 82, 83, 101, 102
Arora, A., 70, 84
Arrow, K., 89
Arundel, A., 84
Awad, N., 167
Balachandra, R., 108
Baldwin, C., 56–60, 94
Bakke, G., 144
Barclay, I., 108
Barnes, B., 50
Baron, J., 63
Behlendorf, B., 126
Benkler, Y., 12, 115
Berners-Lee, T., 145
Bessen, J., 48, 114
Bijker, W., 17, 135, 172, 173
Boldrin, M., 115
Brand communities, 174
Bresnahan, T., 118, 119, 182
Brooks, F., 94
Brown, J., 174
Buenstorf, G., 73
Campbell, D., 137
Carson, R., 40
Chamberlin, E., 110
Christensen, C., 144
Churchill, J., 135
Clark, K., 59, 94
Coase, R., 57, 58
Cohen, W., 68, 84
Connell, J., 150
Conner, K., 99
Consumers, 19
Contracting, 48
Conway, C., 152
Cook, T., 137
Copyrights. See Intellectual property
rights
Csikszentmihalyi, M., 61
Custom products
agency costs and, 6
Apache web server software and, 38–41
heterogeneity of user needs and, 5, 6,
33–43, 74, 93, 126, 162
innovation and, 127, 128
manufacturers and, 6, 14, 15, 51, 52,
117, 18, 127, 128, 145–164
market segmentation and, 37
product platforms and, 14, 15,
128–130, 172
Custom products (cont.)
suppliers and, 127, 128
toolkits and, 14, 15, 147–164
users and, 6, 7, 14, 15, 33–45, 121,
127, 128, 145, 172
Dam, K., 89
Danneels, E., 145
Dasgupta, P., 168
David, P., 168
de Fraja, G., 87
Dellarocas, C., 167
Digital Millennium Copyright Act, 12,
117, 118
Duguid, P., 174
Duke, R., 56
Economic benefit, expectations of
by lead users, 4, 5, 22, 23, 31
by manufacturers, 2–4, 6–10, 51, 52,
56, 128
by users, 1–11, 51, 52, 56, 128
Ehrenkrantz Group, 56
Eisenberg, R., 113, 114
Elrod, T., 108
Enos, J., 22,
Ettrich, M., 116
Fetchmail, 102, 103
Finkelstein, S., 10, 79, 136
Fleming, L., 94
Foray, D., 17, 76, 113, 168, 169
Fosfuri, A., 84
Franke, N., 4–6, 10, 11, 20, 23, 27–30,
37–42, 66, 79, 80, 103, 105, 135, 161,
162, 180
Freeman, C., 22, 108
Free revealing of innovation informa-
tion, 78
case for, 9, 10, 80, 81
collective action model for, 11, 13,
89–91
collective invention and, 78, 79, 83
copyright protection and, 85, 89
evidence of, 9, 10, 77–80, 83
government policy and, 119
in information communities, 9, 10, 13,
106, 166, 168
innovation and, 124–126, 129
incentives for, 85–88
and information diffusion, 81–83
intellectual property rights and, 9, 10,
13, 110–113, 129
lead users and, 109–121
and library information search system,
79
manufacturers and, 9, 11, 80
and open source software, 9–11, 80,
86, 87, 90
and patent protection, 83–86, 89
private-collective model for, 11, 90, 91,
106
reuse and, 88, 89
and sports equipment, 79, 80
social welfare and, 110, 111, 119
trade secrecy and, 89
users and, 9, 10, 13, 17, 77–91, 109, 124
Free software, 8, 11, 93, 96–99. See also
Open source software
Friar, J., 108
Friedman, D., 90
Gallini, N., 113
Gambardella, A., 70, 84
Gemunden, H., 127, 176
General Electric, 130
Goto, A., 84
Government policy, 2, 107–119. See also
Digital Millennium Copyright Act
copyrights and, 12, 114, 115
distribution channels and, 118
free revealing and, 110–113, 129
intellectual commons and, 113–117
intellectual property rights and,
111–117, 129, 131
licensing and, 12
198 Index
manufacturer innovation and, 2, 107,
108, 117–119
and national competitive advantage,
170–172
patents and, 12, 111–114
patent thickets and, 12, 114
provisioning biases and, 110, 111
R&D subsidies and, 118, 119
and social welfare, 2, 11–13, 107–113,
117–119
trade secrets and, 10, 111, 117, 129
user innovation and, 2, 11–13,
107–111, 114–119
Green, P., 37
Greenstein, S., 118, 119, 182
Griffith, S., 103, 104, 125
Grimm, C., 99
Gum, E., 159–161
Hackers, 8, 98, 99, 181
Hall, B., 84, 114
Hanson, C., 116, 124
Harhoff, D., 77, 80, 81, 84, 87, 88
Harsh, M., 130
Hecker, F., 126
Heller, M., 113, 114
Henkel, J., 10, 11, 77, 80, 81, 84, 87, 88,
94, 107, 110, 111, 129
Herrmann, S., 8, 60
Herstatt, C., 20, 35–37, 72–75, 127, 143,
144, 176
Hertel, G., 8, 60
Hienerth, C., 127, 176
Hirschleifer, J., 86
Hollander, S., 21
Honscheid, J., 1
Horgan, M., 1
Horwich, M., 173
Hunt, R., 114
IBM, 79, 130
Information asymmetries, 8, 9, 48,
66–74, 109, 148–151
Information commons, 1, 13, 17,
77–81, 85–88, 95, 96, 165–168,
172–174. See also Information com-
munities; Innovation communities
Information communities, 17, 165–168.
See also Innovation communities
Innovation. See also Innovation com-
munities
attractiveness of, 4, 5
distributed process of, 9, 10, 93–95,
145, 146
economic benefit of. See Economic
benefit
functional sources of, 3, 8, 94, 95, 145,
146
and government policy, 107–119
lead users and. See Lead users
manufacturers and. See Manufacturers
suppliers and. See Suppliers
users and. See Users
Innovation communities, 7, 10, 11, 14,
17, 93–106, 116, 126, 129, 131, 166.
See also Information communities
Apache web server software and, 101
brand and, 174
fetchmail and, 101, 102
innovation and, 93–106
kitesurfing and, 14, 103, 104
open source software and, 11, 14,
96–102, 113, 124, 126, 129, 131, 172,
181
physical products and, 11, 14,
103–105
and social welfare, 7
sociology of, 172–174
and sources of innovation, 11, 17, 94,
95, 129, 131
and sporting equipment, 11, 27–30,
103, 104
user-to-user assistance and, 105, 106
Innovation process, 7, 8, 31, 45, 60, 61,
123, 124
Intellectual commons, 115–117
Index 199
Intellectual property rights. See also
Private-collective innovation
copyrights and, 10, 12, 81, 85, 89, 114,
115
free revealing and, 9, 10, 13, 77–91,
110–113, 129
information communities and, 13, 17,
168, 170
innovation and, 2, 3, 17, 170
intellectual commons and, 115–117
licensing of, 10, 12, 85, 98, 115, 116,
170
open source software and, 9, 10, 170
patent thickets and, 12, 114
patents and, 10, 12, 83–86, 89, 111–
114
trade secrets and, 10, 81, 89, 111, 117,
129
Jensen, M., 6, 46
Jeppesen, L., 105, 111, 129, 130, 148
Jervis, V., 108
Jokisch, M., 129
Katz, R., 151
Kelly, C., 72
Kelman, A., 108
Kitesurfing, 14, 93, 103, 104, 124–126,
172
Kline, R., 173, 174
Knight, K., 21
Knowledge, production and distribution
of, 17, 168–170
Kollack, P., 126
Kotabe, M., 72
Kristensen, P., 149
Lakhani, K., 8, 60, 61, 82, 83, 87, 106,
166
Lead users, 4, 5, 15–31, 133–146
Apache web server software and, 20,
23, 38–41
characteristics of, 4, 5, 134
commercial attractiveness of, 4, 5, 24,
26, 28
economic benefit, expectations of, 4,
5, 22, 23, 31
idea generation and, 15, 16, 133,
136–146
identification of, 4, 5, 15, 16, 133–142
innovation and, 4, 5, 15, 16, 19–31,
121, 127, 133–146
library information search system and,
4, 20, 23–27, 34, 35, 79
manufacturers and, 27, 127, 133–136,
144–146
market research methodologies and,
133, 137, 138, 139, 142
mountain biking and, 20, 35–37
outdoor consumer products and, 20, 21
pipe hanger hardware and, 20, 143,
144
printed circuit CAD software and, 20,
23, 24, 142, 143, 172
pyramiding and, 135, 136
sporting equipment and, 19, 27–30,
127
StataCorp statistical software and, 136
surgical equipment and, 20, 30, 127
theory of, 22, 23
3M and, 15, 16, 133, 136–143
toolkits and, 163
Lerner, J., 86
Lessig, L., 13, 115, 118
Lettl, C., 127, 176
Levin, R., 84
Levine, D., 115
Levinthal, D., 68
Levy, S., 97, 151
Library information search system, 10,
20, 23–27, 34, 35, 79
Licensing. See Intellectual property
rights
Lilien, G., 16, 136–143
Linux, 116, 124, 131, 181
Lim, K., 10, 79
200 Index
Local information, 8, 9, 31, 66–76, 94
Lopez, L., 99
Lüthje, C., 20, 21, 30, 35–37, 72–75
Machlup, F., 169
Mansfield, E., 23, 67, 82–84, 107, 108, 118
Manufacturers
agency costs and, 46–50
characteristics of, 3
custom products and, 6, 14, 15, 33
innovation and, 13–15, 121–131,
147–164
dimensions-of-merit product improve-
ments and, 146
expectations of economic benefit by,
2–9, 33, 51–52, 56
free revealing and, 9, 10, 80
government policy and, 2, 107, 108,
117–119
information asymmetries of, 8, 9,
70–72
innovation and, 1–3, 6–9, 14–17, 27,
33, 37, 45, 49–52, 56, 70–76,
107–119, 133, 136, 147–164, 174
lead users and, 4, 5, 27, 127, 133–136,
144–146
national competitive advantage and,
170–172
social welfare and, 7–13
transaction costs and, 55–57
innovate-or-buy decisions and, 6, 7
Marketing research, 15, 16, 37, 133,
134, 167
Marples, D., 63
Martin, J., 150
Marwell, G., 90
Mathews, J., 25
Maurer, S., 115
McAdam, D., 90
McCool, Rob, 101
Mead, L., 152
Means, R., 56
Meckling, W., 6, 46
Merges, Robert, 113, 114
Merton, Robert, 168
Meyer, M., 99
Microsoft, 13, 128, 151
Midgely, David, 23, 179
Mishina, K., 79
MIT Artificial Intelligence Laboratory,
97, 98
Mitchell, R., 40
Molin, M., 129
Mollick, Ethan, 131
Morrison, Pamela, 4, 10, 20, 23–27, 34,
35, 79, 136–143, 179
Mountain biking, 20, 34–37, 72–75, 94
Muniz, A., 174
Nagata, A., 84
Narver, J., 144
National competitive advantage,
170–172. See also Government policy
Nelson, R., 68, 84, 113, 114, 170
Niedner, S., 8, 60
Nuvolari, A., 10, 78, 79
Ogawa, S., 8, 71, 72, 108
O’Guinn, T., 174
Oliver, P., 90
Olson, E., 144
Olson, M., 89, 90
Open source software. See also Free soft-
ware
communities and, 172, 174
innovation and, 97–102, 126, 129–132
free revealing and, 9–11, 80, 86, 87
innovation communities and, 11, 93,
96–102, 111, 113, 124, 126, 129–132,
172, 181
intellectual commons and, 115–117
intellectual property rights and, 9, 10,
115–117
knowledge and, 169, 170
Ostrom, E., 90
Outdoor products, 20, 21
Index 201
Patents. See Intellectual property rights
Pavitt, K., 22
Penning, C., 73
Perens, B., 98
Pinch, T., 17, 172–174
Pine, J., 163
Pipe hanger hardware, 20, 142, 143
Polanyi, M., 67, 68
Poolton, J., 108
Porter, M., 17, 170–172
Pottinger, T., 173
Prahalad, C., 99
Printed circuit CAD software, 20, 23–34,
142, 143, 172
Private-collective model, 11, 90, 91, 106
Product development, 2, 165, 174–177
Project SAPPHO, 108
Prügl, R., 135, 161
Punj, G., 37, 180
Pyramiding. See Lead users
Raymond, E., 9, 10, 86, 94, 98, 101,
102, 126, 181, 182
Redmond, W., 108
Reisinger, H., 5, 37
Riggs, W., 70, 71, 95
Roberts, J., 4, 10, 20, 23–27, 34, 35, 79,
179
Robertson, A., 108
Rosenberg, N., 21, 22, 68
Rothwell, R., 108
SAPPHO study, 108
Sattler, H., 84
Schaffer, C., 37
Schau, H., 174
Schmidt, G., 173
Schmookler, J., 23
Schrage, M., 151
Schreier, M., 161, 162
Scientific instruments, 70–72, 94, 95
Scotchmer, S., 113
Searls, K., 136–143
Shafer, L., 150
Shah, S., 1, 2, 10, 11, 22, 27–30, 79, 80,
85, 95, 103, 105, 127, 176
Shapiro, C., 12, 114
Silberston, Z., 84
Singleton, S., 90
Slater, S., 144
Slaughter, S., 52–56, 59, 60, 83–85
Smith, A., 21
Smith, G., 99
Social welfare
free revealing and, 89
and government policy, 2, 11–13, 107,
108
innovation and, 2, 3, 110–112, 121–131
manufacturer innovation and, 7–13
private-collective model and, 11, 90,
91, 106
user innovation and, 2, 3, 7–13
Sonnack, M., 135–143
Spaeth, S., 88, 100
Spence, M., 110
Sporting equipment
free revealing and, 79, 80
innovation communities and, 94, 95,
105, 106
lead users and, 19, 20, 22, 27–30, 176
user-to-user assistance and, 105, 106
Stallman, R., 97–99
Stanley, L., 1, 2
Stewart, D., 37, 180
Stressed-skin panels, 52–56, 59, 60
StataCorp statistical software, 128–131,
136
Sticky information, 8, 67, 68
dimensions-of-merit product improve-
ments and, 146
innovation and, 8, 9, 16, 57, 66–70,
93, 108, 146
and scientific instruments, 70, 71
toolkits and, 20, 30, 109, 112,
148–151, 176
Suppliers, 3, 127, 128
202 Index
Surgical equipment, 20, 30, 109, 112, 176
Suzlanski, G., 67
Task partitioning, 13–15, 150–153. See
also Toolkits
Taylor, C., 84
Taylor, M., 90
Technical communities, 165, 172–174
Technicon Corporation, 79, 136
Tedd, L., 25
Teece, D., 67
Thies, S., 129
Thomke, S., 63, 66, 128, 135, 138, 148,
151
3M Corporation, 15, 16, 133, 136–143
Tirole, J., 48, 86, 111
Toolkits, 16, 128–130, 147–164
characteristics of, 147, 148, 153, 154
GE and, 130, 148
innovation and, 147–164
International Flavors and Fragrances
and, 148
lead users and, 163
manufacturers and, 13–15, 148–164
module libraries for, 159
Nestle and, 159–161
open source software and, 100, 101
platform products and, 14, 15,
128–130, 172
semiconductor manufacture and
design and, 16
sticky information and, 148–151
StataCorp and, 128–131
solution spaces and, 156, 157
task partitioning, 13–15, 152, 153
trial-and-error learning in, 148, 149,
154–156
user-friendly tools for, 13, 147, 157–161
users and, 13–15, 148–164
Trade secrets. See Intellectual property
rights
Transaction costs, 45, 46, 50–60, 114.
See also Agency costs
Trevithick, R., 78, 79
Trial-and-error problem solving, 63–66,
148, 149, 152–156, 161
Tripsas, M., 127
Tyre, M., 63, 68–70, 149, 150
Ulin, D., 50
Urban, G., 20, 23, 24, 142, 143
User innovation. See Innovation;
Innovation communities; Users
User need, 5, 6, 13, 33–43, 74, 93, 121,
126, 162
Users. See also Lead users
agency costs and, 6, 46–50
characteristics of, 3
co-invention and, 118, 119
custom products and, 14, 15, 33–43,
127, 128, 172
expectations of economic benefit by,
1–9
free revealing by, 9, 10, 13, 17, 77–91,
168
government policy and, 2, 107–119
innovation and, 13–15, 121, 131
information asymmetries of, 8, 9, 48,
66–74, 109
information communities and, 11,
168
innovate-or-buy decisions by, 5–8,
45–63, 72–75, 94, 123, 124, 176
innovation and, 1–9, 14–16, 33–45,
49–51, 63–76, 93, 107–119, 133–164,
174–177
innovation communities and, 105,
106, 131
innovation process and, 7, 8, 31, 45,
60, 61, 123, 124
knowledge and, 168–170
low-cost innovation niches of, 8, 9, 31,
63–76, 93, 94, 176
national competitive advantage and,
170–172
needs of, 5, 6, 33–43, 74
Index 203

Users (cont.)
and paying for innovations, 38–41, 45,
121
process improvements by, 21, 22
social welfare and, 11–13, 107, 110, 111
toolkits and, 147–164
transaction costs and, 46, 50–56
Utterback, J., 177
Van der Plas, R., 72
Varian, H., 12, 117
von Hippel, E., 4–6, 10, 11, 20–27,
34–42, 63, 66, 67–84, 87, 90–91,
95–111, 121–123, 128, 135–144,
148–151, 166, 171, 175, 180
von Krogh, G., 11, 88–91, 100
Wagner, S., 107, 108, 118
Walsh, J., 84
Watt, J., 78
Weber, S., 17, 116, 169, 170
Wellman, B., 96
Wenger, E., 174
Wikipedia, 17, 166
Wind, Y, 37
Windsurfing, 1, 2, 127, 176
Winter, S., 67
Wolf, B., 8, 60, 61, 87
Young, G., 99
Zeroprestige.com, 103, 104, 125
Zhang, X., 167
Ziedonis, R., 114
204 Index
Recommended