Desalination… a CO2 opportunity ?a CO2 opportunity ?
Herve Faujour
Technical and Performance Director – Middle East
Veolia Environnement
Dubai – December 2013
AgendaVeolia : leader for environment services
• Group Overview
• Focus on R&D and technologies
• Key references in the ME
Desalination – opportunity for CO2 footprint• CF principle and methodology
• Optimizations in CF for mechanical desalination• Optimizations in CF for mechanical desalination
• Optimizations in CF for thermal desalination
Desalination – opportunity for CO2 consumption• Why CO2 is needed in desalination process
• Optimization in injection efficiency
• Synergies in thermal desalination
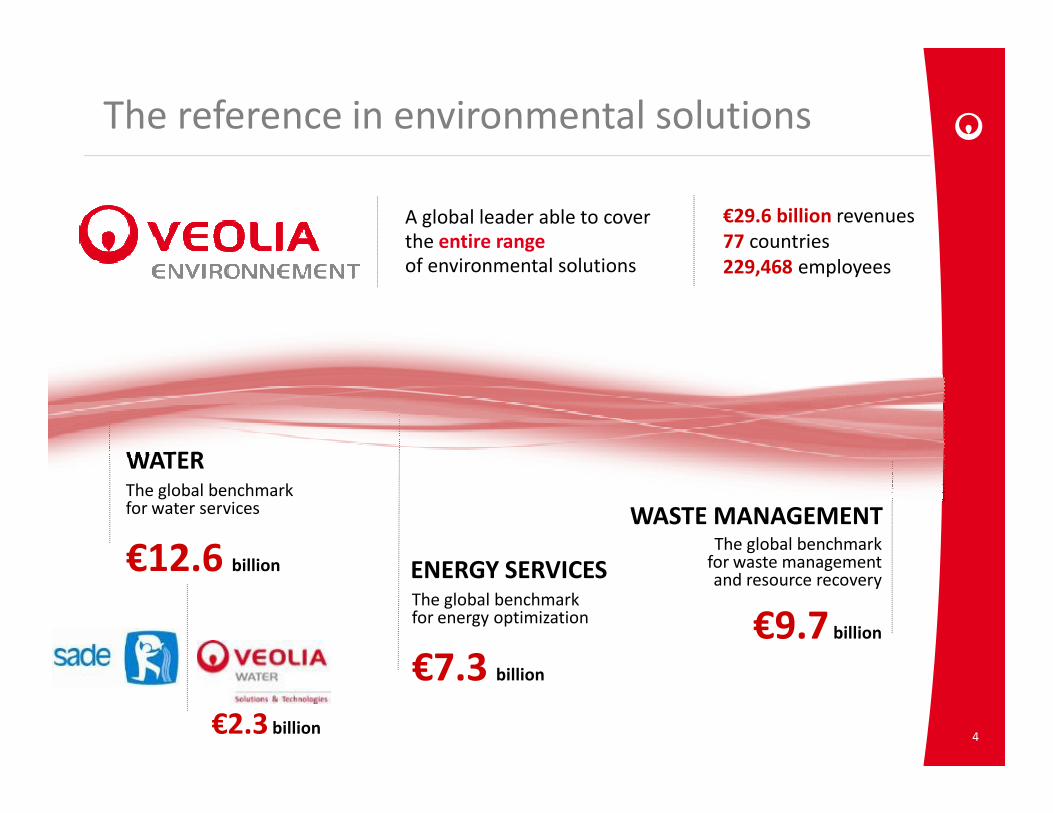
A global leader able to cover the entire rangeof environmental solutions
The reference in environmental solutions
€29.6 billion revenues
77 countries
229,468 employees
The global benchmarkfor water services
€12.6 billion
The global benchmark for energy optimization
€7.3 billion
The global benchmarkfor waste managementand resource recovery
€9.7 billion
4
WATER
WASTE MANAGEMENT
ENERGY SERVICES
€2.3 billion
Key figures
We had 100 million customers for drinking watersupply and 71 million for wastewater services
We treated almost 54 million metric tons of waste
We provided the energy needed for more than We provided the energy needed for more than
130,000 industrial, municipal and household installations
Innovation, efficiency, customer focus and social responsibility are our strengths and the cornerstone
of our success.
5
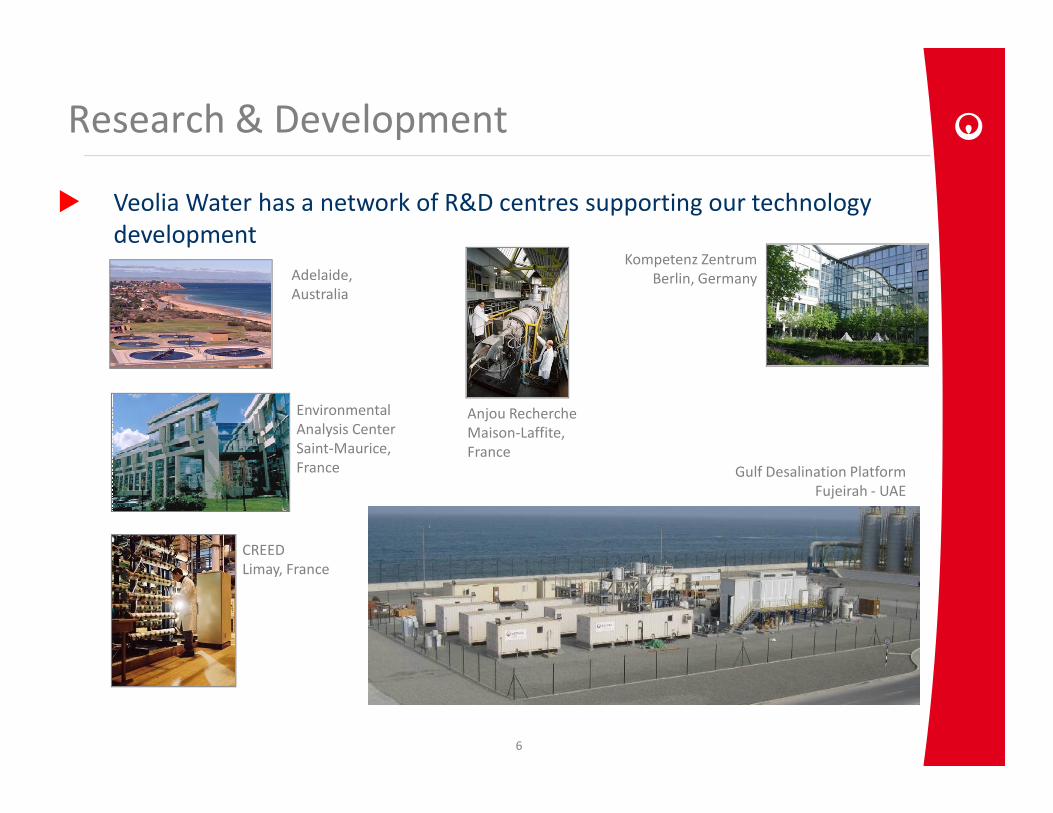
Adelaide,
Australia
Kompetenz Zentrum
Berlin, Germany
Environmental Anjou Recherche
� Veolia Water has a network of R&D centres supporting our technology
development
Research & Development
Environmental
Analysis Center
Saint-Maurice,
France
Anjou Recherche
Maison-Laffite,
France
CREED
Limay, France
6
Gulf Desalination Platform
Fujeirah - UAE
Veolia and environmental performance
www.youtube.com/watch?v=JuAdZLGvhPM
www.youtube.com/watch?v=8d9K5HWheJQ
Lebanon
JJordanordan KuwaitKuwait
SyriaSyria
Iran
Iraq
Jordan
Kuwait
Syria
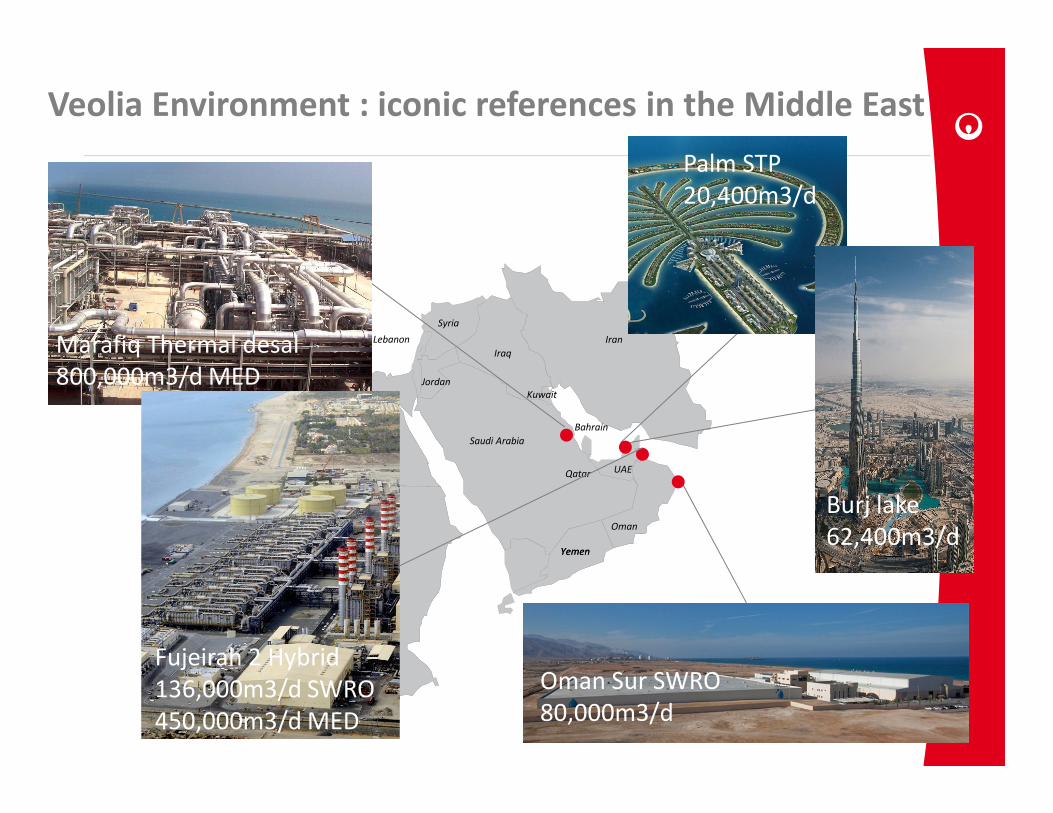
Veolia Environment : iconic references in the Middle East
Palm STP
20,400m3/d
Marafiq Thermal desal
800,000m3/d MED
EgyptEgypt
UAEUAE
Egypt Saudi Arabia
Qatar UAE
Oman
YemenYemen
Sudan
BahrainLibya
Burj lake
62,400m3/d
Oman Sur SWRO
80,000m3/d
Fujeirah 2 Hybrid
136,000m3/d SWRO
450,000m3/d MED
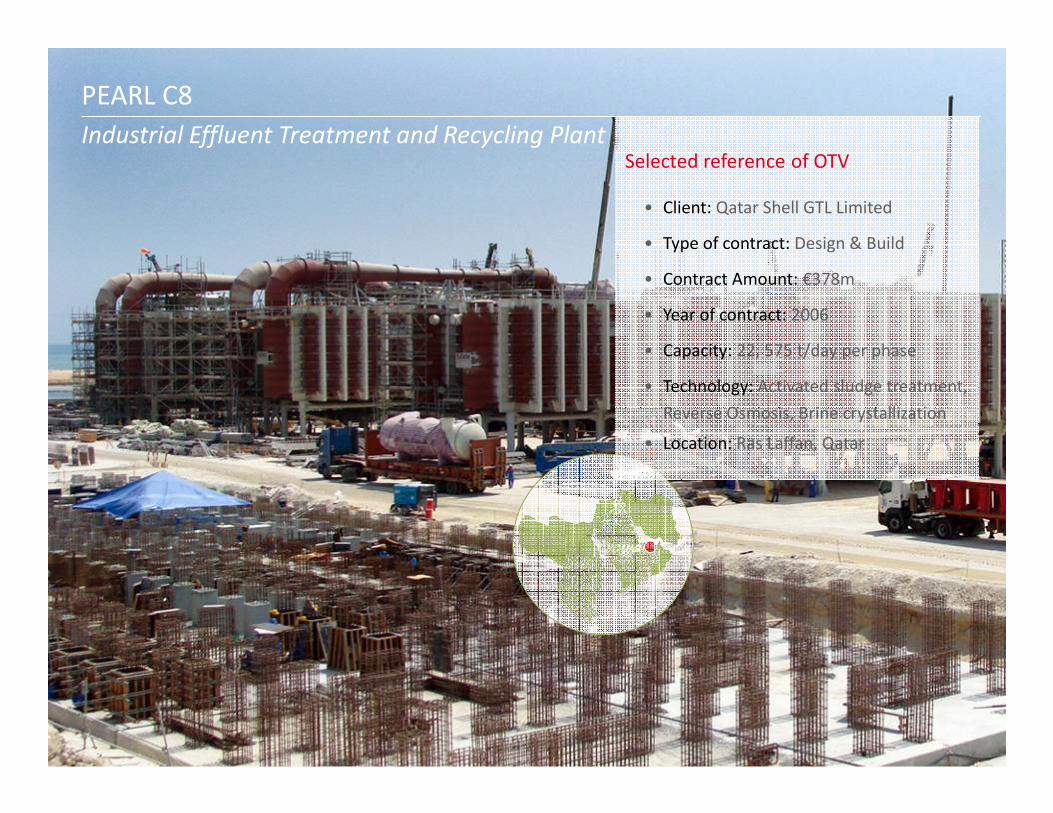
Selected reference of OTV
• Client: Qatar Shell GTL Limited
• Type of contract: Design & Build
• Contract Amount: €378m
• Year of contract: 2006
• Capacity: 22, 575 t/day per phase
• Technology: Activated sludge treatment,
Reverse Osmosis, Brine crystallization
PEARL C8
Industrial Effluent Treatment and Recycling Plant
UAE
Reverse Osmosis, Brine crystallization
• Location: Ras Laffan, Qatar
AgendaVeolia : leader for environment services
• Group Overview
• Focus on R&D and technologies
• Key references in the ME
Desalination – opportunity for CO2 footprint• CF principle and methodology
• Optimizations in CF for mechanical desalination• Optimizations in CF for mechanical desalination
• Optimizations in CF for thermal desalination
Desalination – opportunity for CO2 consumption• Why CO2 is needed in desalination process
• Optimization in injection efficiency
• Synergies in thermal desalination
CO2 emission is the consequence of the increase consumption of fossil energy (gas, petrol, coal…)
• It is not endless, we need to change our habits
CO2 emission is one of the main reason for climatic disorder• It is not too late to correct it, but the later we wait the more difficult
it will be
Importance Importance of COof CO22 footprintfootprint
We need to put ourselves on a tight CO2 budget• Target is to cut CO2 by 2 in 2050, which means that the carbon
footprint per activity must be cut by 6 to take into account population growth and increase of GDP per capita.
Required steps when budget is tight : • First start monitoring by analysing the emission sources : CO2
footprint calculation
• Then take actions, focussing on major emission factors
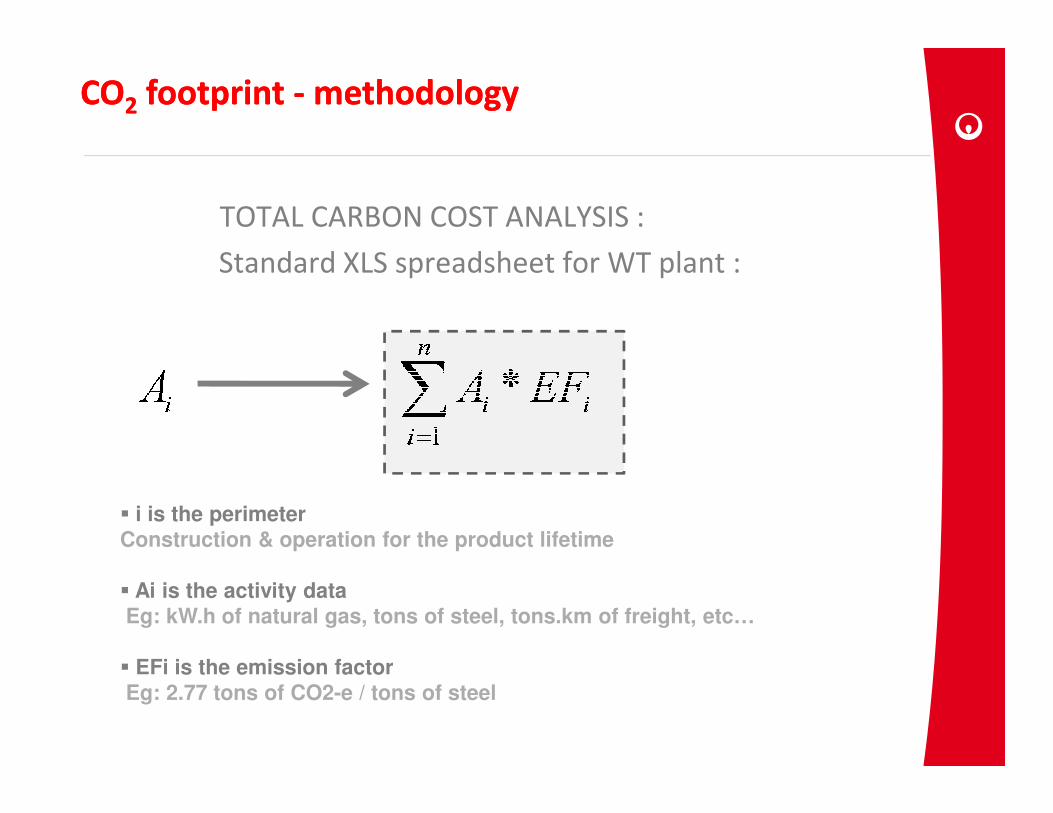
TOTAL CARBON COST ANALYSIS :
Standard XLS spreadsheet for WT plant :
COCO22 footprintfootprint -- methodologymethodology
� i is the perimeter
Construction & operation for the product lifetime
� Ai is the activity data
Eg: kW.h of natural gas, tons of steel, tons.km of freight, etc…
� EFi is the emission factor
Eg: 2.77 tons of CO2-e / tons of steel
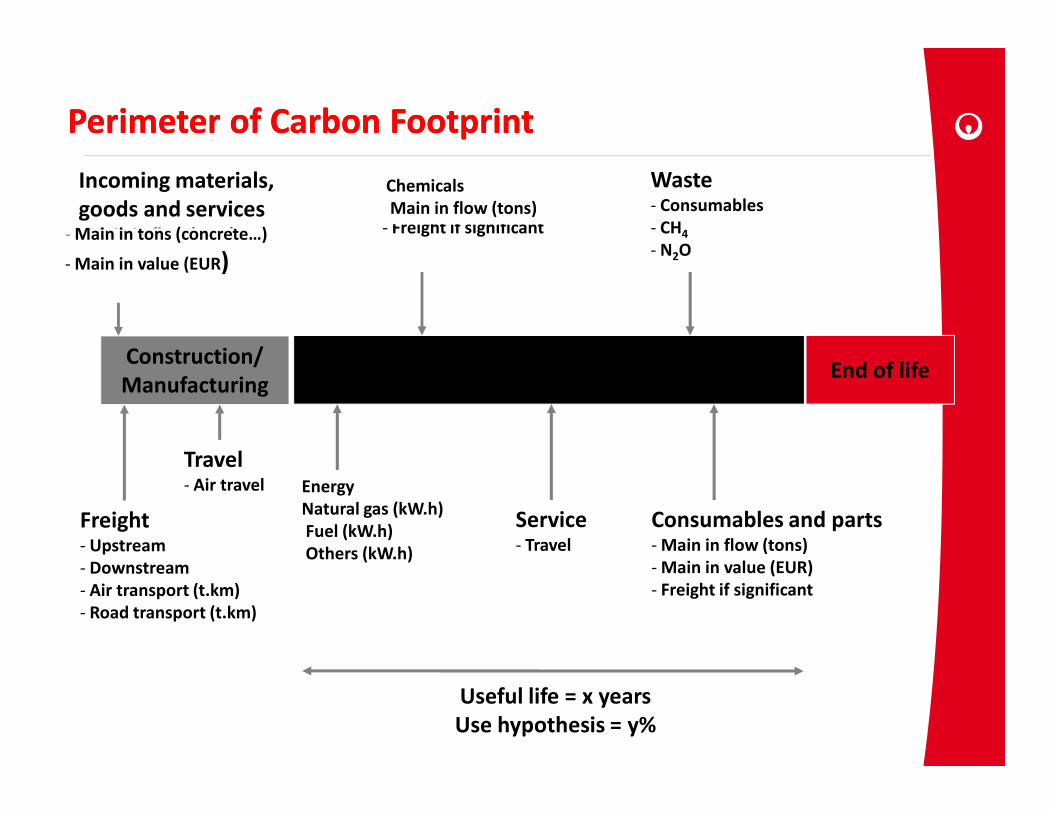
PerimeterPerimeter of of CarbonCarbon FootprintFootprint
End of lifeConstruction/
Manufacturing
Incoming materials,
goods and services- Main in flow (tons)
- Main in value (EUR)
Use/ Operating
Chemicals- Main in flow (tons)
- Freight if significant
Waste- Consumables
- CH4
- N2O
Chemicals
Main in flow (tons)
- Main in tons (concrete…)
- Main in value (EUR)
Freight- Upstream
- Downstream
- Air transport (t.km)
- Road transport (t.km)
Travel- Air travel
Consumables and parts- Main in flow (tons)
- Main in value (EUR)
- Freight if significant
Energy-Natural gas (kW.h)
- Fuel (kW.h)
- Others (kW.h)
Useful life = x years
Use hypothesis = y%
Service- Travel
Energy
Natural gas (kW.h)
Fuel (kW.h)
Others (kW.h)
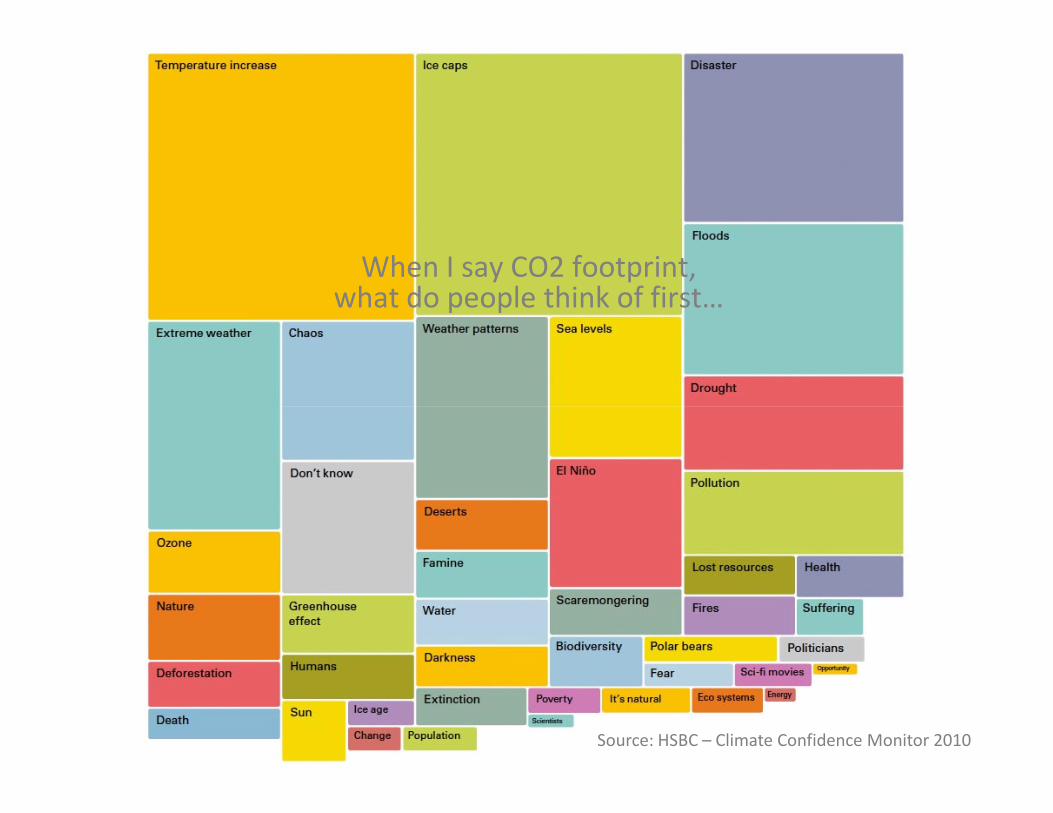
When I say CO2 footprint, what do people think of first…
Source: HSBC – Climate Confidence Monitor 2010
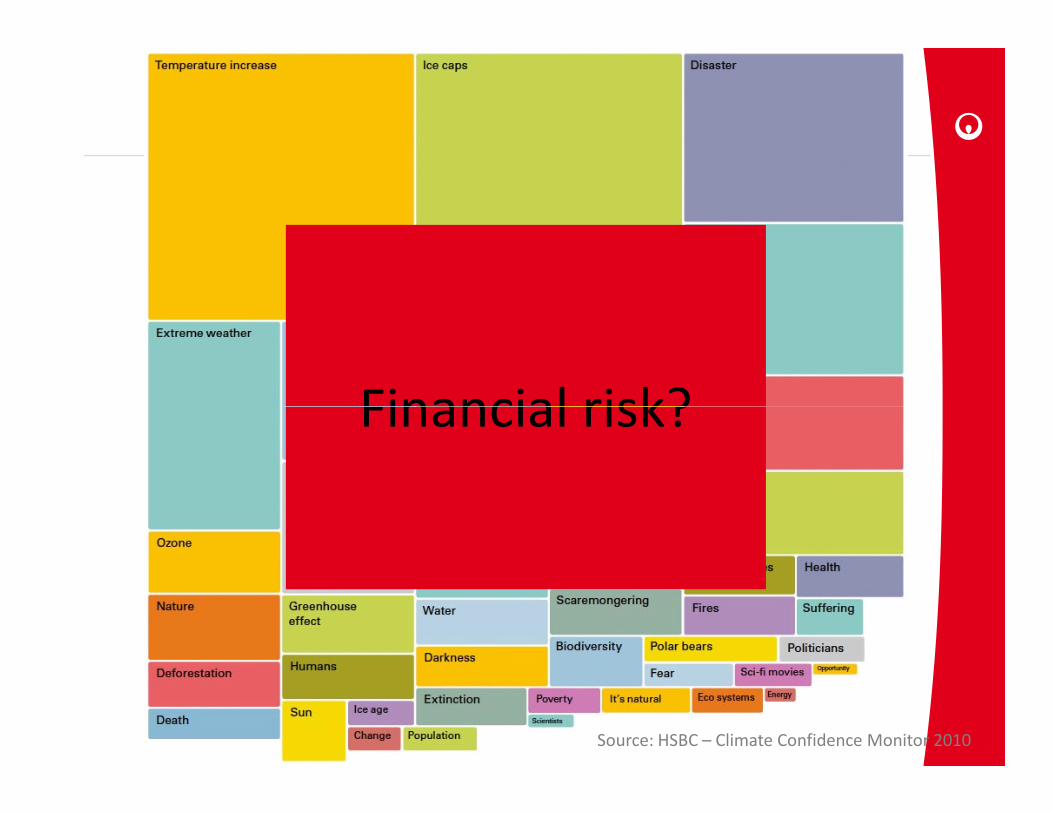
Financial risk?
Source: HSBC – Climate Confidence Monitor 2010
Financial risk?
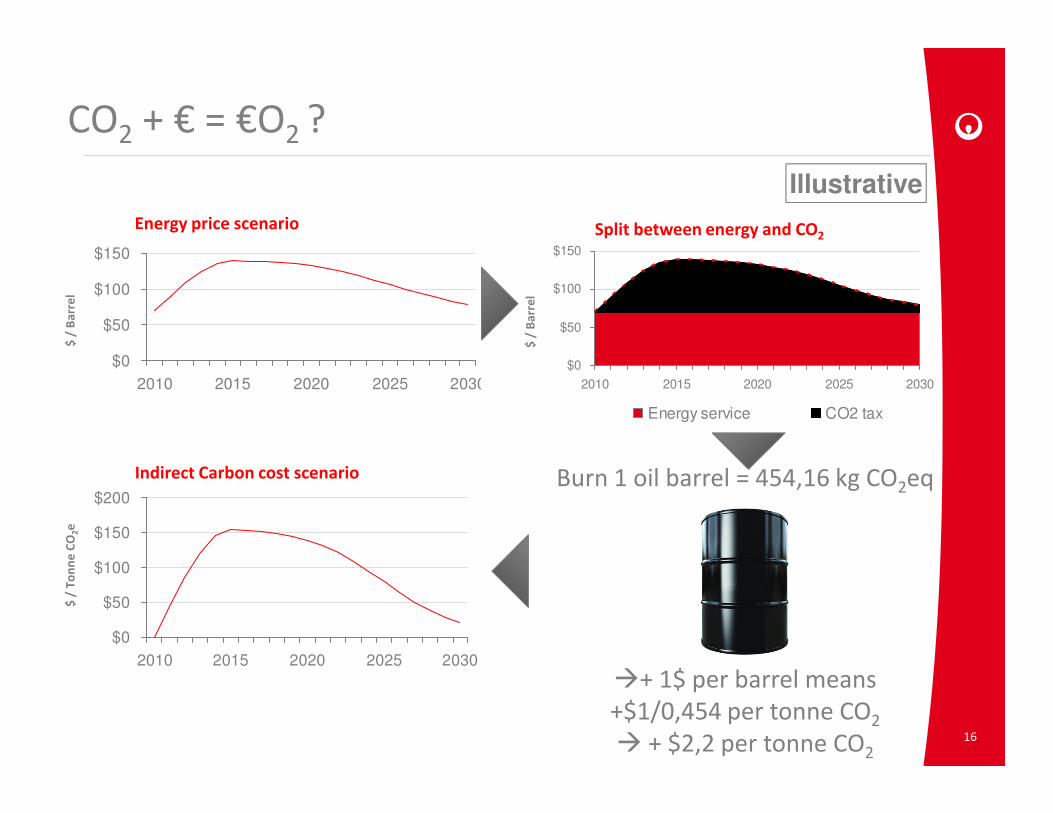
CO2 + € = €O2 ?
Illustrative
Energy price scenario
$0
$50
$100
$150
2010 2015 2020 2025 2030
$ /
Ba
rre
l
$0
$50
$100
$150
2010 2015 2020 2025 2030
Energy service CO2 tax
Split between energy and CO2
$ /
Ba
rre
l
16
Burn 1 oil barrel = 454,16 kg CO2eq
�+ 1$ per barrel means
+$1/0,454 per tonne CO2
� + $2,2 per tonne CO2
Indirect Carbon cost scenario
$0
$50
$100
$150
$200
2010 2015 2020 2025 2030
$ /
To
nn
e C
O2e
Energy service CO2 tax

Portfolio of references of Veolia Portfolio of references of Veolia A very wide range of emissions !A very wide range of emissions !
Mara
fiq (M
ED)
Fuja
irah (M
ED +
RO
)
Sydney (RO
)
Om
an s
ur (R
O)
MSM
Evry
mem
bra
nes
Rosny b
iosty
r
Sald
osa
Evry
activate
d s
ludge
Rosny a
ctivate
d s
ludge
Coal (C
OA)
Wood C
hem
icaly
Activate
d (W
CA)
Tem
bec
Retrofit pla
nt - AnoxKald
nes
Retrofit pla
nt - Conventional activate
d
Coconut shell
(CSA)
Reactivate
d C
OA
Marn
e &
Morin
New p
lant - Conventional activate
d
New p
lant - AnoxKald
nes
Mondi (E
GSB)
Tere
os (UASB)
LED - E
vale
d R
V
Reactivate
d C
SA
BP C
hem
bel (U
ASB)
Conventional pla
nt
Org
anic
a p
lant
LED - E
vale
d A
C
Spendru
ps (EG
SB)
Gertsheim
Aquafa
b - R
apid
Strata
LED - E
vale
d P
C
Balla
st wate
r treatm
ent
Aquafa
b - O
rion
Larg
e D
iskfilter
PM
T
Aquafa
b - M
egaRP
Sm
all
Dis
kfilter
Waste
wate
r treatm
ent
Mediu
m D
rum
filter
Oil/
Wate
r separa
tion
Aquafa
b - M
iniR
O
Elg
ala
b - M
edic
a P
ro
Elg
ala
b - P
ure
Lab
SDI - Aquadem
Cumulated emissions for one year on logarithmic scale
Top 4 of Veolia emission sources : desalination (thermal or by reverse osmosis), by a factor of at least 10 compared to other plants.
� Large opportunities for CO2 footprint in desalination plants
Mara
fiq (M
ED)
Fuja
irah (M
ED +
RO
)
Sydney (RO
)
Om
an s
ur (R
O)
MSM
Evry
mem
bra
nes
Rosny b
iosty
r
Sald
osa
Evry
activate
d s
ludge
Rosny a
ctivate
d s
ludge
Coal (C
OA)
Wood C
hem
icaly
Activate
d (W
CA)
Tem
bec
Retrofit pla
nt - AnoxKald
nes
Retrofit pla
nt - Conventional activate
d
Coconut shell
(CSA)
Reactivate
d C
OA
Marn
e &
Morin
New p
lant - Conventional activate
d
New p
lant - AnoxKald
nes
Mondi (E
GSB)
Tere
os (UASB)
LED - E
vale
d R
V
Reactivate
d C
SA
BP C
hem
bel (U
ASB)
Conventional pla
nt
Org
anic
a p
lant
LED - E
vale
d A
C
Spendru
ps (EG
SB)
Gertsheim
Aquafa
b - R
apid
Strata
LED - E
vale
d P
C
Balla
st wate
r treatm
ent
Aquafa
b - O
rion
Larg
e D
iskfilter
PM
T
Aquafa
b - M
egaRP
Sm
all
Dis
kfilter
Waste
wate
r treatm
ent
Mediu
m D
rum
filter
Oil/
Wate
r separa
tion
Aquafa
b - M
iniR
O
Elg
ala
b - M
edic
a P
ro
Elg
ala
b - P
ure
Lab
SDI - Aquadem
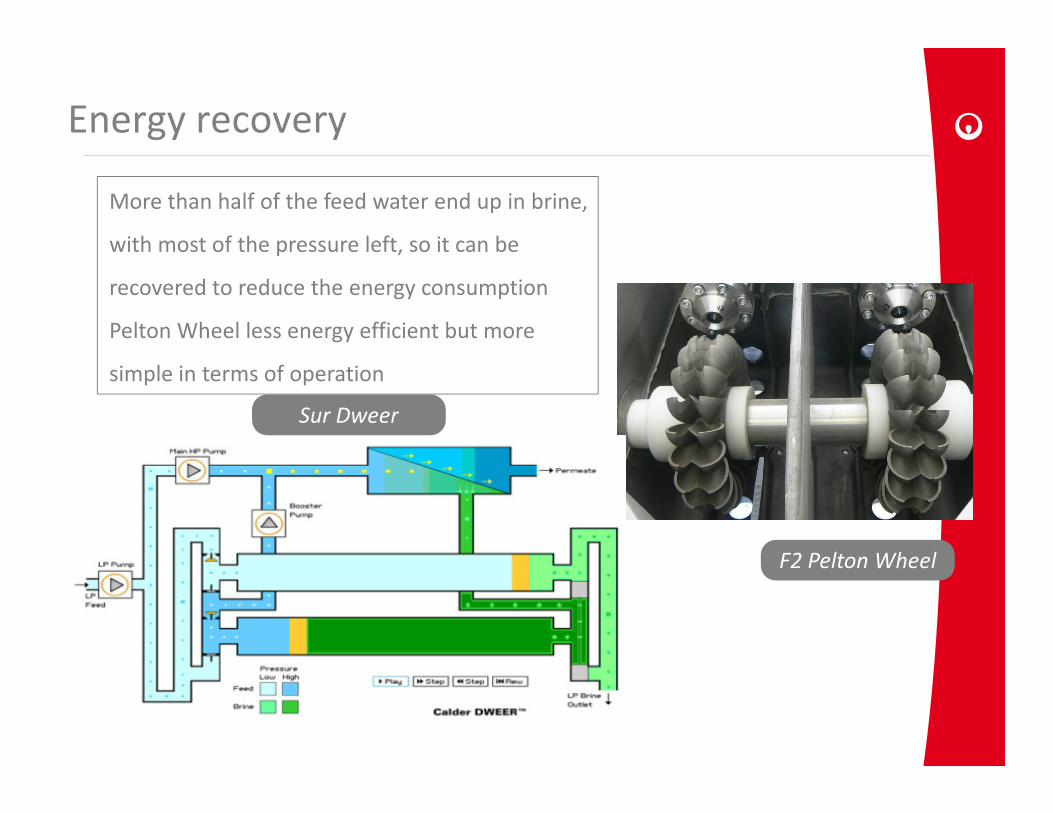
Energy recovery
Sur Dweer
More than half of the feed water end up in brine,
with most of the pressure left, so it can be
recovered to reduce the energy consumption
Pelton Wheel less energy efficient but more
simple in terms of operation
F2 Pelton Wheel
Sur Dweer
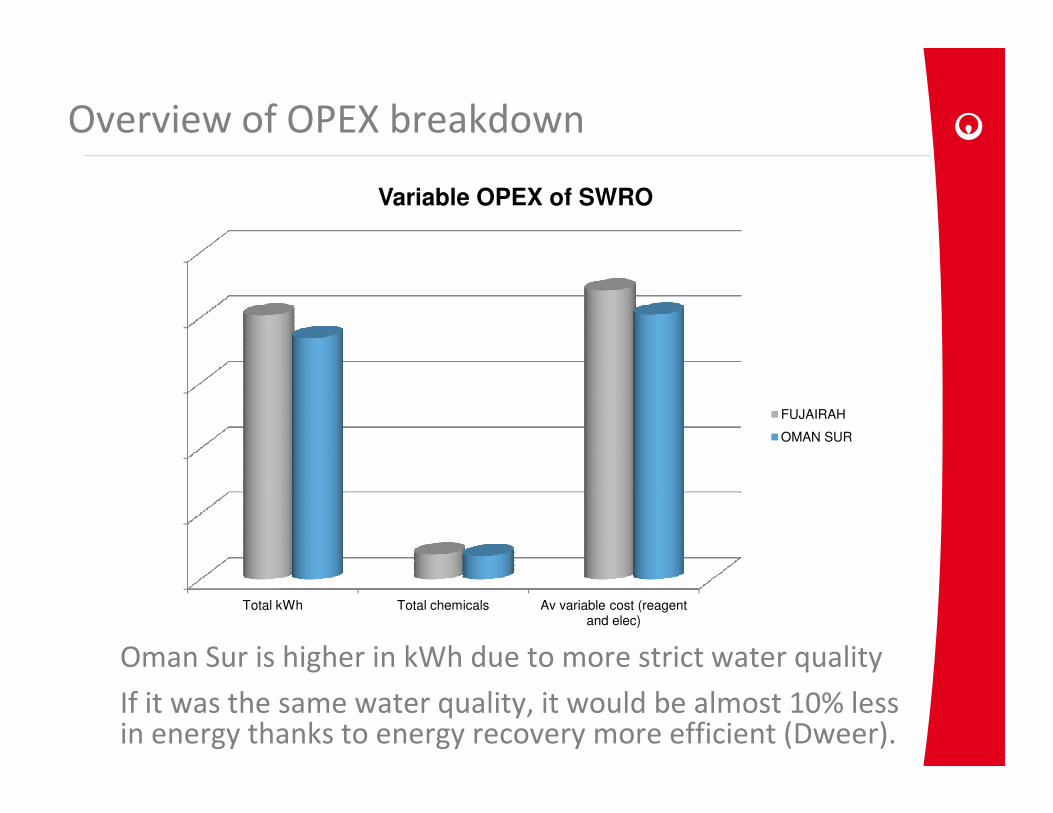
Overview of OPEX breakdown
Variable OPEX of SWRO
Oman Sur is higher in kWh due to more strict water quality
If it was the same water quality, it would be almost 10% less in energy thanks to energy recovery more efficient (Dweer).
Total kWh Total chemicals Av variable cost (reagent and elec)
FUJAIRAH
OMAN SUR
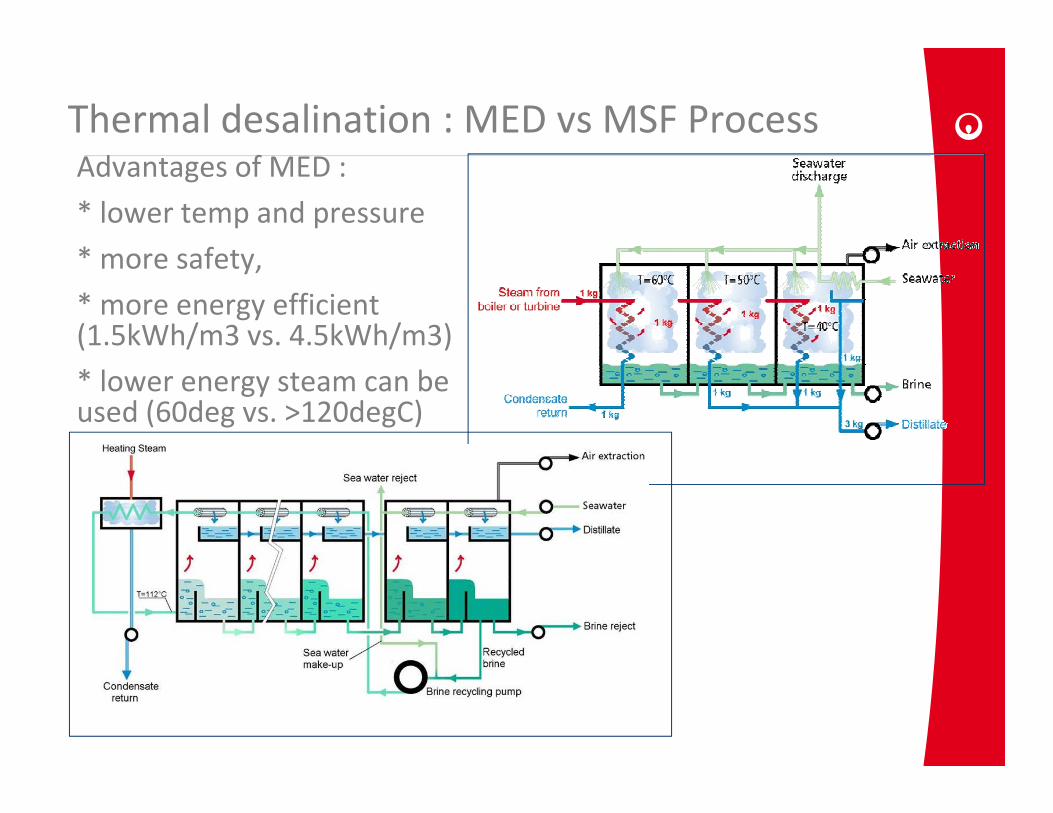
Thermal desalination : MED vs MSF ProcessAdvantages of MED :
* lower temp and pressure
* more safety,
* more energy efficient (1.5kWh/m3 vs. 4.5kWh/m3)
* lower energy steam can be used (60deg vs. >120degC)used (60deg vs. >120degC)
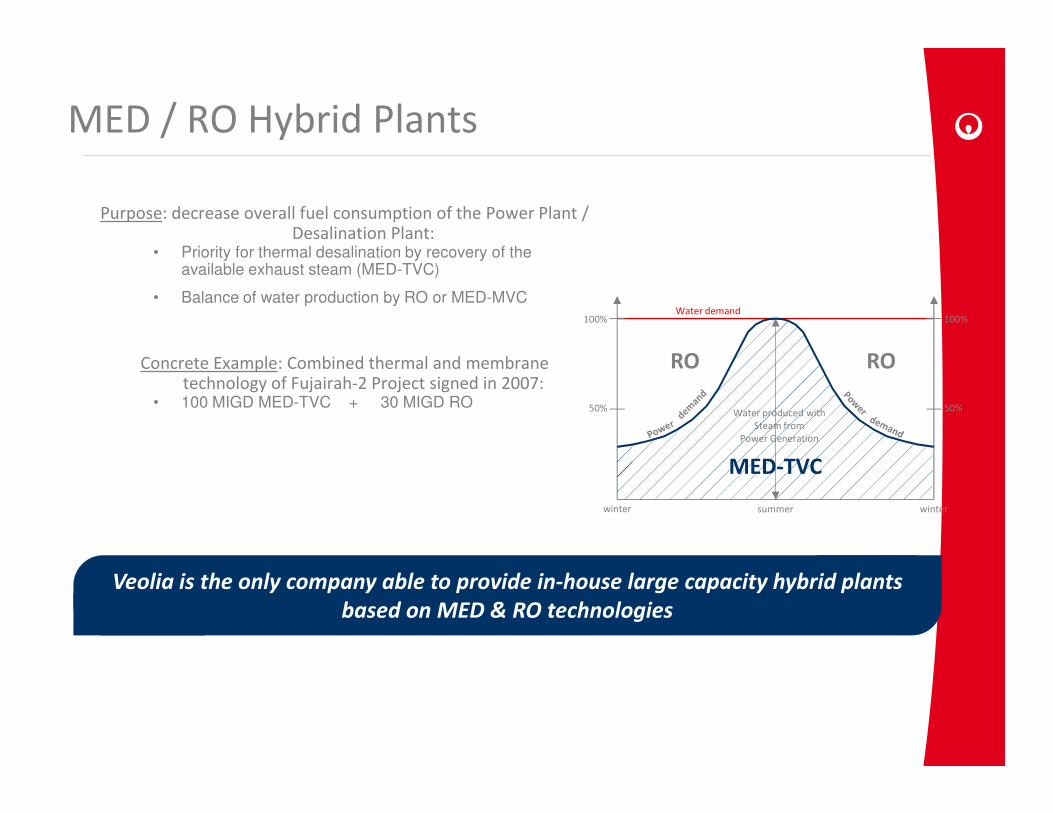
MED / RO Hybrid Plants
Purpose: decrease overall fuel consumption of the Power Plant / Desalination Plant:
• Priority for thermal desalination by recovery of the available exhaust steam (MED-TVC)
• Balance of water production by RO or MED-MVC
Concrete Example: Combined thermal and membrane technology of Fujairah-2 Project signed in 2007:
• 100 MIGD MED-TVC + 30 MIGD RO
Water demand100%
50%
100%
50%
RO
Water produced with
RO
• 100 MIGD MED-TVC + 30 MIGD RO 50% 50%
winter wintersummer
Water produced with
Steam from
Power Generation
MED-TVC
Veolia is the only company able to provide in-house large capacity hybrid plants
based on MED & RO technologies
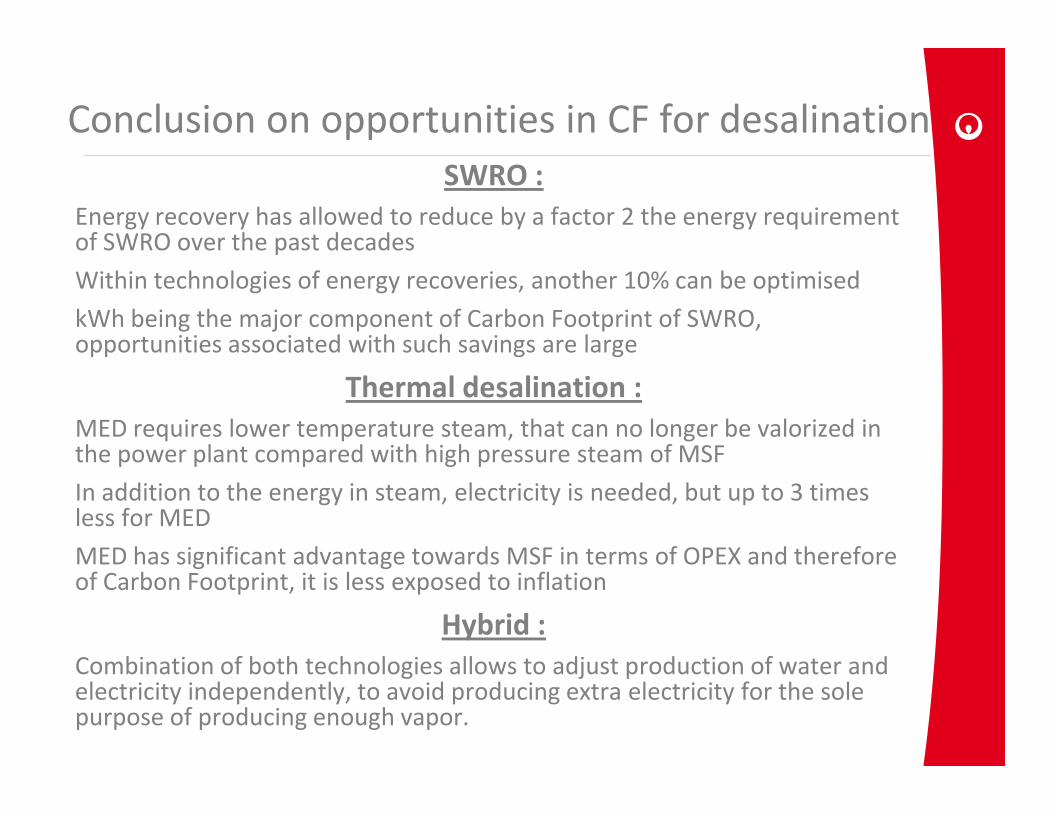
Conclusion on opportunities in CF for desalination
SWRO :
Energy recovery has allowed to reduce by a factor 2 the energy requirement of SWRO over the past decades
Within technologies of energy recoveries, another 10% can be optimised
kWh being the major component of Carbon Footprint of SWRO, opportunities associated with such savings are large
Thermal desalination :
MED requires lower temperature steam, that can no longer be valorized in the power plant compared with high pressure steam of MSF
In addition to the energy in steam, electricity is needed, but up to 3 times less for MED
MED has significant advantage towards MSF in terms of OPEX and therefore of Carbon Footprint, it is less exposed to inflation
Hybrid :
Combination of both technologies allows to adjust production of water and electricity independently, to avoid producing extra electricity for the sole purpose of producing enough vapor.
AgendaVeolia : leader for environment services
• Group Overview
• Focus on R&D and technologies
• Key references in the ME
Desalination – opportunity for CO2 footprint• CF principle and methodology
• Optimizations in CF for mechanical desalination• Optimizations in CF for mechanical desalination
• Optimizations in CF for thermal desalination
Desalination – opportunity for CO2 consumption• Why CO2 is needed in desalination process
• Optimization in injection efficiency
• Synergies in thermal desalination
Desalination requires remineralisation
Desalinated water is not potable, and it is very aggressive
Hardness and alkalinity must be added in the distillate or the filtrate to make it neutral and non aggressive
Hardness (Ca2+)is added in the form of lime or limestone
Alkalinity (HCO3-) is added in the form of CO2 and in limestone
dissolution3 2
dissolution
� There is always injection of CO2 downstream a desalination plant, so desalination plant is an opportunity for CO2 consumption
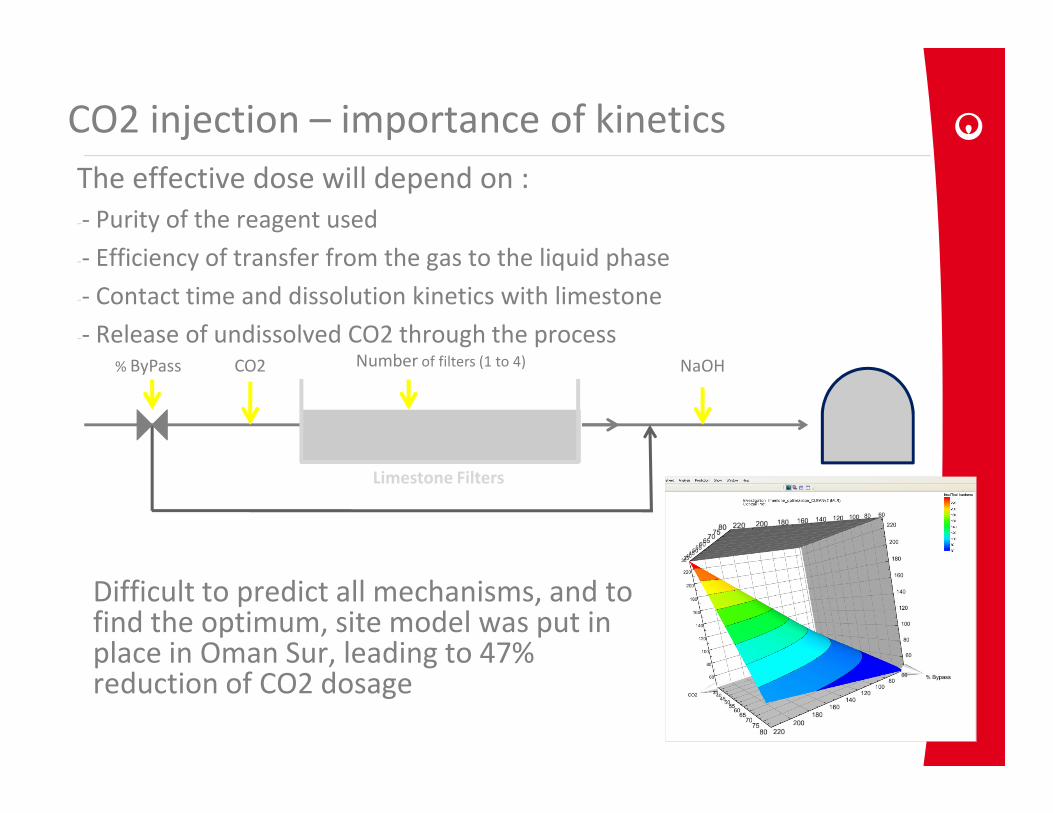
CO2 injection – importance of kinetics
The effective dose will depend on :
-- Purity of the reagent used
-- Efficiency of transfer from the gas to the liquid phase
-- Contact time and dissolution kinetics with limestone
-- Release of undissolved CO2 through the processCO2 Number of filters (1 to 4)% ByPass NaOH
Limestone Filters
Difficult to predict all mechanisms, and to find the optimum, site model was put in place in Oman Sur, leading to 47% reduction of CO2 dosage
Synergies in thermal desalination
Recovery of CO2 from combustion of the thermal plant :
CCU : Carbon Capture and Usage consists in collecting CO2 from large production plant such as power plant, treating it to use it for other application
Thermal desalination has on the same location fossil oil combustion for the power production, and need for CO2 for remineralization, CCU allows to reduce the CO2 emissions of the power plant and of the water plant
Conclusion
Veolia : leader for environment services• Involved in all sorts of industrial projects, like GLT
project with Shell in Qatar or large municipal projects of desalination.
Desalination – opportunity for CO2 footprint• Desalination requires very large amount of energy.
Carbon footprint is a way to measure the level of Carbon footprint is a way to measure the level of exposure of a plant towards inflation, optimization done by Veolia to minimize financial risk.
Desalination – opportunity for CO2 consumption• CO2 injection is part of potable water production in
the Middle-East. It can be optimised thanks to water chemistry expertise, furthermore for thermal desalination, power plant off-gas can be used as source of CO2 after specific treatment
Recommended