1
Design and Technical Evaluation of a Conceptual Process
for Transferring Solvent Precipitated Asphaltenes into
Water Utilising Surfactant Phase Behaviour
Spencer E. Taylor
Corresponding author’s address: Chemical Sciences Division, Faculty of Health and Medical
Sciences, University of Surrey, Guildford, Surrey, GU2 7XH, United Kingdom
Tel.: +44 1276 512915
E-mail: [email protected].
Keywords: asphaltenes, phase transfer, refinery residues, solvent deasphalting, surfactant phase
behaviour, water dispersions
ABSTRACT
Experiments are described which demonstrate that asphaltenes precipitated from a refinery tar using
an excess of n-heptane spontaneously partition into a contacting water phase in the presence of an
ethoxylated nonionic surfactant by effecting a temperature change. The process appears to be related to
the temperature-dependent phase behaviour of the particular surfactant. Hot (ca. 80-90°C) aqueous
octa(ethyleneoxy) nonylphenylether (NPE8) and the heptane-diluted tar, were thoroughly and vigorously
mixed for a short time and then allowed to stand and cool under quiescent conditions. A distinct
oil/water interface rapidly appeared after the mixing had stopped and, at a specific temperature,
asphaltene particles were observed to begin to “rain” into the lower aqueous phase, producing an

2
aqueous asphaltene suspension. The temperature at which asphaltene transfer occurred was close to the
phase inversion temperature of the NPE8/heptane system. Subsequent to different laboratory batch
experiments, a larger-scale semi-continuous operation was carried out allowing other aspects of the
process to be investigated. Rigorous economic analyses of the process have not been included in this
study, although it is apparent that surfactant recycling would need to be ensured in order to approach
commercial viability, even if the technical concepts translate well to large-scale operation.

3
1. Introduction
The present paper describes an experimental investigation of a conceptual approach to the separation
of precipitated asphaltenes from a solvent-diluted refinery residue into water, assisted by a surfactant
exhibiting temperature-dependent oil/water phase partitioning behaviour.
Asphaltenes constitute the heaviest, most polar and currently the least valuable components of crude
oil. Structurally, they comprise lightly functionalised polycondensed aromatic molecules, including
heteroatomic sulphur, nitrogen and oxygen centres which are able to co-ordinate heavy metals such as
nickel and vanadium. Various physicochemical parameters indicate the intermediate polarity of
asphaltenes. For example, intermediate solubility parameters of 20-30 MPa½
have been quoted (Rogel,
1998; Angle et al. 2006), the specific values depending on the crude oil source and the extent of any
thermal treatment. Likewise, asphaltenes possess relatively high dipole moments, e.g. 11.7 D for Dagang
crude atmospheric residue (Zhang et al., 2007) and are traditionally thought to exist in a relatively
homogeneous state in many crude oils and thermally treated residual oils only through associations with
other components, such as the resin fractions, which possess characteristics intermediate between the
asphaltenes and the remainder of the oil (the maltenes). The nature of the interactions between
asphaltenes and resins has been the subject of much conjecture over the years, involving acid-base,
hydrogen bonding and/or electrostatic interactions (León et al., 2002). Asphaltene molecular weight has
also been debated at length, but is now generally regarded to be in the range 500-1000 daltons, with the
higher values quoted being due to aggregation (Mullins, 2007).
Largely as a result of their contrasting nature compared with the majority hydrocarbon components of
crude oils, asphaltenes are implicated in a number of problems affecting production and refining
operations, e.g. stabilization of water-in-oil emulsions (Mohammed et al., 1993; Spiecker, 2003) and
deposition in pipelines and heat exchangers (Matsushita et al. 2004).
Removal of the lighter hydrocarbon fractions of crude oils in refineries by distillation at atmospheric

4
pressure and under vacuum results in the formation of residues which contain high concentrations of
asphaltenic and other high molecular weight material (e.g. resins and waxes). Subsequently, thermal and
catalytic cracking processes operating at different degrees of severity (temperature and hydrogen
pressure) are then used to ‘crack’ susceptible paraffinic chains on the high molecular components to
increase the yield of lower boiling, more valuable distillate fractions. Processing of this type leads to an
increase in the polarity of the resultant polycondensed aromatic components derived from the original
asphaltenes and resins. These products are variously called asphalts, pitches or tars. Excessive thermal
treatment leads initially to precipitation of cracked asphaltenes and ultimately to the formation of coke
(Rahmani et al., 2003).
Different residue upgrading schemes have been developed to maximize the production of distillates,
while at the same time managing the production of the heavy residues as effectively as possible (Rana et
al, 2007). Schemes in popular use at the present time are based on delayed coking or selective solvent
deasphalting (SSDA). In the former process, the controlled thermal treatment of atmospheric or vacuum
residues results in the production of distillates and to extensive residue cracking, with the deliberate
formation of various types of petroleum coke. In SSDA, precipitated asphaltene (PA) is produced in the
residue feed using low carbon number n-alkanes, such as propane, butane and pentane, with solubility
parameters in the range 14 to 15.4 MPa½ (Barton, 1991). Operating the process under supercritical
conditions (for the n-alkanes) is more energy and process efficient, and the ROSE process developed
by Kerr-McGee, and UOP/Foster-Wheeler’s Solvent Deasphalting (SDA) process are such examples.
The precipitating solvent is recovered by distillation and recycled, and the resulting DAO is refined
conventionally. The question then remains as to how to dispose of the PA. Heavy asphalts are used for
road surfacing and as the base components for marine bunker fuels. However, being largely devoid of
stabilizing components, the production of marine bunker fuels will require relatively large quantities of
valuable aromatic diluents to ensure complete asphaltene solubilisation. In order to avoid using
hydrocarbon diluents, asphaltene dispersions in water have also been considered for use as boiler fuels
5
(Logaraj et al., 2000; Shirodkar and McKeon, 2000). In consideration of the recent volatility of the price
of a barrel of crude oil, it is clearly advantageous to consider using residual oils in the most efficient
manner possible, and the present conceptual approach could add to potential options. At the present
time, production of asphaltene dispersions currently requires high temperature emulsification (Logaraj et
al., 2000) or the dispersion of pulverized solidified PA in a residual oil emulsion (Shirodkan and
McKeon, 2000).
In the present paper, however, we explore the possibility of transferring PAs directly from the
precipitation medium into water.
1.1 Transfer of particles between bulk phases
In recent years there has been interest directed towards the interfacial partitioning of particles
contained in a mixture which have a certain affinity for droplet interfaces, as created in an emulsion for
example (Jauregi et al., 2001). Inherent in this approach is the requirement for the particles to have an
appropriate wettability. In another relatively new development, the use of surfactant phases into which
aqueous-based solutes are able to partition has also been used as a separation method. Termed cloud
point extraction (CPE), this latter approach relies on the formation of a separate surfactant phase in the
mixture that is triggered by a temperature, pH or salinity change (Bai et al., 2001). CPE is therefore
proving to be particularly useful in pre-concentrating analytes for quantitative analysis and has also been
considered for the remediation of oil-contaminated soils (Komaromyhiller and von Wandruszka, 1995).
Additionally, in one particular development of this, the use of CPE for the separation of the clay mineral
saponite from aqueous dispersions has been demonstrated (Ito et al., 2003).
Although none of the above examples specifically considers partitioning of a solid phase between
contacting bulk liquid phases, there are some precedents involving this general principle. For example,
phase partitioning has been used as a means of separating biological cells and polymers for some 30
years. In this application, aqueous-based immiscible polymer systems (e.g. poly(ethylene glycol) and
6
dextran) are used to create the biphasic system (Albertsson, 1978). To introduce specificity for the cells,
one of the polymer phases is usually tagged with a biospecific ligand, assisting its preferential phase
transfer.
However, in contrast to this, the present system is one which involves an assumed “non-critical” solid
phase, with partitioning occurring as a consequence of achieving a critical condition in a ternary
oil/water/surfactant system. Somewhat related, perhaps, is the work of Gallagher and Maher (1992) who
investigated the behaviour of colloidal polystyrene spheres, including phase partitioning, in the binary
2,6-lutidine (2,6-dimethylpyridine)/water system which possesses a lower critical temperature of ca.
33.8°C (Loven and Rice, 1963). In their system, two stages were identified upon approaching the critical
temperature, i.e. partitioning to a preferred phase/interface, followed by flocculation of the particles near
the two-phase boundary. The driving force behind the observed behaviour of the colloidal particles was
suggested by the authors as being the formation of wetting layers of the preferred phase on the particle
surfaces as phase separation is approached, resulting in the inclusion of all particles within the more-
wetted phase.
1.2 Surfactant phase characteristics and critical phenomena
With the ongoing development of new surfactants for diverse technological applications, solution
phase behaviour is an extremely important characteristic. The existence and coexistence of different
phases of a given surfactant is influenced considerably by solution composition (e.g. ionic strength, pH,
the presence of organic species) and temperature (Buzier and Ravey, 1983). Moreover, “scanning” these
variables with respect to the solution behaviour reveals critical conditions for the appearance and
disappearance of phase boundaries as single-phase systems become two-phase, and vice versa, and this
is also reflected in the corresponding interfacial tension (Aveyard et al., 1985) and wetting properties
(Kolev et al., 2003). However, considering that critical point phenomena have been described
theoretically and their existence confirmed in model experiments (Boucher, 1989), direct practical

7
applications have received comparatively little attention. In one study, in which non-critical colloidal
particles were exposed to a critical condition, flocculation occurred (Netz, 1996), suggesting that
particle interaction forces were being modified as a consequence of the phase behaviour.
Depending on aqueous phase composition, in particular salinity, it is found that heating aqueous
solutions of nonionic ethoxylated surfactants can result in the separation of small droplets of surfactant-
rich phase at a specific temperature, producing a hazy appearance in the solution. The temperature at
which the onset of haziness occurs is known as the cloud-point, TCP. Coalescence of these droplets can
occur on surfaces, leading to the formation of larger drops. This has been observed by the present author
when carrying out variable temperature spinning drop tensiometry experiments on heavy crude oil
(unpublished observations). Phase separation of this type, occurring as the temperature is increased
towards TCP, is believed to be a consequence of the aggregation of surfactant micelles, as the ethylene
oxide headgroup dehydrates rendering the surfactant more hydrophobic and less water soluble.
Consequently, TCP depends on the structure of the surfactant, as well as factors that influence inter-
micellar forces, such as pH and ionic strength (Huibers et al., 1997). Above TCP, aqueous surfactant
solubility gives way to preferential oil solubility. When used to stabilize emulsions, such changes in
surfactant characteristics are reflected in “phase inversion” (or complete phase separation), e.g. oil-in-
water becoming water-in-oil, at the phase inversion temperature (TPI) (Shinoda and Kunieda, 1985). It
will become apparent that some of the above features are relevant to the present process.
2. Materials and methods
Water was deionised from a Milli-Q unit (Millipore). The residue was a sample of tar from a
combicracker unit at Vohburg Refinery, Germany that had been “fluxed” with 15% gas oil. An
exhaustive determination of heptane-insoluble asphaltenes using Soxhlet extraction yielded a value of
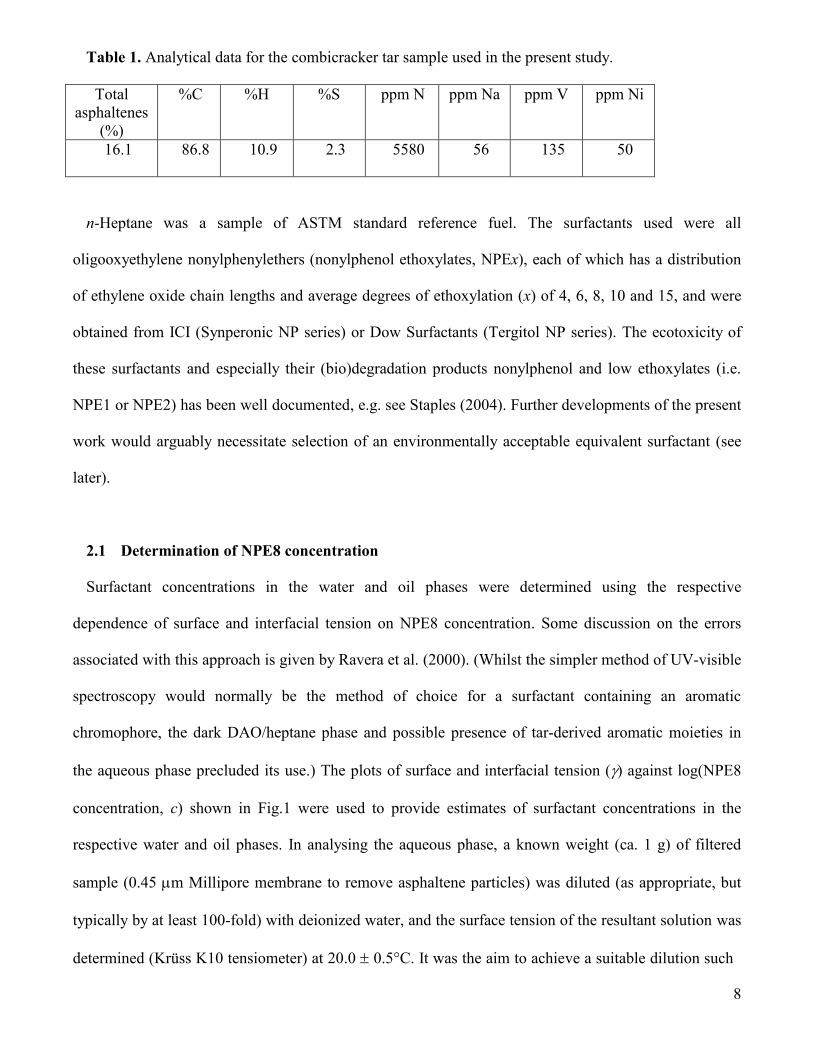
16.1 0.3% w/w. Selected analytical data for the as-received tar are given in Table 1.
8
Table 1. Analytical data for the combicracker tar sample used in the present study.
Total
asphaltenes
(%)
%C %H %S ppm N ppm Na ppm V ppm Ni
16.1 86.8 10.9 2.3 5580 56 135 50
n-Heptane was a sample of ASTM standard reference fuel. The surfactants used were all
oligooxyethylene nonylphenylethers (nonylphenol ethoxylates, NPEx), each of which has a distribution
of ethylene oxide chain lengths and average degrees of ethoxylation (x) of 4, 6, 8, 10 and 15, and were
obtained from ICI (Synperonic NP series) or Dow Surfactants (Tergitol NP series). The ecotoxicity of
these surfactants and especially their (bio)degradation products nonylphenol and low ethoxylates (i.e.
NPE1 or NPE2) has been well documented, e.g. see Staples (2004). Further developments of the present
work would arguably necessitate selection of an environmentally acceptable equivalent surfactant (see
later).
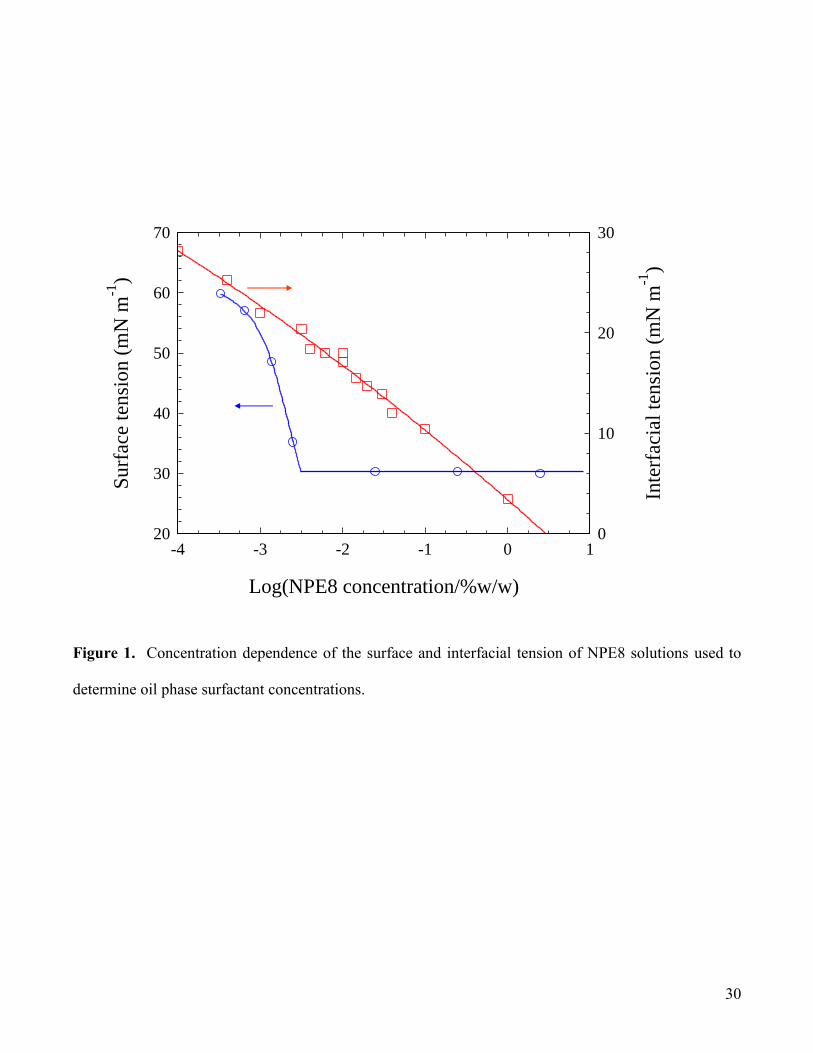
2.1 Determination of NPE8 concentration
Surfactant concentrations in the water and oil phases were determined using the respective
dependence of surface and interfacial tension on NPE8 concentration. Some discussion on the errors
associated with this approach is given by Ravera et al. (2000). (Whilst the simpler method of UV-visible
spectroscopy would normally be the method of choice for a surfactant containing an aromatic
chromophore, the dark DAO/heptane phase and possible presence of tar-derived aromatic moieties in
the aqueous phase precluded its use.) The plots of surface and interfacial tension () against log(NPE8
concentration, c) shown in Fig.1 were used to provide estimates of surfactant concentrations in the
respective water and oil phases. In analysing the aqueous phase, a known weight (ca. 1 g) of filtered
sample (0.45 m Millipore membrane to remove asphaltene particles) was diluted (as appropriate, but
typically by at least 100-fold) with deionized water, and the surface tension of the resultant solution was
determined (Krüss K10 tensiometer) at 20.0 0.5°C. It was the aim to achieve a suitable dilution such

9
that the surface tension fell within the sub-micellar concentration region in which d/dlogc was non-zero
and therefore provides a sensitive measure of concentration. It is appreciated that this method relies on
the composition of the surfactant in the sample matching that used for the calibration. However, as
discussed below, it is considered possible that there could be a change in the oligomer distribution as a
result of phase partitioning (Graciaa et al., 2006), but no detailed distribution analyses have been
performed in the present work. It has to be assumed, therefore, that some additional errors could be
associated with these measurements as a result of changes in oligomer distribution, which may also
explain the scatter in data obtained (see later). The corresponding oil phase NPE8 concentration was
determined from the interfacial tension calibration plot (Fig.1). In this case, samples (ca. 1 g) were again
filtered (0.45 m Millipore) and diluted appropriately with n-heptane prior to interfacial tension
determination. Based on measurement repeatability, errors in each of these determinations are estimated
to be of the order of ±10% of the quoted values for aqueous surfactant concentrations and ±15% for the
corresponding oil surfactant concentrations.
2.2 Other analyses
Optical microscopy and a Galai CIS-1 instrument using time-of-transition analysis were used to
determine the size of precipitated and transferred asphaltene particles. For the relatively dilute aqueous
dispersions, direct observation and measurement were possible. On the other hand, the dark colour of
the heptane-diluted residue precluded this direct course of action, and these samples were therefore
filtered through a 0.45 m Millipore membrane filter in order to collect precipitated asphaltenes, which
were then re-suspended in heptane to provide a sufficiently dilute sample for the analysis. Quantification
of asphaltene concentrations in water was performed gravimetrically by filtering a known weight of
separated aqueous phase through a 0.45 m Millipore membrane filter and drying at 90°C to constant
weight. Water content of the oil samples was determined by Karl Fischer titration.

10
2.3 Laboratory partitioning experiments
Samples of the tar were typically diluted in a (w/w) ratio of 1 part tar to 4 parts n-heptane, the result of
which was precipitation of asphaltene particles. (The relatively unstable nature of this tar ensured that a
significant proportion of the total asphaltenes present were precipitated using this ratio of solvent to tar.)
2.3.1 Small-scale experiments
In initial scoping experiments, small samples (ca. 25 mL) of the diluted tar and typically an equal
volume of aqueous surfactant solutions were mixed thoroughly at 85°C, following which the samples
were cooled and qualitatively assessed by visual inspection for phase separation and any evidence of
asphaltene partitioning. Slightly larger scale (100 mL) experiments were used to quantify the efficiency
of surfactant and asphaltene partitioning for a range of conditions using the most promising candidate
surfactant, NPE8. Again, the diluted tar and the appropriate aqueous surfactant solutions were mixed
thoroughly at the required water:oil ratio (WOR) at 85°C and were maintained at this temperature for
typically 20 minutes. The mixtures were then cooled to 70°C slowly over a period of approximately 30
minutes. Following this period, samples of the upper and lower phases were removed for surfactant
concentration determination.
2.3.2 Intermediate-scale experiments
A larger, litre-scale batch system was set up in order to provide better temperature control to
determine the best conditions to use for subsequent pilot-plant tests and to provide visualization of
asphaltene partitioning. The system comprised a 1-L flanged jacketed glass vessel fitted with overhead
stirrer and thermocouple, as shown in Fig.2. Temperature control was via circulating water supplied
from a thermostat bath initially set to a temperature of 85°C, with temperature reduction being provided
by a cooling coil from a chiller unit.
11
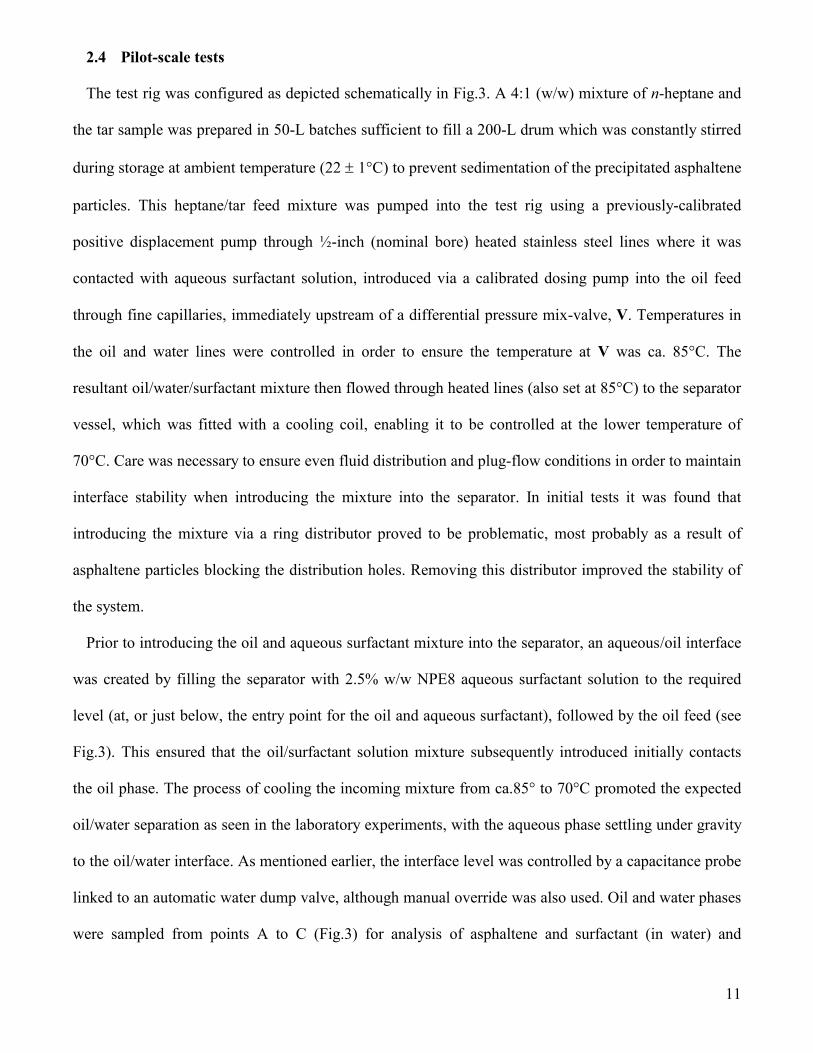
2.4 Pilot-scale tests
The test rig was configured as depicted schematically in Fig.3. A 4:1 (w/w) mixture of n-heptane and
the tar sample was prepared in 50-L batches sufficient to fill a 200-L drum which was constantly stirred
during storage at ambient temperature (22 1°C) to prevent sedimentation of the precipitated asphaltene
particles. This heptane/tar feed mixture was pumped into the test rig using a previously-calibrated
positive displacement pump through ½-inch (nominal bore) heated stainless steel lines where it was
contacted with aqueous surfactant solution, introduced via a calibrated dosing pump into the oil feed
through fine capillaries, immediately upstream of a differential pressure mix-valve, V. Temperatures in
the oil and water lines were controlled in order to ensure the temperature at V was ca. 85°C. The
resultant oil/water/surfactant mixture then flowed through heated lines (also set at 85°C) to the separator
vessel, which was fitted with a cooling coil, enabling it to be controlled at the lower temperature of
70°C. Care was necessary to ensure even fluid distribution and plug-flow conditions in order to maintain
interface stability when introducing the mixture into the separator. In initial tests it was found that
introducing the mixture via a ring distributor proved to be problematic, most probably as a result of
asphaltene particles blocking the distribution holes. Removing this distributor improved the stability of
the system.
Prior to introducing the oil and aqueous surfactant mixture into the separator, an aqueous/oil interface
was created by filling the separator with 2.5% w/w NPE8 aqueous surfactant solution to the required
level (at, or just below, the entry point for the oil and aqueous surfactant), followed by the oil feed (see
Fig.3). This ensured that the oil/surfactant solution mixture subsequently introduced initially contacts
the oil phase. The process of cooling the incoming mixture from ca.85° to 70°C promoted the expected
oil/water separation as seen in the laboratory experiments, with the aqueous phase settling under gravity
to the oil/water interface. As mentioned earlier, the interface level was controlled by a capacitance probe
linked to an automatic water dump valve, although manual override was also used. Oil and water phases
were sampled from points A to C (Fig.3) for analysis of asphaltene and surfactant (in water) and

12
surfactant and water (in oil).
3. Results and Analyses
3.1 Initial laboratory experiments
Scoping experiments were conducted by thoroughly mixing the appropriate quantities of residue, n-
heptane and typically 2.5% w/w aqueous surfactant solution, initially held at 90°C (i.e. ca. 10°C below
the boiling points of both liquid phases). At this initial temperature the surfactants chosen are expected
to partition almost exclusively into the oil phase (comprising n-heptane + residue) with the expectation
(and finding) that a water-in-oil macroemulsion would be formed upon agitating the two phases.
Cooling the different mixtures (at a rate of ca. 1 K min-1
) to a temperature just below the respective TPI
values generally resulted in bulk phase separation, with asphaltene particles being seen to be present in
the lower aqueous phase. On the basis of the initial tests octaoxyethylene nonylphenylether, NPE8, was
found to produce the cleanest separation in terms of oil/water interface quality, together with
qualitatively low observed levels of oil entrainment and highest levels of asphaltenes in the aqueous
phase; this therefore prompted further testing with this surfactant to examine the effects of water:oil
ratio (WOR, expressed as v/v) and surfactant concentration, prior to scaling up to pilot plant conditions.
3.1.1 Effect of WOR on surfactant partitioning.
Fig. 4 shows the effect of WOR on residual surfactant concentrations in oil and water phases
following an asphaltene partitioning thermal cycle and using an initial surfactant concentration of 2.5%
w/w in the aqueous phase. Even allowing for errors associated with the determination of surfactant
concentrations (particularly in the oil phase), it is apparent that the trends in the aqueous phase
composition are more regular; analysis of oil phase samples produces somewhat more erratic results,
ranging between 0.2 and 0.6% w/w. This behaviour is considered to be most likely associated with
inconsistencies in sampling the oil phase, which is likely to contain dispersed, rather than dissolved,

13
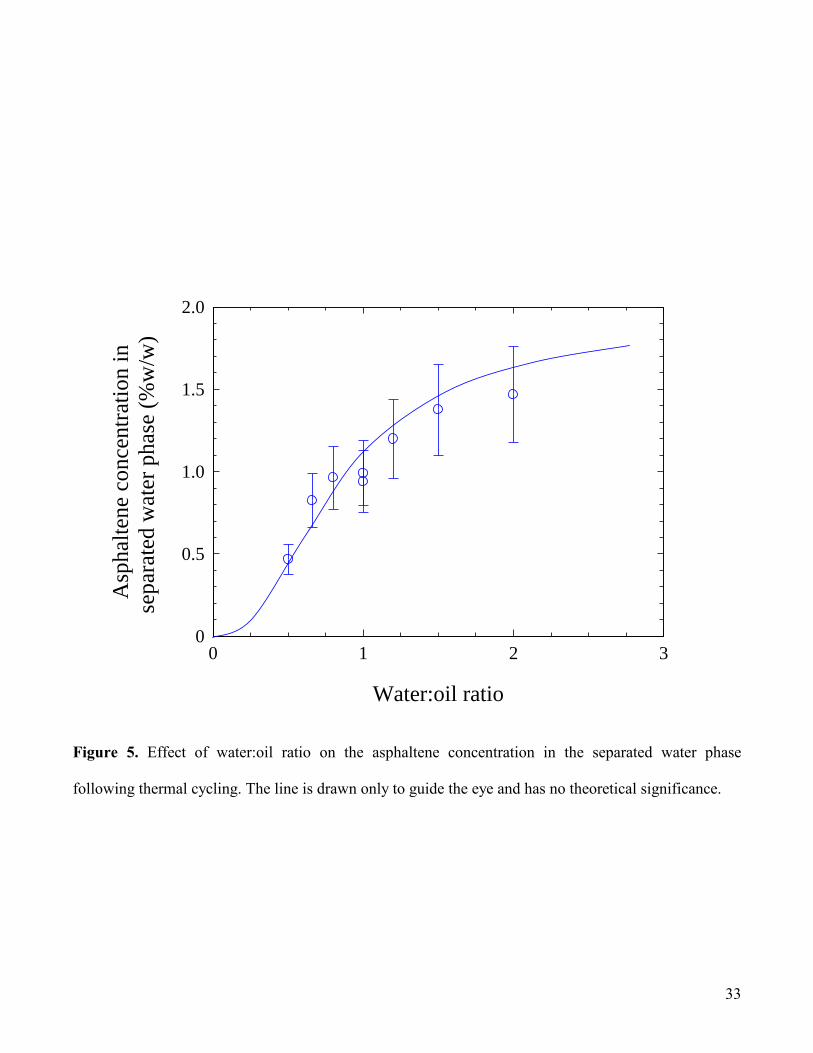
surfactant. Fig.5 shows the corresponding effect of WOR on the aqueous phase asphaltene
concentration. With increasing WOR, the aqueous phase asphaltene concentration is seen to increase in
a regular manner. Since the maximum theoretical aqueous phase concentration can be calculated from:
WOR
2.4 (%w/v)in water ion concentrat Asphaltene (1)
where 2.4% (w/v) is the asphaltene concentration in the feed tar/heptane mixture, the concentration data
from Fig.5 can be converted into transfer efficiency data, as shown in Fig.6. These data indicate a linear
relationship between asphaltene transfer and system composition, such that 100% transfer efficiency is
achieved at a WOR of 1.7, whereas below WOR 0.4 transfer becomes negligible.
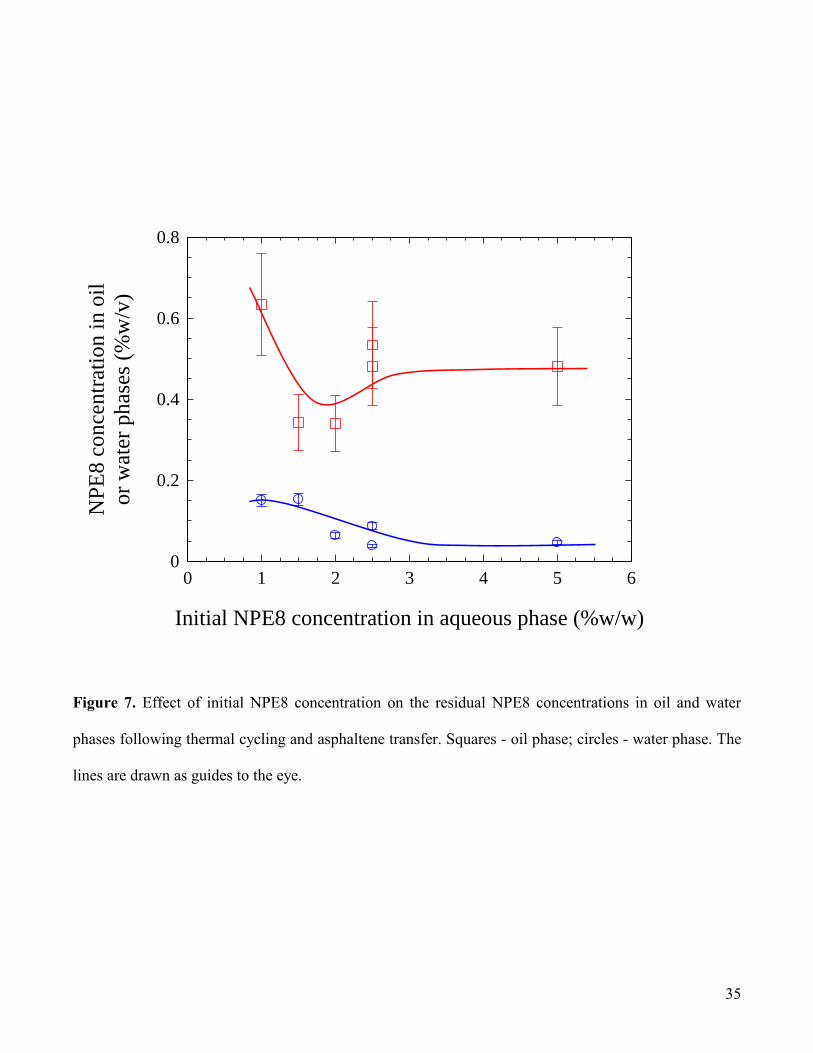
3.1.2 Effect of initial surfactant concentration on surfactant partitioning
In Fig.7, the surfactant concentrations in oil and water phases subsequent to asphaltene partitioning
are plotted as a function of initial surfactant concentration. Even at the lowest initial NPE8
concentrations, it can be seen that the residual concentrations in the oil phase remain relatively high
compared with the corresponding aqueous phase concentrations. The range covered by the measured oil
phase concentrations can be explained essentially as discussed in the previous section. Additionally, it
should be pointed out that for the two lowest NPE8 concentrations studied, 1.0 and 1.5% w/w, no
significant asphaltene partitioning was observed, suggesting that a minimum surfactant concentration is
necessary to facilitate transfer of the particles between the two phases.
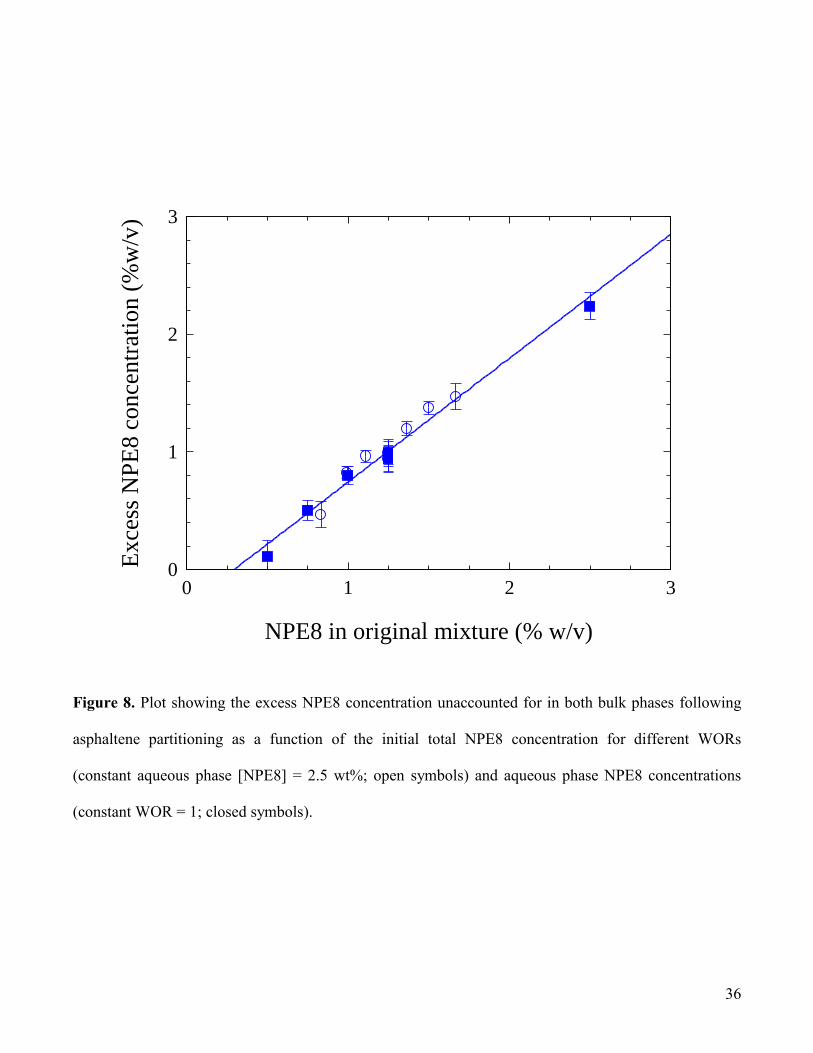
In Fig.8 are shown excess surfactant concentrations following temperature cycling (and asphaltene
partitioning) as a function of the initial NPE8 concentration in the mixed system. This plot represents
the surfactant that is unaccounted for in the bulk oil and water phases and therefore is assumed to be
present as a surfactant-rich Winsor type III phase. Fig.8 includes data where WOR is varied at constant
aqueous surfactant concentration (2.5 % w/v) and aqueous surfactant concentration is varied at
14
constant WOR (= 1). These data confirm the necessity for a minimum surfactant concentration before a
surfactant-rich phase is produced; the linear plot of unit slope shown in Fig.8 yields an intercept on the
x-axis corresponding to a “critical NPE8 concentration” of ca.0.3% w/v. The reduced asphaltene
partitioning efficiency observed at low NPE8 concentrations suggests an association between the
formation of a surfactant-rich phase and asphaltene partitioning.
3.1.3 Intermediate scale testing and visualization of asphaltene partitioning
As a prelude to the pilot-scale tests, it was helpful to scale up and visualize the asphaltene phase
transfer process. Since the stainless steel vessels comprising the pilot plant provided no capability to
observe the separation process, the glass system shown in Fig.2 was used to identify an optimum
asphaltene partitioning temperature, which was the key parameter for the subsequent pilot plant tests. A
system based on WOR = 1, 2.5% w/w NPE8 solution and a 4:1 dilution of tar, as described in the
Experimental section, was examined. It is recognised that the WOR is not optimum, based on the small-
scale laboratory tests, but a 1:1 ratio was more convenient for visual observation.
Initially, the temperature of a thoroughly mixed system was held at 85°C for typically 20-30 minutes.
Other than the phase separation of the bulk oil and water phases, no asphaltene partitioning was evident
at this high temperature, the appearance of the phases being identical to that depicted in Fig.2. It was not
until the temperature had fallen to 77°C that asphaltene particles began to be seen to disengage from the
interface into the lower water phase; the sequence of images shown in Fig.9 show the course of
partitioning. During this sequence, the system was quiescent, with the stirrer (in the aqueous phase)
switched off, allowing for better visualization of the asphaltene transfer. With the stirrer turned on, the
lower aqueous phase darkens more rapidly, as a result of more efficient disengagement of the asphaltene
particles from the interface. Thermal equilibration throughout the biphasic system would also have been
improved with stirring. However, as it was evident that partitioning occurs more effectively below 77°C,
temperatures at or close to this were chosen for use during the pilot-scale tests. Consideration was also
15
given to the consequences of using too low a temperature for partitioning, for which stabilization of oil-
in-water emulsions might be expected to occur.
3.2 Pilot-scale tests
3.2.1 Operational aspects
Limitations with the volume of feed during the larger-scale pilot plant tests prevented a full and
complete evaluation of all experimental variations. However, the results serve to exemplify and extend
the concepts involved, and demonstrate the feasibility of operation in a batch or semi-continuous mode.
3.2.2 Time course for surfactant-mediated asphaltene transfer
Following the initial evaluation of the process parameters described above, and having determined the
operational requirements for stability of the separator vessel under dynamic conditions for short periods
of time, longer duration tests in excess of six hours were carried out. Typically, following the procedures
given in the Experimental section as well as the results of the intermediate batch tests, the operational
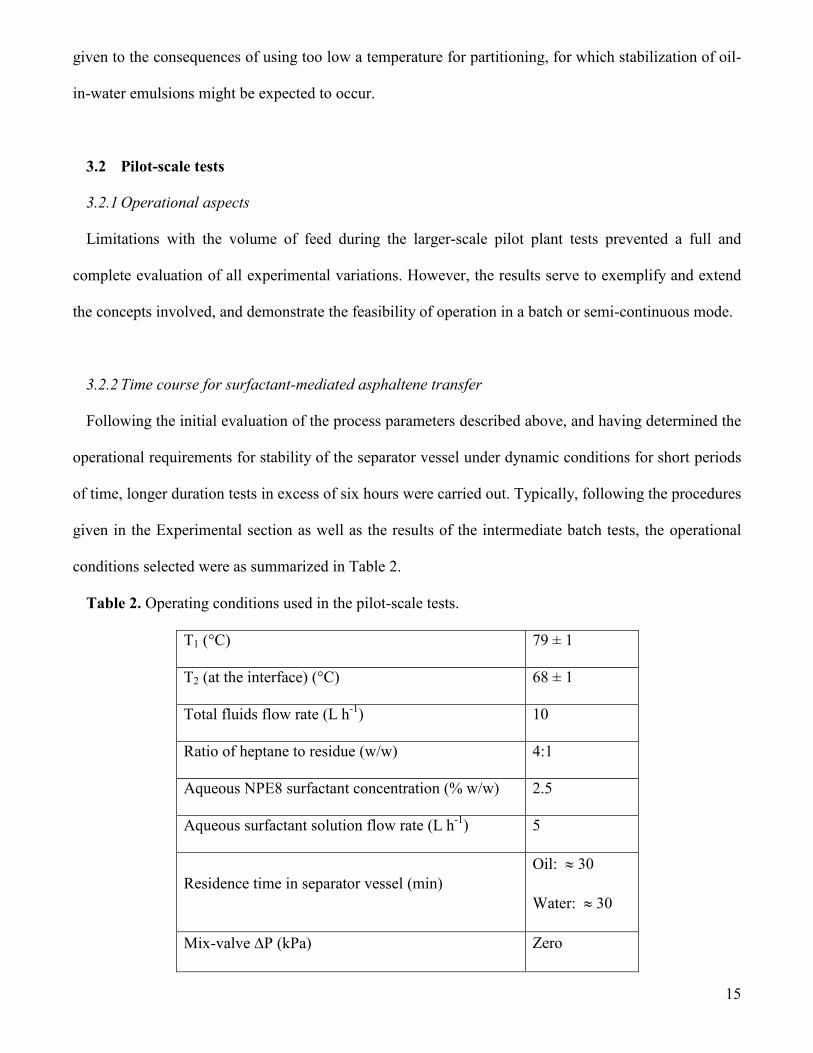
conditions selected were as summarized in Table 2.
Table 2. Operating conditions used in the pilot-scale tests.
T1 (°C) 79 ± 1
T2 (at the interface) (°C) 68 ± 1
Total fluids flow rate (L h-1
) 10
Ratio of heptane to residue (w/w) 4:1
Aqueous NPE8 surfactant concentration (% w/w) 2.5
Aqueous surfactant solution flow rate (L h-1
) 5
Residence time in separator vessel (min)
Oil: 30
Water: 30
Mix-valve P (kPa) Zero

16
After setting up the separator vessel with the heptane/residue mixture and aqueous surfactant solution
interface, the feed surfactant solution and diluted residue mixture was introduced. Interface level control
involved a combination of the automatic water off-take system and manual control, as it was suspected
that operation of the automatic system may have been impaired by the presence of asphaltene particles.
Samples of the feed heptane/residue mixture and outlet oil and water phases were taken at suitable times
during the course of the tests.
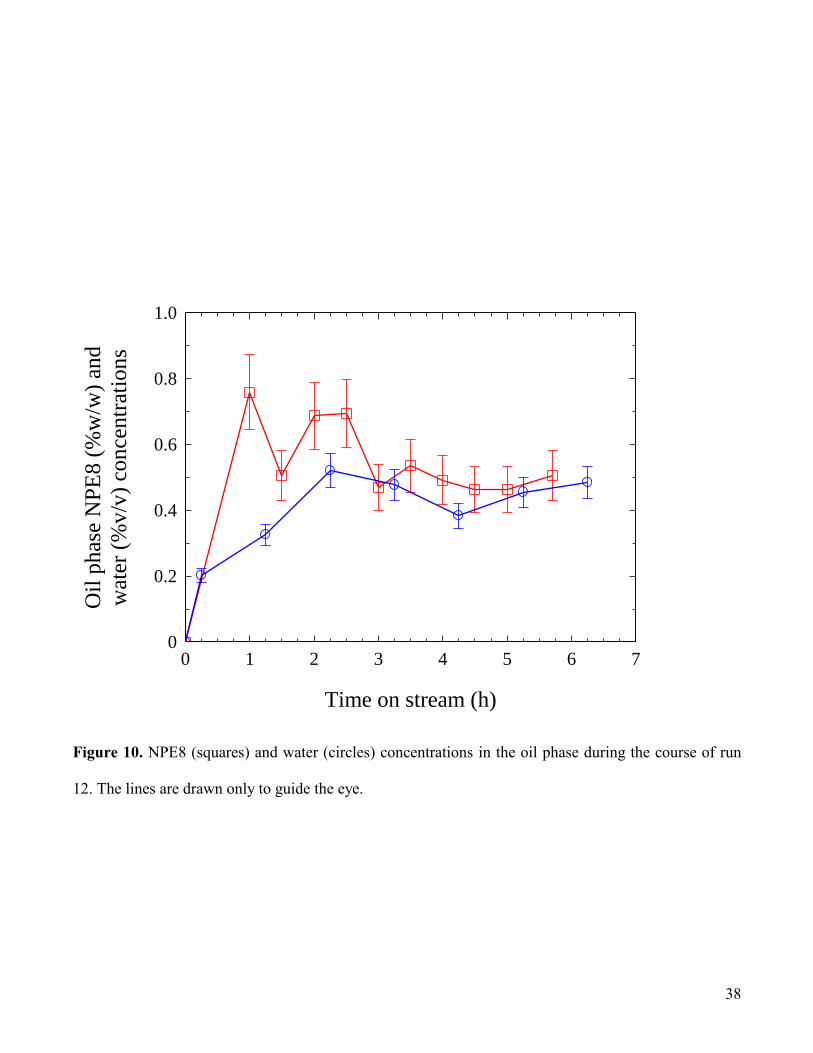
Figs. 10 and 11 show the analytical data obtained run 12, which was one of two tests (the other being
run 16 which is considered below) which ran for over 6 hours, allowing a reasonable degree of stability
to be achieved, and it is for this reason that we will focus on the results of these two particular tests,
which demonstrate that the batchwise laboratory process can also operate successfully under dynamic
conditions over this timescale. In Fig.10 it can be seen that the oil phase surfactant and water
concentrations reach reasonably steady levels after ca. 1.5 hours on stream. The surfactant concentration
data show slightly improved consistency compared with the laboratory results described earlier, reaching
a reasonably steady value of ca. 0.5% w/w. Water concentrations in the outlet oil were also reasonably
constant, also being in the region of 0.5% v/v. If steady-state conditions are assumed for the water and
surfactant in the latter stages of run 12, this corresponds to a molar ratio of water to NPE8 of ca. 50:1
which is suggestive of the presence of microemulsified water, or swollen surfactant micelles (Rosen,
1989).
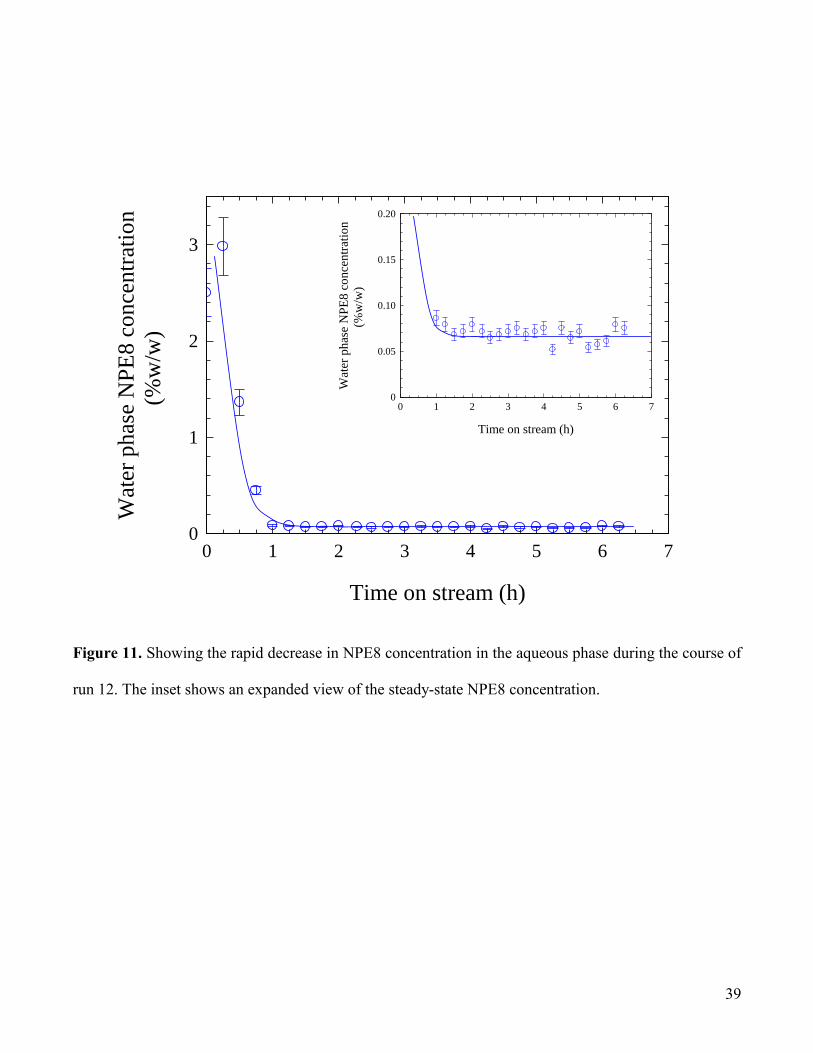
The corresponding aqueous surfactant concentration profile shown in Fig.11 indicates a rapid loss of
surfactant during the course of the first hour on stream, decreasing from the starting concentration of ca.
2.5 - 3% (the slightly higher value possibly arises through phase separation upon being left to stand prior
to starting the test) to a steady value of 0.07 ± 0.01% w/w (i.e. 1.2 mM), approximately 20-fold greater
than the critical micelle concentration of 0.0036% w/w (6.2 10-2
mM) based on Fig.1, cf. the literature
value of 6.8 10-2
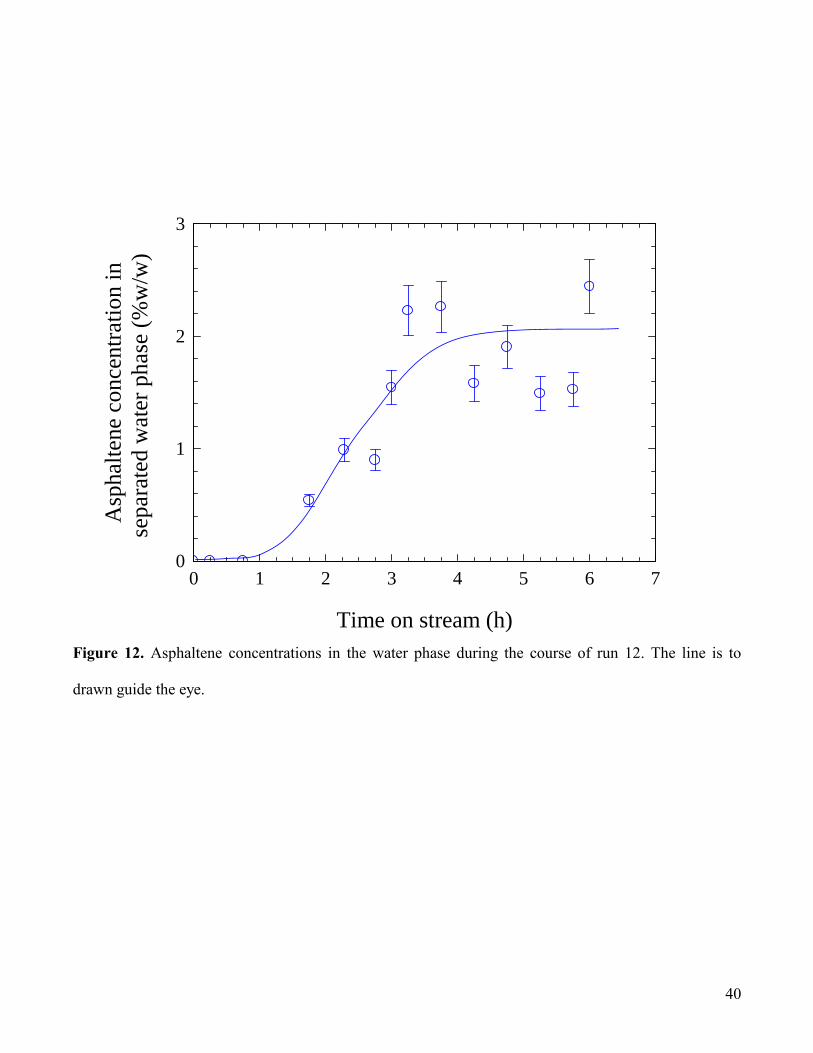
mM (Dai and Tam, 2003). From the concentration profile shown in Fig.12 it is

17
evident that asphaltene transfer steadily increases the aqueous asphaltene concentration over the course
of the first ca. 3 hours, reaching a concentration that is similar to that in the heptane/tar feed (i.e. 2 -
2.5% w/w).
It is reasonable to assume that the difference between the amount of surfactant entering the separator
vessel and that leaving it most likely is a result of the accumulation of a surfactant-rich phase, as found
in the laboratory tests. Sampling the appropriate region of the separator (the interfacial region) to
confirm this assumption was not possible with the present separator vessel configuration, thereby
precluding a full surfactant mass balance analysis. However, under the present test conditions, it appears
that the majority of the surfactant leaving the separator was via the oil phase, which could be present as
discrete droplets of surfactant-rich phase.
For the second extended duration test (run 16), the corresponding data show a general consistency
with the findings for run 12, most notably the rate of decrease in aqueous surfactant concentration and
the relatively constant concentrations of surfactant, water and asphaltene. During this test, however,
changes were made to the process parameters in order to determine the concomitant system response.
Based on the above results, which provide an indication of the time required to achieve reasonable
steady-state conditions, it is accepted that steady-state conditions were not likely to be established during
run 16, although it does provide some indicative trends.
3.2.3 Effect of process parameters
(a) Oil and water phase mixing regime
Two types of mixing regime were used, viz. injection of the water into the oil feed stream through
capillaries alone, and with subsequent mixing through a differential pressure mix-valve. Results
indicated that the latter was unnecessary and contributed to more persistent emulsion problems (the
incorporation of emulsified oil in the water phase). The preferred conditions therefore involved the
simple injection of surfactant solution into the oil phase which utilizes relatively mild mixing

18
conditions.
(b) Water:oil ratio
It was expected that the WOR used in the process would influence partitioning through (i) the change
in the total amount of surfactant in the system (for a given aqueous surfactant concentration), and (ii) the
degree of contact established between oil and water phases. Laboratory experiments had originally been
performed at WOR = 1, and consequently this was chosen as the base case for the pilot-scale studies.
The original surfactant concentration was based on the initial laboratory results which indicated that a
minimum level of surfactant is necessary to facilitate asphaltene transfer. This was also borne out in the
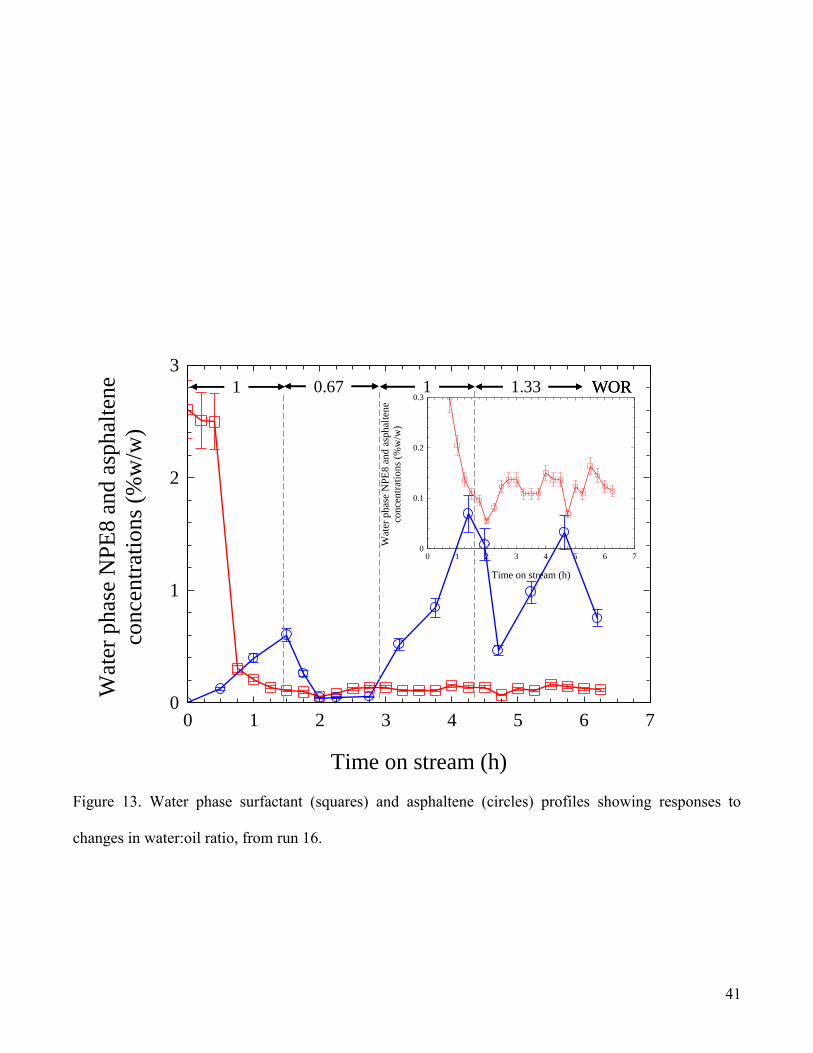
pilot plant tests. From the profiles shown in Fig.13 for run 16, it is evident that for WOR = 1, the initial
increase in asphaltene concentration in the water phase is similar to that found for run 12 (Fig.12).
However, the increasing trend in asphaltene concentration was arrested upon lowering WOR (to 0.67
corresponding to a reduction in the effective available concentration of NPE8 to 80% of its original
value, at constant total fluids flow rate), with the asphaltene concentration in the water phase being
reduced to trace levels within approximately 30 minutes. This response was surprising and totally
unexpected and in an attempt to re-establish the earlier conditions the WOR was returned to 1. This
caused a rapid response during which the aqueous asphaltene concentration increasing to the expected
higher level within a timescale similar to the start-up conditions (Fig.12). Increasing the WOR to 1.33
resulted in an abrupt decrease in asphaltene concentration, presumably as a reaction to the change in
flow conditions, which then appeared to re-attain a more erratic, but generally lower level, as would be
expected on the basis of the increased WOR, as described earlier. (Additionally, the expanded surfactant
concentration data shown in the inset in Fig.13 also show evidence for response to the changes in
conditions.) For low WOR, and correspondingly low surfactant levels, it is likely that asphaltene
particles accumulate at the interface, but are unable to transfer into the water. Increasing the WOR
would serve to increase the total surfactant concentration, thereby effecting disengagement and phase
transfer of these particles from the interface, increasing the erratic nature of the asphaltene

19
concentration. Although the available run duration was strictly insufficient for complete steady-state
conditions to be established (as found for run 12), it is nevertheless considered sufficient to establish
some general trends relating to process efficiency, sensitivity and response time. In Fig.14 are shown the
corresponding surfactant and water concentration profiles in the separated oil phase. It can be seen that
the oil phase composition responds relatively rapidly to the change in WOR, with the water and
surfactant concentrations tracking each other very well, as observed for run 12 (Fig.10). As for run 12,
residual levels of water and surfactant are ca. 0.5%.
(c) Process temperature
As the process requires a change in temperature to facilitate phase transfer of asphaltene particles,
maintaining adequate control over the temperature profile is essential for optimized efficiency. In the
pilot-scale tests it was particularly evident that the relative values of T1 and T2 (Table 2 and Fig.3)
influenced considerably the quality of the produced water phase, with respect to the oil and asphaltene
contents. For example, if T1 was too low (75 – 80°C) the produced water phase contained high levels of
emulsified oil, which is a consequence of the increased water solubility of NPE8 at temperatures
approaching the TPI for this surfactant. In the system used in this study, temperature control was not
ideal, and consequently, unwanted temperature gradients were inevitably generated throughout the
system, and in particular in the separator. Initially, the lower part of the separator containing the aqueous
phase was slow to heat up to the working temperature T2, and this is reflected in the observed change in
aqueous surfactant concentration at the start of the runs (in particular see Fig.11).
(d) Position of fluids injection
There are essentially three positions for injecting the fluids into the separator: (i) above the oil/water
interface into the oil phase; (ii) at the precise position of the interface; and (iii) below the interface into
the water phase. Injection at each of these three positions was investigated during early preliminary tests,
20
when it was found that the preferred position was at or just above the interface, as injection directly into
the aqueous phase led to increase residual oil concentrations in the water.
3.2.4 Asphaltene mass balance
Aqueous phase asphaltene concentrations plotted in Figs.12 and 13 refer to filtered, water-washed and
dried material and as such are difficult to correlate with the original asphaltene concentration in the feed
oil. However, subjecting several samples of aqueous phase asphaltenes from run 12 to Soxhlet
extraction (with n-heptane for 2 h) to remove associated oil indicates that the asphaltene particles
contain 81 2 % (w/w) genuine “heptane insolubles”. Repeating this with the oil phase asphaltenes
allowed the calculation of a transfer efficiency of 80 10% for this system. The remaining asphaltenes
are presumably associated with the heptane/DAO phase, possibly being small enough to be held up
during the residence time in the separator.
3.2.5 Characterization of the aqueous asphaltene dispersion
Fig.15 contains particle size (volume) distributions of the aqueous asphaltene dispersion samples
taken from the latter stages of each of the extended runs 12 and 16 and, by way of comparison, of a feed
oil sample used in run 16. The particle size distributions were found to be relative unaffected by
ultrasonication, such that the differences most likely originate from the original precipitation stage. Also
shown in Fig.15 are fitted log-normal distribution curves which are used to provide a guide to the major
underlying distributions, attempting to eliminate effects due to aggregation. Thus, median (based on
particle volume) particle sizes of 5.5, 7.8 and 9.8 m are obtained for, respectively, the feed sample
from run 16, the water-partitioned sample from the same run and a partitioned sample from run 12. The
distributions are seen to be consistent with the optical photomicrographs shown in Fig. 16, from which
the visual similarity between asphaltene particles in the heptane-diluted feed with the corresponding
particles transferred to the water phase (for run 12) is clearly evident, and in particular the presence of
21
large (> 50 m) particles (agglomerates?) in both samples.
The ca. 1.5% asphaltene-in-water dispersions produced during the pilot plant runs exhibited
reasonable stability towards sedimentation, since the asphaltene density is only slightly greater than
water. However, allowing the dispersions to stand for ca. 2 weeks produced compacted sediments
containing ca. 20% w/w solids, which were able to be easily redispersed by stirring with a spatula.
4. Discussion
In the case of ethoxylated surfactants, the partition coefficient varies as a function of the number of
ethylene oxide groups per molecule (x), and hence to the hydrophile-lipophile balance (HLB), given by
)22044(
44 20 HLB
x
x. (2)
Commercial ethoxylated nonylphenol surfactants (as used here) comprise ethylene oxide oligomers
(NPEi) conforming to Poisson distributions, given by
)exp(!
xi
xX
i
i , (3)
where Xi is the mole fraction of oligomer with chain length i in NPEx (Schick, 1967).
Fig.17 shows a Poisson distribution for NPE8 based on eq.3, which shows that the component
oligomers are distributed between NPE2 and NPE15. Each of these oligomers will be expected to
partition to different extents between oil and water phases, with the most lipophilic components (lower
ethoxylate chain lengths) being preferentially associated with the oil phase and the higher ethoxylated
species being associated with the water phase; consequently, different mean oligomer distributions will
be present in each phase, as reviewed recently by Graciaa et al. (2006). This aspect was originally
investigated by Crook et al. for oligomeric octylphenyl ethoxylates, for which the partition coefficient
between water and oil, oil
i
water
ii ccK , was found to vary with the length of the ethoxylate chain in a
regular way for a given hydrophobic group; below the critical micelle concentration, Ki was found to
increase by four orders of magnitude as i increased from 1 to 10 (Crook et al., 1965). Empirically, it
22
has been found that the relationship
iKKi 45.0loglog 0 , (4)
in which K0 is the partition coefficient for nonylphenol itself, provides an excellent correlation with
experimental data at a given temperature and for a number of different hydrophobic groups. The effect
of temperature was followed up more recently by Salager et al. (2000) who found that partition
coefficients for oligomeric surfactant species (octylphenyl ethoxylates in their case) varied with
temperature in a way that is entirely predictable with thermodynamic considerations, accordant with the
free energy of transfer of the surfactant molecule from water to oil (or vice versa), i.e.
oilwateri
oil
i
water
i
oil
i
water
ii ccRTKRT ***)/ln(ln . (5)
Treating i* as a thermodynamic function comprising enthalpic and entropic contributions, hi* and
si*, respectively, Salager et al. (2000) showed that the equation
R
s
RT
hK ii
i
**ln
(6)
is entirely consistent with the experimental results. Additionally, hi* and si* were each found to show
a different linear dependency on i.
As is evident from these findings, increasing the temperature or decreasing i will favour oligomer
partitioning into the oil phase, with each component oligomer behaving differently, as reflected in the
respective oligomer phase inversion and cloud point temperatures (Shinoda and Arai, 1964). It is not
surprising, therefore, that in the present study we have observed a relatively broad temperature range
over which asphaltene partitioning occurs, beginning at ca. 77°C and apparently extending down to
below 60°C (e.g. Fig.9). Within this temperature range it is likely that the most hydrophilic oligomers
will partition (Graciaa et al., 2006). Nor is it unreasonable that the surfactant concentration data are
subject to some uncertainty.
As the critical asphaltene partitioning temperature, Tc (which may be identified with TPI), is
approached from a higher temperature, a surfactant-rich (coacervate) phase comprising the more

23
hydrophilic NPE8 components will separate, initially as discrete droplets, from the DAO/heptane phase.
The high density of these droplets will facilitate their sedimentation to the interface, together with the
asphaltene particles. It is also possible that these droplets could coalesce with the relatively polar
asphaltene particles before reaching the interface, such that a surfactant-rich wetting layer is formed on
the asphaltene surface. Whichever way the interface is formed, however, it would be expected that the
presence of surfactant intimately associated with the asphaltene particles will serve to increase the
affinity of the latter for the aqueous phase, facilitating phase transfer, whilst also contributing to oil
phase dewetting.
As indicated at the outset of this paper, the concept of asphaltene separation from alkane-diluted
residues through partitioning into water may have useful applications. Results presented herein provide
a demonstration of its technical feasibility, although it is conceded that surfactant losses would need to
be minimised, and preferably eliminated, if an economically viable process is to be achieved. The
brown, rather than black, colour of the resultant dispersed particles suggests that the particles are
substantially different from asphaltene powders obtained by grinding. This may result from different
surface textures or, more likely, from different composition of the partitioned material. Detailed analyses
to establish this have not been carried out in the present study.
Very recently, Zhao and Wei (2008a,b) have reported a process for the simultaneous removal of
asphaltene and water from water-in-bitumen emulsions at 150-180°C using a precipitating (alkane)
solvent, preferably n-pentane. Thermal treatment of mixtures of the three main components is found to
result in the production of a deasphalted oil phase (containing n-pentane) and an asphaltene-in-water
suspension.
4.1 Practical and Economic Considerations
There are several technologies competing for asphaltene separation which will constrain the
development of a surfactant-based process such as described herein. As mentioned earlier, loss of

24
surfactant is possibly the foremost limitation of the process. However, particular circumstances could
enable the development of the present approach, providing that certain criteria are met. Firstly, there
should be an application and market for an aqueous asphaltene dispersion product, most likely as a
water-based boiler fuel. In this case, loss of surfactant may be sustainable, since asphaltene dispersions
require stabilising surfactant. Alternatively, a surfactant recycling scheme would need to be established.
A further important consideration is that ethoxylated nonylphenol surfactants of the type used in the
present demonstration are the subjects of environmental and legislative constraints, restricting the
industrial use of these materials. Thus, there would be a requirement to identify suitable alternative
surfactants should further development be considered.
5. Conclusions
A conceptual scheme for the temperature-induced partitioning of n-heptane-precipitated asphaltenes
directly from an oil phase into water has been demonstrated based on the nonionic surfactant NPE8.
Initial small scale laboratory testing has been scaled up in order to provide a visual demonstration of the
process, which involves sedimentation of the asphaltene particles to an oil-water interface, followed by a
temperature-induced disengagement of the particles from the interface into the aqueous phase in which
they exhibit only modest colloidal stability. A minimum surfactant concentration has been found to be
necessary before partitioning is observed. This concentration appears to correspond closely to that
required for the formation of a surfactant-rich phase in the oil medium upon a temperature reduction,
suggesting that the two observations are linked. The process has been further scaled up and
demonstrated at a larger, semi-continuous scale for which variation in certain operational parameters has
been evaluated within the constraints of material availability.
Acknowledgements
I am grateful to Mike Greenhill-Hooper, Saleem-Ullah Sheikh, Mark Aston and Hugh Bourne for their
25
contributions during the initial stages of the work conducted at the former BP Research Centre,
Sunbury-on-Thames, Middlesex, UK, and the University of Surrey for providing a Visiting Readership
enabling its completion.
References
Albertsson, P. -A., 1978, Partition between polymer phases. J. Chromat. A, 159: 111-122.
Angle, C.W., Long, Y., Hamza, H. and Lue, L., 2006, Precipitation of asphaltenes from solvent-diluted
heavy oil and thermodynamic properties of solvent-diluted heavy oil solutions, Fuel, 85: 492-506.
Aveyard, R., Binks, B.P., Lawless, T.A. and Mead, J., 1985, Interfacial tension minima in oil + water +
surfactant systems, J. Chem. Soc. Faraday Trans. I, 81: 2155-2168.
Bai, D., Li, J., Chen, S. B. and Chen, B. -H., 2001, A novel cloud-point extraction process for
preconcentrating selected polycyclic aromatic hydrocarbons in aqueous solution. Environ. Sci. Technol.,
35: 3936-3940.
Barton, A.F.M., 1991, Handbook of Solubility Parameters and Other Cohesion Parameters; 2nd
ed.
(CRC Press Inc., New York).
Boucher, E.A., 1989, Separation of small-particle dispersions by the preferential accumulation in one of
two liquid phases, or by static flotation at their interface. J. Chem. Soc. Faraday Trans. I, 85: 2963-
2972.
Buzier, M. and Ravey, J.-C., 1983, Solubilization properties of nonionic surfactants. I. Evolution of the
ternary phase diagrams with temperature, salinity, HLB, and CAN, J. Coll. Int. Sci., 91: 20-33.
Crook, E.H., Fordyce, D.B. and Trebbi, G.F., 1965, Molecular weight distribution of non-ionic
surfactants: II. Partition coefficients of normal distribution and homogeneous p-tert-

26
octylphenoxyethoxy-ethanols (OPE's), J. Coll. Sci., 20: 191-204.
Dai, S and K.C. Tam, K.C., 2003, Isothermal titration calorimetric studies of alkylphenol ethoxylate
surfactants in aqueous solutions. Colloids and Surfaces, A229: 157–168.
Gallagher, P. D. and Maher, J. V., 1992, Partitioning of polystyrene latex spheres in immiscible critical
liquid mixtures. Phys. Rev. A, 46: 2012-2021.
Graciaa, A., Andérez, J., Bracho, C. Lachaise, J. Salager, J.-L., Tolosa, L. and Ysambertt, F., 2006, The
selective partitioning of the oligomers of polyethoxylated surfactant mixtures between interface and oil
and water bulk phases, Adv. Coll. Int. Sci., 123-126: 63-73.
Huibers, P.D.T., Shah, D.O. and Katritzky, A.R., 1997, Predicting surfactant cloud point from molecular
structure. J. Coll. Int. Sci., 193: 132-136.
Ito, A., Nii, S., Kawaizumi, F. and Takahashi, K., 2003, Separation of clay minerals based on phase
transition of surfactant followed by cooling, Sep. Pur. Technol., 30: 139-146.
Jauregi, P., Hoeben, M. A., van der Lans, R. G. J.M., Kwant, G. and van der Wielen, L. A. M., 2001,
Selective separation of physically near-identical microparticle mixtures by interfacial partitioning, Ind.
Eng. Chem. Res., 40: 5815-5821.
Kolev, V.L., Kochijashky, I.I., Danov, K.D., Kralchevsky, P.A., Broze, G. and Mehreteab, A., 2003,
Spontaneous detachment of oil drops from solid substrates: governing factors. J. Coll. Int. Sci., 257:
357-363.
Komaromyhiller, G. and von Wandruszka, R., 1995, Decontamination of oil-polluted soil by cloud point
extraction, Talanta, 42: 83-88.
León, O., Contreras, E., Rogel, E., Dambakli, G., Acevedo, S., Carbognani, L. and Espidel, J., 2002,
Adsorption of native resins on asphaltene particles: A correlation between adsorption and activity.
27
Langmuir, 18: 5106-5112.
Logaraj, S., Ernzen, T.J., Ng, A.C., Stroder, M.A., DeCanio, S.J., McKeon, R.J. and Shirodkar, S.M.,
2000, Fuel containing a petroleum hydrocarbon, US Patent 6,113,659.
Loven, A. W. and Rice, O. K., 1963, Coexistence curve of 2,6-lutidine+water system in critical region,
Trans. Faraday Soc., 59: 2723-2727.
Matsushita, K., Marafi, A., Hauser, A. and Stanislaus, A., 2004, Relation between relative solubility of
asphaltenes in the product oil and coke deposition in residue hydroprocessing, Fuel, 83: 1669-1674.
Mohammed, R. A., Bailey, A. I., Luckham, P. F. and Taylor, S. E., 1993, Dewatering of crude oil
emulsions. 2. Interfacial properties of the asphaltic constituents of crude oil, Coll. Surf., A80: 237-242.
Mullins, O.C., 2007, Rebuttal to comment by professors Herod, Kandiyoti and Bartle on ‘‘Molecular
size and weight of asphaltene and asphaltene solubility fractions from coals, crude oils
and bitumen’’, Fuel, 86: 309-312.
Netz, R.R., 1996, Colloidal flocculation in near-critical binary mixtures, Phys. Rev. Lett., 76: 3646-
3649.
Rahmani, S., McCaffrey, W. C., Dettman, H. D. and Gray, M. R., 2003, Coking kinetics of asphaltenes
as a function of chemical structure. Energy Fuels, 17: 1048-1056.
Rana, M.S., Sámano, V., Ancheyta, J. and Diaz, J.A.I., 2007, A review of recent advances on process
technologies for upgrading of heavy oils and residua. Fuel, 86: 1216-1231.
Ravera, F., Ferrari, M. and Liggieri, L., 2000, Adsorption and partitioning of surfactants in liquid-liquid
systems, Adv. Coll. Int. Sci., 88: 129-177.
Rogel, E., 1998, Theoretical approach to the stability of visbroken residues, Energy Fuels, 12: 875-880.
28
Rosen, M.J., 1989, Surfactants and Interfacial Phenomena, (Wiley-Interscience, New York), pp 191-
196.
Salager, J.–L., Marquez, N., Graciaa, A. and Lachaise, J., 2000, Partitioning of ethoxylated octylphenol
surfactants in microemulsion-oil-water systems: Influence of temperature and relation between
partitioning coefficient and physicochemical formulation. Langmuir, 16: 5534-5539.
Schick,M., 1967, Nonionic Surfactants, (Marcel Dekker, NewYork).
Shinoda, K. and Arai, H., 1964, The correlation between phase inversion temperature in emulsion and
cloud point in solution of nonionic emulsifier. J. Phys. Chem., 68: 3485-3490.
Shinoda, K. and Kunieda, H., 1985, Phase Properties of Emulsions: PIT and HLB, in Encyclopedia of
Emulsion Technology, Becher, P., (ed) (Marcel Dekker, New York), Vol. 1, pp 337-367.
Shirodkar, S.M. and McKeon, R.J., 2000, Process for stable asphaltene solutions, US Patent 6,027,634.
Spiecker, P. M., Gawrys, K. L., Trail, C. B. and Kilpatrick, P. K., 2003 Effects of petroleum resins on
asphaltene aggregation and water-in-oil emulsion formation. Coll. Surf, A220: 9-27.
Staples, C., Mihaich, E., Carbone, J., Woodburn, K. and Klecka, G., 2004, A weight of evidence
analysis of the chronic ecotoxicity of nonylphenol ethoxylates, nonylphenol ether carboxylates, and
nonylphenol, Human Ecological Risk Assess, 10: 999-1017.
Zhang, L., Yang, G., Que, G., Zhang, Q. and Yang. P., 2007, Study on the mean dipole moments of
Dagang atmosphere residue fractions, J. Fuel Chem. Technol., 35: 289-292.
Zhao, Y. and Wei, F., 2008a, Simultaneous removal of asphaltenes and water from water-in-bitumen
emulsion. I. Fundamental development, Fuel Proc. Technol., 89: 933-940.
Zhao, Y. and Wei, F., 2008b, Simultaneous removal of asphaltenes and water from water-in-bitumen

29
emulsion. II. Application Feasibility, Fuel Proc. Technol., 89: 941-948.
30
Figure 1. Concentration dependence of the surface and interfacial tension of NPE8 solutions used to
determine oil phase surfactant concentrations.
20
30
40
50
60
70
-4 -3 -2 -1 0 10
10
20
30
Log(NPE8 concentration/%w/w)
Su
rfac
e te
nsi
on
(m
N m
-1)
Inte
rfac
ial
ten
sio
n (
mN
m-1
)

31
Figure 2. Vessel used to demonstrate temperature-controlled asphaltene partitioning.
Figure 3. Simplified schematic flow diagram of the pilot-scale unit used in the asphaltene partitioning
tests.
VT1
T2
Surfactant
solutionResidue +
heptane
Deasphalted
oil + solvent
out
Capacitance
probe control
Ring distributor
Water +
asphaltene
outOil / water /
surfactant
emulsion in
A
B
C
Internal cooling
coil
VT1
T2
Surfactant
solutionResidue +
heptane
Deasphalted
oil + solvent
out
Capacitance
probe control
Ring distributor
Water +
asphaltene
outOil / water /
surfactant
emulsion in
AA
BB
CC
Internal cooling
coil
Stirrer
Circulating
water out
Water
phase
drain
Circulating
water in
Temperature
indicator
Thermocouple
positioned at
interfaceStirrer
Circulating
water out
Water
phase
drain
Circulating
water in
Temperature
indicator
Thermocouple
positioned at
interface

32
Figure 4. Effect of water:oil ratio on the residual NPE8 concentrations in oil and water phases following
thermal cycling and asphaltene transfer. Squares - oil phase; circles - water phase. The line is drawn only
to guide the eye.
0
0.2
0.4
0.6
0.8
0 1 2
Water:oil ratio
NP
E8
co
nce
ntr
atio
n i
n o
il
or
wat
er p
has
es (
%w
/v)
33
Figure 5. Effect of water:oil ratio on the asphaltene concentration in the separated water phase
following thermal cycling. The line is drawn only to guide the eye and has no theoretical significance.
0
0.5
1.0
1.5
2.0
0 1 2 3
Water:oil ratio
Asp
hal
ten
e co
nce
ntr
atio
n i
n
sep
arat
ed w
ater
ph
ase
(%w
/w)

34
Figure 6. Effect of water:oil ratio on the efficiency of asphaltene transfer from diluted oil to water
during thermal cycling.
0
20
40
60
80
100
0 1 2 3
Water:oil ratio
Asp
hal
ten
e tr
ansf
er e
ffic
ien
cy (
%)
0
20
40
60
80
100
0 1 2 3
Water:oil ratio
Asp
hal
ten
e tr
ansf
er e
ffic
ien
cy (
%)
35
Figure 7. Effect of initial NPE8 concentration on the residual NPE8 concentrations in oil and water
phases following thermal cycling and asphaltene transfer. Squares - oil phase; circles - water phase. The
lines are drawn as guides to the eye.
0
0.2
0.4
0.6
0.8
0 1 2 3 4 5 6
Initial NPE8 concentration in aqueous phase (%w/w)
NP
E8
co
nce
ntr
atio
n i
n o
il
or
wat
er p
has
es (
%w
/v)
36
Figure 8. Plot showing the excess NPE8 concentration unaccounted for in both bulk phases following
asphaltene partitioning as a function of the initial total NPE8 concentration for different WORs
(constant aqueous phase [NPE8] = 2.5 wt%; open symbols) and aqueous phase NPE8 concentrations
(constant WOR = 1; closed symbols).
0
1
2
3
0 1 2 3
NPE8 in original mixture (% w/v)
Ex
cess
NP
E8
co
nce
ntr
atio
n (
%w
/v)

37
Figure 9. Still frames captured from a video sequence showing asphaltene partitioning during cooling
(temperature indicated) the NPE8/water/tar/heptane system (images run sequentially down the columns,
and from left to right).
38
Figure 10. NPE8 (squares) and water (circles) concentrations in the oil phase during the course of run
12. The lines are drawn only to guide the eye.
0
0.2
0.4
0.6
0.8
1.0
0 1 2 3 4 5 6 7
Time on stream (h)
Oil
ph
ase
NP
E8
(%
w/w
) an
d
wat
er (
%v
/v)
con
cen
trat
ion
s
39
Figure 11. Showing the rapid decrease in NPE8 concentration in the aqueous phase during the course of
run 12. The inset shows an expanded view of the steady-state NPE8 concentration.
0
1
2
3
0 1 2 3 4 5 6 7
Time on stream (h)
Wat
er p
has
e N
PE
8 c
on
cen
trat
ion
(%w
/w)
0
0.05
0.10
0.15
0.20
0 1 2 3 4 5 6 7
Time on stream (h)
Wat
er p
has
e N
PE
8 c
on
cen
trat
ion
(%w
/w)
40
Figure 12. Asphaltene concentrations in the water phase during the course of run 12. The line is to
drawn guide the eye.
0
1
2
3
0 1 2 3 4 5 6 7
Time on stream (h)
Asp
hal
ten
e co
nce
ntr
atio
n i
n
sep
arat
ed w
ater
ph
ase
(%w
/w)
41
Figure 13. Water phase surfactant (squares) and asphaltene (circles) profiles showing responses to
changes in water:oil ratio, from run 16.
WOR1 10.67 1.33 WOR1 10.67 1.33
0
1
2
3
0 1 2 3 4 5 6 7
Time on stream (h)
Wat
er p
has
e N
PE
8 a
nd
asp
hal
ten
e
con
cen
trat
ion
s (%
w/w
)
0
0.1
0.2
0.3
0 1 2 3 4 5 6 7
Time on stream (h)
Wat
er p
has
e N
PE
8 a
nd
asp
hal
ten
e
con
cen
trat
ion
s (%
w/w
)

42
Figure 14. Oil phase surfactant (squares) and water (circles) concentration profiles during run 16,
showing the response to WOR changes.
WOR1 10.67 1.33 WOR1 10.67 1.33
0
0.2
0.4
0.6
0.8
1.0
0 1 2 3 4 5 6 7
Time on stream (h)
Oil
ph
ase
NP
E8
(%
w/w
) an
d
wat
er (
%v
/v)
con
cen
trat
ion
s

43
Figure 15. Particle size (volume) distributions for (a) heptane-precipitated asphaltenes in the sample
used for run 16; (b) asphaltenes partitioned into water during run 16 (sample taken after 4 h); and (c)
asphaltenes partitioned into water during run 12 (sample taken after 5 h). The patterned lines are the
measured distributions and the solid lines represent log-normal distributions representing the major
volume of the sample, excluding larger, probably aggregated, particles.
0
1
2
3
4
5
6
7
8
9
1 10 100
Particle diameter (m)
Vo
lum
e (
%)
0
1
2
3
4
5
6
7
1 10 100
0
1
2
3
4
5
6
7
8
9
1 10 100
(a) (b) (c)
0
1
2
3
4
5
6
7
8
9
1 10 100
Particle diameter (m)
Vo
lum
e (
%)
0
1
2
3
4
5
6
7
1 10 100
0
1
2
3
4
5
6
7
8
9
1 10 100
(a) (b) (c)

44
Figure 16. (a) Photomicrographs of precipitated asphaltenes (a) in the 4:1 heptane-diluted residue from
run 16, and (b) the water phase from the same run after partitioning. Each scale bar is 100 microns long.

45
Figure 17. Calculated Poisson distribution of the oligomers comprising a polydisperse sample of NPE8.
0
0.05
0.10
0.15
0 2 4 6 8 10 12 14 16 18 20
Ethylene oxide chain length, i
Mo
le f
ract
ion
of
NP
Ei
Recommended