
DESIGN, CONTROL AND SIMULATION OF PMSG BASED STAND-ALONE
WIND ENERGY CONVERSION SYSTEM
A thesis submitted in partial fulfilment
Of the requirements for the award of the degree of
Dual Degree [B.Tech/M.Tech]
In
Electrical Engineering
Submitted By
Debabrata Thatoi
Roll no-710ee2034
Under the guidance of
Prof. Monalisha Pattnaik
Department of Electrical Engineering
National Institute of Technology, Rourkela,
Odisha-769008

i
Department of Electrical Engineering
National institute of Technology, Rourkela
CERTIFICATE
This is to certify that the thesis entitled “DESIGN, CONTROL AND SIMULATION OF
PMSG BASED STAND-ALONE WIND ENERGY CONVERSION SYSTEM” being
submitted by Mr. Debabrata Thatoi to National Institute of Technology, Rourkela (Deemed
University) for the award of Dual degree in Electrical Engineering Department with
specialization in “power electronics and drive”, is a bonafide research work carried out
by him in the Department of electrical engineering, under my supervision and guidance. I
believe that this thesis fulfills the part of the requirement for the award of degree of Master
of technology. The research reports and the results embodied in this thesis have not been
submitted in parts or full to any other university or institution for the award of any other
degree or diploma
Prof Monalisha Pattnaik
Dept. of Electrical Engineering
National Institute of Technology
Rourkela, Odisha, 769008
INDIA
Place : N.I.T Rourkela
Date : 28/05/2015

ii
ACKNOWLEDGEMENT
First and foremost, I am truly indebted and wish to express my gratitude to my supervisor
Professor Monalisha Pattnaik for her inspiration, excellent guidance, continuing
encouragement and unwavering confidence and support during every stage of this
endeavor without which, it would not have been possible for me to complete this
undertaking successfully. I also thank her for his insightful comments and suggestions
which continually helped me to improve my understanding. I express my deep gratitude to
the members of Masters Scrutiny Committee,
I am also very much obliged to the Head of the Department of Electrical Engineering, NIT
Rourkela for providing all possible facilities towards this work. Thanks to all other faculty
members in the department.
I would also like to express my heartfelt gratitude to my friends who have always inspired
me and particularly helped me in my work.
My whole hearted gratitude to my parents for their constant encouragement, love, wishes
and support. Above all, I thank Almighty who bestowed his blessings upon us.
Debabrata Thatoi
Rourkela, May 2015

iii
ABSTRACT
In last decade, due to several limitations of conventional sources of energy such as high cost of fossil
fuels, contribution towards pollution and environmental damage, scarcity in resources, there is an urge for
the utilization of renewable sources of energy. Among several forms of renewable sources of energy,
specifically wind energy conversion system is the most cost effective and technologically improvable. In
variable speed operation, it is important that the generated power from PMSG should be optimized.
Therefore in order to capture as much power as possible from wind during change in wind speed,
maximum power point tracking controller is implemented. Among several methods, the most efficient
method of MPPT technique is Perturbation and observation (P&O) which has its own virtues. Here
simulation evaluation is done to know the working of MPPT and successfully optimize the generated
power during a step change in wind speed. In addition to power optimization, variation in load as well as
wind speed during variable speed operation, results drift in system voltage and frequency which in turn
leads to generation loss owing to line tripping, power swings and also black outs. Therefore in order to
reduce the change in system voltage and frequency to the smallest possible value, a voltage frequency
controller is required. Therefore the simulation of WECS with a voltage frequency control using a VSC
and BESS is performed. The Voltage frequency controller receives/supplies active/reactive power and
hence system voltage and system frequency is maintained almost constant around it`s reference value. For
this three phase three wire systems is considered. The performance of the system is also evaluated for
change in load and fault occurrence at line. A PMSG based stand-alone WECS with VF controller is
designed, modeled and simulated with MATLAB & SIMULINK.

iv
CONTENTS
CERTIFICATE ............................................................................................................................................... i
ACKNOWLEDGEMENT .............................................................................................................................. ii
ABSTRACT .................................................................................................................................................. iii
List of figures ................................................................................................................................................ vi
List of tables ................................................................................................................................................ viii
List of symbols .............................................................................................................................................. ix
CHAPTER 1 ................................................................................................................................................... 1
1. 1 INTRODUCTION ......................................................................................................................... 1
1.2 LITERATURE REVIEW .............................................................................................................. 2
1.3 MOTIVATION .............................................................................................................................. 3
1.4 OBJECTIVE .................................................................................................................................. 4
1.5 STRUCTURE OF THESIS ........................................................................................................... 6
CHAPTER 2 ................................................................................................................................................... 8
2.1 DYNAMICS OF DIFFERENT COMPONENTS OF PMSG BASED SWECS .......................... 8
2.1.1 Wind turbine characteristics .................................................................................................... 8
2.1.2 Two mass drive train ............................................................................................................ 10
2.1.3 Permanent magnet synchronous generator (PMSG) ............................................................ 11
2.1.4 AC to DC three phase diode rectifier ................................................................................... 13
2.1.5 Boost Converter ................................................................................................................... 14
2.1.6 MPPT Controller .................................................................................................................. 15
2.2 SIMULATION OF PMSG BASED SWECS WITH MPPT CONTROL .................................. 21
2.2.1 Two mass drive train ............................................................................................................ 21
2.2.2 Wind turbine, two mass drive train and PMSG ................................................................... 22
2.2.3 Boost converter ................................................................................................................... 23
2.3 SIMULATION RESULTS ......................................................................................................... 25
CHAPTER 3 ................................................................................................................................................. 28
3.1 OVERVIEW ON VOLTAGE FREQUENCY CONTROLLER ............................................... 28
3.1.1 Types of voltage frequency control schemes ...................................................................... 29
3.1.2 Implementation of a Voltage Frequency controller using a VSC and BESS ...................... 30

v
3.2 DYNAMICS OF VOLTAGE FREQUENCY (VF) CONTROLLER, VSC AND BESS ......... 30
3.2.1 Voltage Frequency Controller (VFC) .................................................................................. 30
3.2.2 PWM generator ................................................................................................................... 33
3.2.3 Voltage Source Converter (VSC) ....................................................................................... 33
3.2.4 Battery Energy Storage System (BESS) ............................................................................. 34
3.3 SIMULATION OF VF CONTROLLER, VSC AND BESS ..................................................... 34
3.3.1 Battery energy storage system (BESS) ............................................................................... 34
3.3.2. Voltage source converter (VSC) ......................................................................................... 35
3.3.3 Voltage frequency controller (VFC) ................................................................................... 35
3.3.4 Three phase three wire loads ............................................................................................... 36
3.3.5 Interfacing inductors .......................................................................................................... 37
3.3.6 Maximum current through IGBT ....................................................................................... 37
3.4.1 Simulation result for variable wind speed. ......................................................................... 39
3.4.2 Simulation result for load change ...................................................................................... 45
3.4.3 Simulation for Fault current occurrence at line ................................................................. 50
CHAPTER 4 ................................................................................................................................................. 53
CONCLUSION......................................................................................................................................... 53
SCOPE OF FUTURE WORK .................................................................................................................. 54
REFERENCE ........................................................................................................................................... 55

vi
List of figures
Sl. No. Details of Figures Page No.
Fig 2.1 Circuit diagram of Permanent Magnet Synchronous Generator ............................................. 13
Fig 2.2 Circuit diagram of a boost converter ....................................................................................... 14
Fig 2.3 Block diagram for optimal torque control ............................................................................... 15
Fig 2.4 Block diagram for PSF MPPT control .................................................................................... 16
Fig 2.5 Plot of power coefficient Vs tip speed ratio ............................................................................ 17
Fig 2.6 Block diagram for Tip speed ratio MPPT control................................................................... 17
Fig 2.7 Plot of generated power Vs. Generator speed ........................................................................ 18
Fig 2.8 Plot of dc link power vs dc link voltage .................................................................................. 19
Fig 2.9 Flow chart for P&O MPPT control ......................................................................................... 20
Fig 2.10 Circuit diagram for boost converter with MPPT controller .................................................... 21
Fig 2.11 Simulink model diagram for two mass drive train .................................................................. 22
Fig 2.12 Simulink model for wind turbine, two mass drive train and PMSG ....................................... 22
Fig 2.13 Simulink diagram for Boost converter .................................................................................... 23
Fig 2.14 Simulink model of SWECS with MPPT control .................................................................... 24
Fig 2.15 Variable wind speed ................................................................................................................ 25
Fig 2.16 Output generated power of PMSG .......................................................................................... 26
Fig 2.17 Dc link voltage of boost converter .......................................................................................... 26
Fig 2.18 Rotor speed of PMSG ............................................................................................................. 27
Fig 3.1 Circuit diagram for VF controller using VSC and BESS…………….……………………...28
Fig 3.2 Block diagram of SRF technique of VF control ..................................................................... 32
Fig 3.3 PWM generator ....................................................................................................................... 33
Fig 3.4 Circuit diagram of VSC .......................................................................................................... 33
Fig 3.5 Circuit diagram of Battery energy storage system .................................................................. 34
Fig 3.6 Simulink model for SRF scheme based VF control ................................................................ 36
Fig 3.7 Simulink model for three phase three wire loads and three phase fault ................................. 36
Fig 3.8 Ripple filter ............................................................................................................................. 37
Fig 3.9 Simulink model of SWECS with VF controller...................................................................... 38
vii
Fig 3.10 Variable wind speed ............................................................................................................. 39
Fig 3.11 Three phase generated voltage of PMSG ............................................................................. 39
Fig 3.12 Terminal voltage of PMSG .................................................................................................. 40
Fig 3.13 System frequency ................................................................................................................. 40
Fig 3.14 Load current ......................................................................................................................... 41
Fig 3.15 Power produced by wind turbine ......................................................................................... 41
Fig 3.16 Generated power of PMSG .................................................................................................. 42
Fig 3.17 Load power .......................................................................................................................... 42
Fig 3.18 Battery power ....................................................................................................................... 43
Fig 3.19 Battery terminal voltage ....................................................................................................... 43
Fig 3.20 Rotor speed of PMSG .......................................................................................................... 44
Fig 3.21 IGBT current ........................................................................................................................ 44
Fig 3.22 Generated three phase ac voltage of PMSG ......................................................................... 45
Fig 3.23 RMS voltage of three phase ac generated voltage. .............................................................. 45
Fig 3.24 Rotor speed of PMSG .......................................................................................................... 46
Fig 3.25 Terminal voltage of PMSG .................................................................................................. 46
Fig 3.26 System frequency ................................................................................................................. 47
Fig 3.27 Generated power of PMSG .................................................................................................. 47
Fig 3.28 Load power .......................................................................................................................... 48
Fig 3.29 Battery power ....................................................................................................................... 48
Fig 3.30 Battery terminal voltage ....................................................................................................... 49
Fig 3.31 Load current ......................................................................................................................... 49
Fig 3.32 Three phase ac generated voltage of PMSG ........................................................................ 50
Fig 3.33 Terminal voltage of PMSG .................................................................................................. 50
Fig 3.34 System frequency ................................................................................................................. 51
Fig 3.35 Total generated power of PMSG ......................................................................................... 51
Fig 3.36 Battery power ....................................................................................................................... 52
Fig 3.37 Battery terminal voltage ....................................................................................................... 52

viii
List of tables
Sl. No. Details of Tables Pages No
Table 2.1 PMSG parameters for simulation……………....………………………………………..22
Table 2.2 Wind turbine parameters………............………………………………………………...22
Table 2.3 Boost converter parameters………..……….…….……………………………………...23

ix
List of symbols
𝑃 Power in the wind stream
𝐶𝑝 Power coefficient
𝑃𝑇𝑜𝑡𝑎𝑙 Total power received by wind turbine at intersection
𝜆 Tip speed ratio
𝛽 Pitch angle
𝐹 Thrust force
𝑇 Rotor torque
𝑅 Radius of the wind turbine blade
𝐶𝑇 Torque coefficient
𝑇𝑇𝑜𝑡𝑎𝑙 Total torque received by the wind turbine at the intersection
𝑁 Rotor speed in rpm
𝐻 Inertia constant of machine
𝜔𝑡 Speed of wind turbine in
𝑇𝑚 Mechanical torque
𝑇𝑠 Shaft torque
𝜔𝑒𝑏𝑠 Electrical base speed
𝜃𝑠𝑡𝑎 Shaft twist angle
𝜔𝑟 Rotor speed
𝐾𝑠𝑠 Shaft stiffness
𝐷𝑡 Damping coefficient
𝑓 Frequency of the system
𝑝 No of poles
𝜙𝑓 Air flux

x
𝐹𝑓 MMF produced by flux
𝑒𝑎𝑓 Voltage induced in the coil
𝐸𝑓 RMS value of the induced voltage in the coil
𝑇𝑡 Torque produced by PMSG
𝛿 Load angle
𝐸𝑟 Air gap emf
𝑉𝑡 Terminal voltage of PMSG
𝐼𝑎 Armature current flowing in PMSG
𝑅𝑎 Machine resistance
𝑋𝐿 Machine leakage reactance
𝑃𝑔 Air gap power
𝑉𝑝ℎ Phase voltage
𝐼𝑝ℎ Phase current
𝑉𝑑𝑐 Dc link voltage
𝐼𝑑𝑐 Dc link current
𝑉𝐿𝐿𝑚𝑎𝑥 Line to line peak voltage
𝑉𝑜 Boost output voltage
𝑉𝑖𝑛 Boost input voltage
𝐼𝐿 Inductor current in boost converter
𝐼𝑐 Current flowing in capacitor connected in boost
𝐼𝑜 Load current in boost converter
𝑃𝑑𝑐 Dc link power
𝐿𝑐 Inductance value of inductor in boost converter

1
CHAPTER 1 1. 1 INTRODUCTION
There are two types of energy sources in the world i.e. renewable energy source and conventional energy
sources. Renewable energy sources are the type of energy sources which are plenty in quantity and are
derived from earth. Wind energy, solar energy, geo thermal and bio mass are different types of renewable
energy sources. These resources are inexhaustible in nature. The known advantages of renewable energy
sources are its clean nature, abundant in quantity and most importantly it is ecofriendly unlike non
renewable energy sources. Now days more research is going on the enhancement of technology which can
efficiently convert the renewable energy sources into useful electrical energy sources. Though the literal
conversion efficiency of renewable energy sources is lower than that of conventional energy source, the
technology is developed and improvised on daily basis to improve its efficiency above 90%. On the other
hand conventional sources of energy are contributing towards pollution, it’s depleting in quantity and
exhaustible. Because of several disadvantages renewable energy sources can be used as alternatives to it.
Among different types of renewable sources of energy, wind energy is the most cleanest and the efficient
source of energy. The major advantages of wind energy are wind-generated electricity doesn’t pollute the
water, air or soil. It doesn’t contribute towards global warming. It doesn’t consume large amount of water
needed by other energy sources. It is caused by every day solar radiation. Its supply is abundant unlike
solar power during bad weather condition and night time. The price of electricity generation by wind
power plant is comparatively lesser than other modes of generation. It contributes towards the economy of
middle class and low class communities. It also creates employment opportunities for highly skilled
workers. It’s very fast and easy to install. In a year many large utility scale wind power plants are
installed. There are different components of a SWECS, of which the most important is the type of
generator used. There are several types of generators used such as Self-excited induction generator
(SEIG), doubly fed Induction generator (DFIG) and permanent magnet synchronous generator (PMSG).
Among these generators, PMSG has several advantages which make it very usable for WECS. It doesn’t
require an additional dc supply for excitation circuit. By eliminating the excitation, energy savings of 20%
can be had by simply using magnets. It doesn’t use slip rings, so it is simpler and maintenance free. The
condensers are not required for power factor maintenance unlike in induction generator. It is also
advantageous over geared driven segment IG system. Induction generator requires leading reactive power
to build up terminal voltage. On other hand DFIG has shorter range of operation unlike PMSG. It is quite

2
complex management of LVRT in wind farms. LVRT is low voltage ride through capacity of a wind
turbine: that is the ability to overcome severe voltage dips on main grid without turning off.
1.2 LITERATURE REVIEW
Non-conventional mode of generation of electricity has several advantages over conventional sources of
generation. It is ecofriendly, cost effective, damage free, long lasting and more over harmless [1].
Electricity generation through wind energy is considered as socially beneficial and economically feasible
for several applications [2]. For distributed generation system photovoltaic cells, turbines and small scale
wind turbines are the main components. In many areas photovoltaic system combined with wind energy
system forms a hybrid power system to supply electrical power to the loads as per the requirement [3]. But
it is difficult to achieve the optimized efficiency of power conversion as well as maximum reliability of
the system [4]. In order to connect to small turbines, permanent magnet synchronous generator, self-
excited induction generator, double field excited induction generator are used with gear box.
One of the most efficient wind energy conversion systems is permanent magnet based wind energy
conversion system with fixed pitch angle [5]. First the power generated from the SWECS is converter to
dc power through diode rectifier which is feed to a boost converter. The boost converter implemented with
a MPPT controller optimizes the power of the system. In order to deliver the optimized power to three
phase consumer load an inverter can be used at the terminals of boost converter. In case the consumer load
increases or wind speed decreases over time, the deficient energy can be delivered by using a battery
energy storage system [6]. Other purpose of using a battery energy storage system is to store excess
energy [7]. In addition to that to prevent the system from voltage and frequency fluctuation due to
overloading, fault occurrence and variable wind speed, voltage frequency controller is brought into the
system to maintain constant operating voltage and operating frequency i.e. 50 Hz in this system
irrespective of various in operating conditions [8]. The voltage frequency controller also reduces the
undesired harmonics in the system. The system also compensates the neutral current flowing in three
phase four wire system [12]. Battery energy storage system is connected to the wind energy conversion
system to store excess energy or to supply required energy during deficiency in power of the system [13].
The bi-direction converter is implemented to provide a channel for power flow in both direction i.e from
system to BESS and vice versa [14]. The active power and reactive power provided by the BESS via
voltage source converter stabilizes the terminal voltage as well as system frequency around 50 Hz during
adverse situations [15]. The three phase four wire loads, nonlinear loads, dynamic loads are connected to

3
the WECS. The VF controller is able to maintain system stability with different kind of loads connected to
WECS [16].
1.3 MOTIVATION
The total amount of energy produced around the world in one fiscal year is approximately 2.5 lakhs MW.
On an average around 10% of energy is stored every year whereas 16% of energy is annual demand of
consumers. Hence this deficiency in power has to be compensated by other means of generation. About
60% of energy is produced by using fossil fuels, coals and other raw materials. On the contrary around 12
% of energy is harnessed by means of renewable energy sources such as wind energy, solar energy, geo
thermal energy etc. Among these renewable energy sources, about 40 % of energy is produced by wind
energy conversion system whereas only 4 % is produced by means of solar energy conversion system.
Because of several advantages and high efficiency of wind energy conversion system, the implementation
of wind farms is frequent in number. No of researchers have proposed the voltage regulators for PMSG
for variable power as well as constant power [1]. However some efforts have been made in the area of
controllers for standalone wind energy conversion system using synchronous generators. In WECS, the
load on the system varies but reactive power demand of PMSG for maintaining constant voltage is met by
battery energy storage system connected to it. In case of wind power generation system, the frequency and
system voltage are kept constant. This type of PMSG system requires a load frequency controller as well
as voltage controller for maintaining generated power constant. In WECS frequency and voltage vary due
to variation in consumer loads as well as due to varying in wind speed, therefore a bidirectional active
power and reactive power controller is needed [2]. Various aspects of controller design for synchronous
generators are still open for their cost effective utilization and to use renewable energy sources such as
wind power for supplying electricity to load and isolated community. Moreover, power quality issues have
also become quite relevant due to various types of non-linear and unbalanced loads to be supplied by the
PMSG [9].
There has been an extensive work carried out to develop electronic load controllers for isolated
synchronous generator for regulating the voltage and frequency [10]. In a typical constant power
application, the wind power turbine is uncontrolled and hence it provides a constant power. Thus PMSG
has to operate at a constant generated power under varying consumer loads, called single point operation,
as the generated power, speed, voltage are constant. Therefore to regulate constant generated power at the
generator terminals, electronic load frequency controller or voltage frequency controller is employed using

4
a voltage source converter and battery energy source system to regulate the system voltage and frequency
of the isolated system. The basic principle of PMSG operation is that the total generated power at the
generator terminals should be absorbed by the consumer loads and VF controllers to regulate power at the
generator terminals to a constant value. Early stage voltage frequency controllers are not having
continuous control and the control is implemented in discrete steps. In next stage of development, voltage
frequency controllers have been proposed for WECS having continuous control but they are having
limitations of feeding various types of loads and problems in power quality as well as distorted generated
voltage and currents. Moreover, nowadays to meet the needs of feeding various consumer loads (linear
/nonlinear, balanced/unbalanced, 3-phase 4 wires) and maintaining good power quality, extensive
improvements have been made on voltage frequency controllers. However, such controllers have
disadvantages of complex control and increased cost because of which requirement of an isolated system
is lost [11]. However very little literature is available in view of improved power quality, as well as on
3phase-4wire systems therefore the proposed work is aimed on these issues and investigation on some
improved electronic load controller.
1.4 OBJECTIVE
Based on the extensive literature review on the topic, following research areas are identified and efforts
are made on some of the major issues which are seriously concerned with stand-alone power generation
employing permanent magnet synchronous generators (PMSG). The main objectives are
a) Simulation of PMSG based SWECS
b) Design and analysis of MPPT controller with Boost converter for PMSG based SWECS
c) To improve the performance of PMSG based SWECS with closed loop VF control
i. During variable wind
ii. During load transition
iii. During single phase line to ground fault
d) Simulation of PMSG based SWECS with Battery Energy Storage System (BESS)
Simulation of PMSG based SWECS
Permanent magnet synchronous generator based stand-alone wind energy conversion system is simulated
in MATLAB/SIMULINK. The parameters of PMSG & wind turbine are calculated based on the rating of
the wind energy conversion system.

5
Design and analysis of MPPT controller with Boost converter for PMSG based
SWECS
Among different types of MPPT control, perturbation and observation (P&O) method of MPPT control is
identified as effective controller to extract maximum power during step change in wind speed as this
method doesn’t need any knowledge of wind speed or need any external sensors for measurement of
parameters like voltage and current. The MPPT controller is realized using a boost converter which is
connected to a three phase diode bridge rectifier. The dc link voltage and current are taken as input to the
controller and the duty cycle is the required output which is then fed to the MPPT controller. A P&O
based MPPT controller is modeled and simulated in MATLAB and SIMULINK and tested against PMSG
based stand-alone conversion system driven by varying wind speed.
To improve the performance of PMSG based SWECS with closed loop VF control
1. Under variable wind condition
There are various voltage frequency control scheme such as current synchronous detection (CDS) method
and synchronous reference frame theory (SRF) method. The SRF based control scheme is simple in
approach and implementation and gives undistorted voltages and currents with less generation of
harmonics. The voltage frequency is realized using a three phase voltage source converter (VSC) and
battery energy source system (BESS). The method involves the computation of active component and
reactive component of reference source current. The controller is modeled and simulated in MATLAB and
SIMULINK and tested against PMSG based SWECS driven by varying wind speed. The terminal voltage
and frequency are checked for any variation during a step change in wind speed.
2. Under load transition
Above SRF based voltage frequency is realized in PMSG based SWECS driven by constant wind speed
but varying consumer loads. Here for simplicity three phase three wire load is adopted. The load is
increased at a specific time and the response of the VF controller as well as SWECS is recorded. The
terminal voltage and system frequency are checked for any variation during change in consumer load.
BESS provides necessary reactive power during load increment and therefore load power, terminal
voltage and frequency remains almost constant.

6
3. Under single phase line to ground fault
SRF based voltage frequency controller is realized through a three phase voltage source converter (VSC)
and battery energy source system (BESS) in PMSG based SWECS driven by constant wind speed. The
system response is recorded against sudden occurrence of three phase fault condition at line. The system
voltage and frequency are checked for any variation. Battery provides the necessary reactive power
through bi-directional voltage source converter during voltage and frequency dip. The system takes few
seconds to recover and initial steady state is achieved but with reduced power of the system.
Simulation of PMSG based SWECS with Battery Energy Storage System (BESS)
The wind energy conversion system is connected to a Battery Energy Storage System (BESS) to store as
well as supply excess or required energy during variable wind condition, load transition and single phase
line to ground fault condition. The system performance is recorded by implementing VF controller using a
BESS and VSC.
1.5 STRUCTURE OF THESIS
Chapter 1
The very beginning of the chapter highlights the importance of use of renewable energy source over
conventional source of energy. This chapter describes the merits of wind energy as a source of energy and
explains about a simple permanent magnet based stand-alone wind energy conversion system. This also
includes the motivation and objective of the thesis in a brief manner.
Chapter 2
This chapter deals with the dynamics of a small scale PMSG based wind energy conversion system with
MPPT control. It has explained mathematically about different components of a WECS and the need of
MPPT control in a SWECS. This chapter has also covered the working principle of MPPT via a boost
converter. It also includes the MATLAB simulation of the WECS with MPPT control and the simulation
result has been discussed thoroughly with simulation figures.

7
Chapter 3
This chapter deals with the dynamics of a SWECS with a load voltage and frequency control. It has
explained the need of a voltage frequency controller in WECS through several merits and demerits. This
chapter has mathematically explained the function of a voltage frequency control using a three phase
voltage source converter (VF) and battery energy source system (BESS). It also includes MATLAB
simulation of SWECS with VF control for various objectives such as voltage frequency control for
variable wind speed, increase in load and fault occurrence at line. This chapter has thoroughly explained
the results of simulation using simulation output figures.
Chapter 4
This chapter concludes about SWECS for two types of controller i.e. MPPT controller and VF controller
for different operational situations. This includes in detail study about the behavior of the controller
response to variation in system parameters. It has covered the need of improvising the existing controlling
scheme and future scope of the controller in WECS

8
CHAPTER 2
2.1 DYNAMICS OF DIFFERENT COMPONENTS OF PMSG BASED SWECS
Wind energy conversion system is consisting of a wind turbine which converts wind energy to mechanical
energy. The shaft of the wind turbine is connected to the shaft of the Permanent magnet synchronous
generator through a gear box. The gear box provides the rated torque to the generator. The generator
develops rated three phase voltages and currents which are then connected to three phase three wire loads.
2.1.1 Wind turbine characteristics
In the wind turbine, the amount of kinetic energy stored can be expressed mathematically as
𝐸 =
1
2𝜌𝐴𝑣𝑤
2 (2.1)
Where = density of air, 𝑣𝑤 is the wind speed in m/s, A is the volume of air at the cross section of wind
turbine. The cross sectional area of the amount of air interacting with the rotor per sec is equal to the cross
sectional area of the rotor. The thickness of the air stream is also equal to that of velocity of wind. The
power available in the air which is converted into mechanical energy by wind turbine is mathematically
given as
𝑃 =
1
2𝜌𝐴𝑣𝑤
3 (2.2)
The efficiency of wind energy conversion system is nearly 60 %. It can be analyzed as a part of kinetic
energy is delivered to the rotating part and the rest of energy is wasted. The total energy so converted can
be mathematically related to power coefficient (𝐶𝑝). The power coefficient 𝐶𝑝 is the ratio of total power
converted into mechanical energy to the total power received by the wind turbine. This is shown as
mathematically below
𝐶𝑝 =
𝑃𝑡𝑜𝑡𝑎𝑙
1/2𝜌𝐴𝑣𝑤3
(2.3)

9
Where 𝑃𝑡𝑜𝑡𝑎𝑙 is the total power received by the wind turbine from wind at intersection. According to
Benz`s law maximum power that can be harnessed from wind energy is around 59.3% of the total received
wind power. It is the maximum value of the power coefficient in wind energy conversion system. Again
the power coefficient is a function of many other components such as blade arrangement, rotor blades and
setting etc. hence optimized 𝐶𝑝is obtained by precision and accurate arrangement of these factors. Many
different version of power coefficient have been used. The accurate mathematical formula for power
coefficient is given as
𝐶𝑝(𝜆, 𝛽) = 0.5 (116
1
𝜆𝑖− 0.4𝛽 − 5) 𝑒
−(21𝜆𝑖
)
(2.4)
1
𝜆𝑖=
1
𝜆 + 0.08𝛽−
0.035
1 + 𝛽3
(2.5)
In this model, the value of the pitch angle of the wind turbine is assumed as zero. The characteristic of
power coefficient is a function of tip speed ratio, thrust force and the rotor torque imposed by rotor blades.
The thrust force and rotor torque is mathematically described as
𝐹 =
1
2𝜌𝐴𝑣𝑤
2 (2.6)
𝑇 =
1
2𝜌𝐴𝑣𝑤
2𝑅 (2.7)
Where R is the rotor blade radius in m. Similarly the ratio between the actual torque developed and
theoretical torque is termed as the torque coefficient, which is given as
𝐶𝑇 =
𝑇𝑇𝑜𝑡𝑎𝑙
1/2𝜌𝐴𝑣𝑤2𝑅
(2.8)
Where 𝑇𝑇𝑜𝑡𝑎𝑙 is the actual torque developed in rotor.
Tip speed ratio is defined as the ratio of velocity of rotor tip and velocity of wind. The power developed
by the rotor is a function of tip speed ratio. Mathematically tip speed ratio is given as

10
𝜆 =
2𝜋𝑁𝑅
𝑣𝑤
(2.9)
Where N is the rotational speed of the rotor in rpm and R is the radius of the rotor blade in meter and V is
the wind speed in m/s. Tip speed ratio can also be expressed as the ratio between power coefficient and
torque coefficient.
𝜆 =
𝐶𝑝
𝐶𝑇
(2.10)
The dynamic relation between the rotor and wind stream greatly affects the efficiency of rotor in power
extraction. The 𝐶𝑝 − 𝜆 characteristic shows the rotor performance irrespective of rotor size and site
parameters. From Fig 2.5, it is clear that power coefficient increases with increase in tip speed ratio. But
when tip speed ratio increases further beyond the optimized value, power coefficient starts to decline at
same slope. Hence there is only one optimized point where power extraction is maximum.
2.1.2 Two mass drive train
There are two kinds of generators used for small power generation i.e. self-excited induction generator and
permanent magnet synchronous generator. The mechanical components such as wind turbine rotates at
low rpm whereas the rotor rotates at high rpm. The gear box is used to convert the low speed of wind
turbine to the require speed of generator turbine. In multi poles generator system gear box is not
necessary. The generator converts the mechanical power to electrical power. The mathematical model for
two mass drive train is given as
2𝐻
𝑑𝜔𝑡
𝑑𝑡= 𝑇𝑚−𝑇𝑠
(2.11)
2𝐻
𝑑𝜔𝑡
𝑑𝑡= 𝑇𝑚−𝑇𝑠
(2.12)
𝑇𝑠 = 𝐾𝑠𝑠𝜃𝑠𝑡𝑎 + 𝐷𝑡
𝑑𝜃𝑠𝑡𝑎
𝑑𝑡
(2.13)

11
Where H is the inertia constant of the triangle, θ𝑠𝑡𝑎 is the shaft twist angle, 𝜔𝑡is the angular speed of the
wind turbine, 𝜔𝑟 is the rotor speed of the generator, 𝜔𝑒𝑏𝑠is the electrical base speed, Ts is the shaft torque, is
𝐾𝑠𝑠 the Shaft stiffness, 𝐷𝑡 is the Damping coefficients
2.1.3 Permanent magnet synchronous generator (PMSG)
In this kind of generator, the excitation field is supplied by a permanent magnet unlike a coil in
synchronous generator. The speed of the rotor and speed of magnetic field is equal to synchronous speed.
Hence the name is synchronous. There are two types of rotors i.e. salient pole and cylindrical rotor type.
In salient pole rotor type, air gap flux varies with respect to shape of the rotor whereas in cylindrical rotor
type, magnitude of air gap flux remains constant. Hence magnetic strength and structural strength is better
in case of cylindrical rotors. The windings are embedded in the rotor slots. Cylindrical rotor provides
better dynamic balancing than salient pole rotor type. Hence it is used for high speed turbo generators. In
salient pole, the rotor poles project outside from the core of rotor whereas cylindrical rotor is used in two
or four pole machines. Hence salient pole rotor type is used in low speed hydro electric generators. Salient
pole has large no of poles projecting out of core which has large radius but smaller length.
Because of constant air gap flux, the permeance offered to the MMF doesn’t depend on the angle between
the rotor poles and the MMF axis. In salient pole rotor type, because of variation in air gap flux, the
permeance offered to MMF changes with the change in angle between the MMF axis and the rotor poles.
Hence because of several advantages of cylindrical rotor type, it is used very often. Due to constant nature
it is simple to model the machine and analyze its functioning. The relationship between EMF frequency
and rotor speed is mathematically shown as
𝑓 =𝑝𝑛𝑠
120
(2.14)
Where 𝑓 = frequency in Hz, 𝑛𝑠 = speed of the rotor in RPM, 𝑝 = no of poles
A synchronous generator when connected to an isolated load behaves as a voltage source whose frequency
is measured as a function of its prime mover speed. Synchronous generators are connected in parallel
manner through long distance transmission lines. The system is designed to maintain synchronism in spite
of electrical and mechanical stress. The merits of such inter-connected system are continuity of supply,
capital and are proved to be cost effective. Most of the applications of synchronous motor in industry is

12
constant speed operation. Another merit of using a synchronous motor is that its power factor can be
controlled simply by variation of field current. Hence most of the industries use synchronous motor as
loads which are operated at a leading power factor in order to produce high power factor.
Dynamic model of PMSG
The magnetization curve which is a relationship between 𝜙𝑓 and 𝐹𝑓 is linear if the iron is considered to be
infinitely permeable. In case of linear magnetization curve the relation can be mathematically shown as
𝜙𝑓 = 𝑝𝐹𝑓 (2.15)
Where 𝑝 is permeance per pole. The magnitude of the EMF induced in the coils of N no of turns is given
by faraday`s law
𝑒𝑎𝑓 = −𝑁
𝑑𝜆
𝑑𝑡
(2.16)
𝑒𝑎𝑓 = 𝑁𝜔𝑠𝜙𝑓 sin𝜔𝑠𝑡 (2.17)
is flux linkage of one coil. The RMS value of induced EMF in the coil is given as
𝐸𝑓 = √2𝜋𝑓𝑁𝜙𝑓 (2.18)
Where 𝜙𝑓 is flux per poles. The magnitude of torque is given as
𝑇𝑡 =
𝜋
2(𝑝
2)2
𝜙𝑟𝐹𝑓 sin 𝛿 (2.19)
Where is the angle by which 𝐹𝑓 leads 𝐹𝑟
During motoring action the positive current flows in opposite direction to the direction in which the
induced emf is yielded. The electromagnetic torque acts on the field poles in the direction of rotation so
that the mechanical power is produced hence it is operating as a motor. On other hand, if the terminal
voltage is same as air gap emf i.e. 𝑉𝑡 = 𝐸𝑟 and its frequency is held fixed by an external 3 phase source
called infinite bus, the machine acts as a generator or motor depending upon the mechanical condition at
the shaft. The circuit diagram of the machine acting as a generator is drawn below. The dynamic equation
related to the generating mode of operation is mathematically given as

13
𝑉𝑡 = 𝐸𝑟 − 𝐼𝑎(𝑅𝑎 + 𝑗𝑋𝐿) (2.20)
Where Ra is the machine resistance, XL is leakage reactance in series with the resistance between the
terminal voltage and air gap EMF for each machine phase
Fig 2.1 Circuit diagram of Permanent Magnet Synchronous Generator
2.1.4 AC to DC three phase diode rectifier
When generated power is converted to dc power at unity power factor, the mathematical dynamic equation
is given by
𝑃𝑔 = 3𝑉𝑝ℎ𝐼𝑝ℎ = 𝑉𝑑𝑐𝐼𝑑𝑐 (2.21)
Where 𝑃𝑔 is the generated power, 𝑉𝑝ℎ𝐼𝑝ℎ are the phase voltage and current and 𝑉𝑑𝑐𝐼𝑑𝑐 are the rectified dc
voltage and current.
The value of average power is equal to
𝑉𝑑𝑐 =
3
𝜋∫ 𝑉𝐿𝐿𝑚𝑎𝑥 cos 𝜃 𝑑𝜃
𝜋6
−𝜋6
= 3
𝜋𝑉𝐿𝐿
(2.22)
Where 𝑉𝐿𝐿𝑚𝑎𝑥 is peak value of line to line input voltage of rectifier. Furthermore, the relation of rectified
voltage and RMS phase voltage is:

14
𝑉𝑑𝑐=
3
𝜋√6𝑉
(2.23)
2.1.5 Boost Converter
The three phase voltages are converted to the DC voltage via a three phase rectifier circuit using a
universal Simulink block. The rectified dc voltage is then supplied across the DC-DC Boost converter.
The duty cycle of the boost converter is controlled by a MPPT controller. Hence optimized boosted DC
voltage is produced at the output port of Boost converter A boost converter is used as the power interface
between the WECS and the load to achieve maximum power. The output voltage dc 𝑉𝑜 of the boost
converter can be expressed as:
𝑉𝑜 =
𝑉𝑖𝑛
1 − 𝑑
(2.24)
Where d is the duty cycle, 𝑉𝑜 is the output dc voltage from boost converter and 𝑉𝑖𝑛 is the input dc voltage
to the boost converter. It can be seen the input DC voltages 𝑉𝑖𝑛 can be shifted to a high level. This power
converter is suitable for a lower WECS output voltage and higher desirable DC link voltage case.
Fig 2.2 Circuit diagram of a boost converter
LcDiode
SwitchRLCc
IL
Ic Io
Vin Vo
15
2.1.6 MPPT Controller
Maximum power point tracking is an efficient method of extracting generated power from the generating
systems used by grid connected inverters, solar battery chargers, wind energy conversion system. The
MPPT controller implements the P&O control technique in order to provide the required duty cycle to the
boost converter. Which produces optimized DC link voltage and hence maximum power is generated by
the generator. Wind energy is dependent on weather, topology and environment. It is essential to choose
the best place where quality of air can produce more electricity. Then it is difficult to wind turbine to
provide 60% of power wind speed. Wind energy conversion system have also other losses like mechanical
friction and low generator`s efficiency. So the amount of power output from WECS depends to the tracked
wind power. Therefore, a maximum power point tracking control is required.
Types of MPPT techniques
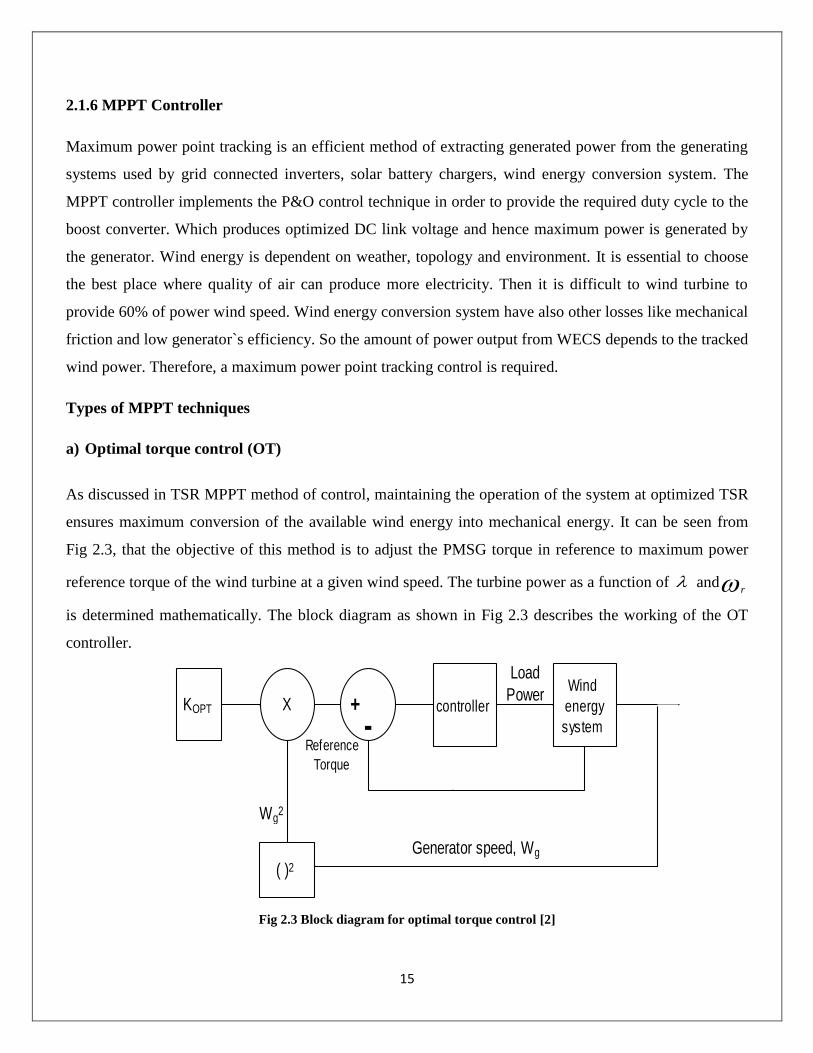
a) Optimal torque control (OT)
As discussed in TSR MPPT method of control, maintaining the operation of the system at optimized TSR
ensures maximum conversion of the available wind energy into mechanical energy. It can be seen from
Fig 2.3, that the objective of this method is to adjust the PMSG torque in reference to maximum power
reference torque of the wind turbine at a given wind speed. The turbine power as a function of and r
is determined mathematically. The block diagram as shown in Fig 2.3 describes the working of the OT
controller.
Fig 2.3 Block diagram for optimal torque control [2]
X
( )2
controller
Wind
energy
system
Generator speed, Wg
Load
PowerKOPT
Wg2
+-
Reference
Torque
16
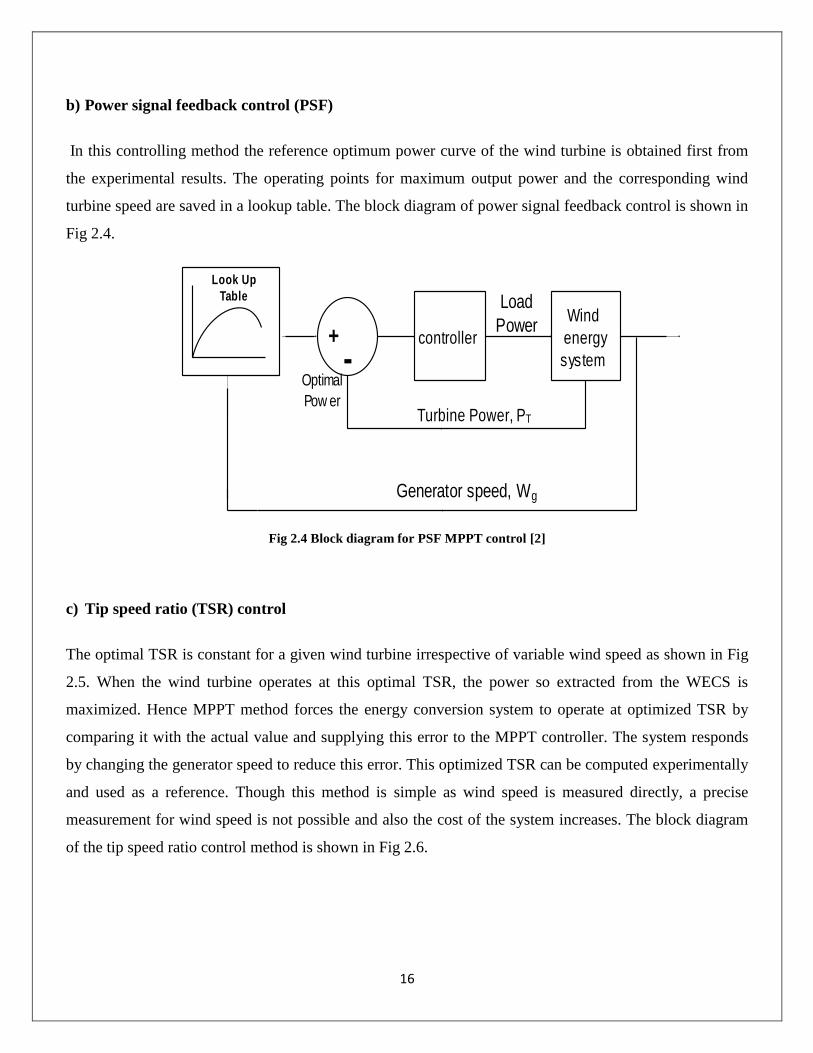
b) Power signal feedback control (PSF)
In this controlling method the reference optimum power curve of the wind turbine is obtained first from
the experimental results. The operating points for maximum output power and the corresponding wind
turbine speed are saved in a lookup table. The block diagram of power signal feedback control is shown in
Fig 2.4.
Fig 2.4 Block diagram for PSF MPPT control [2]
c) Tip speed ratio (TSR) control
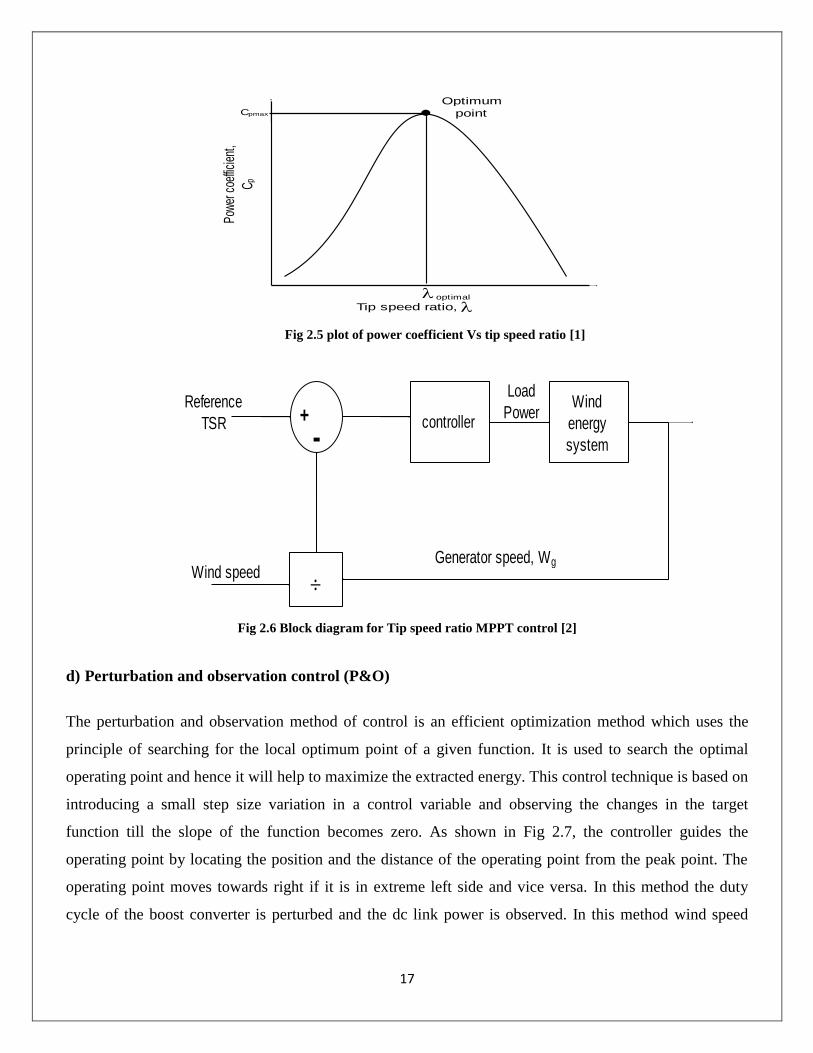
The optimal TSR is constant for a given wind turbine irrespective of variable wind speed as shown in Fig
2.5. When the wind turbine operates at this optimal TSR, the power so extracted from the WECS is
maximized. Hence MPPT method forces the energy conversion system to operate at optimized TSR by
comparing it with the actual value and supplying this error to the MPPT controller. The system responds
by changing the generator speed to reduce this error. This optimized TSR can be computed experimentally
and used as a reference. Though this method is simple as wind speed is measured directly, a precise
measurement for wind speed is not possible and also the cost of the system increases. The block diagram
of the tip speed ratio control method is shown in Fig 2.6.
controller
Wind
energy
system
Generator speed, Wg
Load
Power+-
Optimal
Pow erTurbine Power, PT
Look Up
Table
17
Fig 2.6 Block diagram for Tip speed ratio MPPT control [2]
d) Perturbation and observation control (P&O)
The perturbation and observation method of control is an efficient optimization method which uses the
principle of searching for the local optimum point of a given function. It is used to search the optimal
operating point and hence it will help to maximize the extracted energy. This control technique is based on
introducing a small step size variation in a control variable and observing the changes in the target
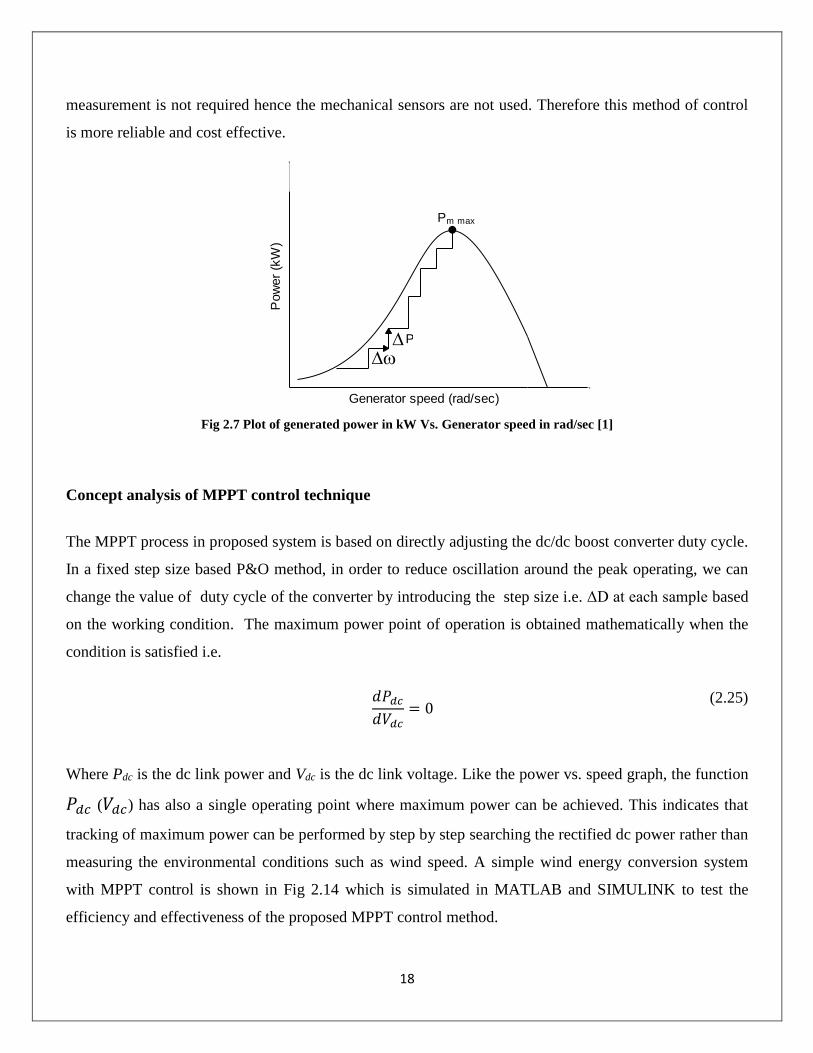
function till the slope of the function becomes zero. As shown in Fig 2.7, the controller guides the
operating point by locating the position and the distance of the operating point from the peak point. The
operating point moves towards right if it is in extreme left side and vice versa. In this method the duty
cycle of the boost converter is perturbed and the dc link power is observed. In this method wind speed
Tip speed ratio,
Powe
r coe
fficie
nt,
C p
Cpmax
optimal
Optimum
point
controllerWind
energy
system
+
-
Wind speed
Reference
TSR
Generator speed, Wg
Load
Power
Fig 2.5 plot of power coefficient Vs tip speed ratio [1]
18
measurement is not required hence the mechanical sensors are not used. Therefore this method of control
is more reliable and cost effective.
Fig 2.7 Plot of generated power in kW Vs. Generator speed in rad/sec [1]
Concept analysis of MPPT control technique
The MPPT process in proposed system is based on directly adjusting the dc/dc boost converter duty cycle.
In a fixed step size based P&O method, in order to reduce oscillation around the peak operating, we can
change the value of duty cycle of the converter by introducing the step size i.e. ΔD at each sample based
on the working condition. The maximum power point of operation is obtained mathematically when the
condition is satisfied i.e.
𝑑𝑃𝑑𝑐
𝑑𝑉𝑑𝑐= 0
(2.25)
Where Pdc is the dc link power and Vdc is the dc link voltage. Like the power vs. speed graph, the function
𝑃𝑑𝑐 (𝑉𝑑𝑐) has also a single operating point where maximum power can be achieved. This indicates that
tracking of maximum power can be performed by step by step searching the rectified dc power rather than
measuring the environmental conditions such as wind speed. A simple wind energy conversion system
with MPPT control is shown in Fig 2.14 which is simulated in MATLAB and SIMULINK to test the
efficiency and effectiveness of the proposed MPPT control method.
Generator speed (rad/sec)
Pow
er
(kW
)
Pm max
P

19
Fig 2.8 Plot of dc link power vs dc link voltage [3]
From above Fig 2.8, it is clear that as the duty-cycle adjustment is guided by the direction of slope of the
function i.e. 𝑑𝑃𝑑𝑐
𝑑𝑉𝑑𝑐 , the duty-cycle value is increased in the high-speed side of the WG characteristic. Hence
WG rotor-speed decreases and power increases till the controller reaches the Maximum Power Point is
reached. In the same way when the starting point is in the low-speed side, following the direction of slope
of the function i.e. 𝑑𝑃𝑑𝑐
𝑑𝑉𝑑𝑐 which results in decrease of the value of duty cycle. Hence the WG rotor speed is
gradually and the controlling variable subsequently converges at the MPP.
.
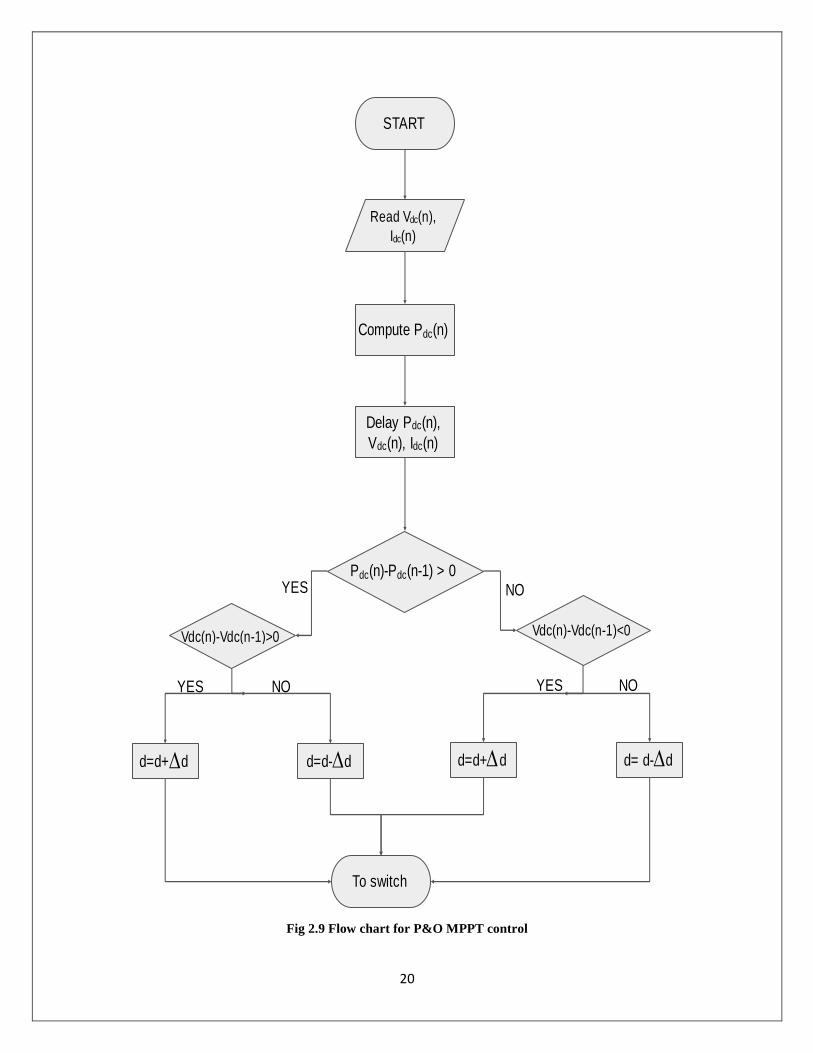
Flow chart for MPPT algorithm
Flow chart describes the step by step working of a MPPT controller based on the describe algorithm. As
shown in Fig 2.9, the inputs taken are the dc link voltage and current and output is the required duty cycle.
In the second step, the controller is computing the dc link power by multiplying mathematically the input
dc link voltage and current. The next step explains (n-1)th value of dc link power which is obtained by
using a delay function in Simulink. If the difference in nth and (n-1)th value of dc link power is greater
than zero then the algorithm goes forward and computes the difference in dc link voltage. Accordingly the
difference in dc link voltage generates new duty cycle by adjusting delta D which is added or subtracted as
per the conditions applied.
Pdc
Vdc
dPdc/dVdc = 0
20
Fig 2.9 Flow chart for P&O MPPT control
START
Read Vdc(n),
Idc(n)
Compute Pdc(n)
Delay Pdc(n),
Vdc(n), Idc(n)
Pdc(n)-Pdc(n-1) > 0
Vdc(n)-Vdc(n-1)<0Vdc(n)-Vdc(n-1)>0
d=d+ d
To switch
d=d- d d=d+ d d= d- d
YES NO
YES NO YES NO
21
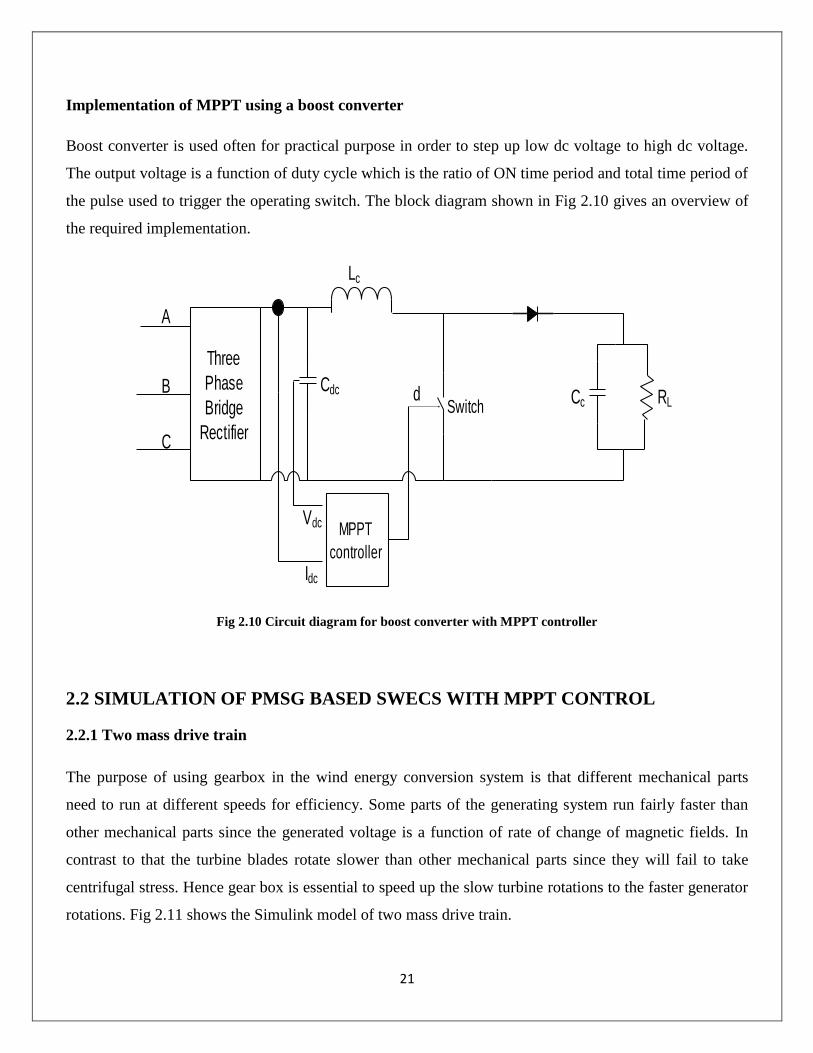
Implementation of MPPT using a boost converter
Boost converter is used often for practical purpose in order to step up low dc voltage to high dc voltage.
The output voltage is a function of duty cycle which is the ratio of ON time period and total time period of
the pulse used to trigger the operating switch. The block diagram shown in Fig 2.10 gives an overview of
the required implementation.
Fig 2.10 Circuit diagram for boost converter with MPPT controller
2.2 SIMULATION OF PMSG BASED SWECS WITH MPPT CONTROL
2.2.1 Two mass drive train
The purpose of using gearbox in the wind energy conversion system is that different mechanical parts
need to run at different speeds for efficiency. Some parts of the generating system run fairly faster than
other mechanical parts since the generated voltage is a function of rate of change of magnetic fields. In
contrast to that the turbine blades rotate slower than other mechanical parts since they will fail to take
centrifugal stress. Hence gear box is essential to speed up the slow turbine rotations to the faster generator
rotations. Fig 2.11 shows the Simulink model of two mass drive train.
MPPT
controller
Three
Phase
Bridge
Rectifier
Lc
Cc RLSwitchdCdc
Vdc
Idc
A
B
C

22
Fig 2.11 Simulink model diagram for two mass drive train
2.2.2 Wind turbine, two mass drive train and PMSG
To produce rated three phase ac voltages and currents, the generator should be provided with rated input
torque. This rated input torque is provided by the wind turbine through a two mass drive train which serve
as a gear box between generator and turbine as shown in Fig 2.12. The per unit rotor speed is supplied as
input to the two mass drive train. The values of different parameters of PMSG & wind turbine are shown
in Table 2.1 and Table 2.2 respectively.
Fig 2.12 Simulink model for wind turbine, two mass drive train and PMSG

23
Table 2.1 PMSG parameters
Variables Specifications
Rating 10.5 kW
Stator resistance 0.434 ohm
Armature inductance 0.000834H
Flux linkage 0.5
Inertia 0.001197J
Damping 0.001189F
Poles pair 2
Variables Specifications
Nominal mechanical power 10.5KW
Base power of generator 10.5/0.9 KVA
Base wind speed 0.8
Base rotational speed 1.2
Pitch angle 0
2.2.3 Boost converter
The three phase ac voltages from the PMSG are rectified using a three phase diode rectifier. This rectified
dc voltage serves as an input to the boost converter. The values of different components of boost converter
are shown in Table 2.3. The gating pulse to the IGBT switch is provided by a PWM generator which is a
function of duty cycle (Fig 2.13).
Fig 2.13 Simulink diagram for Boost converter
Table 2.2 Wind turbine parameters
24
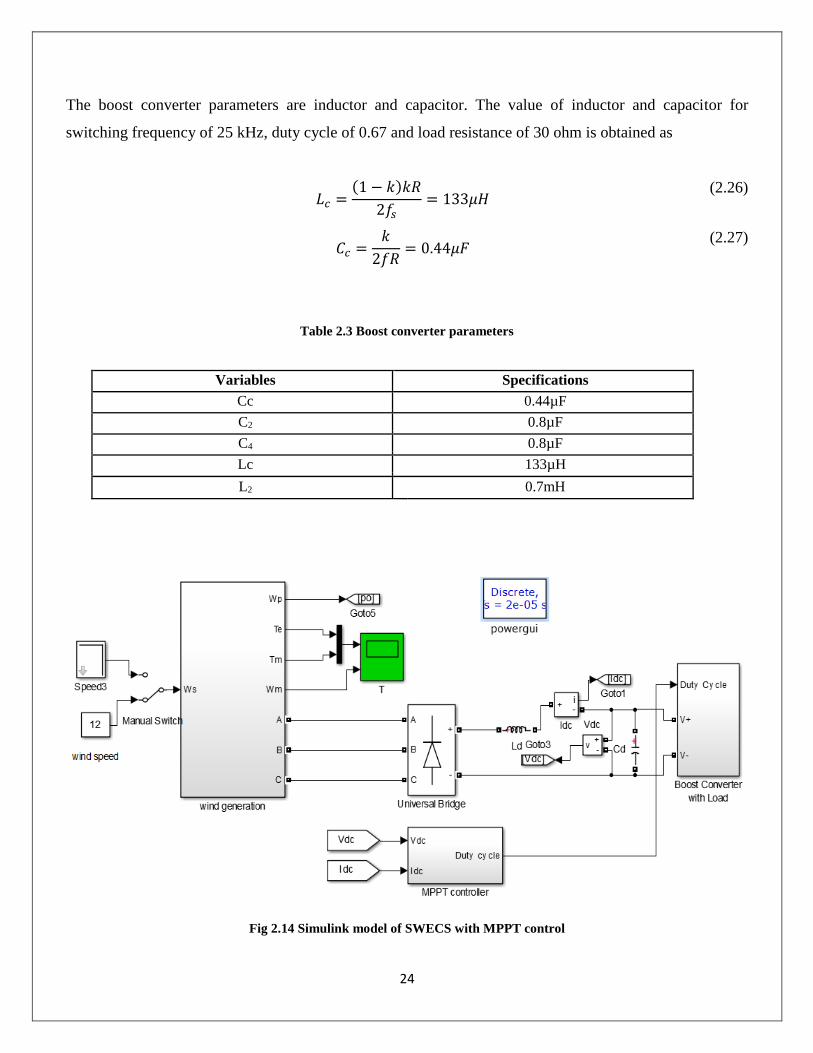
The boost converter parameters are inductor and capacitor. The value of inductor and capacitor for
switching frequency of 25 kHz, duty cycle of 0.67 and load resistance of 30 ohm is obtained as
𝐿𝑐 =
(1 − 𝑘)𝑘𝑅
2𝑓𝑠= 133𝜇𝐻
(2.26)
𝐶𝑐 =
𝑘
2𝑓𝑅= 0.44𝜇𝐹
(2.27)
Table 2.3 Boost converter parameters
Variables Specifications
Cc 0.44µF
C2 0.8µF
C4 0.8µF
Lc 133µH
L2 0.7mH
Fig 2.14 Simulink model of SWECS with MPPT control
25
2.3 SIMULATION RESULTS
The simulation of PMSG based SWECS with MPPT control is carried out with step change in wind speed.
The initial value of wind speed was 8 m/s. Due to step change at t= 2secs, the wind speed increased to
12m/s which is high enough to produce more power from PMSG. As a result the generated voltages,
source current, wind power, DC link voltage and current increases. The following figures describe the
responses of different parameters to step change in wind speed.
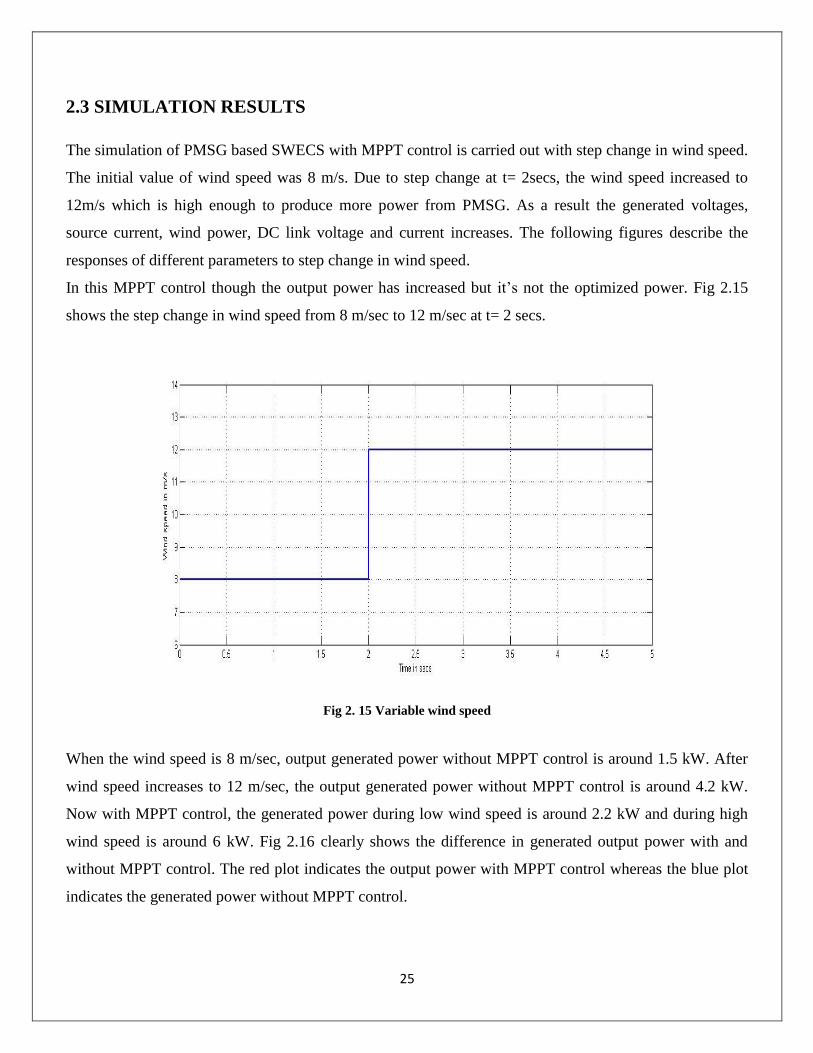
In this MPPT control though the output power has increased but it’s not the optimized power. Fig 2.15
shows the step change in wind speed from 8 m/sec to 12 m/sec at t= 2 secs.
Fig 2. 15 Variable wind speed
When the wind speed is 8 m/sec, output generated power without MPPT control is around 1.5 kW. After
wind speed increases to 12 m/sec, the output generated power without MPPT control is around 4.2 kW.
Now with MPPT control, the generated power during low wind speed is around 2.2 kW and during high
wind speed is around 6 kW. Fig 2.16 clearly shows the difference in generated output power with and
without MPPT control. The red plot indicates the output power with MPPT control whereas the blue plot
indicates the generated power without MPPT control.
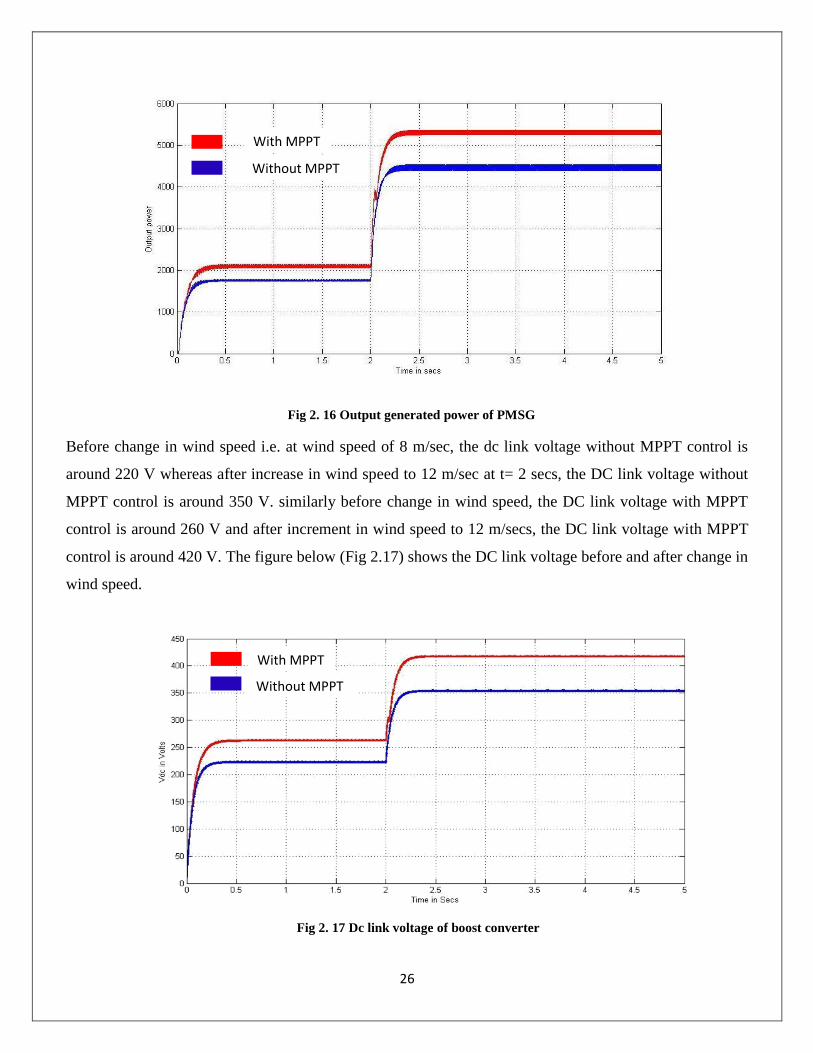
26
Before change in wind speed i.e. at wind speed of 8 m/sec, the dc link voltage without MPPT control is
around 220 V whereas after increase in wind speed to 12 m/sec at t= 2 secs, the DC link voltage without
MPPT control is around 350 V. similarly before change in wind speed, the DC link voltage with MPPT
control is around 260 V and after increment in wind speed to 12 m/secs, the DC link voltage with MPPT
control is around 420 V. The figure below (Fig 2.17) shows the DC link voltage before and after change in
wind speed.
Fig 2. 16 Output generated power of PMSG
Fig 2. 17 Dc link voltage of boost converter
With MPPT
Without MPPT
With MPPT
Without MPPT
27
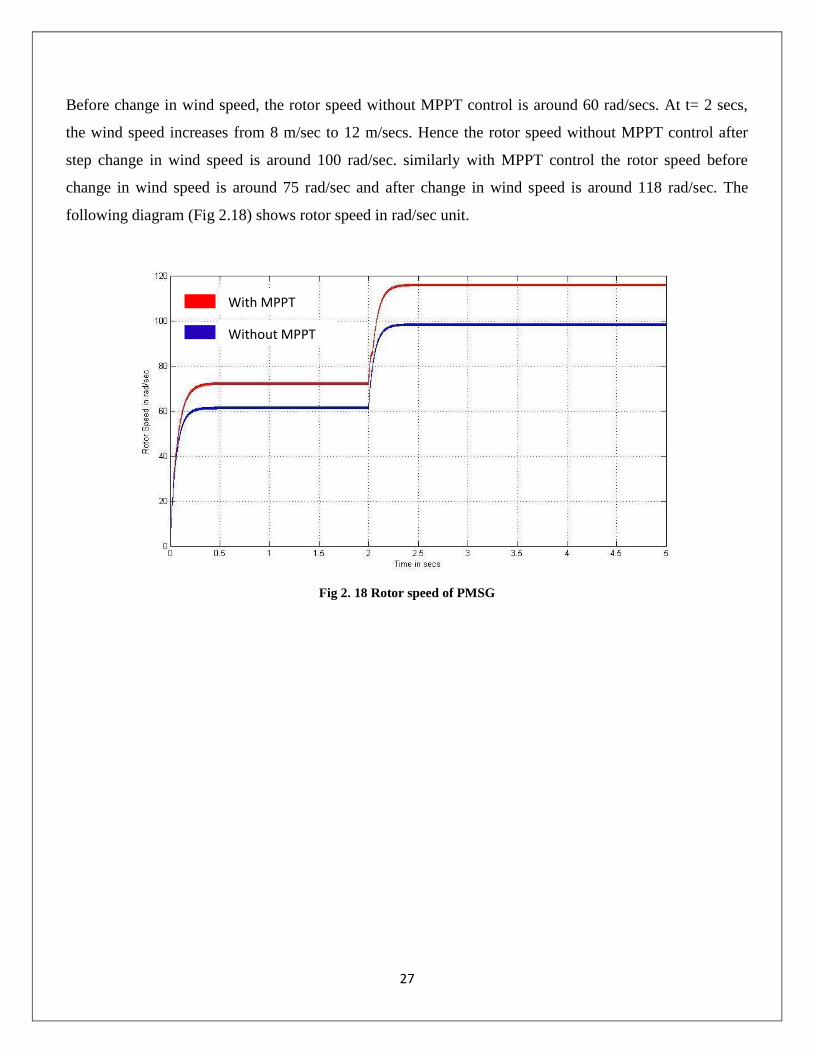
Before change in wind speed, the rotor speed without MPPT control is around 60 rad/secs. At t= 2 secs,
the wind speed increases from 8 m/sec to 12 m/secs. Hence the rotor speed without MPPT control after
step change in wind speed is around 100 rad/sec. similarly with MPPT control the rotor speed before
change in wind speed is around 75 rad/sec and after change in wind speed is around 118 rad/sec. The
following diagram (Fig 2.18) shows rotor speed in rad/sec unit.
Fig 2. 18 Rotor speed of PMSG
With MPPT
Without MPPT
28
CHAPTER 3
3.1 OVERVIEW ON VOLTAGE FREQUENCY CONTROLLER
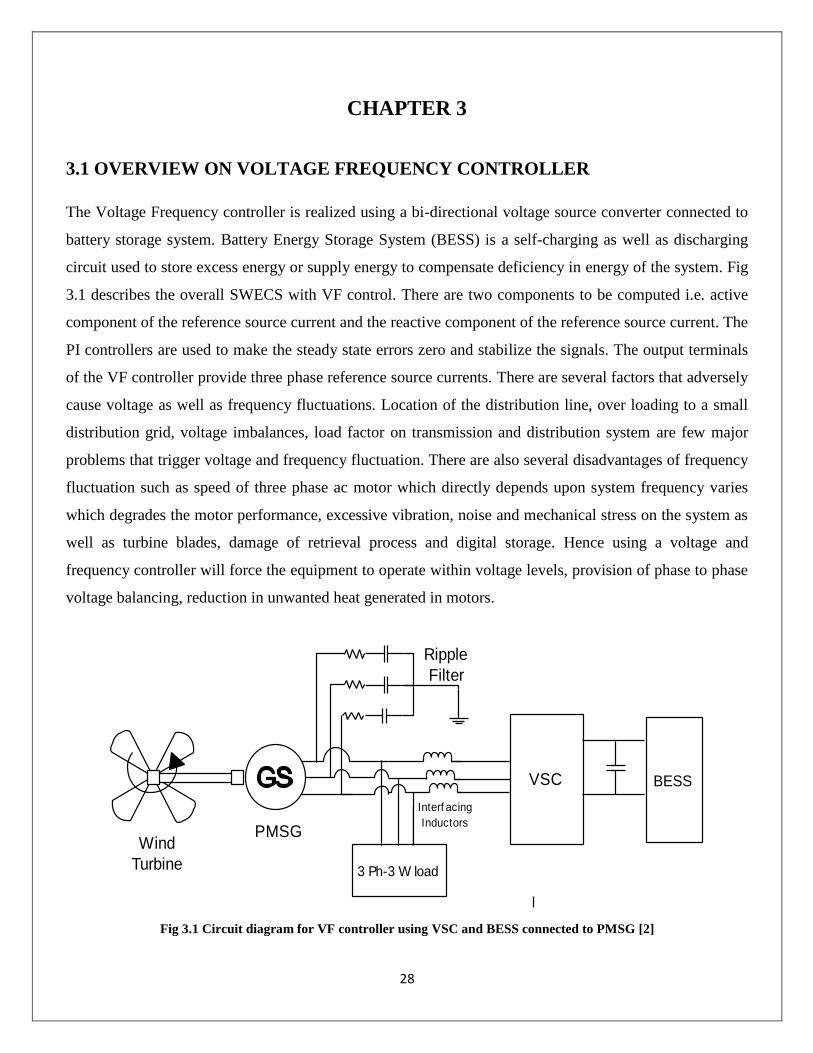
The Voltage Frequency controller is realized using a bi-directional voltage source converter connected to
battery storage system. Battery Energy Storage System (BESS) is a self-charging as well as discharging
circuit used to store excess energy or supply energy to compensate deficiency in energy of the system. Fig
3.1 describes the overall SWECS with VF control. There are two components to be computed i.e. active
component of the reference source current and the reactive component of the reference source current. The
PI controllers are used to make the steady state errors zero and stabilize the signals. The output terminals
of the VF controller provide three phase reference source currents. There are several factors that adversely
cause voltage as well as frequency fluctuations. Location of the distribution line, over loading to a small
distribution grid, voltage imbalances, load factor on transmission and distribution system are few major
problems that trigger voltage and frequency fluctuation. There are also several disadvantages of frequency
fluctuation such as speed of three phase ac motor which directly depends upon system frequency varies
which degrades the motor performance, excessive vibration, noise and mechanical stress on the system as
well as turbine blades, damage of retrieval process and digital storage. Hence using a voltage and
frequency controller will force the equipment to operate within voltage levels, provision of phase to phase
voltage balancing, reduction in unwanted heat generated in motors.
Fig 3.1 Circuit diagram for VF controller using VSC and BESS connected to PMSG [2]
VSC
3 Ph-3 W load
BESS
Wind
Turbine
PMSG
Ripple
Filter
Interf acing
Inductors

29
3.1.1 Types of voltage frequency control schemes
a) Current synchronous detection based control algorithm (CSD):
The control method is used for the VFC of SWECS feeding three phase three wire loads. The principle of
this method is to compute the reference source current by using the controlling scheme and use it to
determine the error. Reference source currents are computed by calculating the active and reactive
components of the reference source currents. The in-phase and phase shifted templates are determined by
estimating the PCC voltage amplitude and instantaneous phase voltages amplitude by the formula given as
below
𝑉𝑡(𝑛) = √2/3(𝑣𝑎
2 + 𝑣𝑏2 + 𝑣𝑐
2 (3.1)
Three phase locked loop is used to determine SWECS frequency. It requires a sample and hold logic, an
instant crossing detector and an estimated phase shifted voltage. For estimation of reference source active
power, the load active power drawn is subtracted from the output of the frequency PI controller i.e.
𝑃𝑔∗ = 𝑃𝑓(𝑛) − 𝑃𝐿(𝑛) (3.2)
The output of voltage PI controller is subtracted from load reactive power to determine the reactive
component as
𝑄𝑔∗ = 𝑄𝑣𝑞(𝑛) − 𝑄𝐿(𝑛) (3.3)
The reference source currents are compared with sensed source currents of each phase. The resulting
current errors are amplified and compared with constant high frequency triangular carrier waves which
generate switching signals for the switches of VFC of SWECS.
b) Synchronous reference frame theory based control algorithm (SRF):
This control technique is different from that of CSD technique. Unlike CSD method, here terminal voltage
amplitude and system frequency is used as reference values. This method works on the principle of
synchronous frame theory in which three phase load currents are first converted to two phase d-q axis
using a PLL. Low pass filters are used to completely eliminate harmonics and unwanted ac components in
d-q components. The filtered d and q components are differentiated from respective outputs of PI

30
controller. The d axis component of load current along with output of frequency PI controller constitutes
the reference d axis component of source current. Whereas q axis of load current along with output of
voltage PI controller constitutes the q axis reference component of source current. The respective d-q axis
components of reference source currents are converted to three phase reference source current by using
reverse park`s theorem.
3.1.2 Implementation of a Voltage Frequency controller using a VSC and BESS
A three-leg VSC with a BESS at its DC bus is used as a VF Controller. The mid-point of each leg of a
VFC is connected at the point of common coupling (PCC) through an interfacing inductor. The VSC-
based VFC regulates the SWECS frequency under change in wind power or consumer loads by supplying
the deficit load active power. A configuration of a PMSG-based SWECS to feed 3P3 W load, is shown in
Fig. 3.1. The presence of permanent magnets at rotor terminals allows rated field excitation. Under change
in wind speed, the required reactive power is made available to the PMSG through a VSC of VFC. The
VSC-based VFC also provides deficit load reactive power and an active power in the presence of a BESS
to keep constant system frequency. A high-pass RC ripple filter is used at the PCC to absorb switching
ripple.
3.2 DYNAMICS OF VOLTAGE FREQUENCY (VF) CONTROLLER, VSC AND
BESS
3.2.1 Voltage Frequency Controller (VFC)
Voltage frequency controller is realized using a battery energy storage system and a bi-direction voltage
source converter. The controller implements an algorithm which is based on synchronous reference frame
theory (SRF). The main objective is to compute reference source currents. The load currents and the
terminal three phase generated voltages are sensed as feedback signals and used for mathematical
computation of amplitude of terminal voltage and system frequency. The load currents are transformed
from a-b-c to the d-q frame using park`s transformation.
[𝑉𝑑𝑉𝑞
] =2
3[ 1 −
1
2−
1
2
0 −√3
2−
√3
2 ]
[𝑉𝑎𝑉𝑏𝑉𝑐
]

31
The three phase voltages from load is converted into two phase dc components i.e. d axis and q axis
component using the unit vectors so obtained. In order to filter the undesired ac harmonic components,
low pass filters are used. The fundamental components along with harmonic components are given as:
𝑖𝑙𝑑 = 𝑖𝑑𝑑𝑐 + 𝑖𝑑𝑎𝑐 (3.4)
𝑖𝑙𝑞 = 𝑖𝑞𝑑𝑐 + 𝑖𝑞𝑎𝑐 (3.5)
The fundamental components so obtained after passing through low pass filters are 𝑖𝑑𝑑𝑐, 𝑖𝑞𝑑𝑐.
Estimation of active component of reference source current:
Using three phase load currents as input to PLL, fundamental frequency of the system is obtained. The
computed frequency of the SWECS is compared with the reference frequency i.e. 50 Hz and the error is
passed through a PI controller. The output of the pi controller is assumed as the active current to be drawn
by the battery energy storage system and voltage source converter. The dynamics of the PI controller is
given as:
𝑖𝑑𝑏(𝑛) = 𝑖𝑑𝑏(𝑛−1) + 𝑘𝑝𝑑(𝑓𝑒(𝑛) − 𝑓𝑒(𝑛−1)) + 𝑘𝑖𝑑𝑓𝑒(𝑛) (3.6)
Where the frequency is given as fe (n) = f – f (n). the PI controller`s parameters i.e. Kpd and Kid are
estimated by hit and trail method. The total reference d-axis source current is therefore as,
𝑖𝑠𝑑∗ = 𝑖𝑑𝑑𝑐 − 𝑖𝑑𝑏 (3.7)
Estimation of the reactive component of the reference source current:
The main objective is to estimate the reactive component of reference source current. The input to the PI
controller is the voltage error whereas the output of the voltage PI controller produces current which is
equivalent to the quadrature axis component of the source current. The resultant of addition of quadrature
axis component and the component obtained from the voltage PI controller (iqr) is assumed as the
quadrature axis component of source current. The amplitude of the terminal voltage is calculated as
32
𝑉𝑡(𝑛) = √2/3(𝑣𝑎
2 + 𝑣𝑏2 + 𝑣𝑐
2 (3.8)
Then, a PI controller is used to minimize this voltage error and drive terminal voltage towards the
reference value i.e. 320 V. The dynamics of the voltage PI controller is described as
𝑖𝑞𝑟(𝑛) = 𝑖𝑞𝑟(𝑛−1) + 𝑘𝑝𝑞(𝑣𝑠𝑒(𝑛) − 𝑣𝑠𝑒(𝑛−1)) + 𝑘𝑖𝑞𝑣𝑒𝑛 (3.9)
Where, 𝑣𝑠(𝑛) = 𝑣𝑠∗ − 𝑣𝑠(𝑛)
indicates the error between reference voltage (𝑣𝑠
∗) and sensed (𝑣𝑠(𝑛) ) terminal
voltage at the nth sampling instant. Kpq and Kiq are the proportional and the integral gains of the voltage PI
controller. The reference source quadrature axis current is given as
𝑖𝑠𝑞∗ = 𝑖𝑞𝑑𝑐 + 𝑖𝑞𝑟 (3.10)
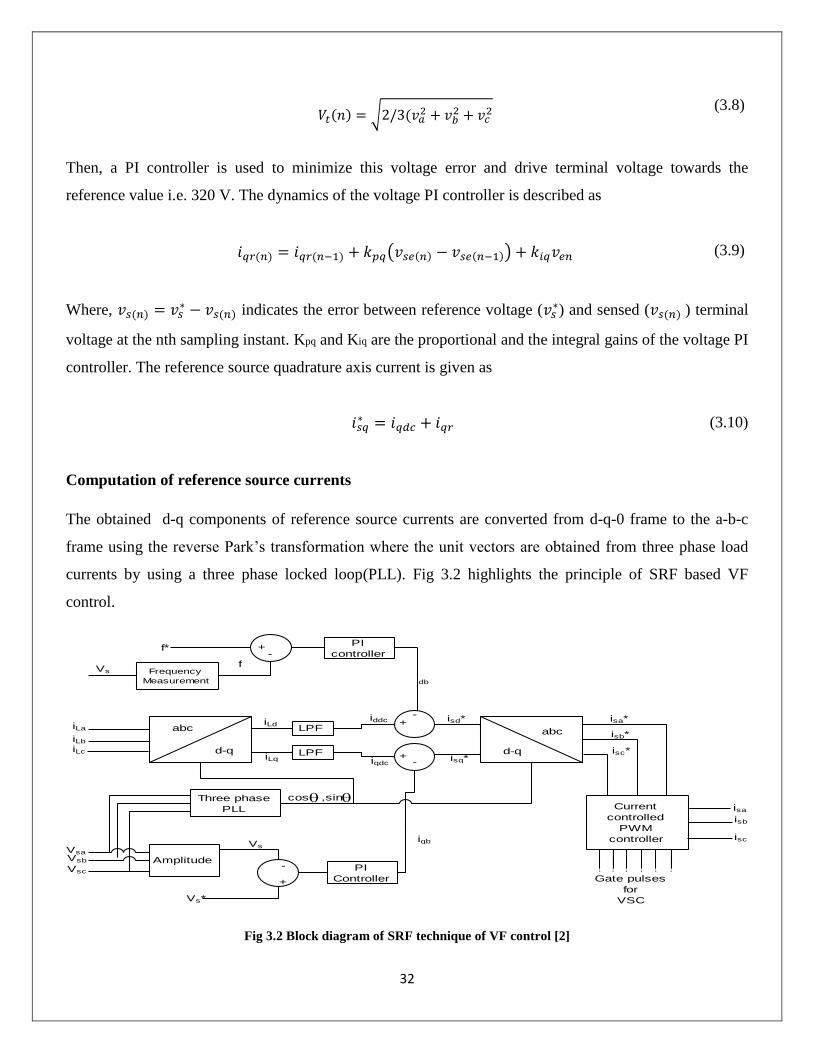
Computation of reference source currents
The obtained d-q components of reference source currents are converted from d-q-0 frame to the a-b-c
frame using the reverse Park’s transformation where the unit vectors are obtained from three phase load
currents by using a three phase locked loop(PLL). Fig 3.2 highlights the principle of SRF based VF
control.
Fig 3.2 Block diagram of SRF technique of VF control [2]
PI
controller
Frequency
Measurement
LPF
LPF
Current
controlled
PWM
controller
Three phase
PLL
AmplitudePI
Controller
abc
d-q d-q
abc
+-
+
+
+
-
-
-
iLa
iLb
iLc
f*
fVs
iLd
iLq
iddc
iqdc
idb
iqb
isd*
isq*
isa*
isb*
isc*
VsaVsb
Vsc
Vs*
Vs
Gate pulses
for
VSC
cos ,sinisa
isb
isc

33
3.2.2 PWM generator
In a PWM current controller, the sensed three phase source currents and the reference source currents so
obtained by above method are compared and the error in each phase is processed through PWM generator.
These current signals are compared with a triangular carrier signal of high frequency about 5 kHz in a
PWM and the gating signals are generated for six IGBT switches of VSC of the VF controller as shown in
Fig 3.3.
Fig 3.3 PWM generator
3.2.3 Voltage Source Converter (VSC)
The three phase ac voltages from PMSG are connected to the six leg three phase voltage source converter
via interfacing inductors. The VSC is built of six IGBT switches with diode in anti-parallel manner as
shown in Fig 3.4. The gating pulses are provided by three single phase current controlled PWM
generators. The reference to these PWM generators is the difference between the reference source current
and computed source current.
PWM
PWM
PWM
Ia
Ib
Ic
Ia*
Ib*
Ic*
S1
S2
S3
S4
S5
S6
A
B
C
+
-
S1 S3 S5
S2 S4 S6
Fig 3.4 Circuit diagram of VSC

34
3.2.4 Battery Energy Storage System (BESS)
Battery energy storage system consists of a rechargeable battery with circuit parameters as resistor and
capacitors as shown in Fig 3.5. Rin is the equivalent series resistance of the series combination of battery,
which is usually a small value (considered 0.001 ohm). The parallel circuit of Rb and Cb is used to
describe the stored energy responsible for self-discharging. The battery parameters to be computed are
battery nominal voltage and parallel circuit capacitance and resistance.
3.3 SIMULATION OF VF CONTROLLER, VSC AND BESS
3.3.1 Battery energy storage system (BESS)
Fig 3.5 Circuit diagram of Battery energy storage system[2]
BESS nominal voltage
The minimum BESS nominal voltage is computed as
𝑉𝑏𝑏 ≥ (
2√2
√3)𝑉𝐿 = 653 𝑉
(3.11)
Where 𝑉𝐿 is the line voltage i.e. 400 v. hence 𝑉𝑏𝑏 is chosen as 756 v.
Parallel circuit capacitor and resistance
The capacitor value for the parallel circuit is computed as
Vbb
CbRb
Rin
Vb

35
𝐶𝑏 =
𝑘𝑊ℎ ∗ 3600 ∗ 1000
0.5 ((𝑉𝑏𝑏𝑚𝑎𝑥2 ) − (𝑉𝑏𝑏𝑚𝑖𝑛
2 ))
(3.12)
Where the minimum discharge battery voltage (𝑉𝑏𝑏𝑚𝑖𝑛) of 661.5 V and maximum discharge battery
voltage (𝑉𝑏𝑏𝑚𝑎𝑥) of 850 V is used. Assuming the storage capacity of battery 110kWh to feed the rated
consumer loads of 4.5 kW for 10 hours when the wind speed is low and generated power is negligible, the
value of the battery capacitor is mathematically obtained as 9120 F. The value of Rb is considered as 10k
ohm for self-discharging circuit.
3.3.2. Voltage source converter (VSC)
Voltage source converter is designed for 11.67kVA, 400 V, 4pole, 50 Hz, 0.9 lagging power factor
PMSG-based SWECS to feed three phase three wire loads. The PMSG supplies rated power of 10.5 kW at
rated voltage of 400 V when it is running at rated speed of 1500 rpm. The required rating of a Battery
energy storage system and its voltage are chosen as per the mathematical formula mentioned above. The
apparent rating of VSC is computed assuming the system is delivering generated power to rated three
phase three wire loads at 0.8 lagging power factor as
𝑆𝑣𝑑𝑐 = √𝑃𝐿
2 + 𝑄𝐿2
(3.13)
Where 𝑄𝐿 is the reactive power required by PMSG to regulate rated voltage under rated load conditions.
The value of 𝑃𝐿 and 𝑄𝐿 are taken as 6.4kW and 4.8kVAR. The value of 𝑉𝑏𝑏 is obtained as 756 V and the
current rating of voltage source converter is calculated as
√3𝑉𝐿𝐼𝑣𝑠𝑐 = 10 𝑘𝑉𝐴 (3.14)
The value of 𝐼𝑣𝑠𝑐 is obtained as 14.43 amps.
3.3.3 Voltage frequency controller (VFC)
The VFC is implemented based on Synchronous reference theory (SRF) of control. In this method active
component and reactive component of reference source current is computed as shown in Fig 3.6. The
36
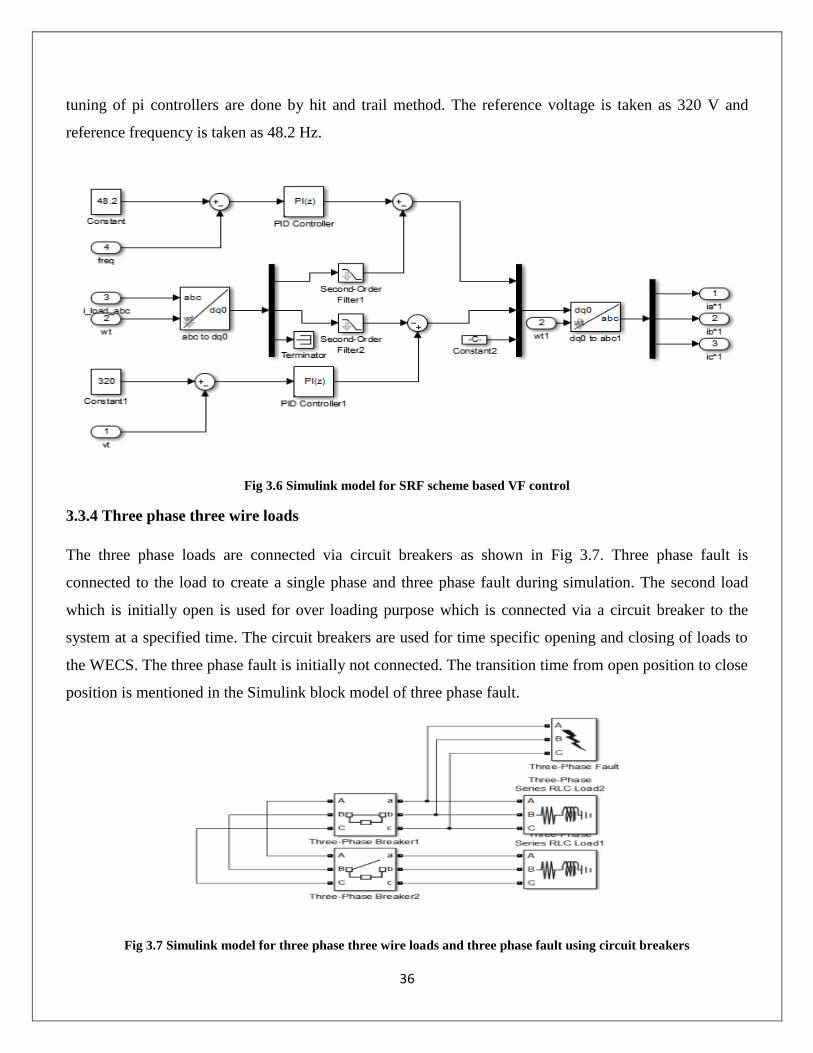
tuning of pi controllers are done by hit and trail method. The reference voltage is taken as 320 V and
reference frequency is taken as 48.2 Hz.
Fig 3.6 Simulink model for SRF scheme based VF control
3.3.4 Three phase three wire loads
The three phase loads are connected via circuit breakers as shown in Fig 3.7. Three phase fault is
connected to the load to create a single phase and three phase fault during simulation. The second load
which is initially open is used for over loading purpose which is connected via a circuit breaker to the
system at a specified time. The circuit breakers are used for time specific opening and closing of loads to
the WECS. The three phase fault is initially not connected. The transition time from open position to close
position is mentioned in the Simulink block model of three phase fault.
Fig 3.7 Simulink model for three phase three wire loads and three phase fault using circuit breakers

37
3.3.5 Interfacing inductors
The interfacing inductor between three phase output terminals of PMSG and the VSC is obtained as
𝐿𝑖 =
√3 ∗ 𝑚 ∗ 𝑉𝑏𝑏
12 ∗ 𝑎 ∗ 𝑓𝑠 ∗ 𝑖𝑝𝑝
(3.15)
Where modulation index (m) is considered as 1, overloading factor (a) is selected as 1.2, 𝑉𝑏𝑏 is taken as
756 V, peak to peak ripple current( 𝑖𝑝𝑝) through VSC equals 5% of the rated current (14.43 A) and
switching frequency of VSC(𝑓𝑠) equal to 3.14 kHz, the value of 𝐿𝑖 is obtained as 50 mH.
3.3.6 Maximum current through IGBT
For considering 5% of peak to peak ripple current, the maximum current through an IGBT is obtained as
𝐼𝑠 = 1.25(𝑖𝑝𝑝 + √2𝐼𝑣𝑠𝑐) (3.16)
This is obtained as 26.41 A. An IGBT of 26 A, and 1000 V rating is selected based on its availability.
3.3.7 Ripple filter
The ripple filter is the series combination of a resistance and a capacitance as shown in Fig 3.8. The filter
is used to block the generated high frequencies and unwanted harmonics in the generated voltages. A low
impedance of 5.92 ohm and capacitance of 10µF is selected for elimination of harmonics. The
combination offers the total impedance of 319 ohm at fundamental voltage.
Fig 3.8 Ripple filter
A
B
C
R
R
R
C
C
C
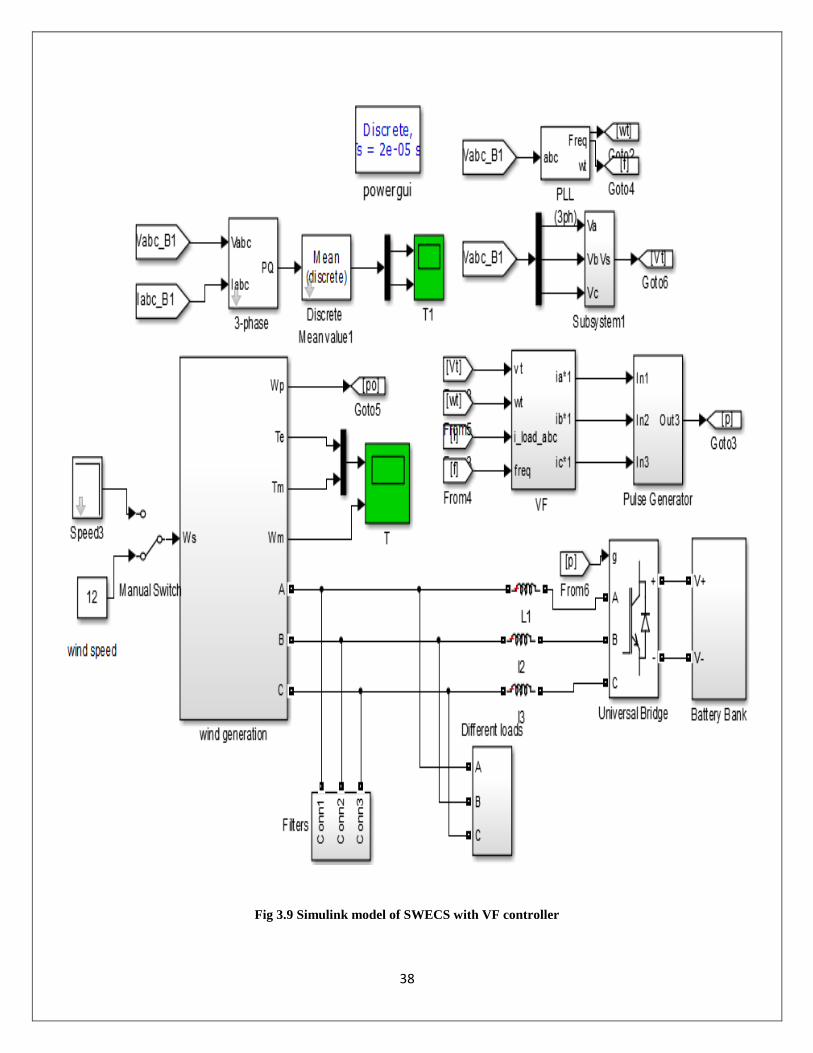
38
Fig 3.9 Simulink model of SWECS with VF controller

39
3.4 SIMULATION RESULTS
3.4.1 Simulation result for variable wind speed.
The wind speed is changed in a unit step manner. Initially the wind speed is 10 m/secs and after step
change the wind speed is 8 m/sec as shown in Fig 3.10. The response of the VF controller is recorded
against this step change in the following diagrams.
Fig 3.10 Variable wind speed
The three phase source voltage before change in wind speed is 320 V and after change in wind speed to
8m/sec the voltage remains almost around 320 V as shown in Fig 3.11. The imbalances seen in the
diagram is due to controlling action of VF controller.
Fig 3.11 Three phase generated voltage of PMSG
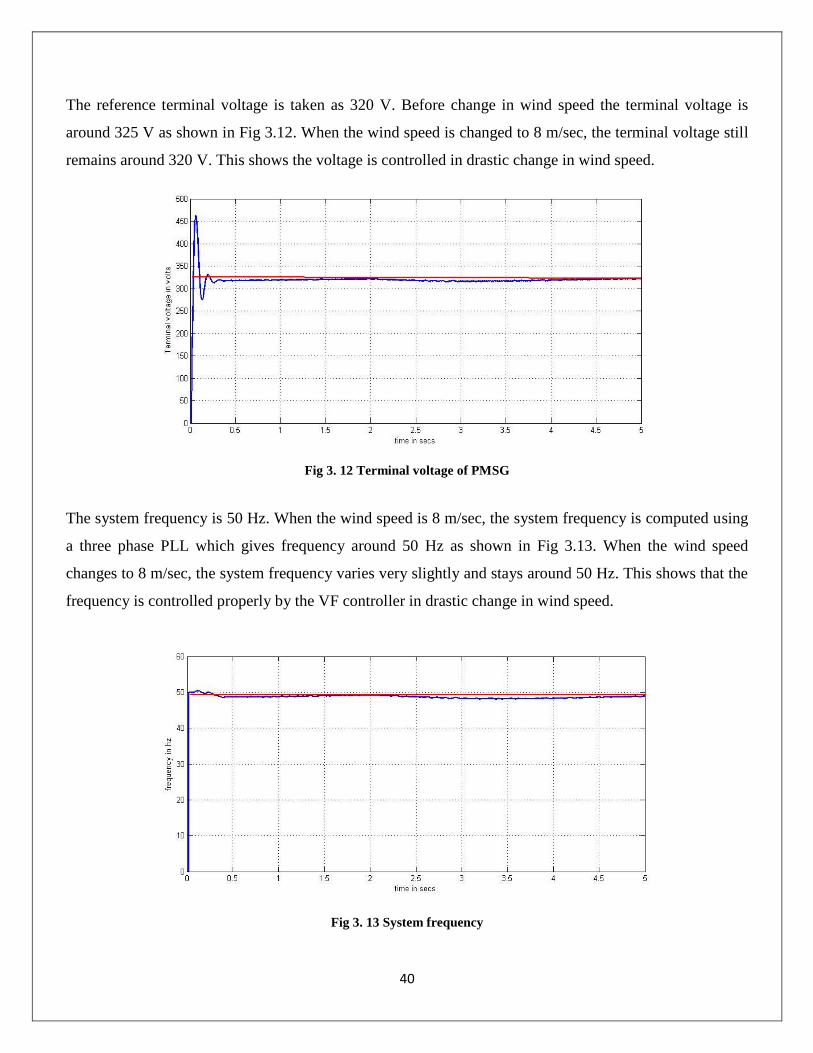
40
The reference terminal voltage is taken as 320 V. Before change in wind speed the terminal voltage is
around 325 V as shown in Fig 3.12. When the wind speed is changed to 8 m/sec, the terminal voltage still
remains around 320 V. This shows the voltage is controlled in drastic change in wind speed.
Fig 3. 12 Terminal voltage of PMSG
The system frequency is 50 Hz. When the wind speed is 8 m/sec, the system frequency is computed using
a three phase PLL which gives frequency around 50 Hz as shown in Fig 3.13. When the wind speed
changes to 8 m/sec, the system frequency varies very slightly and stays around 50 Hz. This shows that the
frequency is controlled properly by the VF controller in drastic change in wind speed.
Fig 3. 13 System frequency
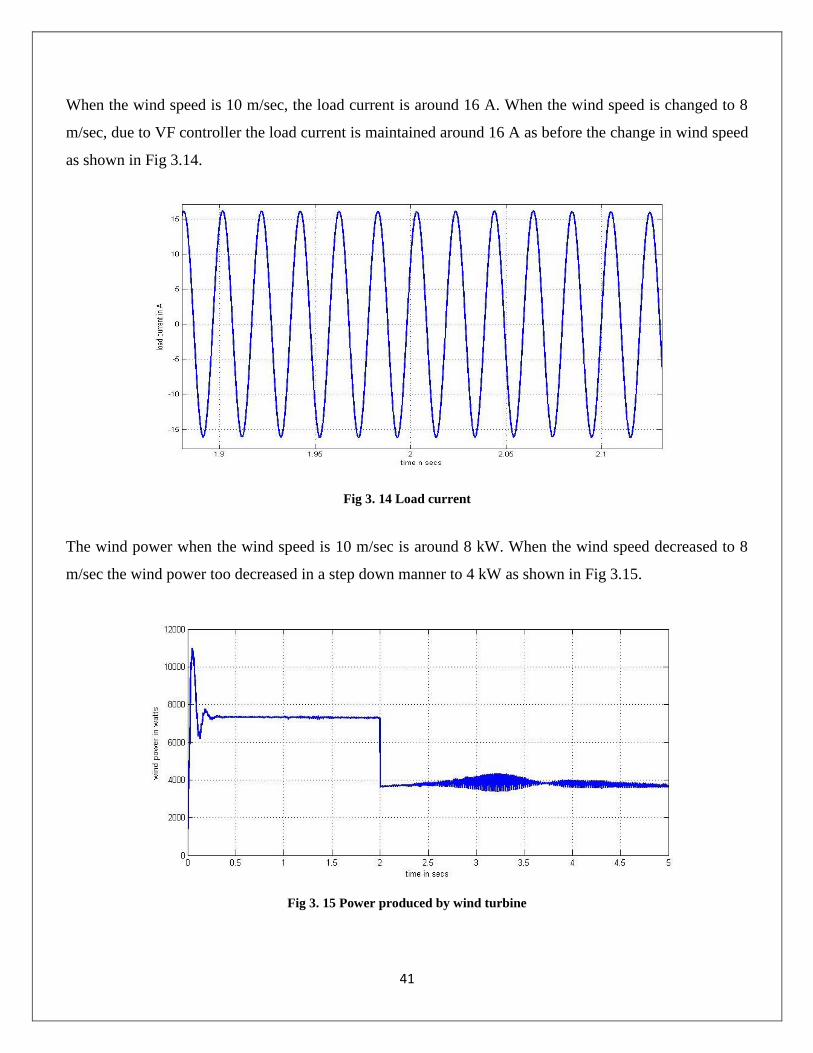
41
When the wind speed is 10 m/sec, the load current is around 16 A. When the wind speed is changed to 8
m/sec, due to VF controller the load current is maintained around 16 A as before the change in wind speed
as shown in Fig 3.14.
Fig 3. 14 Load current
The wind power when the wind speed is 10 m/sec is around 8 kW. When the wind speed decreased to 8
m/sec the wind power too decreased in a step down manner to 4 kW as shown in Fig 3.15.
Fig 3. 15 Power produced by wind turbine
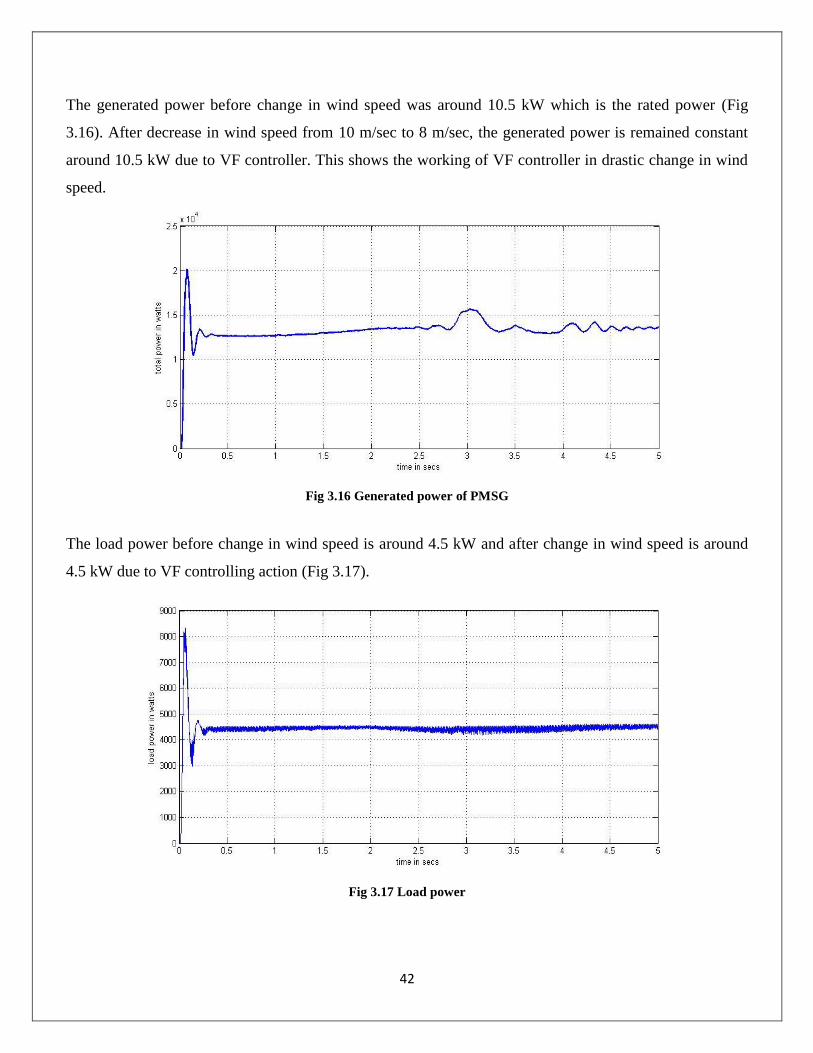
42
The generated power before change in wind speed was around 10.5 kW which is the rated power (Fig
3.16). After decrease in wind speed from 10 m/sec to 8 m/sec, the generated power is remained constant
around 10.5 kW due to VF controller. This shows the working of VF controller in drastic change in wind
speed.
Fig 3.16 Generated power of PMSG
The load power before change in wind speed is around 4.5 kW and after change in wind speed is around
4.5 kW due to VF controlling action (Fig 3.17).
Fig 3.17 Load power
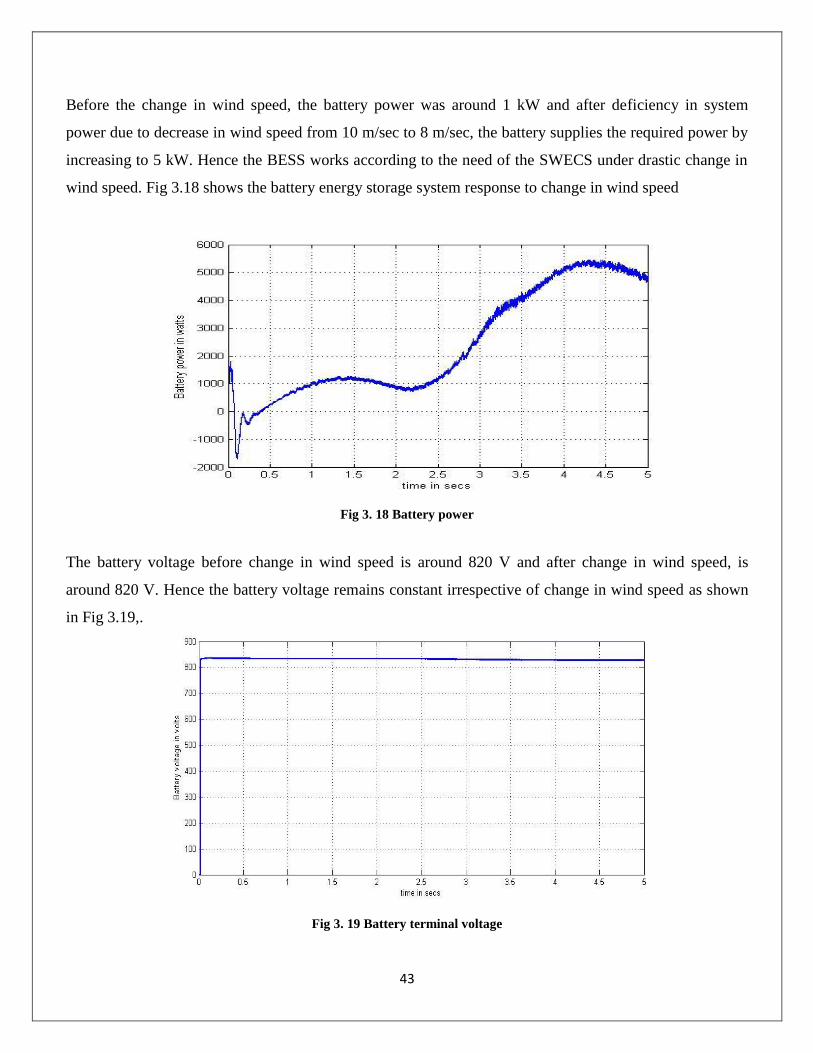
43
Before the change in wind speed, the battery power was around 1 kW and after deficiency in system
power due to decrease in wind speed from 10 m/sec to 8 m/sec, the battery supplies the required power by
increasing to 5 kW. Hence the BESS works according to the need of the SWECS under drastic change in
wind speed. Fig 3.18 shows the battery energy storage system response to change in wind speed
Fig 3. 18 Battery power
The battery voltage before change in wind speed is around 820 V and after change in wind speed, is
around 820 V. Hence the battery voltage remains constant irrespective of change in wind speed as shown
in Fig 3.19,.
Fig 3. 19 Battery terminal voltage
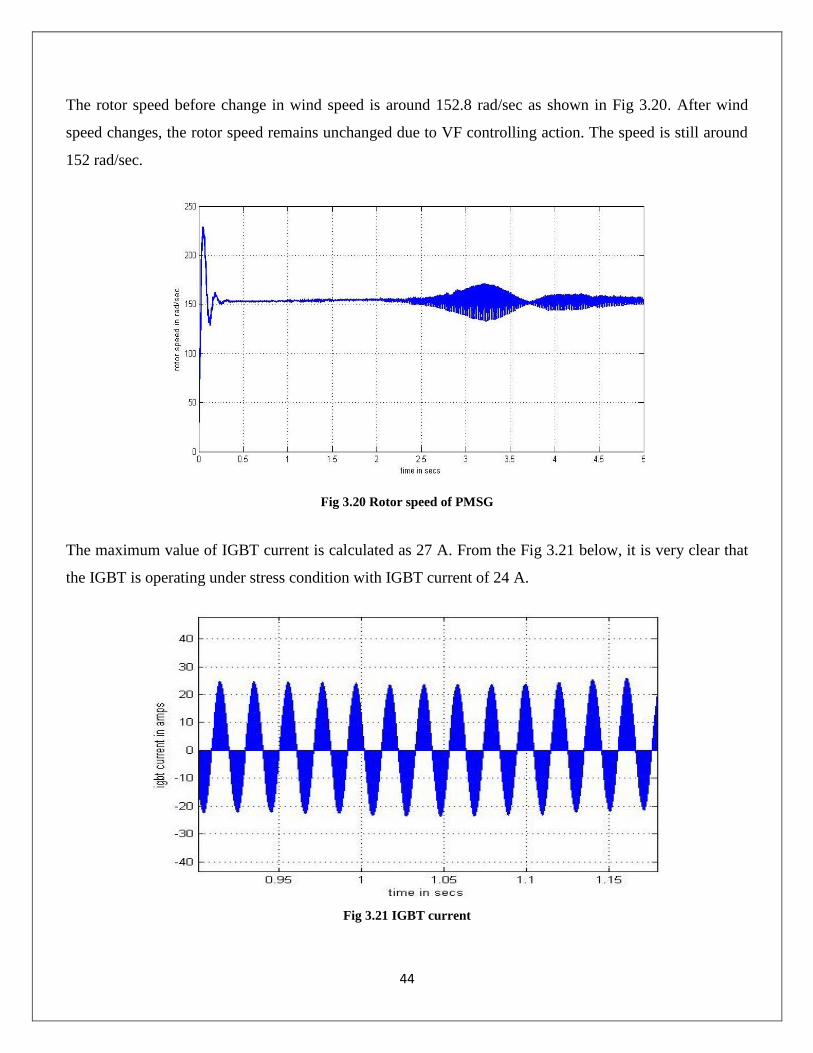
44
The rotor speed before change in wind speed is around 152.8 rad/sec as shown in Fig 3.20. After wind
speed changes, the rotor speed remains unchanged due to VF controlling action. The speed is still around
152 rad/sec.
Fig 3.20 Rotor speed of PMSG
The maximum value of IGBT current is calculated as 27 A. From the Fig 3.21 below, it is very clear that
the IGBT is operating under stress condition with IGBT current of 24 A.
Fig 3.21 IGBT current
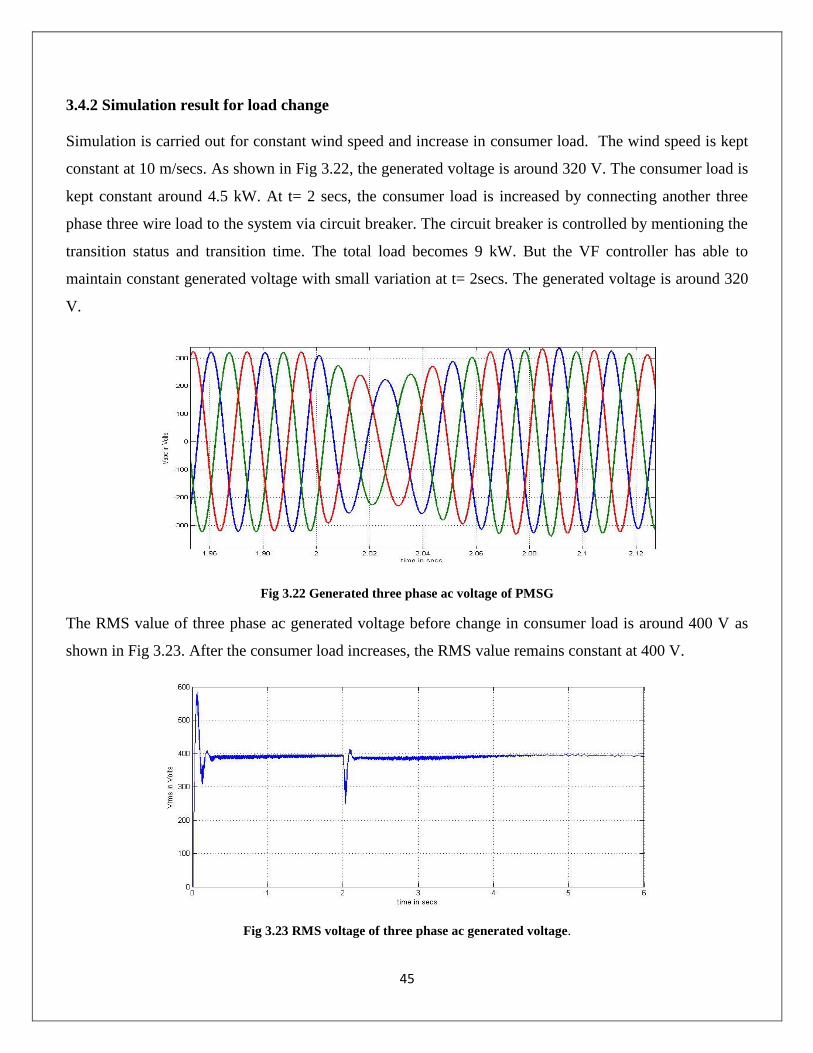
45
3.4.2 Simulation result for load change
Simulation is carried out for constant wind speed and increase in consumer load. The wind speed is kept
constant at 10 m/secs. As shown in Fig 3.22, the generated voltage is around 320 V. The consumer load is
kept constant around 4.5 kW. At t= 2 secs, the consumer load is increased by connecting another three
phase three wire load to the system via circuit breaker. The circuit breaker is controlled by mentioning the
transition status and transition time. The total load becomes 9 kW. But the VF controller has able to
maintain constant generated voltage with small variation at t= 2secs. The generated voltage is around 320
V.
Fig 3.22 Generated three phase ac voltage of PMSG
The RMS value of three phase ac generated voltage before change in consumer load is around 400 V as
shown in Fig 3.23. After the consumer load increases, the RMS value remains constant at 400 V.
Fig 3.23 RMS voltage of three phase ac generated voltage.
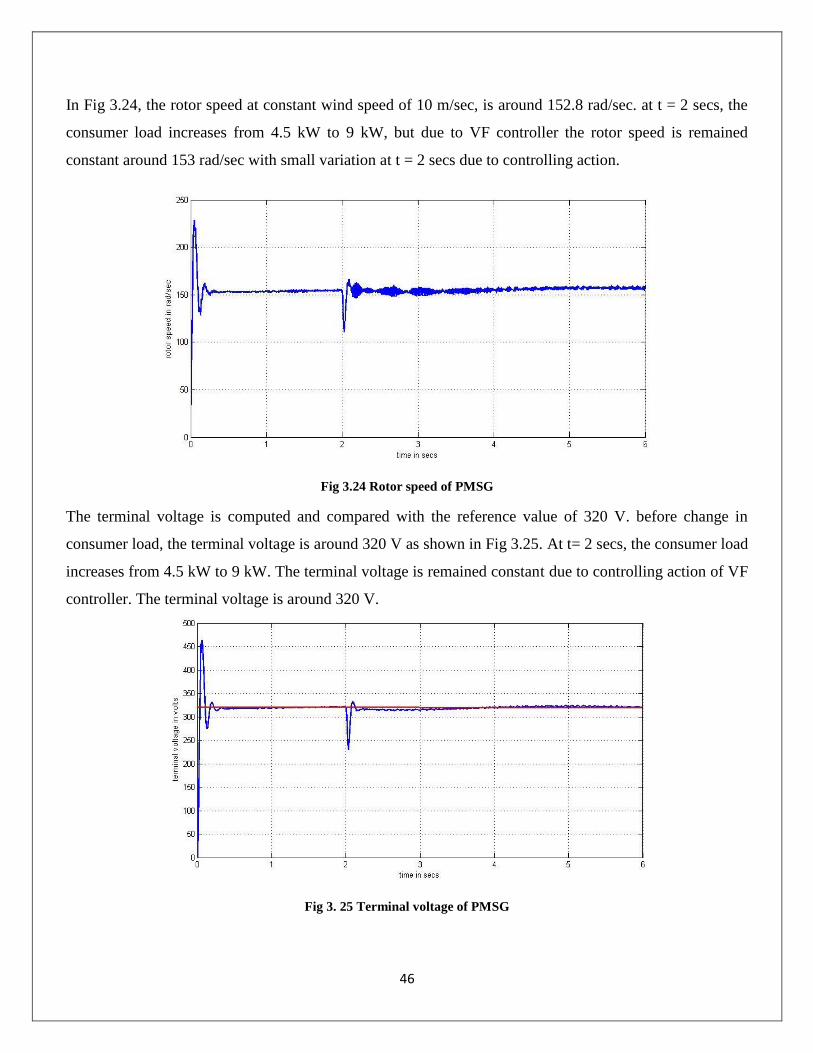
46
In Fig 3.24, the rotor speed at constant wind speed of 10 m/sec, is around 152.8 rad/sec. at t = 2 secs, the
consumer load increases from 4.5 kW to 9 kW, but due to VF controller the rotor speed is remained
constant around 153 rad/sec with small variation at t = 2 secs due to controlling action.
Fig 3.24 Rotor speed of PMSG
The terminal voltage is computed and compared with the reference value of 320 V. before change in
consumer load, the terminal voltage is around 320 V as shown in Fig 3.25. At t= 2 secs, the consumer load
increases from 4.5 kW to 9 kW. The terminal voltage is remained constant due to controlling action of VF
controller. The terminal voltage is around 320 V.
Fig 3. 25 Terminal voltage of PMSG
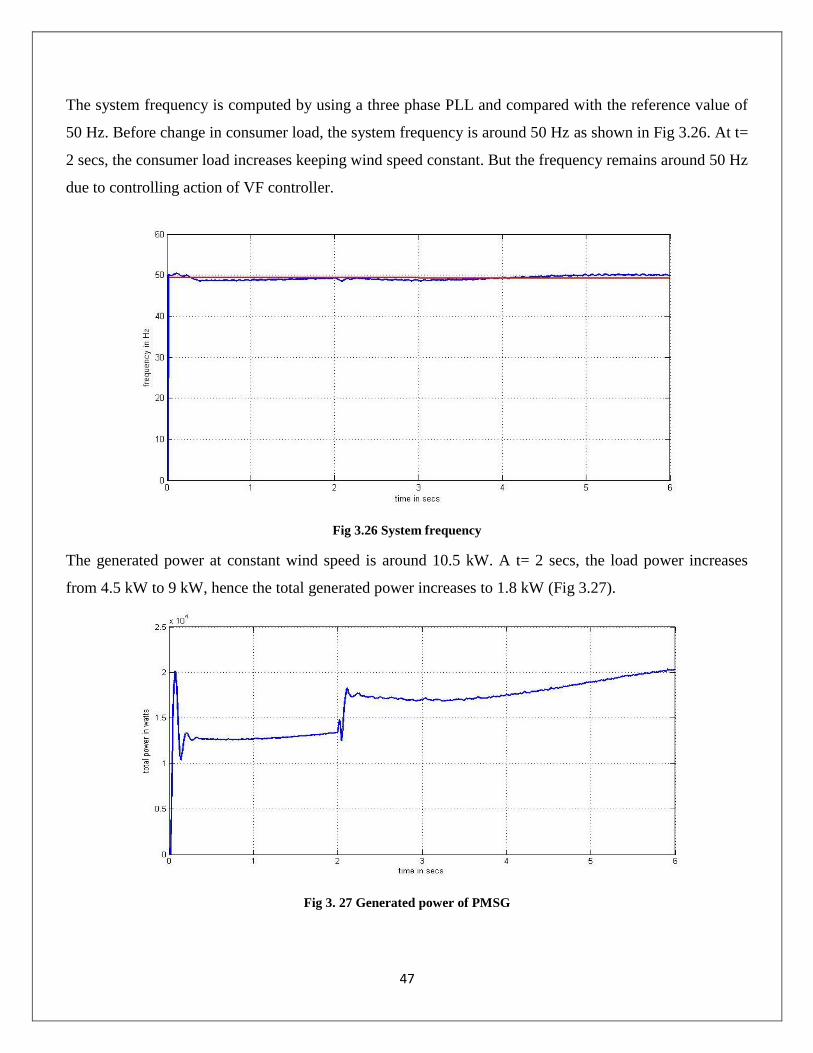
47
The system frequency is computed by using a three phase PLL and compared with the reference value of
50 Hz. Before change in consumer load, the system frequency is around 50 Hz as shown in Fig 3.26. At t=
2 secs, the consumer load increases keeping wind speed constant. But the frequency remains around 50 Hz
due to controlling action of VF controller.
Fig 3.26 System frequency
The generated power at constant wind speed is around 10.5 kW. A t= 2 secs, the load power increases
from 4.5 kW to 9 kW, hence the total generated power increases to 1.8 kW (Fig 3.27).
Fig 3. 27 Generated power of PMSG
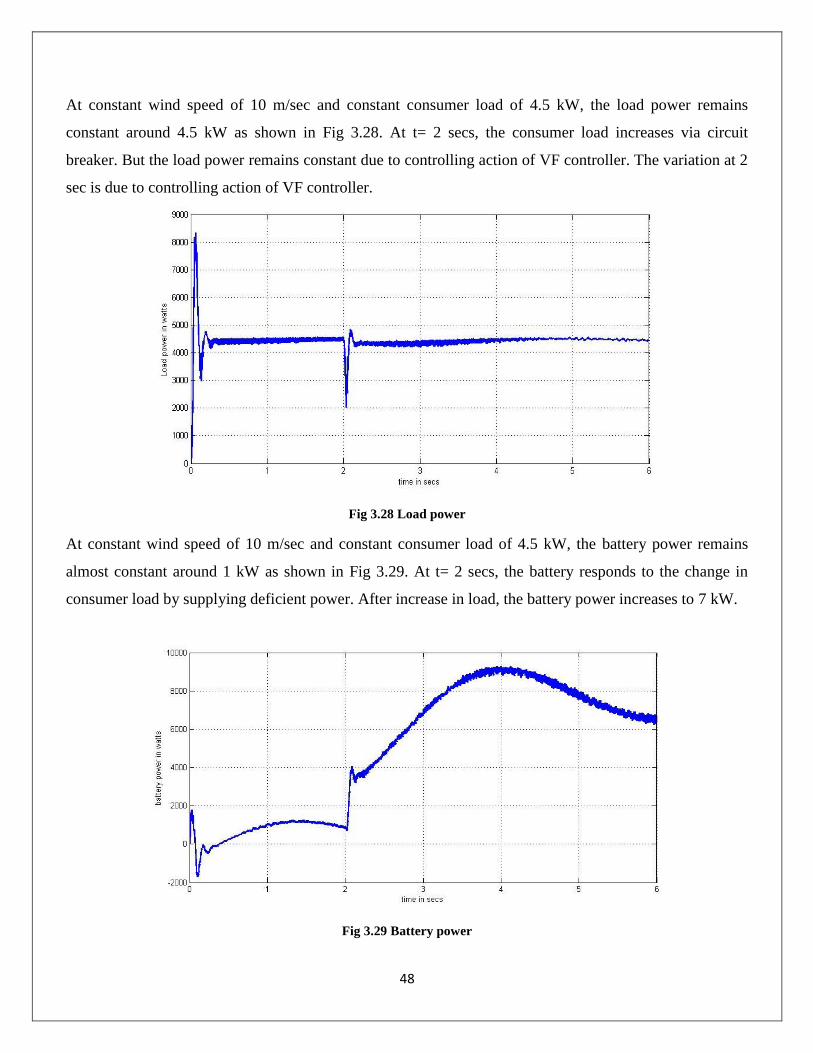
48
At constant wind speed of 10 m/sec and constant consumer load of 4.5 kW, the load power remains
constant around 4.5 kW as shown in Fig 3.28. At t= 2 secs, the consumer load increases via circuit
breaker. But the load power remains constant due to controlling action of VF controller. The variation at 2
sec is due to controlling action of VF controller.
Fig 3.28 Load power
At constant wind speed of 10 m/sec and constant consumer load of 4.5 kW, the battery power remains
almost constant around 1 kW as shown in Fig 3.29. At t= 2 secs, the battery responds to the change in
consumer load by supplying deficient power. After increase in load, the battery power increases to 7 kW.
Fig 3.29 Battery power
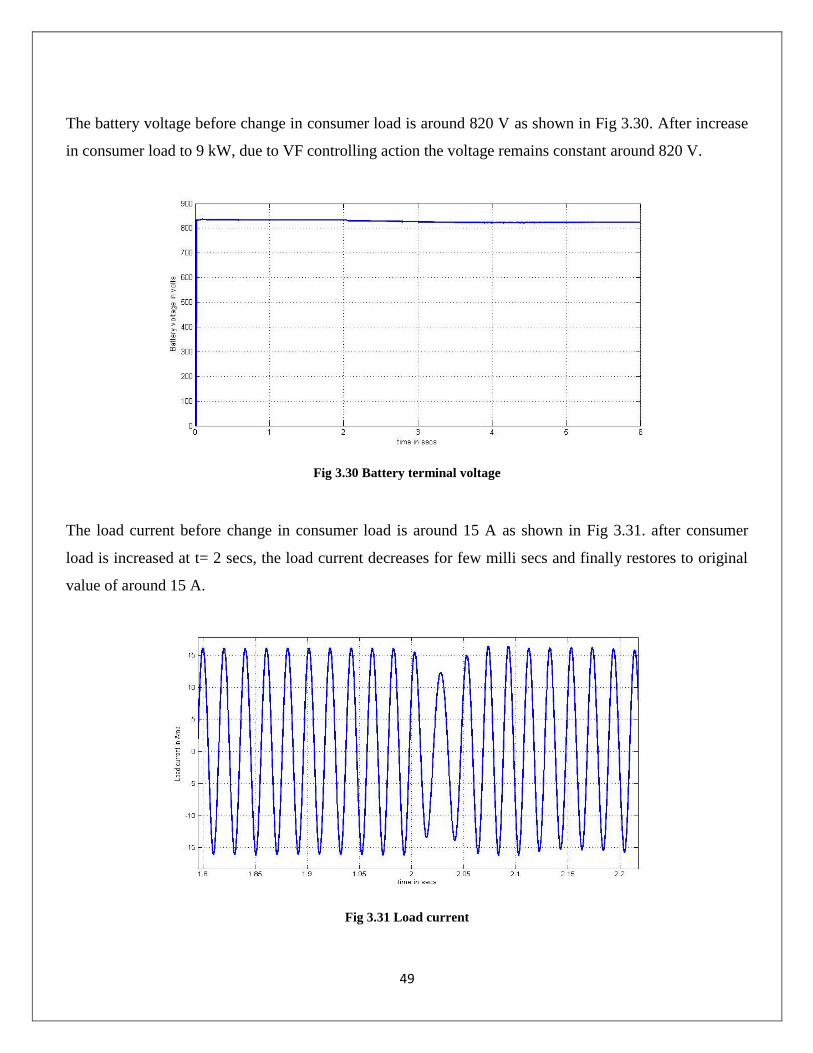
49
The battery voltage before change in consumer load is around 820 V as shown in Fig 3.30. After increase
in consumer load to 9 kW, due to VF controlling action the voltage remains constant around 820 V.
Fig 3.30 Battery terminal voltage
The load current before change in consumer load is around 15 A as shown in Fig 3.31. after consumer
load is increased at t= 2 secs, the load current decreases for few milli secs and finally restores to original
value of around 15 A.
Fig 3.31 Load current
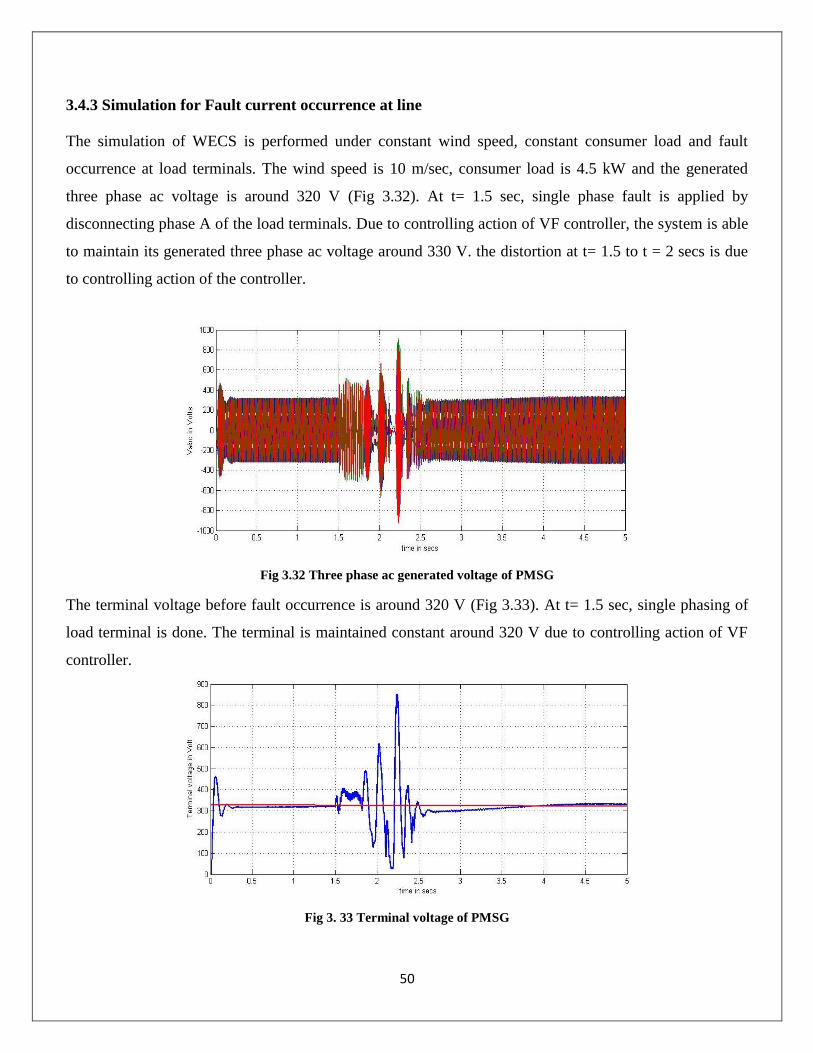
50
3.4.3 Simulation for Fault current occurrence at line
The simulation of WECS is performed under constant wind speed, constant consumer load and fault
occurrence at load terminals. The wind speed is 10 m/sec, consumer load is 4.5 kW and the generated
three phase ac voltage is around 320 V (Fig 3.32). At t= 1.5 sec, single phase fault is applied by
disconnecting phase A of the load terminals. Due to controlling action of VF controller, the system is able
to maintain its generated three phase ac voltage around 330 V. the distortion at t= 1.5 to t = 2 secs is due
to controlling action of the controller.
Fig 3.32 Three phase ac generated voltage of PMSG
The terminal voltage before fault occurrence is around 320 V (Fig 3.33). At t= 1.5 sec, single phasing of
load terminal is done. The terminal is maintained constant around 320 V due to controlling action of VF
controller.
Fig 3. 33 Terminal voltage of PMSG
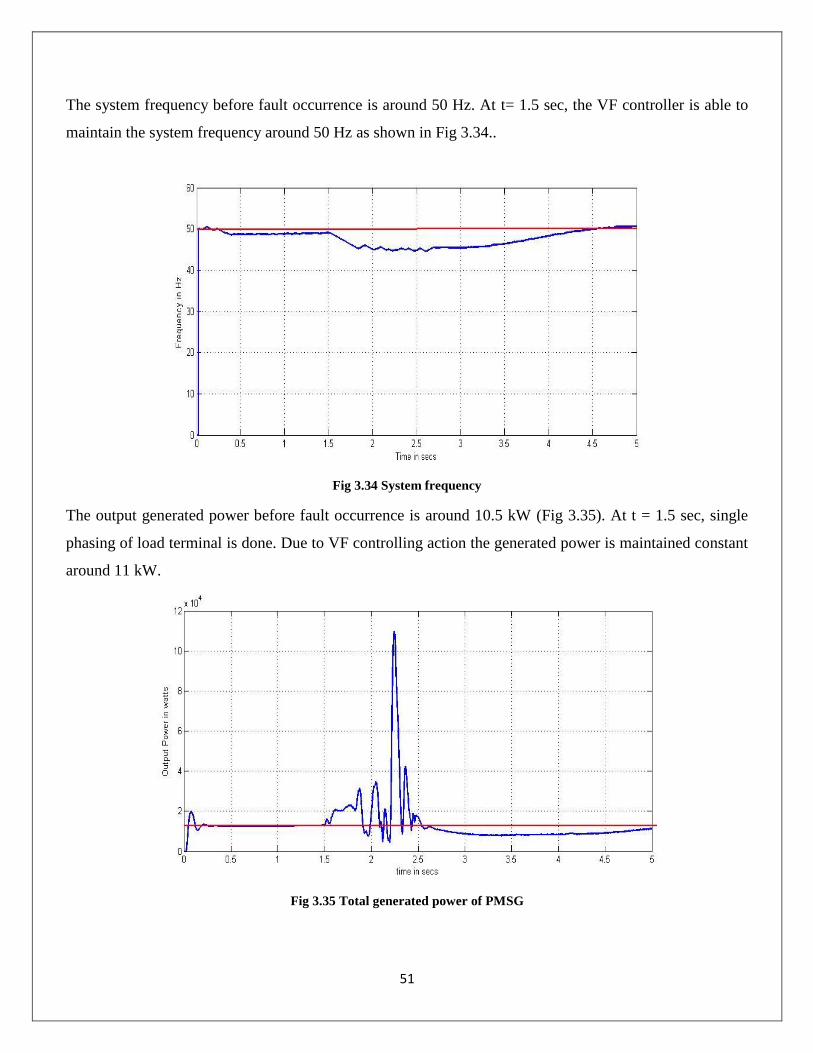
51
The system frequency before fault occurrence is around 50 Hz. At t= 1.5 sec, the VF controller is able to
maintain the system frequency around 50 Hz as shown in Fig 3.34..
Fig 3.34 System frequency
The output generated power before fault occurrence is around 10.5 kW (Fig 3.35). At t = 1.5 sec, single
phasing of load terminal is done. Due to VF controlling action the generated power is maintained constant
around 11 kW.
Fig 3.35 Total generated power of PMSG
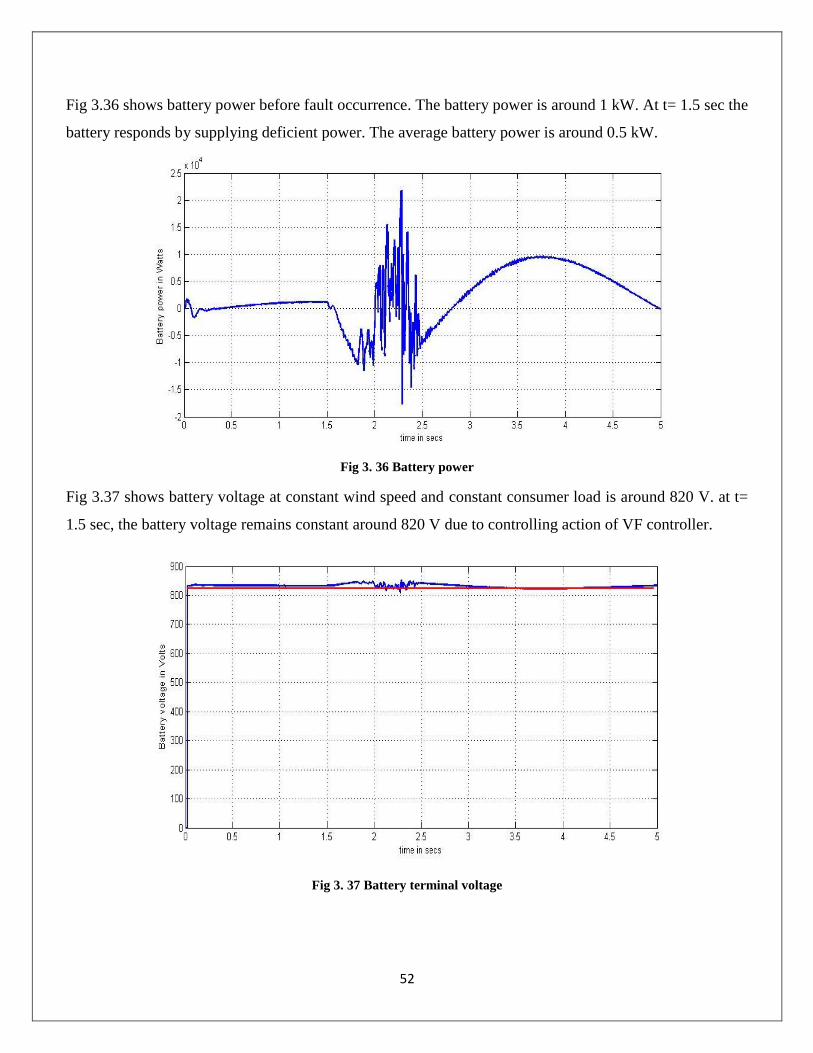
52
Fig 3.36 shows battery power before fault occurrence. The battery power is around 1 kW. At t= 1.5 sec the
battery responds by supplying deficient power. The average battery power is around 0.5 kW.
Fig 3. 36 Battery power
Fig 3.37 shows battery voltage at constant wind speed and constant consumer load is around 820 V. at t=
1.5 sec, the battery voltage remains constant around 820 V due to controlling action of VF controller.
Fig 3. 37 Battery terminal voltage
53
CHAPTER 4
CONCLUSION
The PMSG based WECS was modeled and simulated using MATLAB & SIMULINK. The P&O MPPT
control technique was implemented using a boost converter. Wind speed was varied in a step up manner
from 8 m/sec to 10 m/sec and response of the controller is recorded. The plots of generated output power,
dc link voltage, and output three phase voltage was recorded. The proposed model is run for 5 sec first
without MPPT control and then with MPPT control. The power generated without MPPT controller was
low i.e. 4.5 kW and the power generated with a MPPT controller is around 6 kW. This shows the
improvement in the conversion efficiency of the controller. Most of the power loss occurs in VSC
switches and converters. Hence the proposed MPPT method is utilized and it is seen that the efficiency of
power conversion is increased to around 40%. The SWECS was tested against step change in wind speed
from 10 m/s to 8m/s at t= 2secs, change in load from normal loading to over loading and three phase fault
at line. First the SWECS was run without VF controller against above conditions and the results were
noted down. It is seen from the figures that during change in wind speed at t= 2secs the power extracted
from the wind decreases, three phase generated voltage from PMSG decreases, terminal voltage decreases,
frequency fluctuation occurs, load power decreases, active power of the system decreases. Hence the
system has under-performed. This kind of performance is also expected during over loading condition and
three phase fault condition at line. Therefore the efficiency of the SWECS is way below normal value. The
simulation was then run with SWECS connected to VF controller, VSC and BESS against mentioned
conditions. It was observed that during change in wind speed, over loading and single phase fault the
system is able to maintain its terminal voltage, system frequency around 50 Hz, constant load power,
balanced three phase generated voltage, rated rotor speed. The battery provided the required power during
deficient in power and over loading conditions BESS has been used in all condition for load leveling.
With the demonstrated performance, it have been shown that devised VFCs performs satisfactorily as a
load leveler, a load balancer, a phase balancer under change in wind speed and consumer load

54
SCOPE OF FUTURE WORK
1. Development of hybrid wind and solar energy conversion system for maximum utilization of
renewable energy sources
2. Implementation of SWECS with nonlinear and dynamic loads
3. Development of more efficient maximum power tracking method based on variable step size and
variable pitch angle of wind turbine
4. Connection of stand-alone wind energy conversion system to a micro grid.
5. Development of more efficient voltage frequency controller in order to reduce harmonics and
produce low switching losses.
6. Hardware implementation of WECS with VF controller connected to three phase four wire loads
55
REFERENCE
[1] Hyeung-Gyun Kim, Dong-Choon Lee, Jul-Ki Seok, and G-Myoung Lee, “Stand-alone wind power
generation system using vector-controlled cage-type induction generators,” in Proc. of Inter.
Conference on Electrical Machines and systems, vol.1, pp.289-292, Nov.2003.
[2] Bhim Singh and Gaurav Kumar Kasal, “Voltage and Frequency Controller for a three-phase four wire
autonomous wind energy conversion systems,” IEEE Trans. Energy Conversion, vol. 23, no.2,
pp.509–518, June 2008.
[3] S.Grabic, N. Celanovic and V.A Katic, “Permanent Magnet Synchronous Generator Cascade for
Wind Turbine Application,” IEEE Trans. On Power Electronics, vol. 23, no. 3, pp.1136 – 1142, May
2008.
[4] F.Valenciaga and M.R. Puleston, “High-Order Sliding Control for a Wind Energy Conversion System
Based on a Permanent Magnet Synchronous Generator,” IEEE Trans. on Energy Conversion, vol.23,
no.3, pp. 860-867, Sept. 2008.
[5] M.Popesci, M.V. Cistelecan, L.Melcescu, and M. Covrig, “Low Speed Directly Driven Permanent
Magnet Synchronous Generators for Wind Energy Applications,” in Proc. Of International Conf. on
Clean Electrical Power, 2007. ICCEP '07, pp:784 – 788, 21-23 May 2007.
[6] M.Chinchilla, S.Arnaltes, and J.C.Burgos, “Control of permanent magnet generators applied to
variable-speed wind-energy systems connected to the grid”, IEEE Trans. on Energy Conversion, vol.
21, no.1, pp.130 – 135, March 2006.
[7] C.V Nayar, J. Perihia, F. Thomas, S,J.Philips, T.Pryor and W.L.James, “Investigation of Capacitor
excited induction generators and permanent magnet alternators for small scale wind power generation
” Renewable Energy, vol.1, no.3/4, pp.381–388, July 1991.
[8] B S .Borowy and Z M Salameh, “Dynamic response of a stand-alone wind energy conversion system
with battery energy storage to a wind gust,” IEEE Trans. on Energy Conversion, vol.12, no.1, Mar.
1997.
[9] Hurng-Liahng, Kuen- Der Wu, Jinn- Chang Wu and Wen- Jung Chiang, “A three-phase four- wire
power filter comprising a three-phase threewire active filter and a zig-zag transformer,” IEEE Trans.
of Power Electronics, vol. 23, no. 1, pp. 252- 259, January 2008.
[10] S. Bhattacharya and D. Diwan, “Synchronous Frame Based Controller Implementation for a Hybrid
Series Active Filter System’’, in Proc. Of IEEE IAS Meeting, pp 2531-2540, Jan I995,.
[11] Z.M.Salameh, M.A.Casacca and W.A. Lynch, “A mathematical model of lead acid batteries,” IEEE
Trans. on Energy Conversion, vol.7, no.1, pp. 93-97, Mar. 1992.

56
[12] L.M.Fernandez, J.R.Saenz and F.Jurado, “dynamic Models of wind pharms with fixed speed wind
turbines,” Renewable Energy, vol.31, no.8, pp.1203–1230, July 2006.
[13] Hurng- Liahng Jou, Kuen- Der Wu, Jinn- Chang Wu and Wen- Jung Chiang, “A three-phase four-
wire power filter comprising a three-phase three-wire active filter and a zig-zag transformer,” IEEE
Trans. Power Electron., vol. 23, No. 1, pp. 252- 259, January 2008.
[14] M.C. Benhabib and S. Saadate, “New control approach for four-wire active power filter based on the
use of synchronous reference frame,” Electric Power Systems Research, vol. 73,no. 3, pp. 353-362,
Mar 2005.
[15] María Isabel Milanés, Enrique Romero Cadaval and Fermín Barrero González, “Comparison of
Control Strategies for Shunt Active Power Filters in Three-Phase Four-Wire Systems,” IEEE
Transactions on Power Electronics, vol. 22, no. 1, pp.229-236, Jan. 2007.
[16] B S .Borowy and Z M Salameh, “Dynamic response of a standalone wind energy conversion system
with battery energy storage to a wind gust,” IEEE Trans. on Energy Conversion, vol.12, no.1, Mar.
1997.
Recommended