The Seventh International Colloquium on Bluff Body Aerodynamics and Applications (BBAA7) Shanghai, China; September 2-6, 2012
Design Wind Loads of Wire Mesh Claddings and their
Fatigue Behavior considering Structural Non-Linearities
Frank H. Kemper1, Markus Feldmann2
1,2RWTH Aachen University, Institute for Steel Structures, Aachen, Germany
ABSTRACT: Cladding elements made of prestressed, permeable wire meshes are for different
reasons challenging with respect to their aerodynamic load-response behavior. On the one hand,
the aerodynamic admittance is dominated by the flow resistance of the mesh and its individual
location on the buildings surface. On the other hand, the wind excited stress range spectra may
lead to structural failures caused by fatigue, therefore a proper determination of the expected
gust induced vibrations and a subsequent stress analysis of the geometric non-linear structure is
necessary. By means of wind tunnel tests and a sophisticated analytical model of the non-linear
dynamic structure, a realistic design concept has been derived to allow a closed form structural
dimensioning.
KEYWORDS: Permeable Structures, Gust Response, Geometric non-linearity, Fatigue Design
1 INTRODUCTION
Permeable cladding structures are part of modern architectural concepts. In most cases only
simplest static load assumptions are considered for their design, i.e. a consideration as a free
standing element. However, the complexity of the actual installation position and the thereby
caused interaction with a closed inner facade lead to a significantly modified aerodynamic im-
pact. Especially for permeable elements with high porosity, general rules are rare.
Wind affected structures generally have to withstand fluctuating load cycles. For an ap-
praisement whether the resulting stress range spectra may lead to structural failures during the
designed lifetime, standard methods are still rare because the influencing parameter are mani-
fold. A realistic determination of structural stress range spectra provoked by the natural wind,
needs profound knowledge about the statistical properties of the wind flow at the considered
site, as well as about the dynamic structural behavior. Eventually, the interpretation of the
resulting structural responses in terms of stress amplitudes Δσ and associated frequencies of
occurrence N(Δσ)Li f e over the expected lifetime are the main task to allow fatigue verifications.
The complexity of the topic increases significantly, when the usual linearized considerations are
not sufficient anymore. In the present paper the fatigue behavior of geometrically non-linear
elements under gusty wind loads is considered.
2 WIRE MESH CLADDINGS
Cladding structures made of wire mesh are part of modern architectural concepts and they are
used both as an amendment of conventional closed facades and as sole building closure (e.g. for
car parks). In Figure 1 an innovative cladding concept is shown, thereby the permeable wire
mesh webs are installed in front of the glazed facade.
Design wind loads of wire mesh claddings and their fatigue behavior considering structural non-linearities
1173

The Seventh International Colloquium on Bluff Body Aerodynamics and Applications (BBAA7) Shanghai, China; September 2-6, 2012
Figure 1. Exemplary Wire Mesh Cladding Structure at the Los Angeles Police Department, USA
2.1 Static Wind Force Description
2.1.1 Simplified Load Considerations
For the calculation of the static wind forces, the aerodynamic characteristics of the used meshes
and the influence of the installation position at the building have to be known. In case of multi-
layered cladding systems, where the outer skin is made of a permeable mesh structure and the
inner one is impermeable, the distance between both is an important additional parameter for
the load determination.
Approximative values for the design of mesh elements, a simple accumulation of the flow
resistances leads to conservative results. Taking the example of the multi-layered cladding, the
flow resistance consists of the mesh resistance and the resistance of the inner barrier. The first
effect can be approximated by the Bernoulli Equation under consideration of the pressure loss
coefficient of the mesh (1). Hence, the acting local wind speed ui can be determined to:
ρ2·u2
∞ = (1+ζMesh) · ρ2·u2
i → ui = u∞ ·√
1
1+ζMesh(1)
The computation of local loads can be performed based on the mesh force coefficient and the
local flow velocity vi. Due to the second resistance effect (closed inner wall), generally an
additional reduction of the local flow speed can be expected.
40 45 50 55 60 65 70 75 800
1
2
3
4
Porosity μ in %
Pres
sure
Los
sζ
Pressure Loss Coefficients for round wire meshes
BordaRichards1Richards2IdelchikOwn Measurements
Figure 2. Pressure Loss Coefficients ζ of round Wire Meshes, Comparison of own Measurements and
Data from other Authors
1174
The Seventh International Colloquium on Bluff Body Aerodynamics and Applications (BBAA7) Shanghai, China; September 2-6, 2012
Parameter
α = 0,16
Definition of Angles Measuring Positions
0°
90°
180°
270°
11 12 13
21
31
22
32
23
33
U∞
Φ
180
e
e
225
34 34 90
180
[mm]
225
225
225
225
180
λGeo = 1:250 �Mesh = 1.3
λTime = 1:100 Δ = 15°Φ
ΦRange = 0°-360°I = 0,17u,ref
L = 400 mmux
h = 90 mmref
u = 12 m/sref
Measuring Range
e = 3-20 mm
Figure 3. Illustration of the Wind Tunnel Model and Definition of Measurement Parameters, Angles and
Measuring Positions
2.1.2 BLWT Investigations
More detailed information about the directional wind load components (due to the mesh resis-
tance as well as due to the inner blockage) can be achieved based on experiments in the boundary
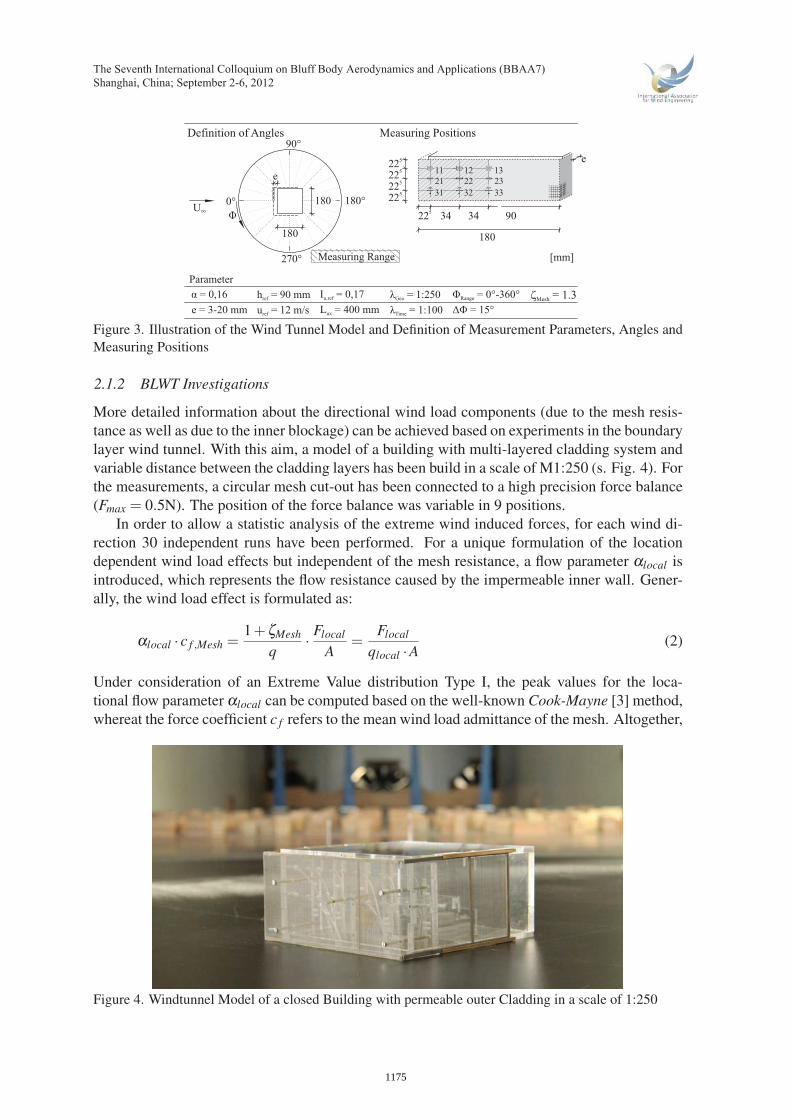
layer wind tunnel. With this aim, a model of a building with multi-layered cladding system and
variable distance between the cladding layers has been build in a scale of M1:250 (s. Fig. 4). For
the measurements, a circular mesh cut-out has been connected to a high precision force balance
(Fmax = 0.5N). The position of the force balance was variable in 9 positions.
In order to allow a statistic analysis of the extreme wind induced forces, for each wind di-
rection 30 independent runs have been performed. For a unique formulation of the location
dependent wind load effects but independent of the mesh resistance, a flow parameter αlocal is
introduced, which represents the flow resistance caused by the impermeable inner wall. Gener-
ally, the wind load effect is formulated as:
αlocal · c f ,Mesh =1+ζMesh
q· Flocal
A=
Flocal
qlocal ·A (2)
Under consideration of an Extreme Value distribution Type I, the peak values for the loca-
tional flow parameter αlocal can be computed based on the well-known Cook-Mayne [3] method,
whereat the force coefficient c f refers to the mean wind load admittance of the mesh. Altogether,
Figure 4. Windtunnel Model of a closed Building with permeable outer Cladding in a scale of 1:250
1175

The Seventh International Colloquium on Bluff Body Aerodynamics and Applications (BBAA7) Shanghai, China; September 2-6, 2012
−0.20
0.20.40.6
Column 1
Row
1
−0.20
0.20.40.6
Column 2
−0.20
0.20.40.6
Column 3
−0.20
0.20.40.6
Row
2
−0.20
0.20.40.6
−0.20
0.20.40.6
0 5 10 15 20−0.2
00.20.40.6
Row
3
Distance e in mm0 5 10 15 20
−0.20
0.20.40.6
Distance e in mm0 5 10 15 20
−0.20
0.20.40.6
Distance e in mm
Figure 5. Characteristic Values α and α for a mesh with a Pressure Loss Coefficient ζMesh = 1.3 for
different Cladding Positions, dependent on the Distance e between Mesh and inner Cladding
the following formulas have been used for the analysis:
αlocal = (1+ζMesh) · mean(Fi)+0.636 · std(Fi)
qp(z = HOK) · c f ·A (3)
αlocal = (1+ζMesh) · mean(Fi)−0.636 · std(Fi)
qp(z = HOK) · c f ·A (4)
In Figure 6 the results for α are plotted, dependent on the wind direction and the distance be-
tween the cladding layers in model scale. Obviously, the perpendicular and nearly perpendicular
flow towards the mesh (Θ ≈ 0◦ −20◦) is most unfavorable for the positive force in wind direc-
tion. With increasing distance between mesh and closed inner facade, as well as with increasing
0.1
0.1
0.1
0.2
0.2
0.20.2
0.3
0.30.3
0.4
0.40.4
0.5
0.5
0.6
Mesh 1, Pos. 11 − αmax
Wind Direction
Dis
tanc
e in
mm
0 20 40 60 80
5
10
15
20
0.1
0.1
0.10.2
0.2
0.20.2
0.3
0.30.3
0.4
0.4
0.5
Mesh 1, Pos. 13 − αmax
Wind Direction
Dis
tanc
e in
mm
0 20 40 60 80
5
10
15
20
0.1
0.1
0.10.2
0.2
0.2
0.3
0.3
0.4
Mesh 1, Pos. 21 − αmax
Wind Direction
Dis
tanc
e in
mm
0 20 40 60 80
5
10
15
200.1
0.1
0.10.1
0.2
0.2
0.3
Mesh 1, Pos. 23 − αmax
Wind Direction
Dis
tanc
e in
mm
0 20 40 60 80
5
10
15
20
Figure 6. Characteristic Flow Parameter α for the building with double-layered Cladding System, depen-
dent on the Layer Distance e and the Direction of Flow Θ, Pressure Loss Coefficient ζMesh = 1.3
1176

The Seventh International Colloquium on Bluff Body Aerodynamics and Applications (BBAA7) Shanghai, China; September 2-6, 2012
a
N0N0
P
�
EAr
a
Figure 7. Duffing Oscillator as a 1 DOF Modell for the Dynamic Behaviour of prestressed Cladding Webs
wind direction, the wind positive wind force decreases. Appreciable negative wind forces only
occur for wind angles above Θ ≈ 45, but the amplitude is commonly not decisive.
3 GEOMETRIC NONLINEAR STRUCTURAL BEHAVIOUR
The dynamic behavior of prestressed line-like elements can be described by a nonlinear single
degree of freedom oscillator. As the resisting force is a polynomial with first and third order
terms in r, this kind of oscillator is denoted as Duffing-Oscillator (s. Fig. 7). According to
the geometric nonlinear kinematic, the deflection r of a Duffing-Oscillator leads to an elastic
(additional) strain:
ε =
(a2 + r2
)1/2 −aa
=
[1+
( ra
)2]1/2
−1 (5)
Due to the increment of strain, the inner force N growths, compared to the prestressing force N0:
N = N0 + εEA = N0 +EA
{[1+
( ra
)2]1/2
−1
}(6)
The associated restoring force FR of the Duffing-Oscillator can be determined by [1]:
FR(r) = 2 ·Nsinφ = 2 ·N r
(a2 + r2)1/2
= 2 ·N0 · ra
[1+
( ra
)2]−1/2
+2EA · ra
{1−
[1+
( ra
)2]−1/2
}(7)
Obviously, the response behavior from Duffing-Oscillators is dominated by the initial force N0,
the longitudinal elasticity EA and the span-width 2 ·a. The decisive parameter which combines
the mentioned values is the degree of nonlinearity δ . It can be expressed as [5]:
δ ≈ EA2a2N0
(8)
For fatigue verifications, not only the extreme values are relevant, but also the distribution of
amplitudes has to be considered. For this aim, it is suggested to make use of advanced stochastic
methods. Classical stochastic linearization approaches utilize an optimization of the expected
value between the nonlinear and the linear stiffness to minimize the divergence of an equivalent
linear system to the original system, in a least-square sense [8]. As a results a single equivalent
structural frequency ωeq can be found. This approach generally leads to a correct representation
of the spectral energy and the increased structural frequencies, but underestimates the spectral
1177

The Seventh International Colloquium on Bluff Body Aerodynamics and Applications (BBAA7) Shanghai, China; September 2-6, 2012
5 10 15 200
0.5
1
1.5
2 2 244
4
6
6
6
8
8
8
10
10
10
2
12
12
14
14
16
16
18
18
0
202224
Span width 2⋅a in m
Def
lect
ion
r in
m
Frequency Ratio ω/ω0 of the deflected Duffing−Oscillator
Figure 8. Increase of structural frequency of a Duffing-Oscillator dependent on span-width 2 · a and
applied deflection r
bandwidth (especially for slightly damped systems) [2]. Therefore Miles [7] and Spanos [9]
used a concept, based on a linear differential equation of motion with a random expression for
the amplitude dependent structural frequency (Equivalent Linear System, ELS). Transferring
these concepts and extending them to stochastic wind loads with non-zero means leads to good
approximations of the spectral system response, as well. Due to the analytic approach, they are
advantageous compared to transient methods in case of structures which can be reduced to a
single degree of freedom system.
In this paper, the ELS method is presented. The amplitude related structural frequency ω(A)can be obtained from:
r+2ζ ω0r+ω2(A) · r = f (t) (9)
Hence, the differential equation of motion (9) represents a system of linear single degree of
freedom oscillators. The Eigenfrequency ω is dependent on the deflective amplitude A and the
expected frequency of its occurrence Pn(A). According to [7], [9],[6] probability distribution
can be expressed for a clear white noise excitation as:
P(A) =2πω2
0 (A+δ ·A)ω(A)
· e−A2(δ ·A2+2)
4·σ20 and Pn(A) =
P(A)∫ ∞0 P(a)da
(10)
A dynamically excited Duffing-Oscillator changes its frequency continuously, the amplitude
related detuning can be expressed analytically [1]:
ω(A)ω0
=
√1+
3
4δA2 (11)
In Figure 8 exemplarily the increase factors of the structural frequency ω(A)/ω are plotted over
the system span width and the applied deflection.
The approximate PSD of the structural deflective response Saa(ω) can now be computed accord-
ing to:
Saa(ω) =∫ ∞
0
S f f (ω)
(ω2 (A)−ω2)2+(2ζ ω0ω)2
·Pn(A)dA (12)
Although equation 10 is only exact for a white noise excitation with zero expectation, it has been
used as an approximation here, whereat the variance σ20 of the process has been derived by a
1178

The Seventh International Colloquium on Bluff Body Aerodynamics and Applications (BBAA7) Shanghai, China; September 2-6, 2012
linear spectral computation with the actual force spectrum (based on a Kaimal PSD of the wind
velocity).
Wind gust effects generally come along with a significant mean load component. The struc-
tural vibrations then take place around the resulting average deflection. To incorporate those
effects alternatively in the before described computation algorithm, firstly the static displace-
ment rstat has to be computed based on the associated load situation:
Fstat = 2 ·N0 · rstat
a+(EA−N0) ·
(rstat
a
)3(13)
Due to the static deflection, the structural stiffness increases. Subsequently, all dynamic compu-
tations acc. to Equations (11) to (12), may be used with the associated structural characteristics
of the modified system (denoted by the index “1”), i.e. the Eigenfrequency ω1 and the vari-
ance σ21 . Consistently, in Equation 12 the varying structural frequency is to be computed for
A1 = A+ rstat.
4 DETERMINATION OF NONLINEAR RESPONSES WITH STOCHASTIC METHODS
The geometric non-linear behavior can be considered analytically based on the findings of sec-
tion 3. Typical prestressed cladding constructions show degrees of non-linearity between δ = 50
and δ = 100. In this section, the presented ELS method has been performed for structures with
different degrees of non-linearity under varying load cases. As a load scenario, a 10 min gust
impact has been considered, whereat for the aerodynamic admittance, different local flow coef-
ficients have been taken into account. All associated properties are listed in Table 1.
As a first result, the power spectral densities of the structural deflections are plotted in Figure
10, as a comparison between the ELS method to conventional time based methods. The spectral
results reveal the accuracy of the analytic method with respect to the predicted response behavior.
In section 5, the consequence of the method, related to the fatigue prediction is investigated.
5 FATIGUE BEHAVIOUR AND STRUCTURAL INFLUENCE ON THE LIFETIME
Making use of a PSD based cycle count algorithm which is able to interpreted processes with
arbitrary bandwidth, namely the Dirlik-algorithm [4], the rain-flow cycle count succeeds with
frequency based responses. Even in case of nonlinear structures, the Rainflow classification can
be performed based on the (with the prior described methods) computed power spectral density
Suu(ω).The applicability of the presented methodology is illustrated by exemplary computations of
flexible cladding elements (membrane structures) with different, realistic mechanical parame-
ters. By means of these results, it is demonstrated how the different parameters influence the
expectable damage and the fatigue life respectively.
So far, only the impact of a short-termed extreme wind on the stress range distribution has
been considered. For the computation of the expected design life-time under fatigue aspects,
the prevalent wind events during the foreseen lifetime have to be taken into account as well.
Table 1. Overview of Aerodynamic and Mechanic Properties of the Exemplary Computations
System αlocal δ System αlocal δ System αlocal δS01-LC1 0.05 0.4 S02-LC1 0.05 4.0 S03-LC1 0.05 40
S01-LC2 0.5 0.4 S02-LC2 0.5 4.0 S03-LC2 0.5 40
S01-LC3 2.0 0.4 S02-LC3 2.0 4.0 S03-LC3 2.0 40
1179

The Seventh International Colloquium on Bluff Body Aerodynamics and Applications (BBAA7) Shanghai, China; September 2-6, 2012
10−1
100
101
102
10−8
10−6
10−4
10−2
100
102
PSD
in m
2 ⋅ s
Frequency in Hz
SRR
[S1−LC1]
10−1
100
101
102
10−8
10−6
10−4
10−2
100
102
PSD
in m
2 ⋅ s
Frequency in Hz
SRR
[S1−LC2]
10−1
100
101
102
10−8
10−6
10−4
10−2
100
102
PSD
in m
2 ⋅ s
Frequency in Hz
SRR
[S1−LC3]
10−1
100
101
102
10−8
10−6
10−4
10−2
100
102
PSD
in m
2 ⋅ s
Frequency in Hz
SRR
[S2−LC1]
10−1
100
101
102
10−8
10−6
10−4
10−2
100
102
PSD
in m
2 ⋅ s
Frequency in Hz
SRR
[S2−LC2]
10−1
100
101
102
10−8
10−6
10−4
10−2
100
102
PSD
in m
2 ⋅ s
Frequency in Hz
SRR
[S2−LC3]
10−1
100
101
102
10−8
10−6
10−4
10−2
100
102
PSD
in m
2 ⋅ s
Frequency in Hz
SRR
[S3−LC1]
ELS Time
10−1
100
101
102
10−8
10−6
10−4
10−2
100
102
PSD
in m
2 ⋅ s
Frequency in Hz
SRR
[S3−LC2]
ELS Time
10−1
100
101
102
10−8
10−6
10−4
10−2
100
102
PSD
in m
2 ⋅ s
Frequency in Hz
SRR
[S3−LC3]
ELS Time
Figure 9. PSD of deflective Response for different Structures with ELS and transient Computation
0 2 40
1
2x 10
4
N
σ
RF [S1−LC1]
ELSTime
0 100 200 3000
1000
2000
σ
RF [S1−LC2]
ELSTime
0 200 400 600 8000
500
1000
σ
RF [S1−LC3]
ELSTime
0 20 400
1
2x 10
4
N
σ
RF [S2−LC1]
ELSTime
0 1000 20000
1000
2000
3000
σ
RF [S2−LC2]
ELSTime
0 2000 40000
1000
2000
3000
σ
RF [S2−LC3]
ELSTime
0 200 4000
1
2x 10
4
N
σ
RF [S3−LC1]
ELSTime
0 2000 40000
5000
10000
σ
RF [S3−LC2]
ELSTime
0 5000 100000
5000
10000
σ
RF [S3−LC3]
ELSTime
Figure 10. Stress Range Spectra (Rainflow Method) of ELS and transient computed Responses
1180

The Seventh International Colloquium on Bluff Body Aerodynamics and Applications (BBAA7) Shanghai, China; September 2-6, 2012
Weibull A für RK=1, H=10,0m
10° W 0° 10° E 20° E
40° N
50° N
60° N
A [m/s]0 2 4 6 8 10 12
Weibull k für RK=1, H=10,0m
10° W 0° 10° E 20° E
40° N
50° N
60° N
k0.5 1 1.5 2 2.5 3
Figure 11. Weibull Parameter for Europe, Roughness Category 1 (Data Source: European Wind Atlas [10])
Merging all before described influence parameters, the stress range spectra can be computed by
the following expression:
N(Δσ)Li f e =∫ u
0
TLi f e
Tre f· f (u) ·N(Δσ ,u)du (14)
where: TLi f e is the designed Lifetime, Tre f is the average time of the mean wind speed, f (u) is
the probability density function of the wind velocity and N(Δσ ,u) is the stress range spectra for
a given mean wind speed within the average time period.
The probability density function for the frequency of occurrence of mean wind speeds can
be derived based on the Weibull-Distribution:
f (u) =kA
(uA
)k−1
exp
[−(
uA
)k]
(15)
where: A is the scale and k is the form parameter of the distribution. Site dependent values for
these parameters can be taken from e.g. the European Wind Atlas [10]. In Fig. 11, exemplarily
the parameters A and k (cumulated over all directions) are plotted in the map of Europe for the
roughness category 1 (z0 = 0.05m), for a height of 10m and for an average period of T = 1 hour.
Based on the appropriate assumptions for the site dependent extreme wind impact and the
probability of exceedance of the prevalent wind speeds, a realistic consideration of fatigue im-
pact is possible. Using the direction related Weibull Parameter, even a directional design is
possible.
The fatigue verification now succeeds with common methods, like Miner-Rule for a linear
damage cumulation with an appropriate s-N-Curve. In most cases the s-N-Curve should be
obtained from dynamic fatigue tests, as general notch cases are not classified for crimped wires.
6 CONCLUSIONS
Static wind load assumptions have been derived for permeable cladding structures, installed
as an outer skin in front on conventional, closed facades. Based on simplified models of the
total pressure drop and the extended Bernoulli equation, conservative loads can be determined.
Additional wind tunnel results show a good concordance of the local flow parameter αlocal .
With respect to the structural investigations, it has been shown, that reliable fatigue verifications
based on cumulative damage predictions are possible by means of closed form spectral methods,
1181

The Seventh International Colloquium on Bluff Body Aerodynamics and Applications (BBAA7) Shanghai, China; September 2-6, 2012
even for highly nonlinear structures. The chosen method, the equivalent linearization approach,
leads to appropriate estimations of the increased structural frequencies of geometrical nonlinear
systems under loading, as well as of the obtained damage prognoses. The presented examples
emphasize the complexity of the topic and the effects of the various structural and aerodynamic
parameters with respect to the expected fatigue life.
REFERENCES
[1] J. Argyris and H.-P. Mlejnek. Computerdynamik der Tragwerke, volume III of Die Methode derfiniten Elemente. Vieweg, Braunschweig, studienausg. edition, 1997.
[2] R. Bouc. The power spectral density of response for a strongly non-linear random oscillator. Journalof Sound and Vibration, (175):317–331, 1994.
[3] N. J. Cook and J. R. Mayne. A novel working approach to the assessment of wind loads for equiv-
alent static design. In Journal of Industrial Aerodynamics, volume 4, pages 149–164. ELSEVIER
SCIENCE BV, 1979.
[4] T. Dirlik. Application of computers to fatigue analysis. PhD thesis, Warwick University, Warwick,
1985.
[5] F. H. Kemper, M. Feldmann, and J. Kuck. Stochastic vibrations of prestressed membrane cladding
elements. In Michael Brennan, editor, RASD. Synergie Lymington Ltd, Lymington and UK, 2010.
[6] Y. K. Lin. Probabilistic Theory of Structural Dynamics. McGraw-Hill Book Company, New York,
1967.
[7] R.N Miles. Spectral response of a bilinear oscillator. Journal of Sound and Vibration, (163):319–
326, 1993.
[8] J.B Roberts and P.D Spanos. Random vibration and statistical linearization. Dover books on
engineering. Dover Publ, Mineola and NY, 2003.
[9] P. D. Spanos, I.A Kougioumtzoglou, and C. Soize. On the determination of the power spectrum
of randomly excited oscillators via stochastic averaging: An alternative perspective. ProbabilisticEngineering Mechanics, (26):10–15, 2011.
[10] I. Troen and E. L. Petersen. European wind atlas. Risø National Laboratory, Roskilde, 1989.
1182
Recommended