Detecting Financial
Danger Zones
with Machine Learning
SYstemic Risk TOmography:
Signals, Measurements, Transmission Channels, and Policy Interventions
Marika Vezzoli Department of Economics and Management - University of Brescia CSRA research meeting – December, 15 2014
Main ObjectiveWhat’s our main target → stratify the “Risk Temperature” of:
Country-riskBank(and other Financial)-riskCorporate-risk
How do we do → Data Mining techniques:Regression Trees (RT) & Heatmap in each RT risk cluster (final node)Random Forests (RF)Tree on ensemble predictions (FRT – Final Regression Tree)
Where in SYRTO → EWS Implementation (WP 7)Risk Thresholds Warning Signals
Marika VezzoliUniversity of Brescia
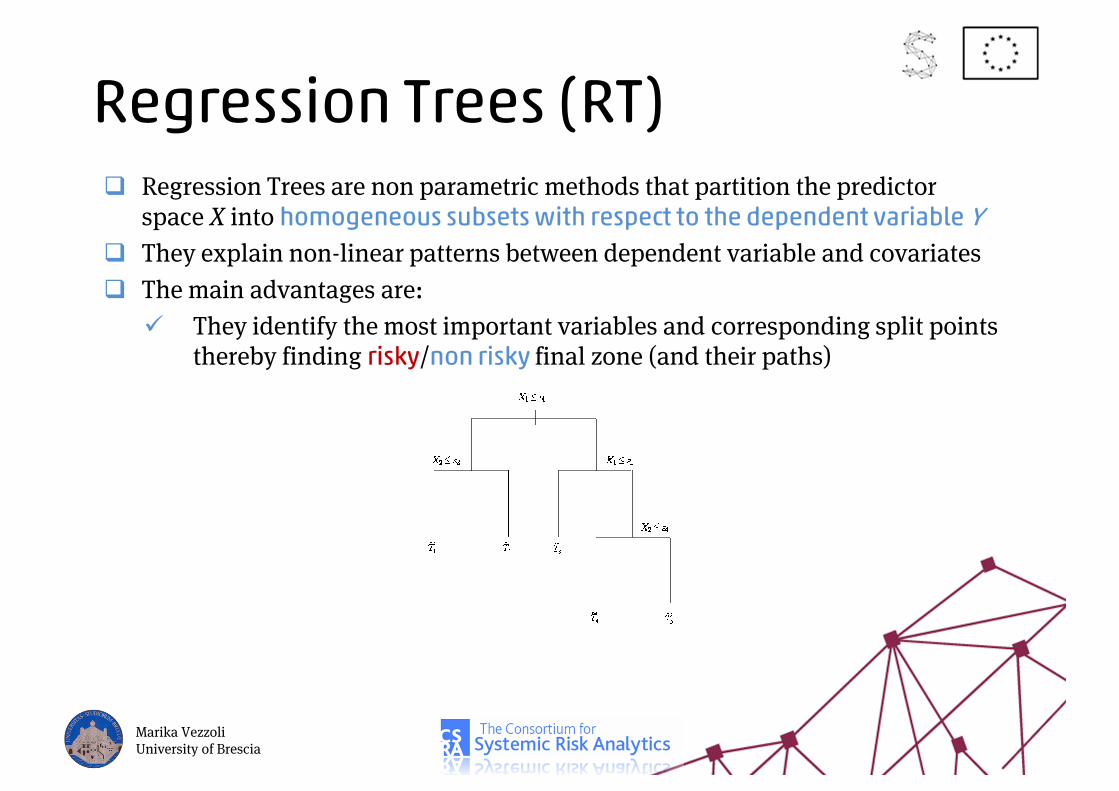
Regression Trees (RT)Regression Trees are non parametric methods that partition the predictor space X into homogeneous subsets with respect to the dependent variable YThey explain non-linear patterns between dependent variable and covariatesThe main advantages are:
They identify the most important variables and corresponding split points thereby finding risky/non risky final zone (and their paths)
Marika VezzoliUniversity of Brescia
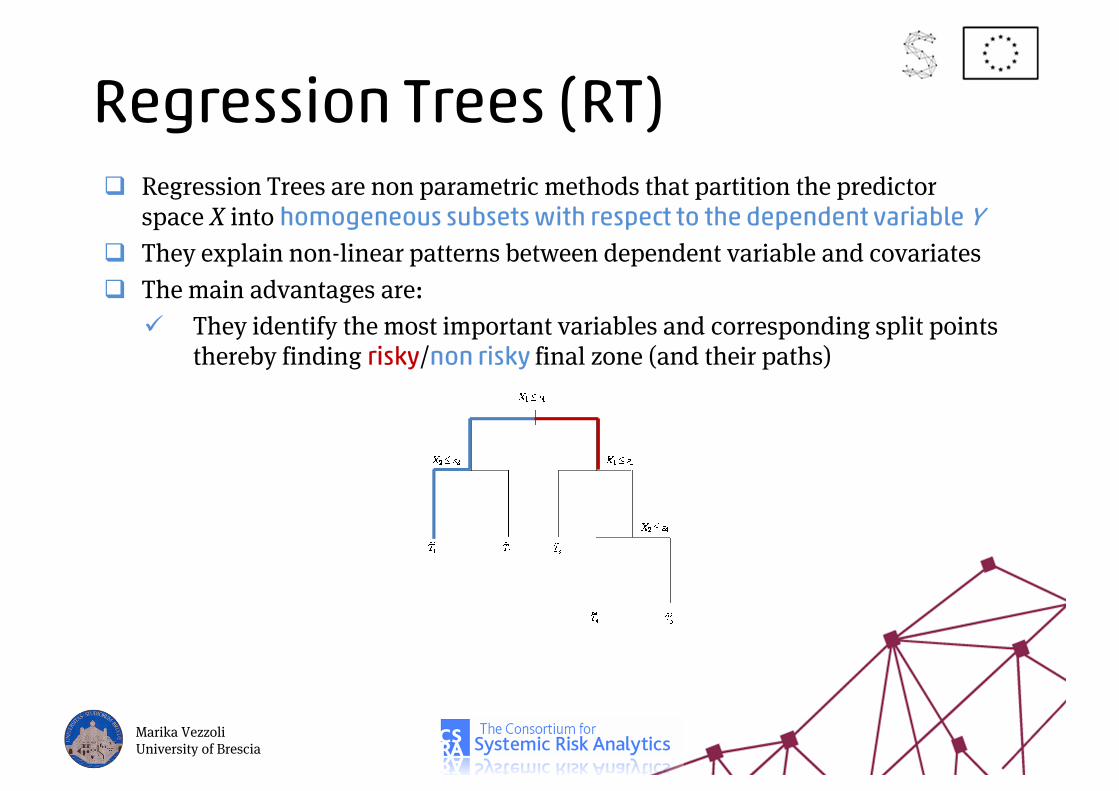
Regression Trees (RT)Regression Trees are non parametric methods that partition the predictor space X into homogeneous subsets with respect to the dependent variable YThey explain non-linear patterns between dependent variable and covariatesThe main advantages are:
They identify the most important variables and corresponding split points thereby finding risky/non risky final zone (and their paths)
Marika VezzoliUniversity of Brescia
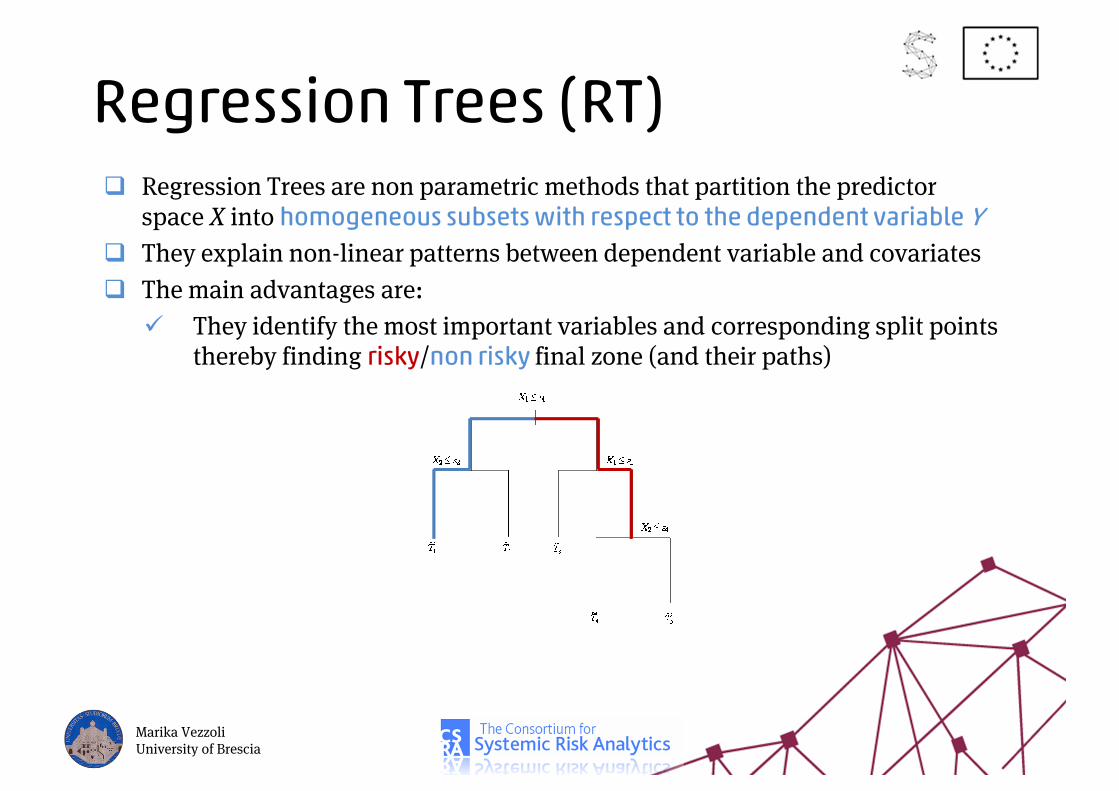
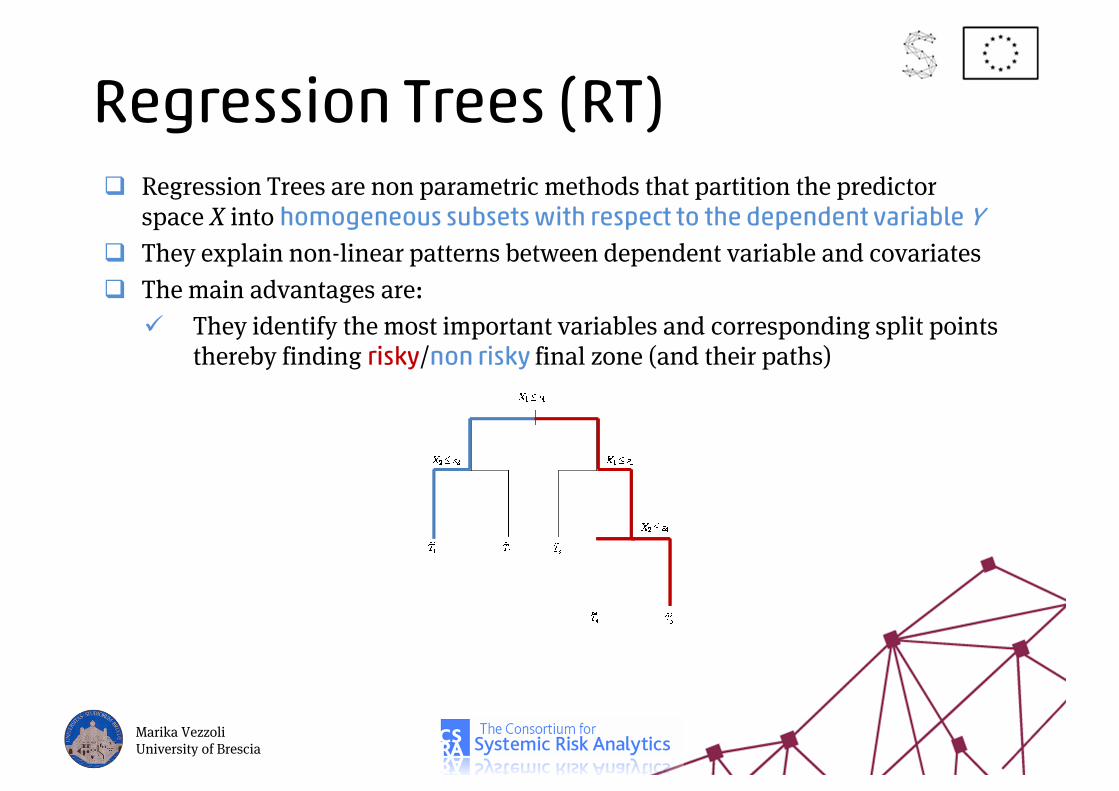
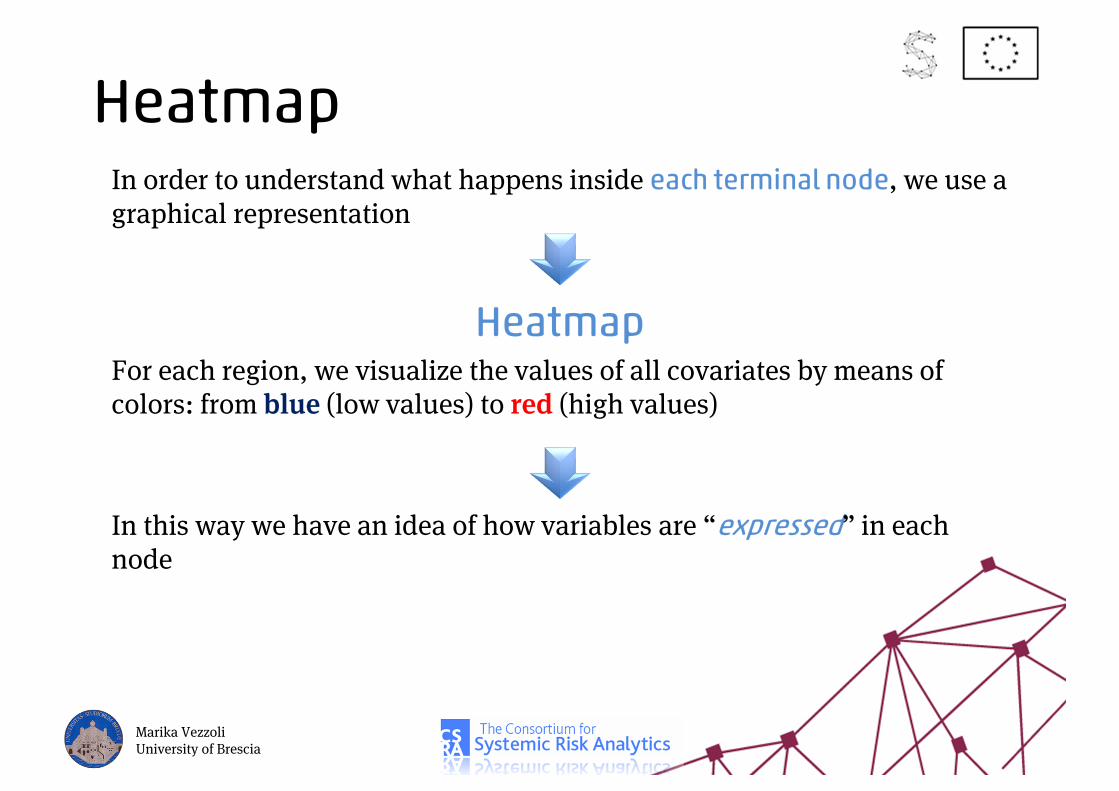
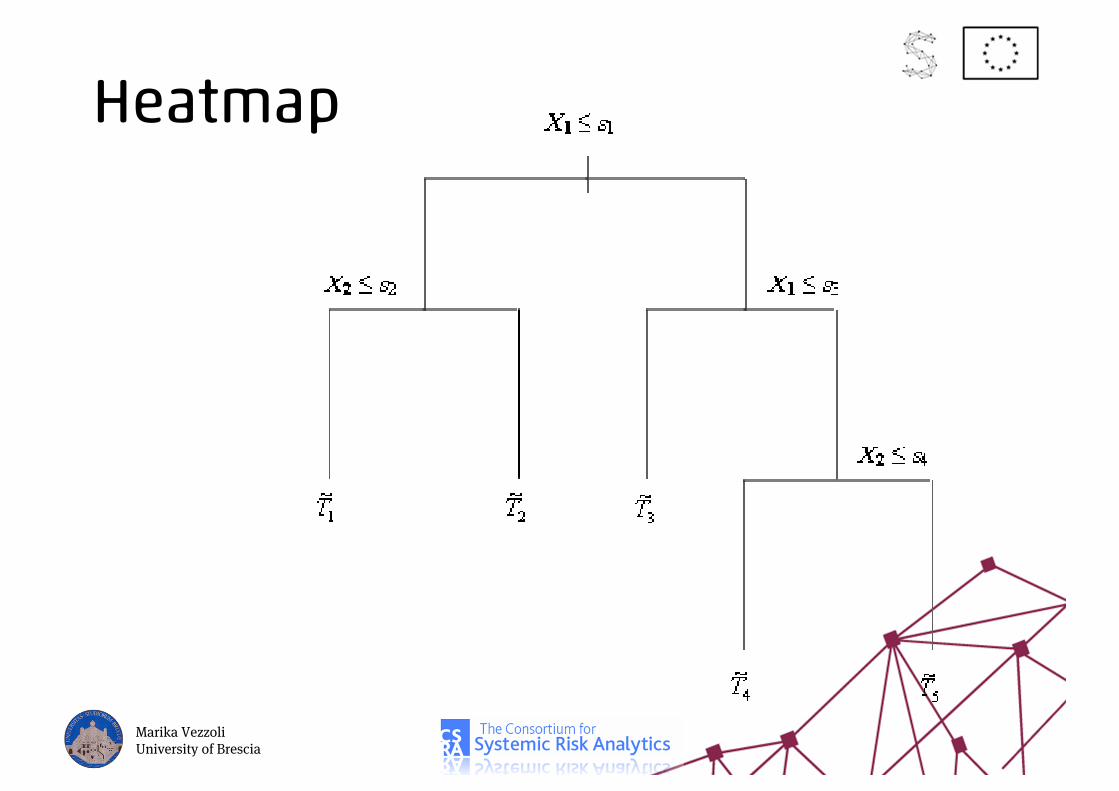
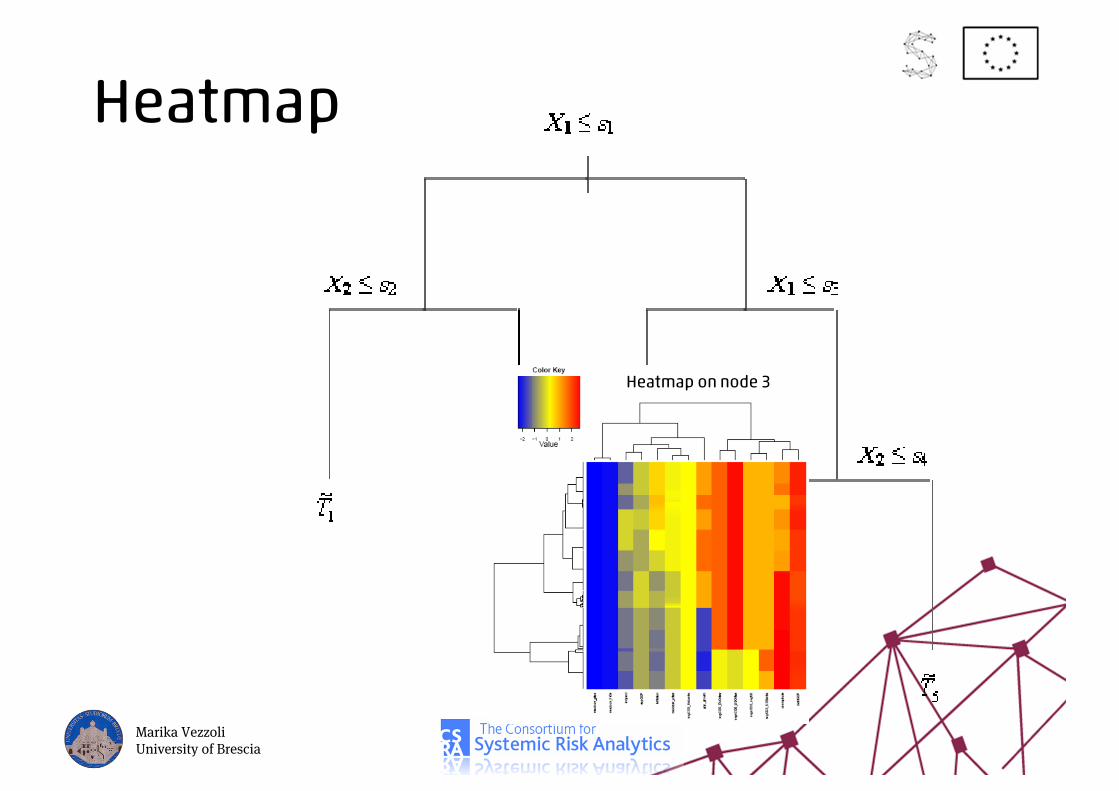
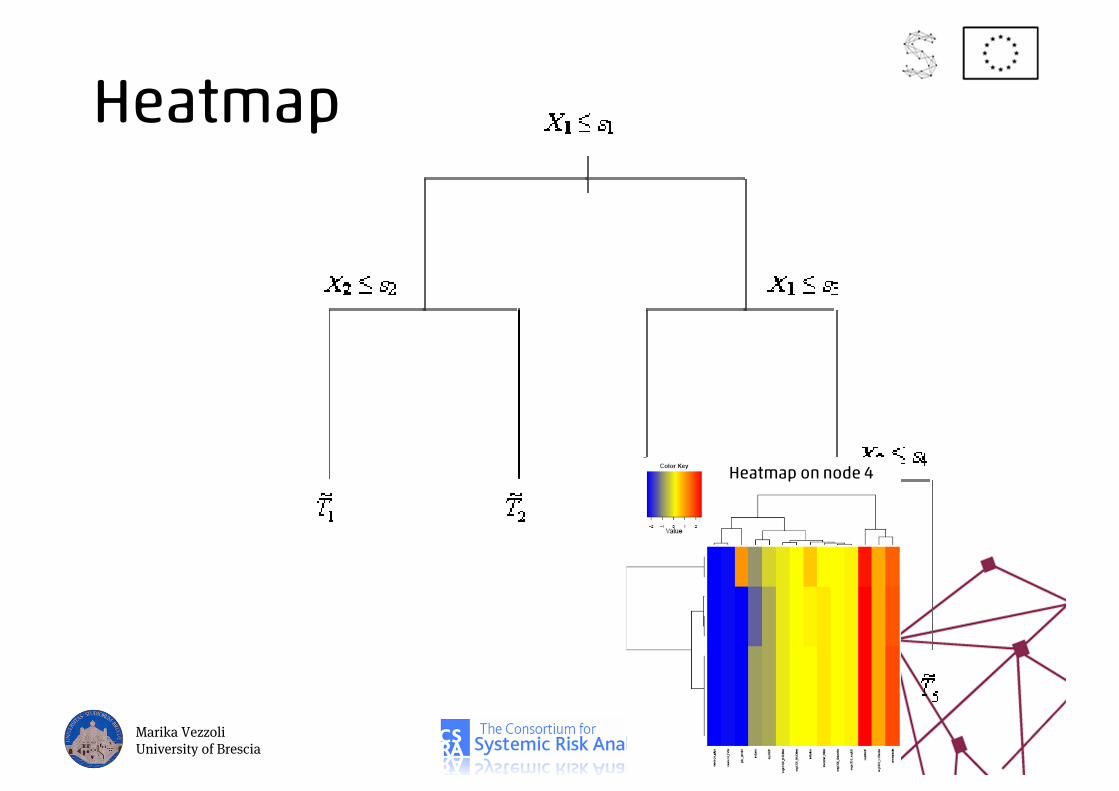
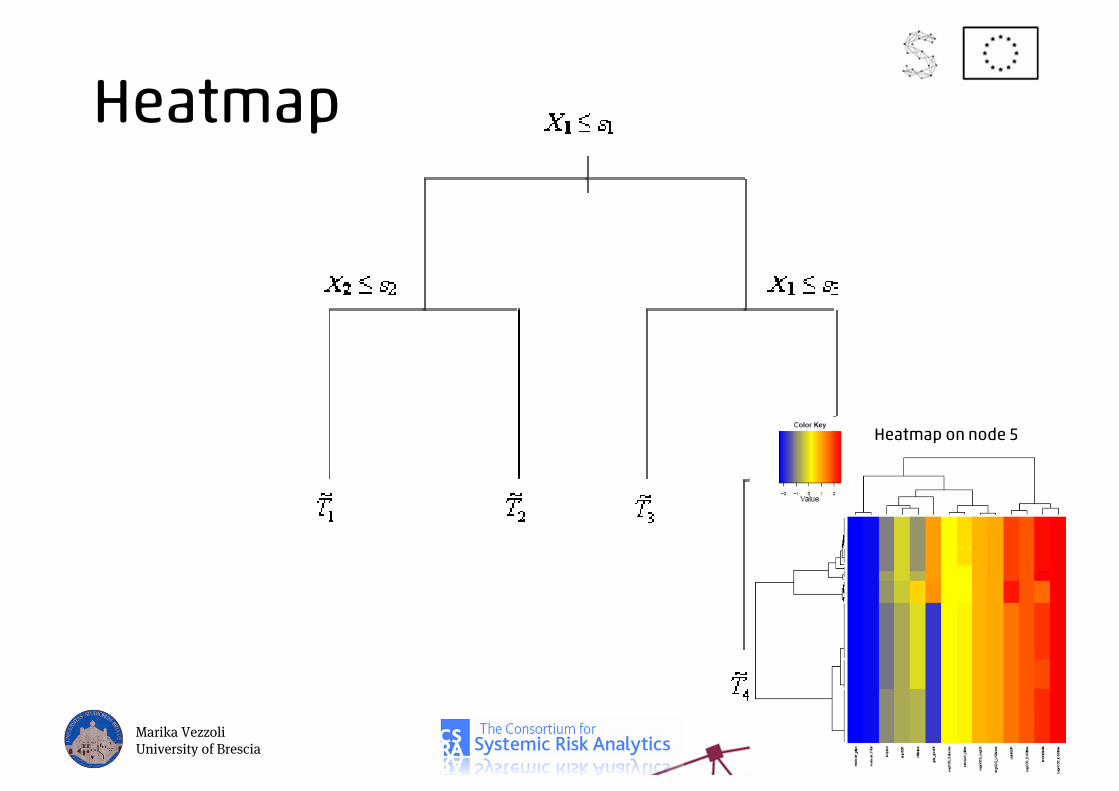
HeatmapIn order to understand what happens inside each terminal node, we use a graphical representation
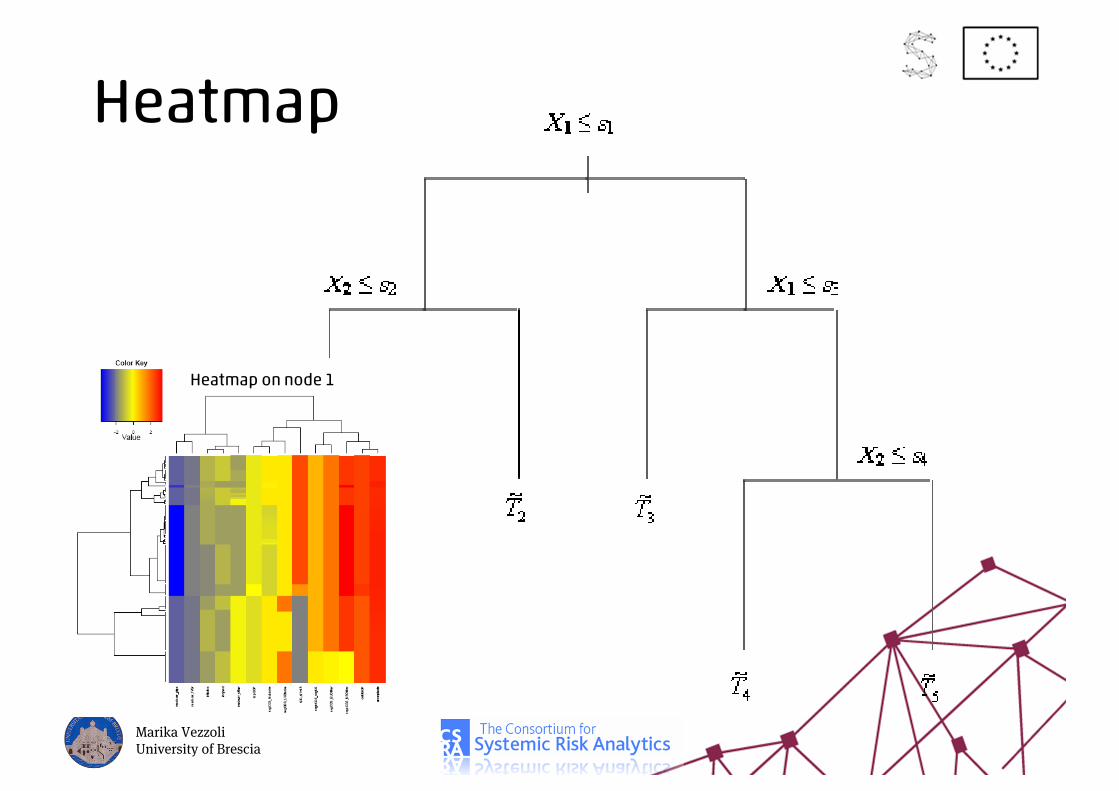
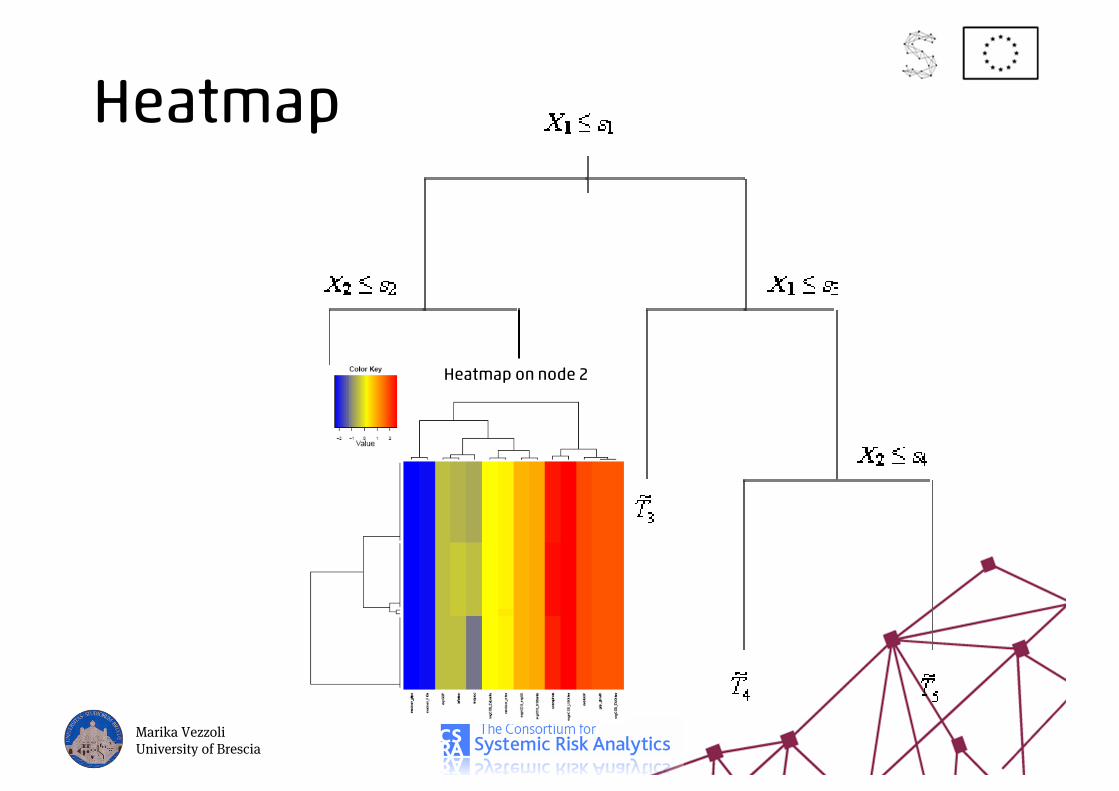
HeatmapFor each region, we visualize the values of all covariates by means of colors: from blue (low values) to red (high values)
In this way we have an idea of how variables are “expressed” in each node
Marika VezzoliUniversity of Brescia
Heatmap
Marika VezzoliUniversity of Brescia
Heatmap
Marika VezzoliUniversity of Brescia
Heatmap on node 1
Heatmap
Marika VezzoliUniversity of Brescia
Heatmap on node 2
Heatmap
Marika VezzoliUniversity of Brescia
Heatmap on node 3
Heatmap
Marika VezzoliUniversity of Brescia
Heatmap on node 4
Heatmap
Marika VezzoliUniversity of Brescia
Heatmap on node 5
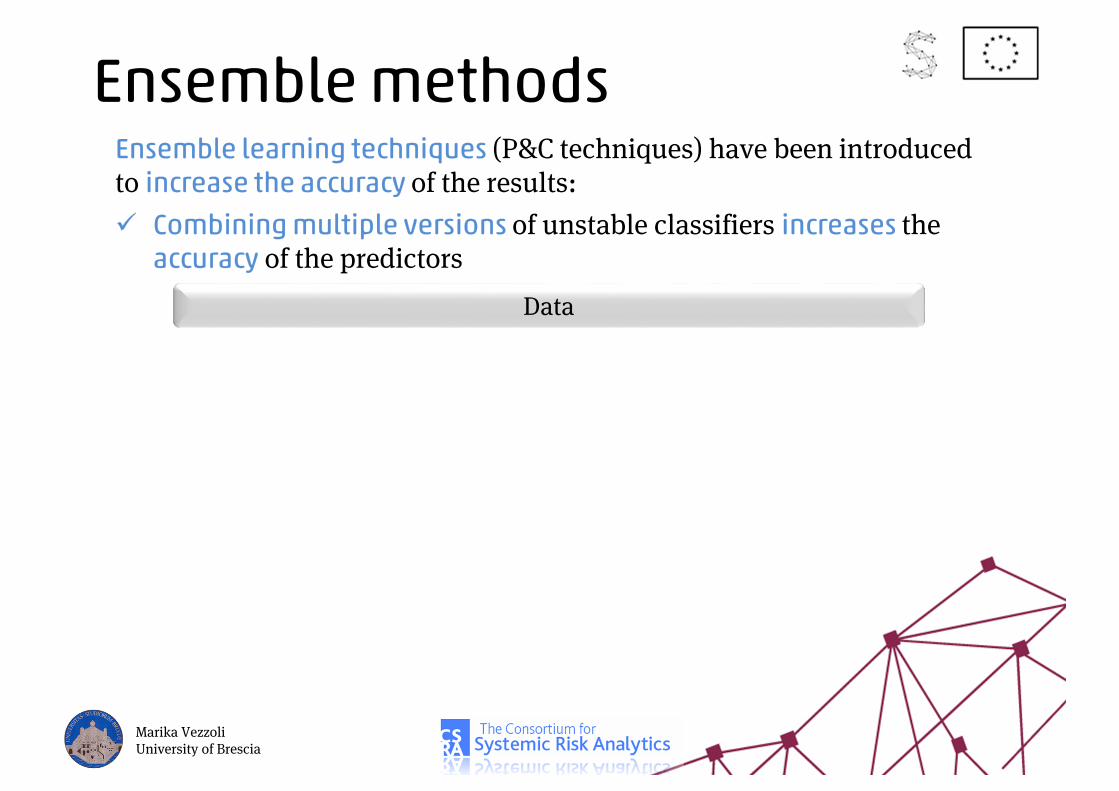
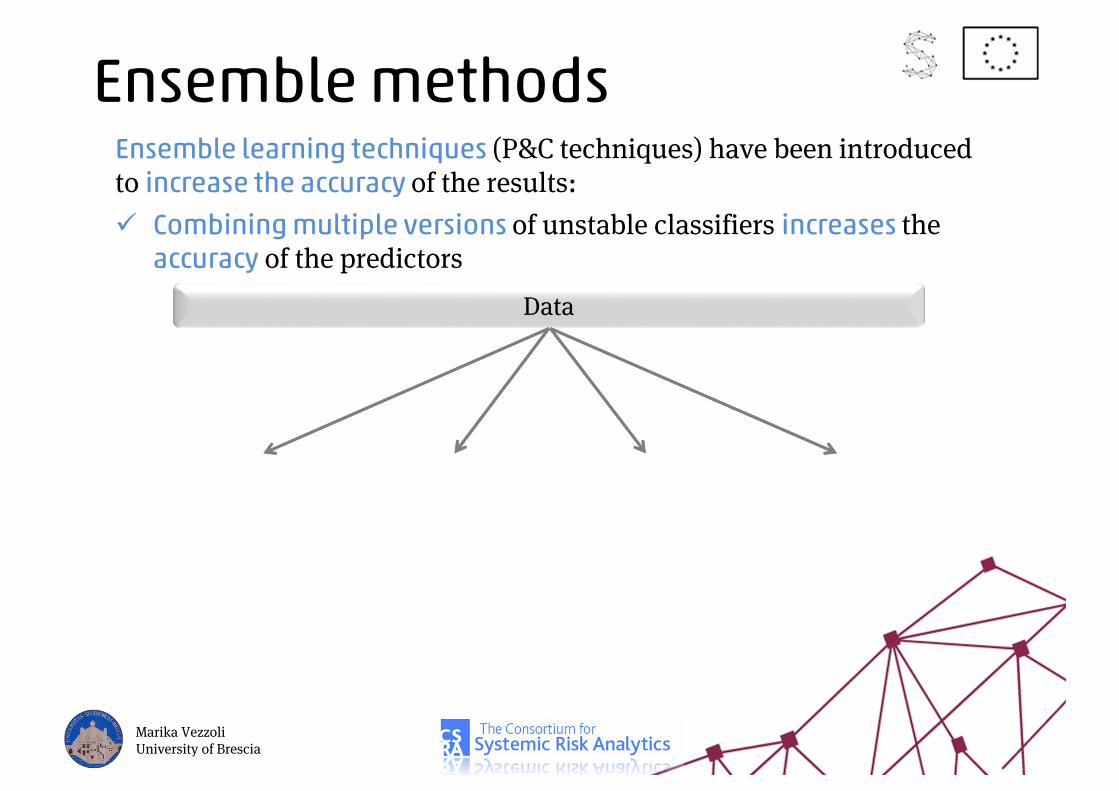
Ensemble methodsEnsemble learning techniques (P&C techniques) have been introduced to increase the accuracy of the results:
Combining multiple versions of unstable classifiers increases the accuracy of the predictors
Marika VezzoliUniversity of Brescia
Data
Ensemble methodsEnsemble learning techniques (P&C techniques) have been introduced to increase the accuracy of the results:
Combining multiple versions of unstable classifiers increases the accuracy of the predictors
Marika VezzoliUniversity of Brescia
Data
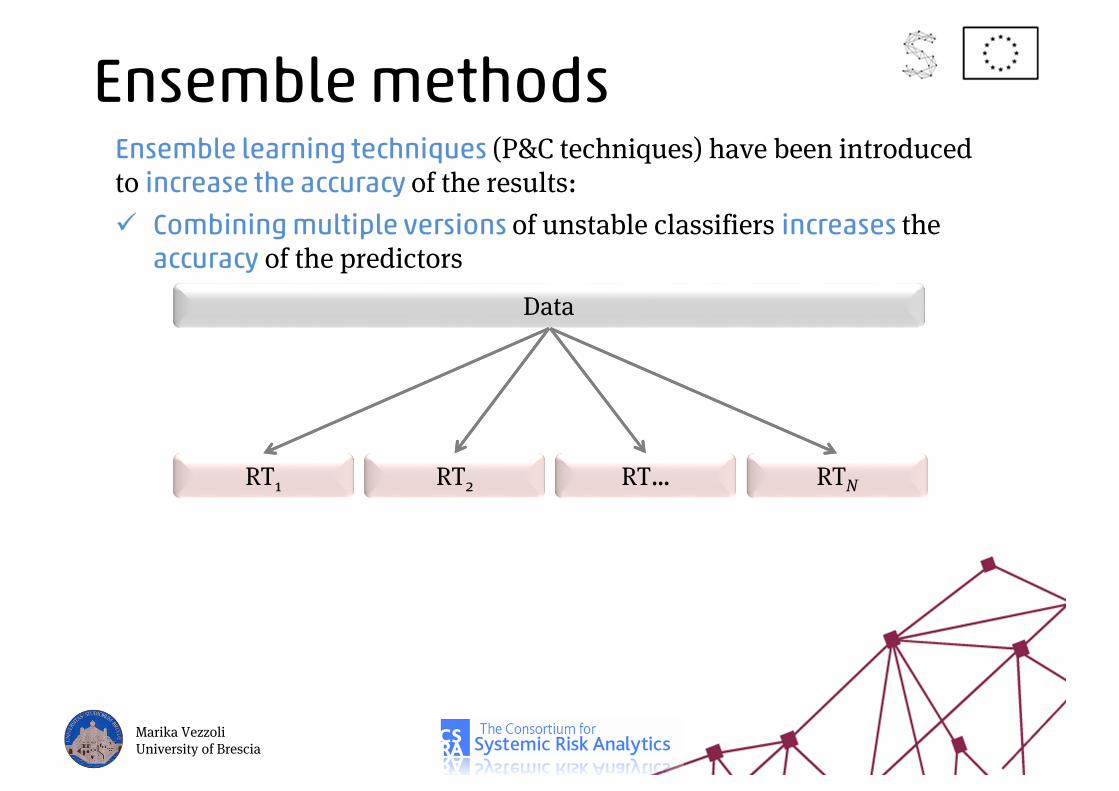
Ensemble methodsEnsemble learning techniques (P&C techniques) have been introduced to increase the accuracy of the results:
Combining multiple versions of unstable classifiers increases the accuracy of the predictors
Marika VezzoliUniversity of Brescia
Data
RT1 RT2 RT… RTN

Ensemble methodsEnsemble learning techniques (P&C techniques) have been introduced to increase the accuracy of the results:
Combining multiple versions of unstable classifiers increases the accuracy of the predictors
Marika VezzoliUniversity of Brescia
Data
RT1 RT2 RT… RTN
…
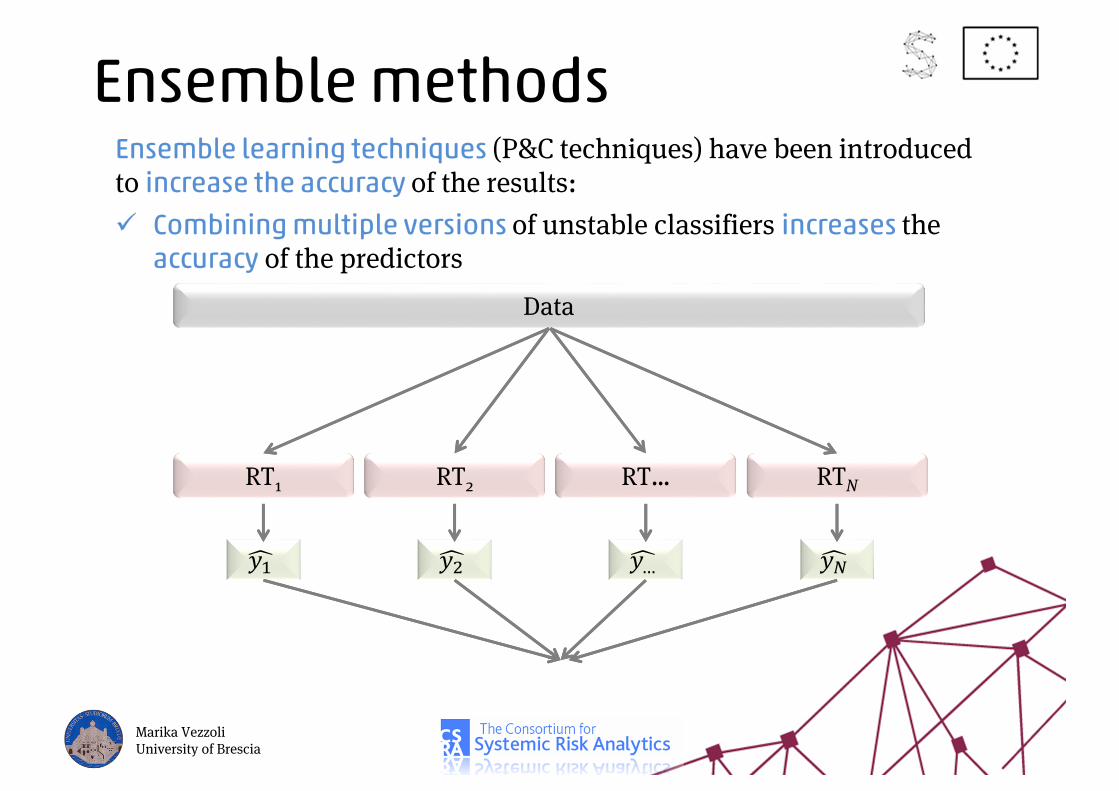
Ensemble methodsEnsemble learning techniques (P&C techniques) have been introduced to increase the accuracy of the results:
Combining multiple versions of unstable classifiers increases the accuracy of the predictors
Marika VezzoliUniversity of Brescia
Data
RT1 RT2 RT… RTN
…
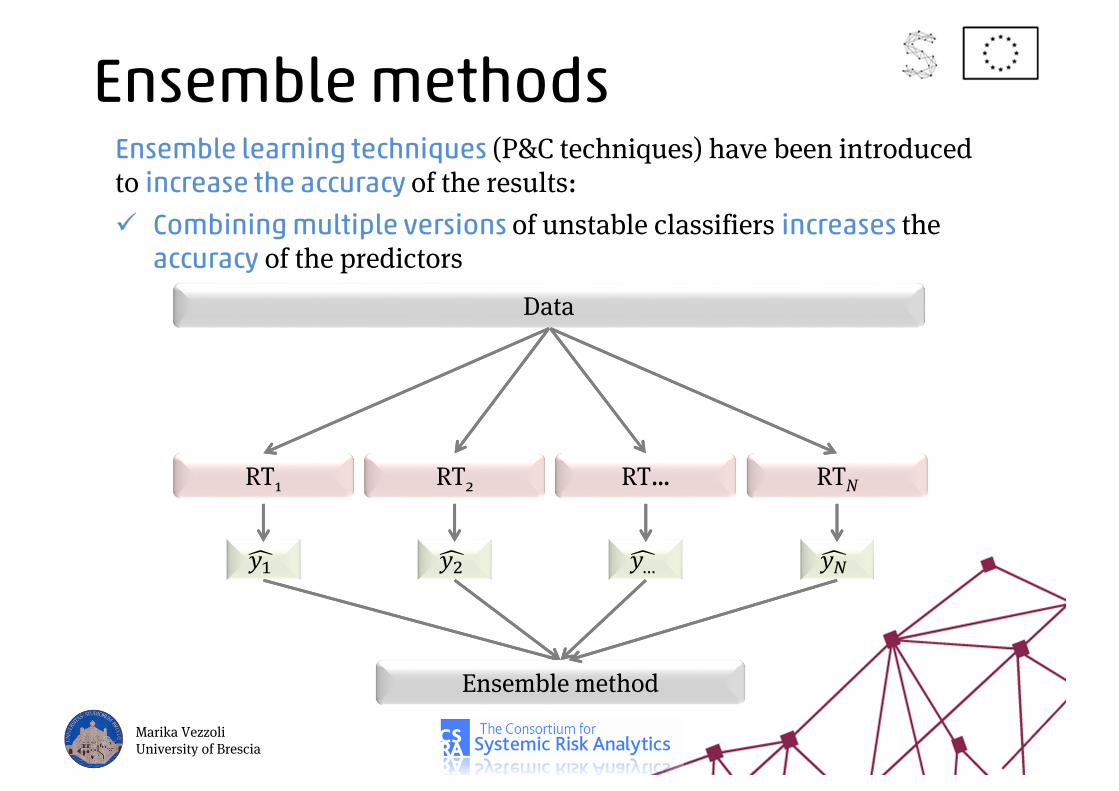
Ensemble methodsEnsemble learning techniques (P&C techniques) have been introduced to increase the accuracy of the results:
Combining multiple versions of unstable classifiers increases the accuracy of the predictors
Marika VezzoliUniversity of Brescia
Data
RT1 RT2 RT… RTN
…Ensemble method
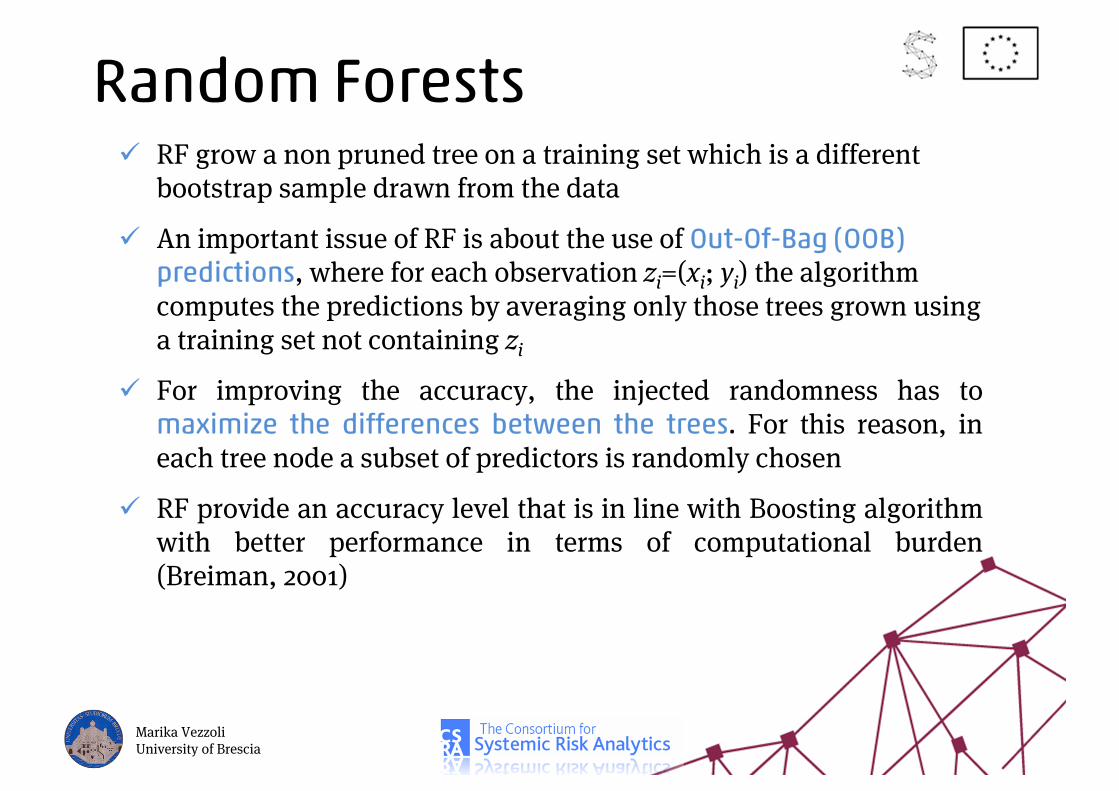
Random ForestsRF grow a non pruned tree on a training set which is a different bootstrap sample drawn from the data
An important issue of RF is about the use of Out-Of-Bag (OOB) predictions, where for each observation zi=(xi; yi) the algorithm computes the predictions by averaging only those trees grown using a training set not containing zi
For improving the accuracy, the injected randomness has tomaximize the differences between the trees. For this reason, ineach tree node a subset of predictors is randomly chosen
RF provide an accuracy level that is in line with Boosting algorithmwith better performance in terms of computational burden(Breiman, 2001)
Marika VezzoliUniversity of Brescia
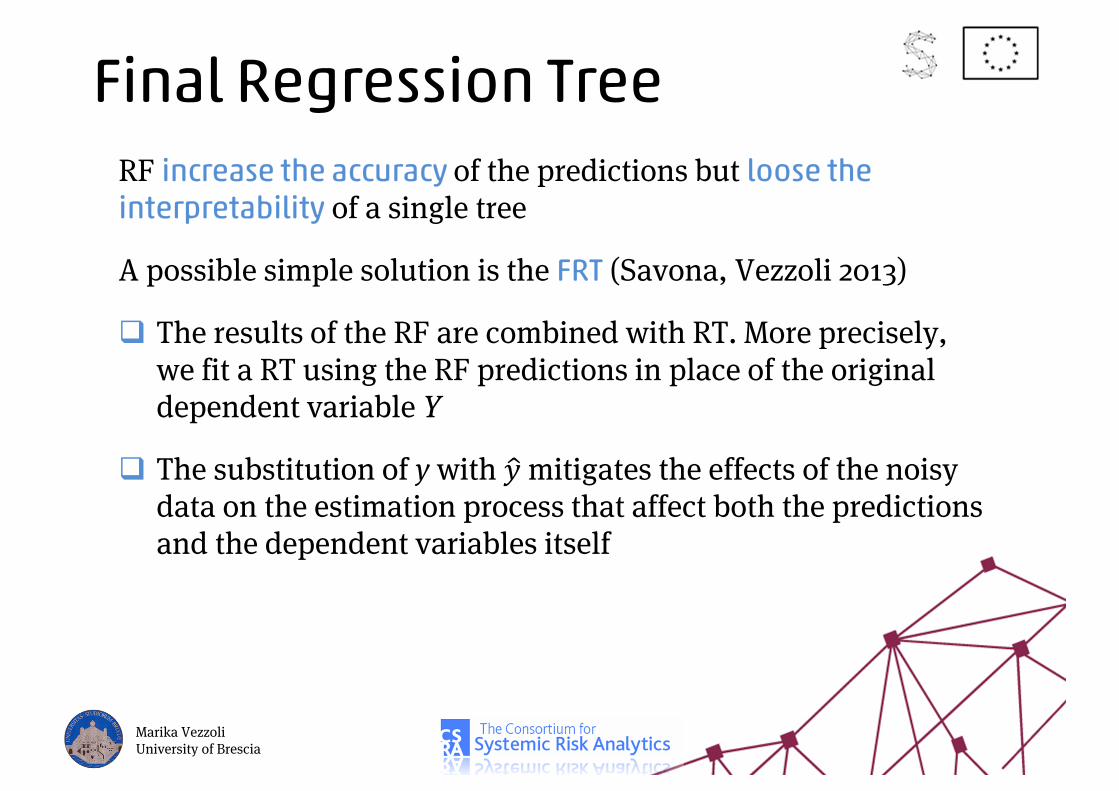
Final Regression TreeRF increase the accuracy of the predictions but loose the interpretability of a single tree
A possible simple solution is the FRT (Savona, Vezzoli 2013)
The results of the RF are combined with RT. More precisely, we fit a RT using the RF predictions in place of the original dependent variable Y
The substitution of y with mitigates the effects of the noisy data on the estimation process that affect both the predictions and the dependent variables itself
Marika VezzoliUniversity of Brescia
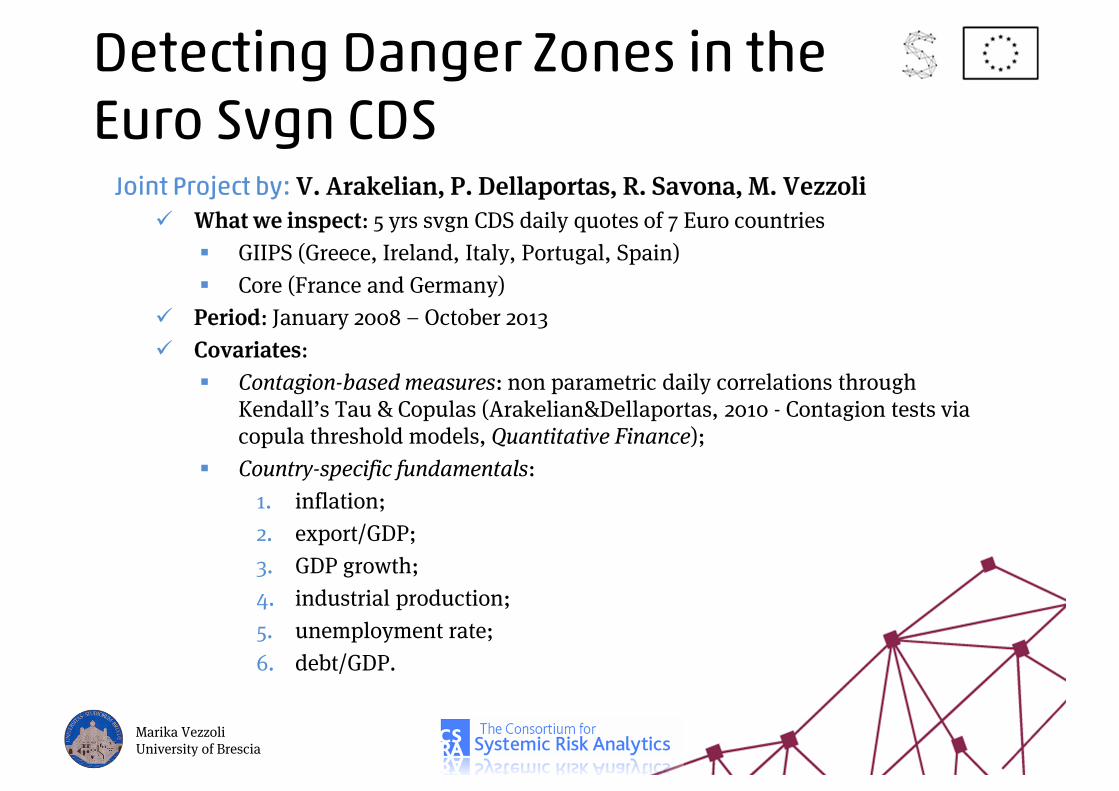
Detecting Danger Zones in the Euro Svgn CDS
Joint Project by: V. Arakelian, P. Dellaportas, R. Savona, M. VezzoliWhat we inspect: 5 yrs svgn CDS daily quotes of 7 Euro countries
GIIPS (Greece, Ireland, Italy, Portugal, Spain)Core (France and Germany)
Period: January 2008 – October 2013Covariates:
Contagion-based measures: non parametric daily correlations through Kendall’s Tau & Copulas (Arakelian&Dellaportas, 2010 - Contagion tests via copula threshold models, Quantitative Finance);Country-specific fundamentals:
1. inflation;2. export/GDP;3. GDP growth; 4. industrial production; 5. unemployment rate; 6. debt/GDP.
Marika VezzoliUniversity of Brescia
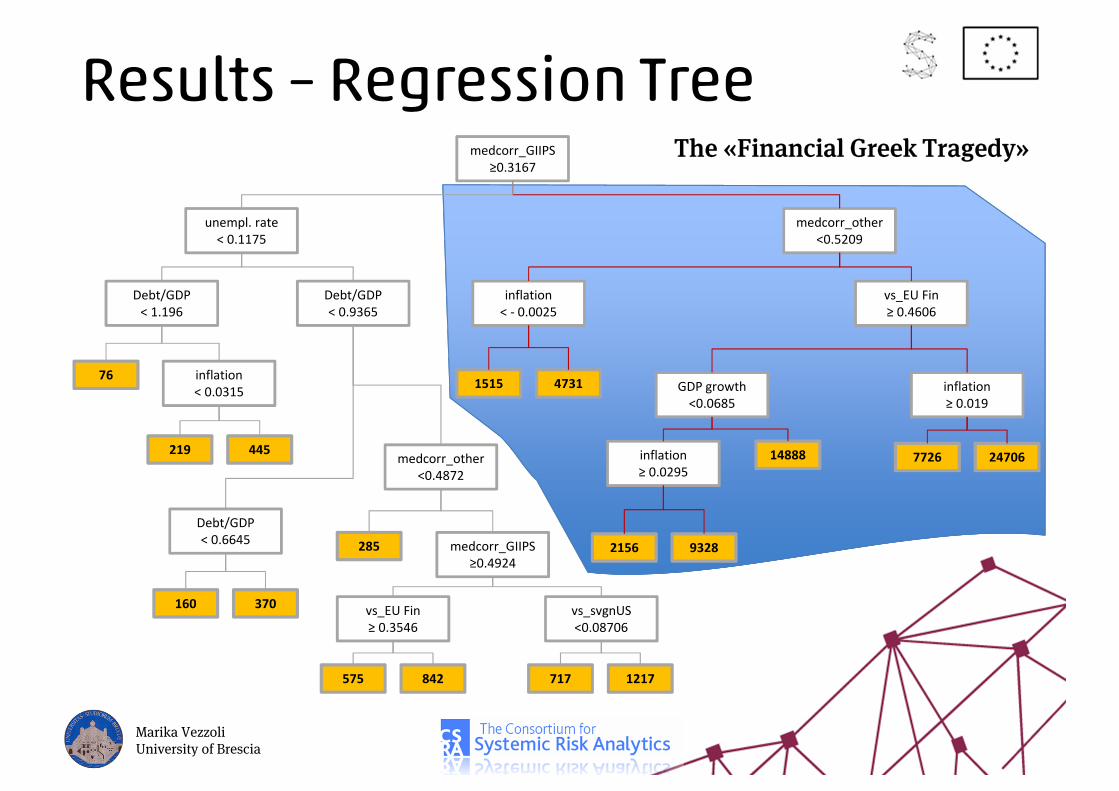
Results – Regression Treemedcorr_GIIPS
≥0.3167
medcorr_other<0.5209
vs_EU Fin≥ 0.4606
inflation≥ 0.019
GDP growth<0.0685
inflation≥ 0.0295
inflation< - 0.0025
1515 4731
2156 9328
7726 2470614888
unempl. rate< 0.1175
Debt/GDP< 1.196
inflation< 0.0315
Debt/GDP< 0.9365
Debt/GDP< 0.6645
medcorr_other<0.4872
medcorr_GIIPS≥0.4924
vs_svgnUS<0.08706
vs_EU Fin≥ 0.3546
717 1217575 842
285
160 370
219 445
76
The «Financial Greek Tragedy»
Marika VezzoliUniversity of Brescia
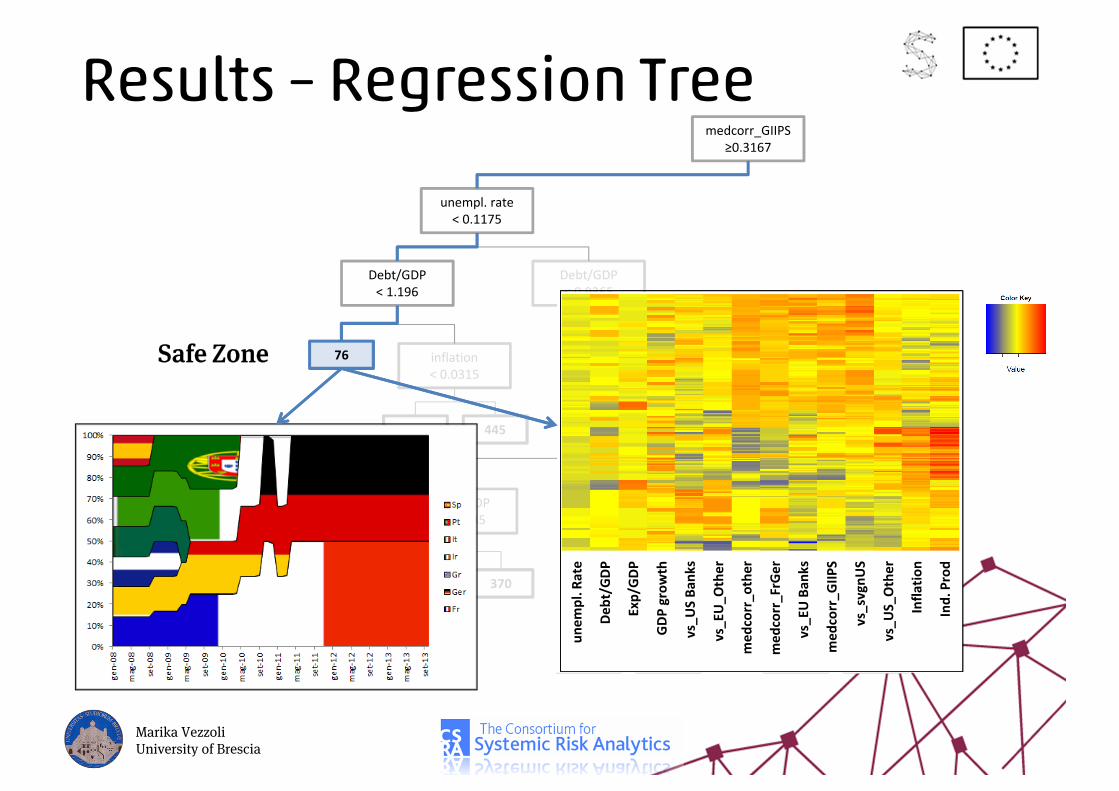
Results – Regression Treemedcorr_GIIPS
≥0.3167
unempl. rate< 0.1175
Debt/GDP< 1.196
inflation< 0.0315
Debt/GDP< 0.9365
Debt/GDP< 0.6645
medcorr_other<0.4872
medcorr_GIIPS≥0.4924
vs_svgnUS<0.08706
vs_EU Fin≥ 0.3546
717 1217575 842
285
160 370
219 445
76Safe Zone
unem
pl. R
ate
Debt
/GDP
Exp/
GDP
GDP
grow
th
vs_U
SBa
nks
vs_E
U_O
ther
med
corr
_oth
er
med
corr
_FrG
er
vs_E
UBa
nks
med
corr
_GIIP
S
vs_s
vgnU
S
vs_U
S_O
ther
Infla
tion
Ind.
Pro
d
Marika VezzoliUniversity of Brescia
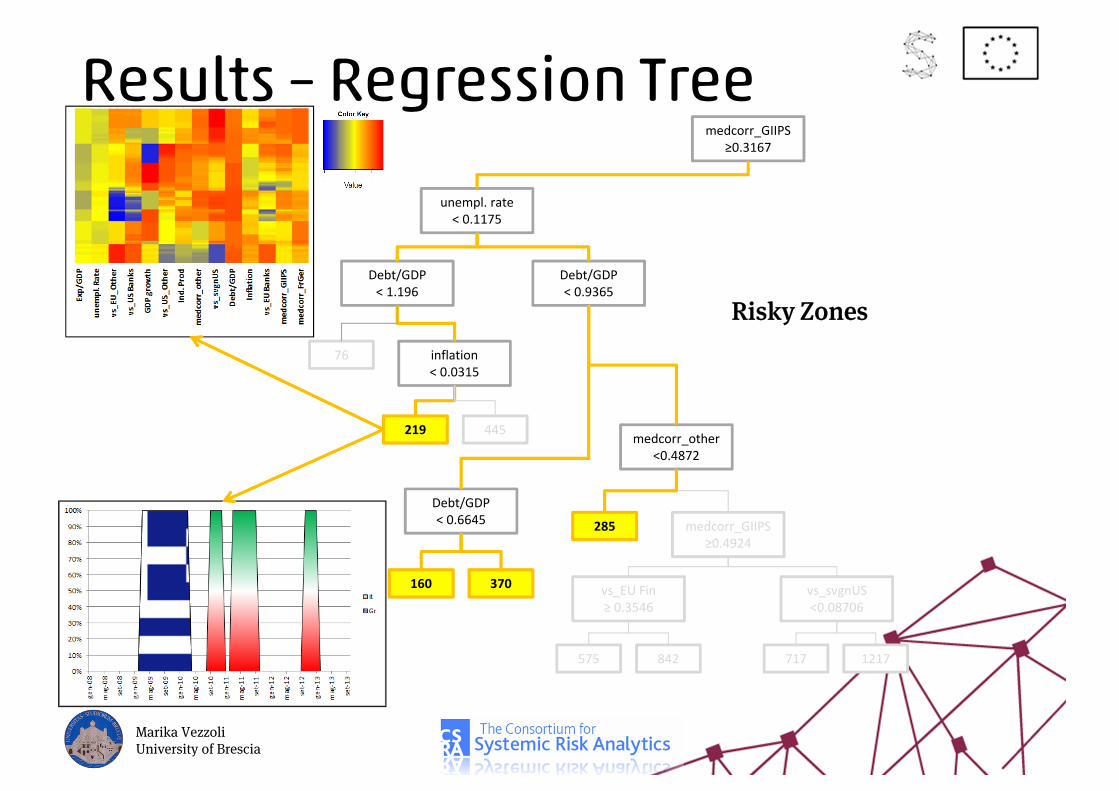
Results – Regression Treemedcorr_GIIPS
≥0.3167
unempl. rate< 0.1175
Debt/GDP< 1.196
inflation< 0.0315
Debt/GDP< 0.9365
Debt/GDP< 0.6645
medcorr_other<0.4872
medcorr_GIIPS≥0.4924
vs_svgnUS<0.08706
vs_EU Fin≥ 0.3546
717 1217575 842
285
160 370
219 445
76
Risky Zones
Marika VezzoliUniversity of Brescia
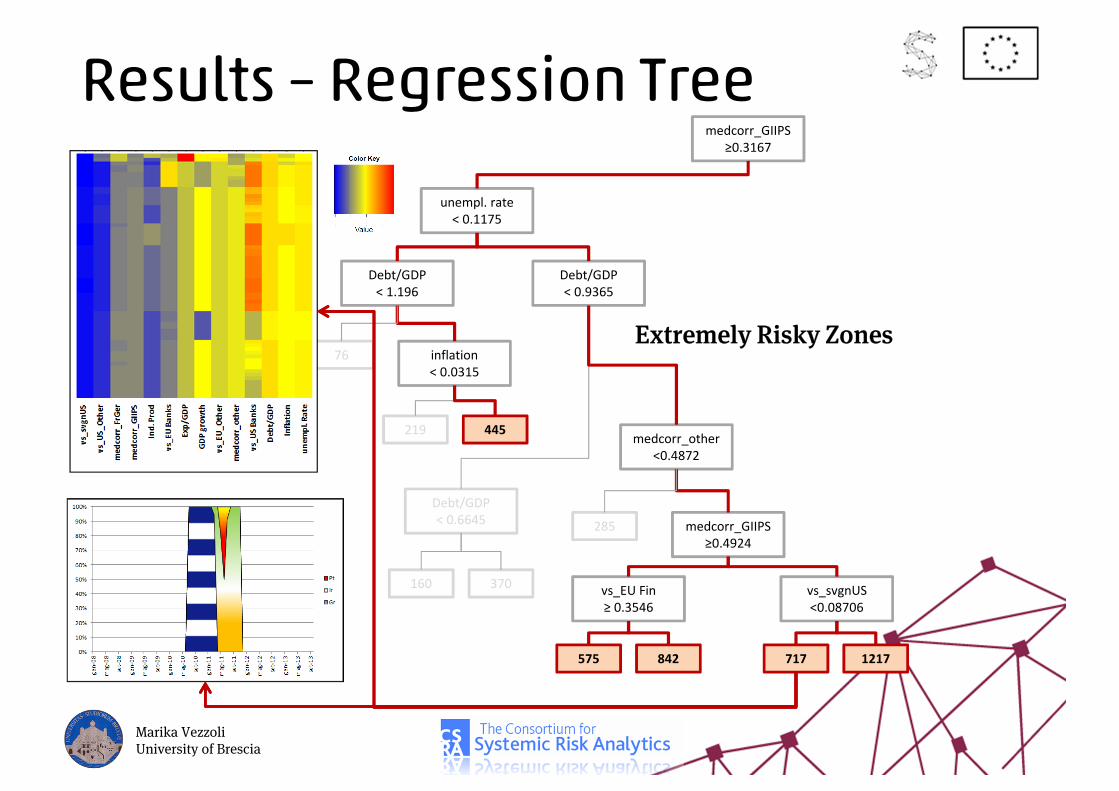
Results – Regression Treemedcorr_GIIPS
≥0.3167
unempl. rate< 0.1175
Debt/GDP< 1.196
inflation< 0.0315
Debt/GDP< 0.9365
Debt/GDP< 0.6645
medcorr_other<0.4872
medcorr_GIIPS≥0.4924
vs_svgnUS<0.08706
vs_EU Fin≥ 0.3546
717 1217575 842
285
160 370
219 445
76Extremely Risky Zones
Marika VezzoliUniversity of Brescia
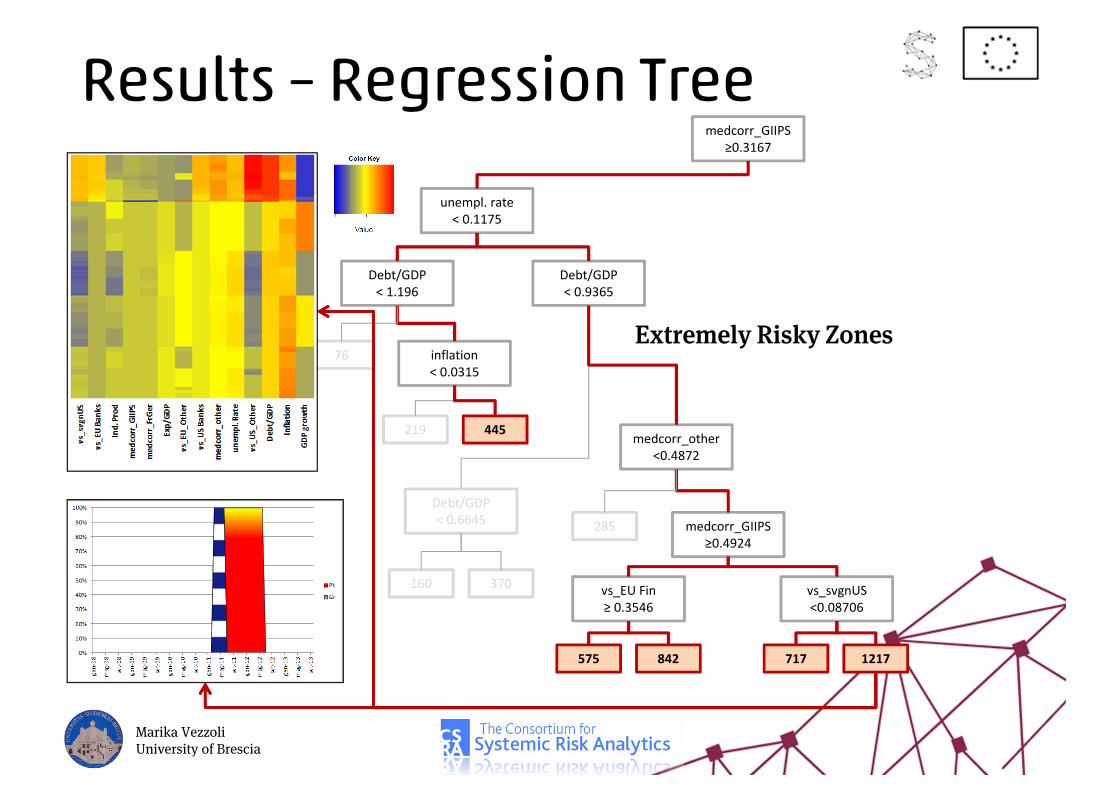
Results – Regression Treemedcorr_GIIPS
≥0.3167
unempl. rate< 0.1175
Debt/GDP< 1.196
inflation< 0.0315
Debt/GDP< 0.9365
Debt/GDP< 0.6645
medcorr_other<0.4872
medcorr_GIIPS≥0.4924
vs_svgnUS<0.08706
vs_EU Fin≥ 0.3546
717 1217575 842
285
160 370
219 445
76Extremely Risky Zones
Marika VezzoliUniversity of Brescia
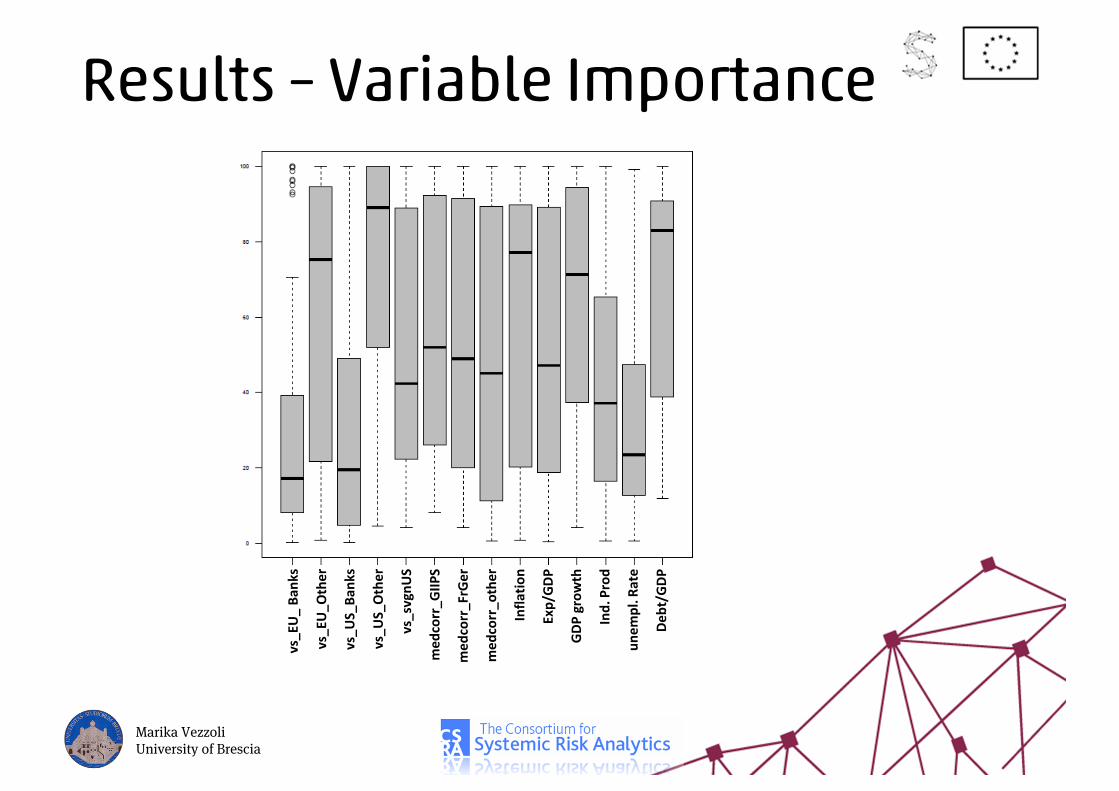
Results – Variable Importance
vs_E
U_
Bank
s
vs_E
U_O
ther
vs_U
S_Ba
nks
vs_U
S_O
ther
vs_s
vgnU
S
med
corr
_GIIP
S
med
corr
_FrG
er
med
corr
_oth
er
Infla
tion
Exp/
GDP
GDP
grow
th
Ind.
Pro
d
unem
pl. R
ate
Debt
/GDP
Marika VezzoliUniversity of Brescia

This project has received funding from the European Union’s
Seventh Framework Programme for research, technological
development and demonstration under grant agreement n° 320270
www.syrtoproject.eu
This document reflects only the author’s views.
The European Union is not liable for any use that may be made of the information contained therein.
Recommended