1
Determinants of nutritional status of under-five children receiving Integrated Child
Development Services (ICDS) in India
Authors
Manas Ranjan Pradhan, PhD1 and Mahesh Rajendra Shete2
1 Assistant Professor, Department of Fertility & Social Demography, International Institute for
Population Sciences (IIPS), Govandi Station Road, Deonar, Mumbai, 400088, Maharashtra,
India. Email: [email protected]
2 Data Analyst, Max Institute of Healthcare Management, Indian School of Business, Mohali,
India. Email: [email protected]
Abstract
Background: Undernutrition is a significant public health problem and the leading risk factor
for India's disease burden.
Aim: To understand the determinants of nutritional status of under-five children receiving
services under Integrated Child Development Services (ICDS) in India.
Methods: The study used data from the National Family Health Survey–4 (NFHS–4) conducted
during 2015–16. The present analysis was carried out for under-five children who have availed
of any ICDS services in the 12 months preceding the survey (n=1,27,813). Stunting, wasting,
and underweight were estimated following the WHO guideline and used as the primary
outcome variables. The binary logistic regression was carried out to examine the adjusted effect
of ICDS utilization and socioeconomic-demographic predictors of under-five children's
nutritional status. STATA (V 13) was used for statistical analyses.
Results: A sizable proportion of under-five children receiving any ICDS services suffer from
undernutrition. The undernutrition prevalence varied considerably by socioeconomic and
demographic characteristics, plus the frequency of ICDS utilization. Logistic regression found
insignificant role of ICDS on the nutritional status of under-five children. The child's age and
gender, maternal education and nutrition status, wealth index of the household, social group,
region, place of residence and region were significant determinants of undernutrition among
ICDS beneficiaries.
Conclusion: The study suggests the need to ensure all available services to children enrolled in
the ICDS/Anganwadi Centre (AWC). More importantly, the program should also emphasize
feeding practices and educating parents about improving child health and nutrition.
2
Introduction
Undernutrition is a significant public health problem and the leading risk factor for India's
disease burden. The prevalence of undernutrition among under-five children is high and vary
widely depending on the assessment methodology adopted (Sahu et al., 2015). India is the
home to the highest number of children under five years wasted and found to have made no
progress in meeting the 2025 global nutrition target for wasting (Global Nutrition Report,
2020). Again, 35% of the under-five children are stunted, higher than the Asia region average
(21.8%). Malnutrition was the principal risk factor for death in under-five children in every
state of India in 2017, accounting for 68% of the total under-five deaths (Swaminathan et al.,
2019). Earlier studies found various socioeconomic and demographic factors such as age and
gender of the child (Bharati et al., 2008), maternal education (Meshram et al., 2012; Mukherjee
et al., 2008; Sen et al., 2011) and Body Mass Index-BMI (Corsi et al., 2016), family size (Rehan
et al., 2020; Swami et al., 2000), household wealth status (Corsi et al., 2016; Kanjilal et al.,
2010; Meshram et al., 2012), housing condition (Som et al., 2007), religion & caste (Rehan et
al., 2020), place of residence and region (Bharati et al., 2008), and state-level dietary diversity
(Borkotoky et al., 2018) affecting the nutritional status of under-five children in the country.
In India, the policy and programme to facilitate the delivery of nutrition‐specific interventions
is broadly in place but varies by the intervention (Avula et al., 2016). The Integrated Child
Development Services (ICDS) scheme implemented by the Ministry of Women and Child
Development (MoWCD) and the National Health Mission (NHM) implemented by the
Ministry of Health and Family Welfare (MoHFW) are the primary nutrition programs that
operate across the country. They are designed to deliver nutrition‐specific interventions
through their frontline workers (Avula et al., 2016). The ICDS, launched in 1975, is one of the
world's largest programmes for early childhood care and development. The beneficiaries under
the ICDS scheme are children in the age group of 0-6 years, pregnant women, and lactating
mothers. One of the primary objectives of the scheme is to improve the nutritional and health
status of children in the age group 0-6 years, which also aims to reduce the incidence of
mortality, morbidity, malnutrition and school dropout; lay the foundation for proper
psychological, physical and social development of the child; to enhance the capability of the
mother to look after the health and nutritional needs of the child through proper nutrition and
health education, and to achieve effective coordination of policy and implementation amongst
the various departments to promote child development. Supplementary nutrition, pre-school
non-formal education, nutrition & health education, immunization, health check-up and
referral services are provided under the scheme (MoWCD, Government of India). These
services are delivered through Anganwadi Centers (AWCs). An AWC is part of the Indian
public healthcare system. The AWCs are managed by Anganwadi Workers (AWWs), a
community-based frontline worker.
Most of the earlier studies evaluating the impact of ICDS on the nutritional status of children
have found little impact, except a few, that revealed positive contribution on the nutritional
status of children from a specific age or socioeconomic groups. Thakur et al. (2011), analyzing
3
the data of 803 under-five children in Chandigarh, revealed an insignificant difference in the
prevalence of underweight among children registered under ICDS and those not registered.
Dutta and Ghosh (2015), using primary data of 390 households in West Bengal, found no
impact of enrollment and utilization of supplementary feeding from ICDS on child stunting
measures. Concerns with infrastructure and delivery of services like health check-ups,
immunization, referral slip availability, and referral of sick children by AWC were found in
the assessment study in Gujurat (Chudasama et al., 2015). Analyzing data of 60 women ICDS
beneficiaries in Jammu & Kashmir, another study found problems with the provision of
supplementary nutrition throughout the year, plus lack of coordination between health and
AWW staff affecting child immunization (Bashir et al., 2018). Past studies based on DHS data
of 2005-06 reveals a mixed effect of ICDS on child nutrition. Kandpal (2011) found significant
treatment effects of ICDS, particularly for the most malnourished children. This study further
revealed that ICDS effectively targets poor areas but failed to target areas with low levels of
average education and those with unbalanced sex ratios. Another study found a positive effect
of daily supplementary feeding on the nutritional status of children aged 0-2 years in rural India
(Jain, 2015). However, using propensity score matching in the same dataset, Dixit et al. (2018)
revealed that women who received nutrition and health education from the ICDS had a higher
chance of institutional delivery. However, this service has no positive impact on children's
nutritional status.
An insightful assessment of the role of ICDS utilization in influencing child undernutrition
among different subgroups using a large representative recent sample will have better policy
implications to improve the ICDS service utilization and reduce child morbidity and mortality.
Based on a nationally representative sample, this study aims to understand the determinants of
nutritional status of under-five children receiving ICDS services in India. Specifically, the
paper attempts to study the association of specific ICDS services with child nutrition.
Moreover, the frequency/extent of utilization of the ICDS services is expected to influence
children's nutritional status and hence studied. The study results deemed to provide the
evidence required to formulate/strengthen strategies and programs for appropriate nutrition-
focused interventions. This paper's essence may also be considered for assessing the
effectiveness of ICDS services in reducing undernutrition in the country.
Methods
Data
The study used data from the National Family Health Survey–4 (NFHS–4) conducted during
2015–16. The NFHS-4 provides information for a wide range of monitoring and impact
evaluation indicators of population, health, and nutrition. A total of 699,686 women aged 15-
49, 112,122 men aged 15-54, and 243,867 children under-five years were surveyed from
601,509 households covering all districts in the country. The Primary Sampling Unit (PSUs),
i.e., the survey villages in rural areas and Census Enumeration Blocks (CEBs) in urban areas,
were selected using probability proportional to size (PPS) sampling. The households were
randomly selected with systematic sampling in each of the selected PSU for the survey. Trained
4
research investigators using computer-assisted personal interviewing (CAPI) gathered the data.
Informed consent procedures were followed, and only those respondents who voluntarily
consented (written or oral) to participate in the survey were interviewed. A detailed survey
design, questionnaire, quality control measures, and survey management information can be
obtained from the published national report (International Institute for Population Sciences and
ICF, 2017). The present analysis was carried out for under-five children who have availed of
any ICDS services in the 12 months preceding the survey (n=1,27,813). Specifically, the survey
gathered information on the frequency of receiving food, any health check-ups, immunization,
and weight measurement for children under-five, which was considered for analysis. In
addition, the survey asked the following questions to capture the utilization of ICDS services:
During the last 12 months, has (NAME) received any benefits from the anganwadi or ICDS
centre?
Those responding yes to the above question were asked the following questions:
In the last 12 months, how often has (NAME) received food from the anganwadi/ICDS centre?
(Pre-coded as: not at all (0), almost daily (1), at least once a week (2), at least once a month
(3), less often (4), don’t know (8)
In the last 12 months, how often has (NAME) had a health check-up from the anganwadi/ICDS
centre? (Pre-coded as: not at all (0), at least once a month (1), less often (2), don’t know (8)
In the last 12 months, has (NAME) received any immunizations through the anganwadi/ICDS
centre? (Pre-coded as: yes (1), no (2), don’t know (8)
In the last 12 months, how often has (NAME’s) weight been measured by the anganwadi/ICDS
centre? (Pre-coded as: not at all (0), at least once a month (1), at least once in 3 months (2),
less often (3), don’t know (8)
Outcome variables
In NFHS-4, information about the age, height and weight of the children born in the last five
years was collected from their mothers or any eligible individual in the household. This
information was used to estimate stunting, wasting, and underweight among the under-five
children following WHO guideline (WHO, 2019) and used as the present study's primary
outcome variables. Stunting: Children whose height-for-age Z-score was below minus two
standard deviations (-2 SDs) from the reference population's median were considered short for
their age (stunted), or chronically undernourished. Wasting: Children whose weight-for-height
Z-score was below minus two standard deviations (-2 SDs) from the median of the reference
population were considered thin (wasted), or acutely undernourished. Underweight: Children
whose weight-for-age Z-score was below minus two standard deviations (-2 SDs) from the
reference population's median were classified as underweight. All three dependent variables
were converted into dichotomous binary variable with categories defined as 1= yes (Z-score<
-2 SDs), 0= no (Z-score>= -2 SDs).
5
Predictor variables
The primary predictor variables used in the analysis were the utilization of ICDS services.
Specifically, frequency of receiving food (almost daily, at least once a week, at least once a
month, less often, not at all), health check-ups (at least once a month, less often, not at all),
immunization (yes, no), and weight measurement (at least once a month, at least once in 3
months, less often, not at all) from the ICDS were included. The food supplements are expected
to be provided daily, although the modalities might differ. AWW provide it as regular lunch
for those aged 3-6 years attending the AWC or as a take-home-ration for those aged 0-3 years.
The children aged 0-6 are provided various health check-ups in AWC, including regular health
check-ups, management of malnutrition, treatment of diarrhoea, and de-worming. These
services are provided with support from Auxiliary Nurse Midwife (ANM) and once every
month. Although children are free to take vaccination from any health facility, the aim was to
capture whether they receive an immunization from AWC, which provides immunization
services through support from the ANM. The children aged 0-3 years are expected to be
weighed once a month and those aged 3-6 years once in three months. However, there is a
possibility of those mal-nutritious children getting weighed every month irrespective of age.
To assess the adjusted effect of ICDS utilization on nutritional status of under-five children,
selected additional potential predictors such as child’s age in months (<6, 6-11, 12-23,24-35,
36-47, 48-59), gender (male, female), mother's years of schooling (illiterates, less than ten
years, ten years and above), mother’s BMI (Normal underweight, overweight), social groups
(scheduled caste-SC, scheduled tribe-ST, other backward classes-OBC, Non-SC/ST/OBC),
religion (Hindu, Muslim, others) wealth quintile (poorest, poorer, middle, richer, richest), place
of residence (urban, rural), and geographical regions (north, central, east, northeast, west,
south) were also considered for the analysis. The wealth quintile is a measure of a household's
living standard and was calculated using data on the household's ownership of selected assets,
materials used for housing construction, and types of water access and sanitation facilities. The
southern region consists of Andaman Nicobar Islands, Andhra Pradesh, Karnataka, Kerala,
Lakshadweep, Puducherry, Tamil Nadu and Telangana; western consists of Dadra Nagar and
Haveli, Daman and Diu, Goa, Gujarat and Maharashtra; northern consists of Chandigarh,
Haryana, Himachal Pradesh, Jammu and Kashmir, New Delhi, Punjab, Rajasthan and
Uttarakhand; central consists of Chhattisgarh, Madhya Pradesh and Uttar Pradesh; eastern
consists of Bihar, Jharkhand, Odisha and West Bengal; and north-eastern consists of Arunachal
Pradesh, Assam, Manipur, Meghalaya, Mizoram, Nagaland, Sikkim and Tripura. These
included socioeconomic and demographic variables are well-established factors of child
nutrition in India. “Do not know” responses in all the predictor variables wherever applicable
were excluded from the analysis.
Statistical analysis
Descriptive analysis was conducted to assess the percentage distribution of the socioeconomic
and demographic characteristics of under-five children. The independent association of the
predictor variables with the outcome variables was examined using the Chi-square method.
6
Further, since the outcome variables were dichotomous, binary logistic regression was
employed to examine the adjusted effect of socioeconomic and demographic predictors on
under-five children's nutritional status. The variables included for regression analysis was
finalized based on their significant individual association with the outcome variables and
checking multicollinearity among the predictor variables. Multicollinearity was examined
through Variance Inflation Factor (VIF) method. It was found that all the predictor variables
used in the model had a VIF value below two, ruling out collinearity (Gareth et al., 2013). The
goodness of fit of the regression models was assessed using Pearson χ2 goodness-of-fit test.
National sample weight available in the data set was used in the analysis. STATA (V 13) was
used for statistical analyses.
Results
Sample characteristics
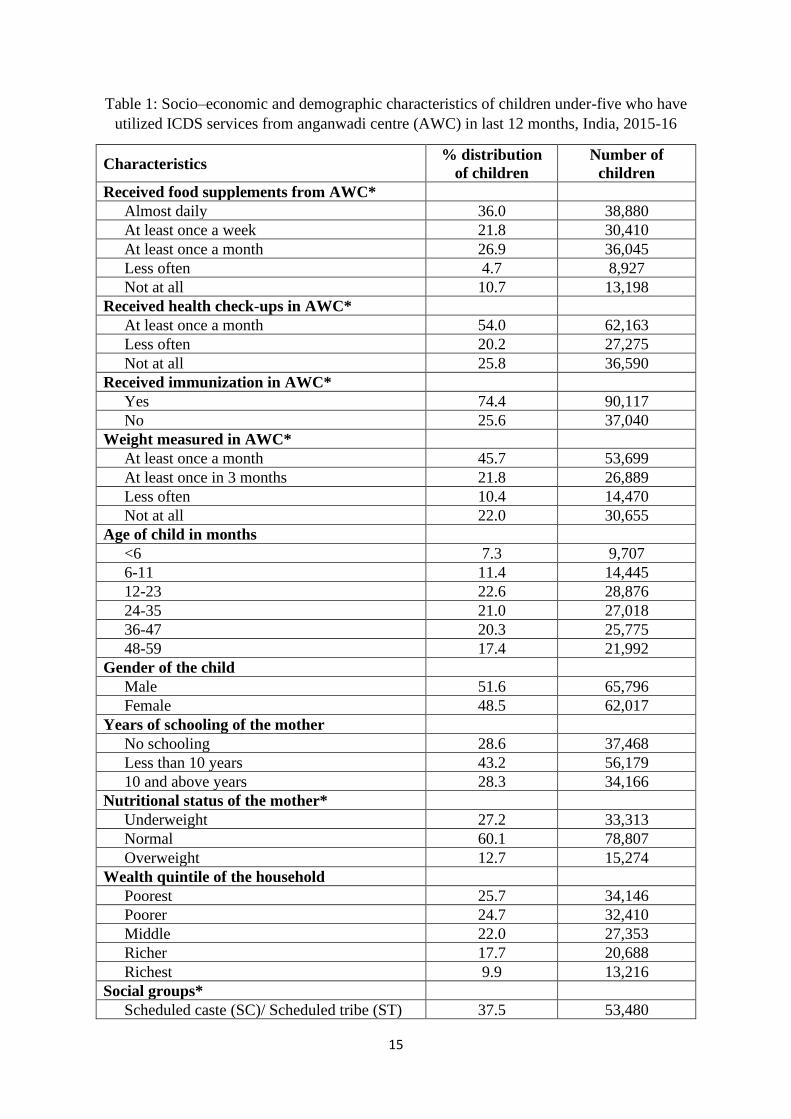
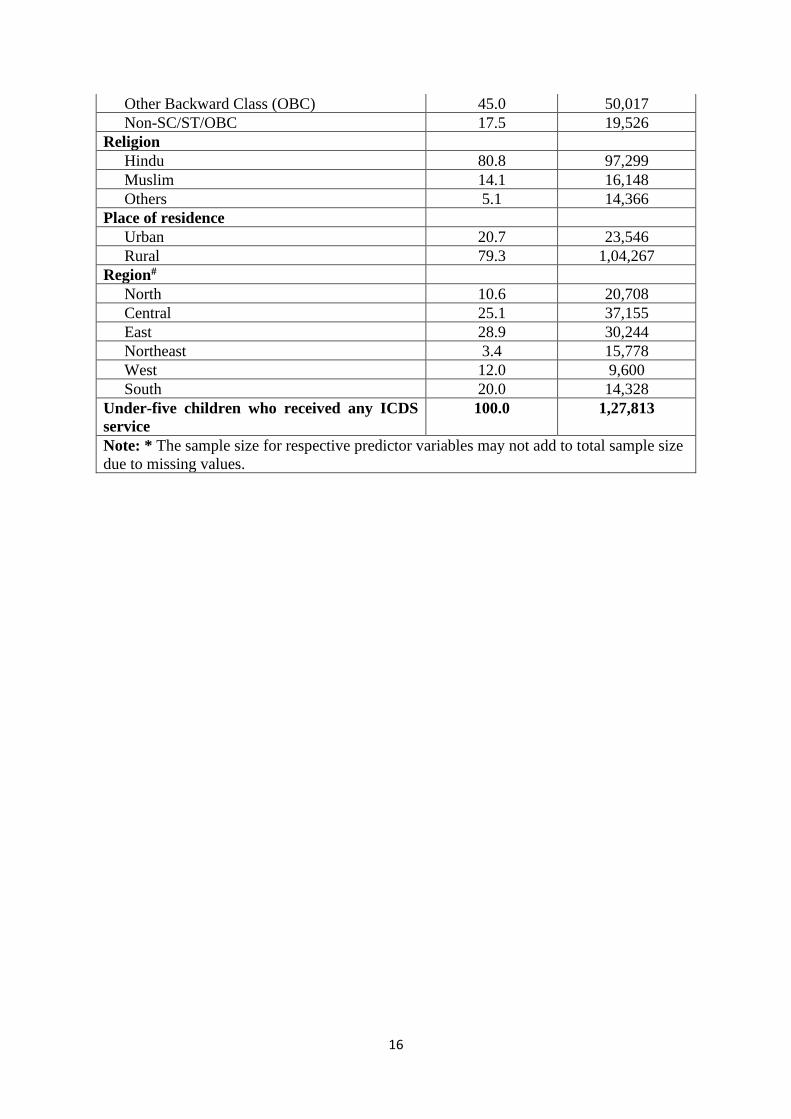
Table 1 presents the socioeconomic and demographic characteristics of under-five children
who had utilized ICDS services in the last 12 months preceding the survey. Of the children,
36% received food supplements from the ICDS centre almost daily, 22% received it at least
once a week, 27% received it at least once a month, 5% received it less often, and 11% did not
receive it at all. More than a half (54%) of these children received health check-ups at least
once a month, and about a quarter (26%) of them never had any health check-ups in AWC.
Nearly three-fourths (74%) of these children had received immunization in AWC. Of the
children, 46% were weighed at least once in a month, 22% once in three months, 10% less
often, and 22% never, in the AWC. Of the sample children, 7% were less than six months old,
11% were 6-11 months old, 23% were 12-23 months old, 21% were 24-35 months old, 20%
were 36-47 months old, and the rest aged 48-59 months. Boys comprised 52% of the total
children. Nearly three out of every ten mothers were non-literates. Twenty-seven per cent of
the mothers were underweight, 60% were of normal weight, and the remaining were
overweight. Economically, 26% of these children belong to poorest, 25% to poorer, 22% to
middle income, 18% to richer, and 10% to richest households. Of the total children, 45% were
from OBC, 37% from SC/ST, and 18% from the non-SC/ST/OBC category. Eighty-one per
cent of the children were Hindus, 14% were Muslims and the rest from other religions. A
majority (79%) of the children reside in rural areas. Twenty-nine per cent of the children belong
to the eastern region, 25% to the central region, 20% to the southern region, 12% to the western
region, 11% to the northern region, and 3% to the northeast region.
Socioeconomic and demographic differential in nutritional status
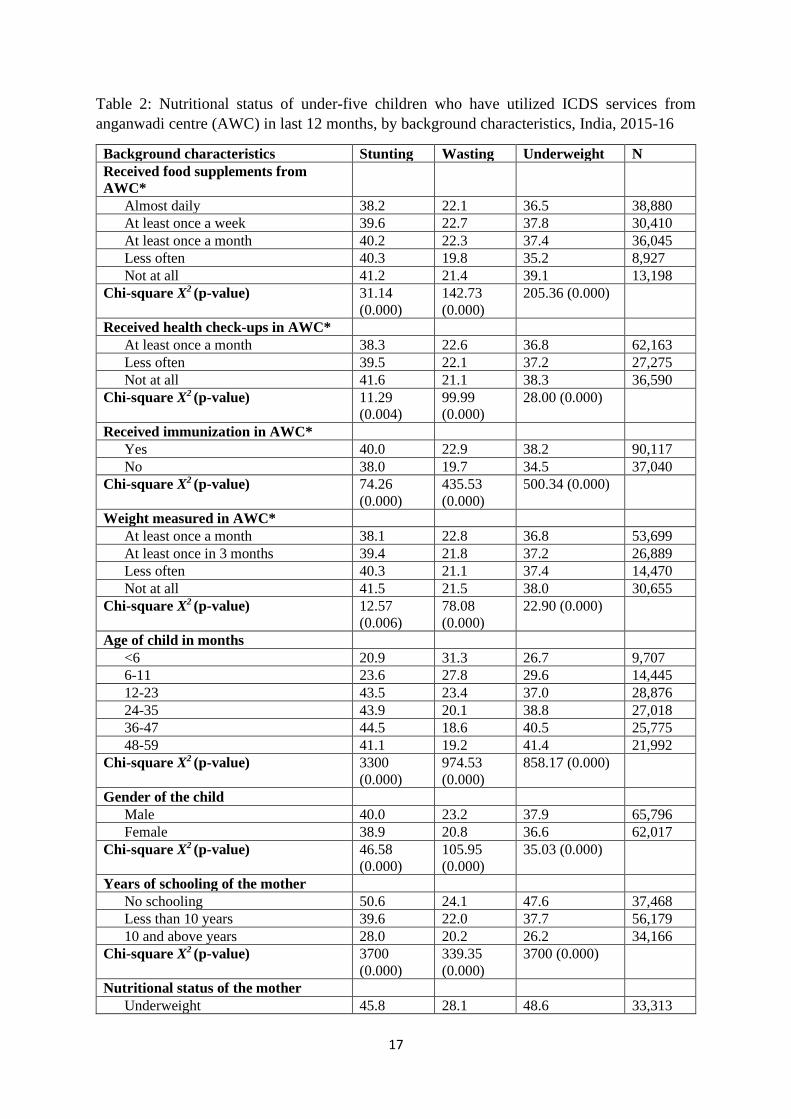
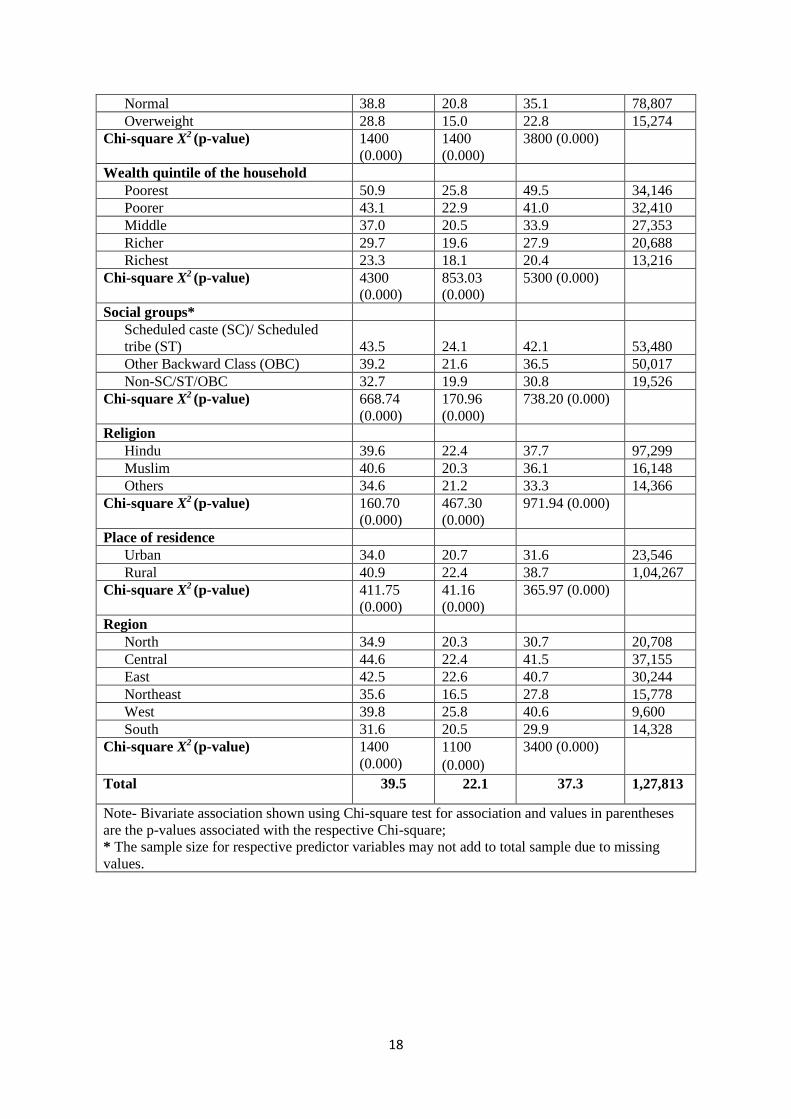
Table 2 presents the nutritional status of under-five children who had utilized ICDS services in
the last 12 months by background characteristics. Of these children, 40% were found stunted,
22% were wasted, and 37% were underweight. Thirty-eight per cent of the children receiving
food supplements almost daily were stunted compared to 41% of children who never had
received any food supplements from ICDS centre. Thirty-eight per cent of the children whose
health was checked-up at least once a month was found stunted, as against 42% of those who
never went through health check-ups in ICDS centre. A similar result was found so far as
7
weight measurement was concerned. Forty per cent of the children immunized in ICDS centre
were stunted as against 38% of their counterparts not immunized in that place. Wasting
prevalence also varied by sociodemographic and economic characteristics, plus the frequency
of ICDS utilization. Twenty per cent of the children receiving food supplements less often were
wasted than 22% of children who had received it almost daily from ICDS centre. Twenty-three
per cent of the children receiving health check-ups were wasted as against 21% of their
counterparts not receiving any health check-ups in the ICDS centre. Twenty-three per cent of
the children immunized in ICDS centre were wasted as against 20% of their counterparts not
immunized in that source. The wasting prevalence did not vary much with the frequency of
receiving weight measurement at ICDS centre (22-23%). Thirty-nine per cent of the children
receiving food supplements less often were underweight than 37% of children who had
received it almost daily from ICDS. Thirty-eight per cent of the children immunized in ICDS
centre were underweight against 35% of their counterparts not immunized in that place. The
underweight prevalence did not vary much with the frequency of receiving health check-ups
and weight measurement at ICDS centre (37-38%).
The proportion of stunted and underweight children increased with the increase in the age of
the children, while wasting was inversely associated. Nearly a half of the children of non-
literate mothers were found stunted (51%) and underweight (48%), while the corresponding
figures were 28% and 26% for those children whose mothers had ten plus years of schooling.
A higher percentage of children with underweight mothers (46%) were stunted, wasted (28%),
and underweight (48%) than their peers whose mothers were of normal weight (39%, 21% and
35%). The proportion of children with stunting, wasting and underweight found to decrease
with the uptrend of the economic status of the household. In the poorest households, 51% were
stunted, 28% were wasted, and 50% were underweight compared to 23% stunted, 15% wasted
children and 20% underweight children from the richest households. Forty-four per cent of the
SC/ST children were stunted, and 42% were underweight. The corresponding figures were 33%
and 31% among Non-SC/ST/OBC children. Higher percentages of the children from the central
region were stunted (45%) and underweight (42%).
Determinants of nutritional status
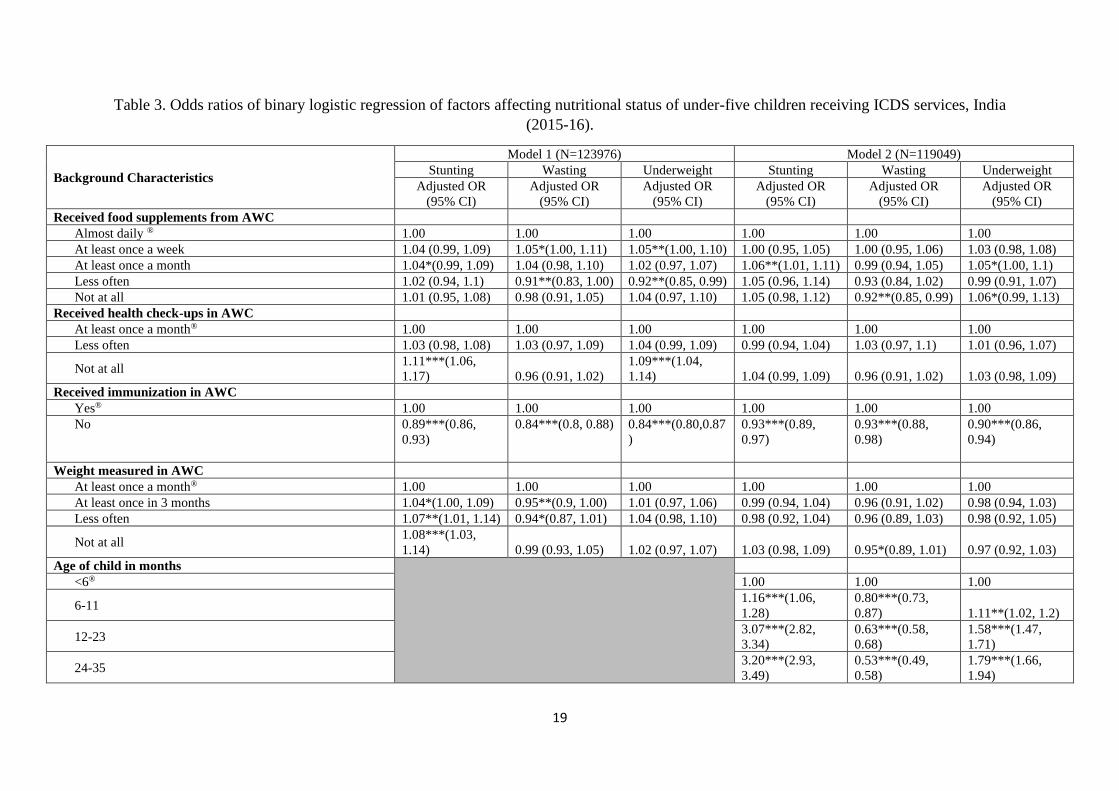
Table 3 presents the result of logistic regression of factors affecting the nutritional status of
under-five children receiving ICDS services. Model 1, comprising variables of ICDS
utilization, found that children who received food supplements at least once a month was more
likely to be stunted (OR: 1.04; P<0.10) than those who received it almost daily. The association
remained significant (OR: 1.06; P<0.05) even after adjusting the effects of other background
characteristics used in model 2. The chances of wasting were significantly lower (OR: 0.92;
P<0.05) among children who never received any food supplements than those who received it
almost daily after adjusting the variables. Children without any food supplements from ICDS
had higher odds of being underweight than those who received it almost daily (OR: 1.06;
P<0.10) when adjusted for other sociodemographic and economic predictors.
8
The children without any health check-ups in the ICDS centre had higher odds of being stunted
(OR: 1.11; P<0.01) and underweight (OR: 1.09; P<0.01) than those undergone health check-
ups. However, the significance of these associations disappeared when adjusted for other
variables. Children not immunized in ICDS centre were less likely to be stunted (OR: 0.89;
P<0.01), wasted (OR: 0.84; P<0.01) and underweight (OR: 0.84; P<0.01) than their
counterparts immunized in that centre. This association persisted significant (P<0.01) after
adjusting other variables' effects in model 2. Children never weighed in the ICDS centre had
higher chances of stunting than those weighed at least once a month (OR: 1.08; P<0.01). The
significant association between stunting and frequency of weight measurement disappeared
when adjusted for other variables. However, the likelihood of wasting was less among the
children never weighed in the ICDS centre (OR: 0.95; P<0.10), controlling the effects of
socioeconomic and demographic variables.
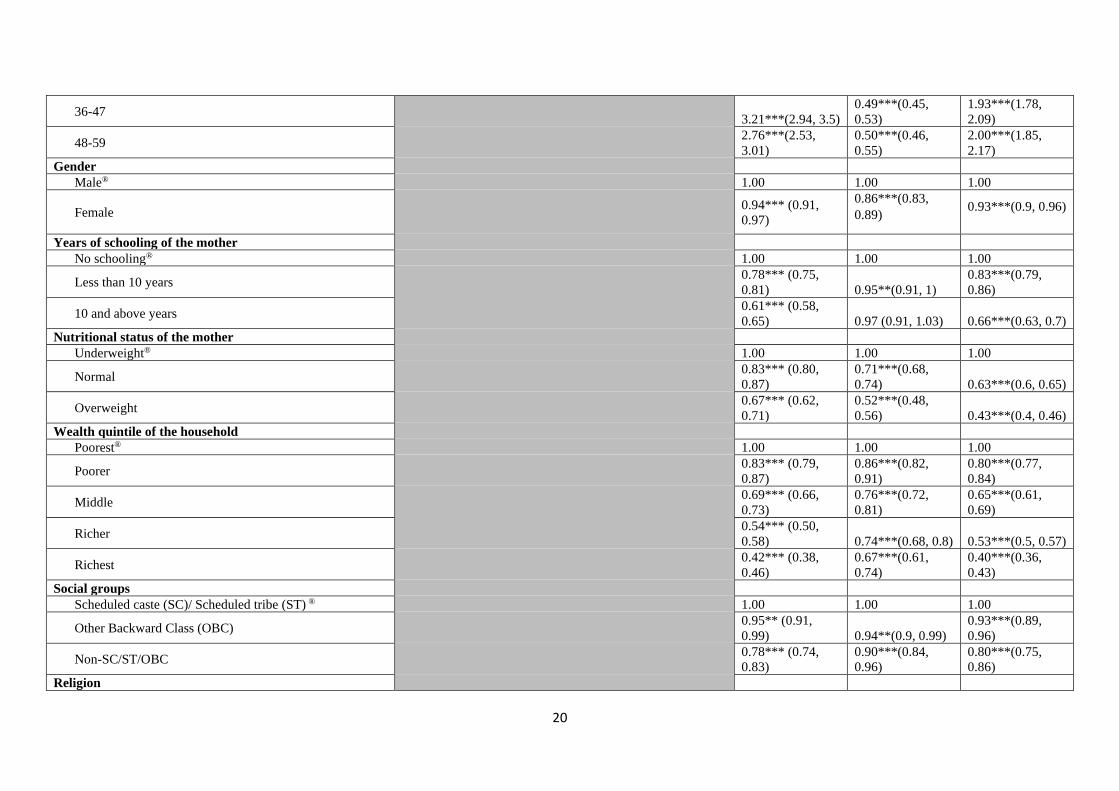
Age of child revealed a significant (P<0.01) inverse association with wasting and direct
association with stunting and underweight among under-five children. Girls were less likely to
be stunted (OR: 0.94; P<0.01), wasted (OR: 0.86; P<0.01) and underweight (OR: 0.93; P<0.01).
Children of educated mothers had lesser odds of stunting, wasting, and underweight than non-
literate mothers. For example- children of mothers with ten plus years of schooling had a 39%
lower chance of being stunted and 34% lower chance of being underweight than mothers with
no schooling. Children whose mothers had normal weight or were overweight had a lower
probability of stunting (OR: 0.83, OR: 0.67; P<0.01), wasting (OR: 0.71, OR: 0.52; P<0.01)
and underweight (OR: 0.63, OR: 0.43; P<0.01) as against those with underweight mothers. The
household's economic condition had a significant inverse association with undernutrition-
children from the richest quintile of households had lower odds of being stunted by 58%, waste
by 33% and underweight by 60% from the poorest quintile households. The children from non-
SC/ST/OBC category had lower chances of stunting (OR: 0.78, P<0.01), wasting (OR: 0.90,
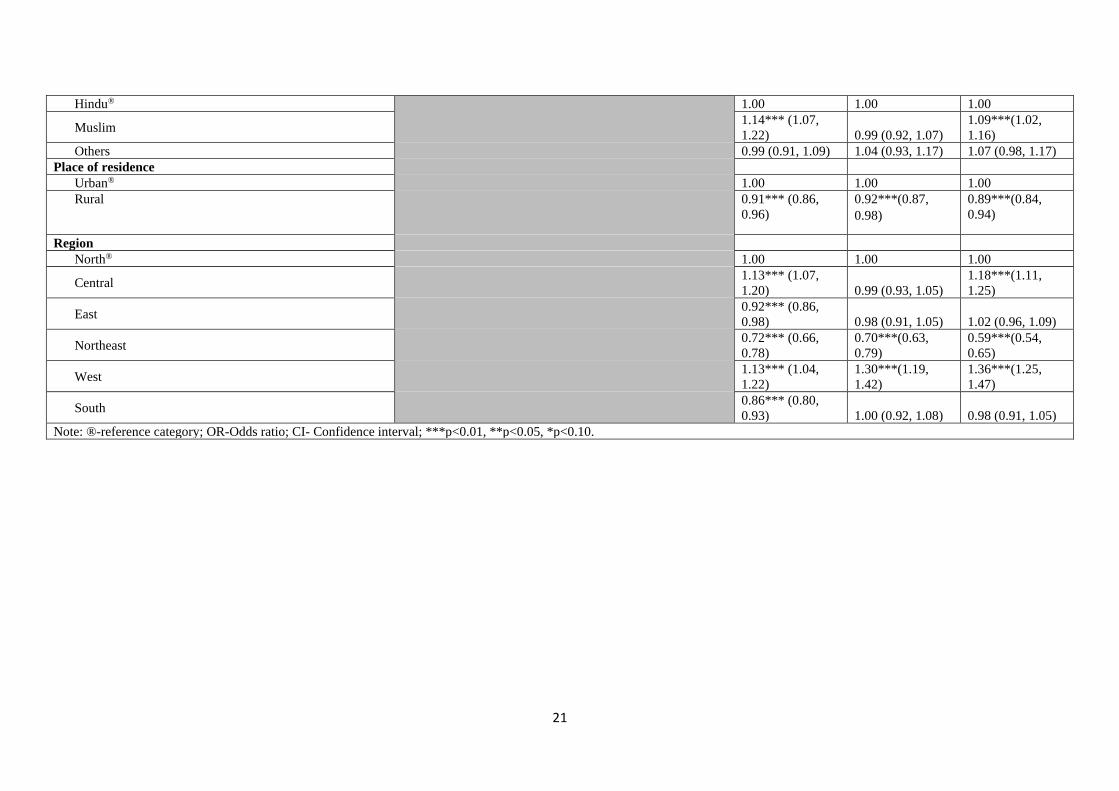
P<0.01) and underweight (OR: 0.80, P<0.01) than those from SC/ST category. Muslim
children were more likely to be stunted (OR: 1.14; P<0.01) and underweight (OR: 1.09; P<0.01)
than Hindu children. Children from rural areas had lower odds of stunting (OR: 0.91; P<0.01),
wasting (OR: 0.92; P<0.01) and underweight (OR: 0.89; P<0.01) than their urban counterparts.
Under-five children from the northeast region were less likely to be stunted (OR: 0.72; P<0.01),
wasted (OR: 0.70; P<0.01) and underweight (OR: 0.59; P<0.01) compared with peers from the
northern region.
Discussion
The study found that a sizable number of under-five children receiving any ICDS services
suffer from undernutrition, and the prevalence varied considerably by socioeconomic and
demographic characteristics plus the frequency of ICDS utilization. The utilization of ICDS
had a weak association with the nutritional status of under-five children. The child's age and
gender, maternal education and nutrition status, wealth index of the household, social group,
region, place of residence and region were significant determinants of undernutrition among
ICDS beneficiaries' in the country.
9
Utilization of all available child-centric ICDS services was not universal among the under-five
children who had received any services. A recent study also revealed that among all the benefits
offered under ICDS, services related to health and nutrition and pre-school were relatively
lesser utilized and a high concordance between service utilization by mothers and their children
(Rajpal et al., 2020). Another past study found that the mean proportion of respondents using
ICDS services has increased between 2006 and 2016; nevertheless, the population's poorest
quintiles were still left behind (Chakrabarti et al., 2019). It was also observed that having an
ICDS centre in the village does not affect the nutritional status of children due to poor delivery
of ICDS benefits (Jain, 2015).
The ICDS utilization had a negligible effect on the nutritional status of children. Most of the
earlier studies assessing the impact of ICDS on child nutrition had similar findings (Dixit et
al., 2018; Dutta and Ghosh, 2017; Thakur et al., 2011). Even the planning commission report
on the evaluation of ICDS was inconclusive about its impact on nutritional outcomes (Planning
Commission, 2011). This finding question the effectiveness of the ICDS to improve child
nutrition, although the direct approach in many large-scale programs has been found ineffective
(Das Gupta et al., 2005). One possibility is that the designated amount of food supplements
and food diversity might be insufficient to mark significant changes in under-five children's
nutritional condition. A past study among 1286 pre-school children also revealed a higher
prevalence of protein-energy malnutrition among ICDS beneficiaries than non-beneficiaries
(Swami et al., 2000).
Moreover, the insignificant effect of health check-ups, weight measurement, and immunization
at the ICDS centre on undernutrition might be due to the beneficiaries' profile. A sizable
proportion of the beneficiaries were from socio-economically underprivileged groups and
probably could not fully utilize the benefits/learnings to improve children's nutritional status
due to their disadvantageous status. Literature suggests shifting focus to improve
environmental hygiene and child feeding practices and enhancing nutritional awareness of
caregivers from the mere provision of supplementary feeding to improve child nutritional status
(Dixit et al., 2018). Dutta and Ghosh (2015) recommend that child stunting may be improved
if the child receives supplementary food and the caregiver is provided information on the
nutrition and growth trajectory of the child. Another study found caregiver's knowledge,
attitudes, and practices regarding hygiene and infant feeding as major determinants of child
nutrition (Kalid et al., 2019). Athavale et al. (2020) recommend engaging all family members
and strengthening maternal self-efficacy for following IYCF recommended guidelines to
improve nutritional status.
Stunting and underweight prevalence found to increase with the increasing age of under-five
children. This result may be because of inadequate complementary feedings once breast milk
alone becomes insufficient. Moreover, low-quality foods and lack of food and water safety
might have affected the older children. Boys were more undernourished than girls, and the
finding conformed to a recent systematic review that attributed both biological and social
10
factors as possible reasons (Thurstans et al., 2020). As found in many past studies (Corsi et al.,
2016; Meshram et al., 2012; Mukherjee et al., 2008; Sen et al., 2011), this study also found that
better education and nutritional status of mothers significantly reduce the likelihood of
undernutrition among under-five children. An earlier study revealed that educated mothers
have a better awareness of the available health services, and the acceptance of utilizing the
same is more among them (Murarkar et al., 2020). A recent study also found higher odds of
MAD feeding among children with educated mothers exposed to mass media (Acharya et al.,
2021). Children from affluent households had improved nutritional status. One possible reason
may be that these children had higher odds of MAD feeding, which was found in many earlier
studies (Patel et al., 2012; Senarath et al., 2012). Moreover, the higher MAD feeding among
the children from wealthy households could be attributed to their ability to afford food diversity
and required meal frequency to maintain a diet diversity (Rohner et al., 2013). Mothers from
poor households were again more likely to focus on food quantity than wealthy households
who give their children highly nutritious foods (Joshi et al., 2012).
The study found that children from socially backward communities (SCs/STs) more likely to
be undernourished. A past study decomposing malnutrition inequalities between SCs/STs and
the remaining population attributed the gap primarily caused by the former’s lower wealth,
education, and healthcare services (Van de Poel and Speybroeck, 2009). Additionally, their
ignorance about the importance of diet diversity and incapacity to afford the required diet
diversity and meal frequencies might also be a factor. An earlier study revealed a lower
probability of MAD feeding among children from the SCs community (Acharya et al., 2021).
There is again enough evidence to suggest lower literacy among the SC/ST people and their
economically weaker status (International Institute for Population Sciences (IIPS) and ICF,
2017; Ministry of Social Justice and Empowerment Government of India, 2004-05; Registrar
General and Census Commissioner of India, 2011). Moreover, social-group based inequalities
in accessing health services and health services utilization measures- SC/ST communities being
the disadvantaged group, might be another possibility (Balarajan et al., 2011; Baru et al., 2010;
Shaikh et al., 2018). The differences in the effects of religion on stunting may be attributed to
the variations in values and norms that guide lifestyles and beliefs concerning health and well-
being (Parekh and Pillai, 2016). In contrast to past studies that found a better nutritional status
of urban children (Bharati, 2009; Ministry of Health and Family Welfare (MoHFW),
Government of India, 2019), this study found that under-five children residing in rural areas
had a lower chance of undernutrition. One possibility might be improved awareness of dietary
diversity and access to seasonal, nutritious foods in rural areas (Murarkar et al., 2020). This
study also found a wide regional disparity in under-five children's undernutrition (Jain and
Agnihotri, 2020; Jose et al., 2018). The higher chances of undernutrition in the country's central
and western region that comprise a sizable proportion of the country's child population was a
cause of concern.
The study's strengths could be attributed to the findings based on a large representative sample
of children covered in the recently concluded NFHS-4 with a robust sampling design. Thus,
the results are contemporary. The study documents the determinants of nutritional status of
11
under-five children and the insignificant effect of ICDS on nutritional status. However, the
survey's cross-sectional design limits child undernutrition's causal association with factors
drawn from this analysis. Moreover, this study does not identify a causal effect due to the
possible correlation between socioeconomic status, AWC utilization, and undernutrition.
Despite this, the study's findings would help strengthen the existing service delivery
mechanism to increase utilization/coverage and quality of services under ICDS, thus ensuring
a better nutritional status of under-five children. The study suggests the need to ensure all
available services to children enrolled in the AWC. Regular monitoring of service utilization
and supervision by the Child Development Project Officer (CDPO) may help in expanding the
coverage. More importantly, the program should also emphasize feeding practices and
educating parents about improving child health and nutrition.
Ethical statements
Informed consent was taken before interviewing the respondents in the NFHS-4. The NFHS-4
survey was approved by the Institutional Review Boards of the institutions involved. The
NFHS-4 datasets are available for broader use in social research at https://www.
dhsprogram.com. This study used secondary data of the NFHS-4.
Declaration of conflicting interest
The author(s) declare that there is no conflict of interest.
12
References:
Acharya A, Pradhan MR, and Das AK (2021) Determinants of Minimum Acceptable Diet
Feeding among Children Aged 6-23 Months in Odisha, India. Public Health Nutrition,
1-27.
Athavale P, Hoeft K, Dalal RM, et al. (2020) A qualitative assessment of barriers and
facilitators to implementing recommended infant nutrition practices in Mumbai, India.
Journal of Health Population and Nutrition 39, 7. https://doi.org/10.1186/s41043-020-
00215-w
Avula R, Raykar N, Menon P, et al. (2016) Reducing stunting in India: what investments are
needed? Maternal & Child Nutrition 12(Suppl 1): 249-252.
Balarajan Y, Selvaraj S and Subramanian SV (2011) Health care and equity in India. Lancet
377(9764): 505-515.
Baru R, Acharya A, Acharya S, et al. (2010) Inequities in Access to Health Services in India:
Caste, Class and Region. Economic & Political Weekly 45(38): 49-58.
Bashir A, Bashir U, Ganie ZA, et al. (2014) Evaluation Study of Integrated Child Development
Scheme (ICDS) In District Bandipora of Jammu and Kashmir, India. International
Research Journal of Social Sciences 3(2): 34-36.
Bharati S, Pal M and Bharati P (2008) Determinants of nutritional status of pre-school children
in India. Journal of Biosocial Science 40(6): 801-814.
Borkotoky K, Unisa S and Gupta AK (2018) State-level dietary diversity as a contextual
determinant of nutritional status of children in India: a multilevel approach. Journal of
Biosocial Science 50(1): 26-52.
Chakrabarti S, Raghunathan K, Alderman H, et al. (2019) India's Integrated Child
Development Services programme; equity and extent of coverage in 2006 and 2016.
Bulletin of the World Health Organization 97: 270-282.
Chudasama RK, Patel UV, Verma PB, et al. (2015) Evaluation of Anganwadi centres
performance under integrated child development services (ICDS) program in Gujarat
state, India during year 2012-13. Journal of Mahatma Gandhi Institute of Medical
Sciences 20(1): 60-65.
Corsi DJ, Mejía-Guevara I and Subramanian SV (2016) Risk factors for chronic undernutrition
among children in India: Estimating relative importance, population attributable risk and
fractions. Social Science & Medicine 157: 165-185.
Das Gupta M, Gragnolati M, Ivaschenko O, et al. (2005) Improving Child Nutrition Outcomes
In India: Can The Integrated Child Development Services Be More Effective? World
Bank Policy Research Paper 3647. Available at:
https://openknowledge.worldbank.org/bitstream/handle/10986/8301/wps3647.pdf?sequ
ence=1&isAllowed=y (accessed 2 June 2021).
Dixit P, Gupta A, Dwivedi LK, et al. (2018) Impact evaluation of integrated child development
services in rural India: Propensity score matching analysis. SAGE Open 8(2): 1-7.
Dutta A and Ghosh S (2017) Impact of integrated child development scheme on child
malnutrition in West Bengal, India. Maternal & Child Nutrition 13(4).
Gareth J, Daniela W, Trevor H, et al. (2013). An introduction to statistical learning: with
applications in R. Spinger.
13
Global Nutrition Report (2020) 2020 Global nutrition report: action on equity to end
malnutrition. Bristol, UK: Development Initiatives.
International Institute for Population Sciences (IIPS) and ICF (2017) National Family Health
Survey (NFHS-4), 2015–16. India: IIPS Mumbai.
Jain A and Agnihotri SB (2020) Assessing inequalities and regional disparities in child
nutrition outcomes in India using MANUSH - a more sensitive yardstick. International
Journal for Equity in Health 19(1): 138.
Jain M (2015) India’s struggle against malnutrition—is the ICDS program the answer? World
Development 67: 72-89.
Jose S, Reddy AB and Agrawal M (2018) Child undernutrition in India: assessment of
prevalence, decline and disparities. Economic & Political Weekly 53(48): 63-70.
Joshi N, Agho KE, Dibley MJ, et al. (2012) Determinants of inappropriate complementary
feeding practices in young children in Nepal: secondary data analysis of Demographic
and Health Survey 2006. Maternal & Child Nutrition 8 Suppl 1(Suppl 1): 45-59.
Kalid M, Osman F, Sulaiman M, Dykes F, et al. (2019). Infant and young child nutritional
status and their caregivers' feeding knowledge and hygiene practices in internally
displaced person camps, Somalia. BMC nutrition, 5, 59. https://doi.org/10.1186/s40795-
019-0325-4
Kandpal E (2011) Beyond Average Treatment Effects: Distribution of Child Nutrition
Outcomes and Program Placement in India's ICDS. World Development 39(8): 1410-
1421.
Kanjilal B, Mazumdar PG, Mukherjee M, et al. (2010) Nutritional status of children in India:
household socioeconomic condition as the contextual determinant. International Journal
for Equity in Health 9(19): 1-13.
Meshram, II, Arlappa N, Balakrishna N, et al. (2012) Prevalence and determinants of
undernutrition and its trends among pre-school tribal children of Maharashtra State,
India. Journal of Tropical Pediatrics 58(2): 125-132.
Ministry of Social Justice and Empowerment Government of India (2004-05) State-Wise
Percentage of Population Below Poverty Line by Social Groups, 2004-05. Available at:
http://socialjustice.nic.in/UserView/index?mid=76672 (accessed 10 February 2021).
Ministry of Women & Child Development (MoWCD) and Government of India Integrated
Child Development Services (ICDS) Scheme. Available at: https://icds-
wcd.nic.in/icds.aspx (accessed 10 February 2021).
Mukherjee R, Chaturvedi S and Bhalwar R (2008) Determinants of Nutritional Status of School
Children. Medical Journal Armed Forces India 64(3): 227-231.
Murarkar S, Gothankar J, Doke P, et al. (2020) Prevalence and determinants of undernutrition
among under-five children residing in urban slums and rural area, Maharashtra, India: a
community-based cross-sectional study. BMC Public Health 20(1): 1559.
Parekh R and Pillai VK (2016) Stunting in India: an empirical approach to human rights-based
solutions. Journal of Human Rights and Social Work 1(4): 184-192.
Patel A, Pusdekar Y, Badhoniya N, et al. (2012) Determinants of inappropriate complementary
feeding practices in young children in India: secondary analysis of National Family
Health Survey 2005-2006. Maternal & Child Nutrition 8 Suppl 1(Suppl 1): 28-44.
14
Planning Commission (2011) Evaluation report on integrated child development services. New
Delhi, India: Programme Evaluation Organisation.
Rajpal S, Joe W, Subramanyam MA, et al. (2020) Utilization of Integrated Child Development
Services in India: Programmatic Insights from National Family Health Survey, 2016.
International Journal of Environmental Research and Public Health 17(9): 3197.
Registrar General and Census Commissioner of India (2011) Population totals: India data sheet.
India: Ministry of Home Affairs, Government of India.
Rehan A, Kishore S, Singh M, et al. (2020) A study to assess undernutrition and its
sociodemographic correlates in under-five children in urban and rural areas of Rishikesh,
Uttarakhand. Journal of Family Medicine and Primary Care 9(9): 4980-4984.
Rohner F, Bradley AW, Grant JA, et al. (2013) Infant and young child feeding practices in
urban Philippines and their associations with stunting, anemia, and deficiencies of iron
and vitamin A. Food and Nutrition Bulletin 34(2_Suppl1): S17-S34.
Sahu SK, Kumar SG, Bhat BV, et al. (2015) Malnutrition among under-five children in India
and strategies for control. Journal of Natural Science, Biology, and Medicine 6(1): 18-
23.
Sen P, Bharati S, Som S, et al. (2011) Growth and nutritional status of pre-school children in
India: a study of two recent time periods. Food and Nutrition Bulletin 32(2): 84-93.
Senarath U, Agho KE, Akram DE, et al. (2012) Comparisons of complementary feeding
indicators and associated factors in children aged 6-23 months across five South Asian
countries. Maternal & Child Nutrition 8 Suppl 1(Suppl 1): 89-106.
Shaikh M, Miraldo M and Renner A-T (2018) Waiting time at health facilities and social class:
Evidence from the Indian caste system. PLoS ONE 13(10): e0205641.
Som S, Pal M and Bharati P (2007) Role of individual and household level factors on stunting:
a comparative study in three Indian states. Annals of Human Biology 34(6): 632-646.
Swami HM, Thakur JS, Bhatia SPS, et al. (2000) National immunization day to assess
nutritional status of underfives in Chandigarh. Indian Journal of Pediatrics 67(1): 15-17.
Swaminathan S, Hemalatha R, Pandey A, et al. (2019) The burden of child and maternal
malnutrition and trends in its indicators in the states of India: the Global Burden of
Disease Study 1990–2017. The Lancet Child & Adolescent Health 3(12): 855-870.
Thakur JS, Prinja S and Bhatia SS (2011) Persisting malnutrition in Chandigarh: decadal
underweight trends and impact of ICDS program. Indian Pediatrics 48(4): 315-318.
Thurstans S, Opondo C, Seal A, et al. (2020) Boys are more likely to be undernourished than
girls: a systematic review and meta-analysis of sex differences in undernutrition. BMJ
Global Health 5(12): e004030.
Van de Poel E and Speybroeck N (2009) Decomposing malnutrition inequalities between
Scheduled Castes and Tribes and the remaining Indian population. Ethnicity & Health
14(3): 271-287.
WHO (2019) Nutrition Landscape Information System (NLiS) country profile indicators:
interpretation guide.
15
Table 1: Socio–economic and demographic characteristics of children under-five who have
utilized ICDS services from anganwadi centre (AWC) in last 12 months, India, 2015-16
Characteristics % distribution
of children
Number of
children
Received food supplements from AWC*
Almost daily 36.0 38,880
At least once a week 21.8 30,410
At least once a month 26.9 36,045
Less often 4.7 8,927
Not at all 10.7 13,198
Received health check-ups in AWC*
At least once a month 54.0 62,163
Less often 20.2 27,275
Not at all 25.8 36,590
Received immunization in AWC*
Yes 74.4 90,117
No 25.6 37,040
Weight measured in AWC*
At least once a month 45.7 53,699
At least once in 3 months 21.8 26,889
Less often 10.4 14,470
Not at all 22.0 30,655
Age of child in months
<6 7.3 9,707
6-11 11.4 14,445
12-23 22.6 28,876
24-35 21.0 27,018
36-47 20.3 25,775
48-59 17.4 21,992
Gender of the child
Male 51.6 65,796
Female 48.5 62,017
Years of schooling of the mother
No schooling 28.6 37,468
Less than 10 years 43.2 56,179
10 and above years 28.3 34,166
Nutritional status of the mother*
Underweight 27.2 33,313
Normal 60.1 78,807
Overweight 12.7 15,274
Wealth quintile of the household
Poorest 25.7 34,146
Poorer 24.7 32,410
Middle 22.0 27,353
Richer 17.7 20,688
Richest 9.9 13,216
Social groups*
Scheduled caste (SC)/ Scheduled tribe (ST) 37.5 53,480
16
Other Backward Class (OBC) 45.0 50,017
Non-SC/ST/OBC 17.5 19,526
Religion
Hindu 80.8 97,299
Muslim 14.1 16,148
Others 5.1 14,366
Place of residence
Urban 20.7 23,546
Rural 79.3 1,04,267
Region#
North 10.6 20,708
Central 25.1 37,155
East 28.9 30,244
Northeast 3.4 15,778
West 12.0 9,600
South 20.0 14,328
Under-five children who received any ICDS
service
100.0 1,27,813
Note: * The sample size for respective predictor variables may not add to total sample size
due to missing values.
17
Table 2: Nutritional status of under-five children who have utilized ICDS services from
anganwadi centre (AWC) in last 12 months, by background characteristics, India, 2015-16
Background characteristics Stunting Wasting Underweight N
Received food supplements from
AWC*
Almost daily 38.2 22.1 36.5 38,880
At least once a week 39.6 22.7 37.8 30,410
At least once a month 40.2 22.3 37.4 36,045
Less often 40.3 19.8 35.2 8,927
Not at all 41.2 21.4 39.1 13,198
Chi-square X2 (p-value) 31.14
(0.000)
142.73
(0.000)
205.36 (0.000)
Received health check-ups in AWC*
At least once a month 38.3 22.6 36.8 62,163
Less often 39.5 22.1 37.2 27,275
Not at all 41.6 21.1 38.3 36,590
Chi-square X2 (p-value) 11.29
(0.004)
99.99
(0.000)
28.00 (0.000)
Received immunization in AWC*
Yes 40.0 22.9 38.2 90,117
No 38.0 19.7 34.5 37,040
Chi-square X2 (p-value) 74.26
(0.000)
435.53
(0.000)
500.34 (0.000)
Weight measured in AWC*
At least once a month 38.1 22.8 36.8 53,699
At least once in 3 months 39.4 21.8 37.2 26,889
Less often 40.3 21.1 37.4 14,470
Not at all 41.5 21.5 38.0 30,655
Chi-square X2 (p-value) 12.57
(0.006)
78.08
(0.000)
22.90 (0.000)
Age of child in months
<6 20.9 31.3 26.7 9,707
6-11 23.6 27.8 29.6 14,445
12-23 43.5 23.4 37.0 28,876
24-35 43.9 20.1 38.8 27,018
36-47 44.5 18.6 40.5 25,775
48-59 41.1 19.2 41.4 21,992
Chi-square X2 (p-value) 3300
(0.000)
974.53
(0.000)
858.17 (0.000)
Gender of the child
Male 40.0 23.2 37.9 65,796
Female 38.9 20.8 36.6 62,017
Chi-square X2 (p-value) 46.58
(0.000)
105.95
(0.000)
35.03 (0.000)
Years of schooling of the mother
No schooling 50.6 24.1 47.6 37,468
Less than 10 years 39.6 22.0 37.7 56,179
10 and above years 28.0 20.2 26.2 34,166
Chi-square X2 (p-value) 3700
(0.000)
339.35
(0.000)
3700 (0.000)
Nutritional status of the mother
Underweight 45.8 28.1 48.6 33,313
18
Normal 38.8 20.8 35.1 78,807
Overweight 28.8 15.0 22.8 15,274
Chi-square X2 (p-value) 1400
(0.000)
1400
(0.000)
3800 (0.000)
Wealth quintile of the household
Poorest 50.9 25.8 49.5 34,146
Poorer 43.1 22.9 41.0 32,410
Middle 37.0 20.5 33.9 27,353
Richer 29.7 19.6 27.9 20,688
Richest 23.3 18.1 20.4 13,216
Chi-square X2 (p-value) 4300
(0.000)
853.03
(0.000)
5300 (0.000)
Social groups*
Scheduled caste (SC)/ Scheduled
tribe (ST) 43.5 24.1 42.1 53,480
Other Backward Class (OBC) 39.2 21.6 36.5 50,017
Non-SC/ST/OBC 32.7 19.9 30.8 19,526
Chi-square X2 (p-value) 668.74
(0.000)
170.96
(0.000)
738.20 (0.000)
Religion
Hindu 39.6 22.4 37.7 97,299
Muslim 40.6 20.3 36.1 16,148
Others 34.6 21.2 33.3 14,366
Chi-square X2 (p-value) 160.70
(0.000)
467.30
(0.000)
971.94 (0.000)
Place of residence
Urban 34.0 20.7 31.6 23,546
Rural 40.9 22.4 38.7 1,04,267
Chi-square X2 (p-value) 411.75
(0.000)
41.16
(0.000)
365.97 (0.000)
Region
North 34.9 20.3 30.7 20,708
Central 44.6 22.4 41.5 37,155
East 42.5 22.6 40.7 30,244
Northeast 35.6 16.5 27.8 15,778
West 39.8 25.8 40.6 9,600
South 31.6 20.5 29.9 14,328
Chi-square X2 (p-value) 1400
(0.000)
1100
(0.000)
3400 (0.000)
Total 39.5 22.1 37.3 1,27,813
Note- Bivariate association shown using Chi-square test for association and values in parentheses
are the p-values associated with the respective Chi-square;
* The sample size for respective predictor variables may not add to total sample due to missing
values.
19
Table 3. Odds ratios of binary logistic regression of factors affecting nutritional status of under-five children receiving ICDS services, India
(2015-16).
Background Characteristics
Model 1 (N=123976) Model 2 (N=119049)
Stunting Wasting Underweight Stunting Wasting Underweight
Adjusted OR
(95% CI)
Adjusted OR
(95% CI)
Adjusted OR
(95% CI)
Adjusted OR
(95% CI)
Adjusted OR
(95% CI)
Adjusted OR
(95% CI)
Received food supplements from AWC
Almost daily ® 1.00 1.00 1.00 1.00 1.00 1.00
At least once a week 1.04 (0.99, 1.09) 1.05*(1.00, 1.11) 1.05**(1.00, 1.10) 1.00 (0.95, 1.05) 1.00 (0.95, 1.06) 1.03 (0.98, 1.08)
At least once a month 1.04*(0.99, 1.09) 1.04 (0.98, 1.10) 1.02 (0.97, 1.07) 1.06**(1.01, 1.11) 0.99 (0.94, 1.05) 1.05*(1.00, 1.1)
Less often 1.02 (0.94, 1.1) 0.91**(0.83, 1.00) 0.92**(0.85, 0.99) 1.05 (0.96, 1.14) 0.93 (0.84, 1.02) 0.99 (0.91, 1.07)
Not at all 1.01 (0.95, 1.08) 0.98 (0.91, 1.05) 1.04 (0.97, 1.10) 1.05 (0.98, 1.12) 0.92**(0.85, 0.99) 1.06*(0.99, 1.13)
Received health check-ups in AWC
At least once a month® 1.00 1.00 1.00 1.00 1.00 1.00
Less often 1.03 (0.98, 1.08) 1.03 (0.97, 1.09) 1.04 (0.99, 1.09) 0.99 (0.94, 1.04) 1.03 (0.97, 1.1) 1.01 (0.96, 1.07)
Not at all 1.11***(1.06,
1.17) 0.96 (0.91, 1.02)
1.09***(1.04,
1.14) 1.04 (0.99, 1.09) 0.96 (0.91, 1.02) 1.03 (0.98, 1.09)
Received immunization in AWC
Yes® 1.00 1.00 1.00 1.00 1.00 1.00
No 0.89***(0.86,
0.93)
0.84***(0.8, 0.88) 0.84***(0.80,0.87
)
0.93***(0.89,
0.97)
0.93***(0.88,
0.98)
0.90***(0.86,
0.94)
Weight measured in AWC
At least once a month® 1.00 1.00 1.00 1.00 1.00 1.00
At least once in 3 months 1.04*(1.00, 1.09) 0.95**(0.9, 1.00) 1.01 (0.97, 1.06) 0.99 (0.94, 1.04) 0.96 (0.91, 1.02) 0.98 (0.94, 1.03)
Less often 1.07**(1.01, 1.14) 0.94*(0.87, 1.01) 1.04 (0.98, 1.10) 0.98 (0.92, 1.04) 0.96 (0.89, 1.03) 0.98 (0.92, 1.05)
Not at all 1.08***(1.03,
1.14) 0.99 (0.93, 1.05) 1.02 (0.97, 1.07) 1.03 (0.98, 1.09) 0.95*(0.89, 1.01) 0.97 (0.92, 1.03)
Age of child in months
<6® 1.00 1.00 1.00
6-11 1.16***(1.06,
1.28)
0.80***(0.73,
0.87) 1.11**(1.02, 1.2)
12-23 3.07***(2.82,
3.34)
0.63***(0.58,
0.68)
1.58***(1.47,
1.71)
24-35 3.20***(2.93,
3.49)
0.53***(0.49,
0.58)
1.79***(1.66,
1.94)
20
36-47 3.21***(2.94, 3.5)
0.49***(0.45,
0.53)
1.93***(1.78,
2.09)
48-59 2.76***(2.53,
3.01)
0.50***(0.46,
0.55)
2.00***(1.85,
2.17)
Gender
Male® 1.00 1.00 1.00
Female 0.94*** (0.91,
0.97)
0.86***(0.83,
0.89) 0.93***(0.9, 0.96)
Years of schooling of the mother
No schooling® 1.00 1.00 1.00
Less than 10 years 0.78*** (0.75,
0.81) 0.95**(0.91, 1)
0.83***(0.79,
0.86)
10 and above years 0.61*** (0.58,
0.65) 0.97 (0.91, 1.03) 0.66***(0.63, 0.7)
Nutritional status of the mother
Underweight® 1.00 1.00 1.00
Normal 0.83*** (0.80,
0.87)
0.71***(0.68,
0.74) 0.63***(0.6, 0.65)
Overweight 0.67*** (0.62,
0.71)
0.52***(0.48,
0.56) 0.43***(0.4, 0.46)
Wealth quintile of the household
Poorest® 1.00 1.00 1.00
Poorer 0.83*** (0.79,
0.87)
0.86***(0.82,
0.91)
0.80***(0.77,
0.84)
Middle 0.69*** (0.66,
0.73)
0.76***(0.72,
0.81)
0.65***(0.61,
0.69)
Richer 0.54*** (0.50,
0.58) 0.74***(0.68, 0.8) 0.53***(0.5, 0.57)
Richest 0.42*** (0.38,
0.46)
0.67***(0.61,
0.74)
0.40***(0.36,
0.43)
Social groups
Scheduled caste (SC)/ Scheduled tribe (ST) ® 1.00 1.00 1.00
Other Backward Class (OBC) 0.95** (0.91,
0.99) 0.94**(0.9, 0.99)
0.93***(0.89,
0.96)
Non-SC/ST/OBC 0.78*** (0.74,
0.83)
0.90***(0.84,
0.96)
0.80***(0.75,
0.86)
Religion
21
Hindu® 1.00 1.00 1.00
Muslim 1.14*** (1.07,
1.22) 0.99 (0.92, 1.07)
1.09***(1.02,
1.16)
Others 0.99 (0.91, 1.09) 1.04 (0.93, 1.17) 1.07 (0.98, 1.17)
Place of residence
Urban® 1.00 1.00 1.00
Rural 0.91*** (0.86,
0.96)
0.92***(0.87,
0.98)
0.89***(0.84,
0.94)
Region
North® 1.00 1.00 1.00
Central 1.13*** (1.07,
1.20) 0.99 (0.93, 1.05)
1.18***(1.11,
1.25)
East 0.92*** (0.86,
0.98) 0.98 (0.91, 1.05) 1.02 (0.96, 1.09)
Northeast 0.72*** (0.66,
0.78)
0.70***(0.63,
0.79)
0.59***(0.54,
0.65)
West 1.13*** (1.04,
1.22)
1.30***(1.19,
1.42)
1.36***(1.25,
1.47)
South 0.86*** (0.80,
0.93) 1.00 (0.92, 1.08) 0.98 (0.91, 1.05)
Note: ®-reference category; OR-Odds ratio; CI- Confidence interval; ***p<0.01, **p<0.05, *p<0.10.
Recommended