Finance and Economics Discussion SeriesDivisions of Research & Statistics and Monetary Affairs
Federal Reserve Board, Washington, D.C.
Determinants of the Locations of Payday Lenders, Pawnshops andCheck-Cashing Outlets
Robin A. Prager
2009-33
NOTE: Staff working papers in the Finance and Economics Discussion Series (FEDS) are preliminarymaterials circulated to stimulate discussion and critical comment. The analysis and conclusions set forthare those of the authors and do not indicate concurrence by other members of the research staff or theBoard of Governors. References in publications to the Finance and Economics Discussion Series (other thanacknowledgement) should be cleared with the author(s) to protect the tentative character of these papers.
Determinants of the Locations of Payday Lenders, Pawnshops and Check-Cashing Outlets
Robin A. Prager Assistant Director
Division of Research and Statistics Board of Governors of the Federal Reserve System
June 2009
The views expressed in this paper are those of the author and do not necessarily reflect the views of the Board of Governors of the Federal Reserve System or its staff. The author thanks Matt Fellowes and Mia Mabanta for providing data on the number of payday loan stores, pawnshops and check-cashing outlets in each U.S. county, and Stefanie Ramirez for outstanding research assistance.
1
Abstract
A large and growing number of low-to-moderate income U.S. households rely upon alternative financial service providers (AFSPs) for a variety of credit products and transaction services, including payday loans, pawn loans, automobile title loans, tax refund anticipation loans and check-cashing services. The rapid growth of this segment of the financial services industry over the past decade has been quite controversial. One aspect of the controversy involves the location decisions of AFSPs. This study examines the determinants of the locations of three types of AFSPs – payday lenders, pawnshops, and check-cashing outlets. Using county-level data for the entire country, I find that the number of AFSP outlets per capita is significantly related to demographic characteristics of the county population (e.g., racial/ethnic composition, age, and education level), measures of the population’s credit worthiness, and the stringency of state laws and regulations governing AFSPs.
2
I. Introduction A large and growing number of low-to-moderate income U.S. households rely
upon alternative financial service providers (AFSPs) for a variety of credit products and
transaction services, including payday loans, pawn loans, automobile title loans, tax
refund anticipation loans and check-cashing services. The rapid growth of this segment
of the financial services industry over the past decade has been quite controversial.1
Supporters argue that AFSPs have flourished because they meet consumers’ growing
demand for quick, convenient access to cash and short-term credit. At the same time,
critics assert that these firms charge unconscionably high prices that are not justified by
costs, thereby taking advantage of some of the most economically vulnerable members of
society.
The location decisions of AFSPs have also been the subject of considerable
debate. Supporters of AFSPs argue that the firms locate in areas that are inadequately
served by banks and other mainstream financial service providers, thereby fulfilling
otherwise unmet needs of the residents of these neighborhoods. Critics of AFSPs, on the
other hand, argue that these firms prey upon disadvantaged segments of the population by
strategically locating their stores in low-income, high-minority-population
neighborhoods.
A number of researchers have studied the geographic distribution of alternative
financial service providers. Most of these studies have focused on a limited geographic
area (e.g., a single state or a small number of urban areas) or have used highly aggregated
(e.g., state-level) data to examine a larger geographic area, such as the entire country or a
large portion thereof. They typically have considered demographic factors such as 1 Apgar and Herbert (2004), page I-1.
3
income, race, and education level as determinants of the locations of AFSPs. Some
studies have also included state usury ceilings or the proximity of bank branches as
explanatory variables. Although the findings of these studies are somewhat mixed, they
generally find that AFSPs are more prevalent in areas where a large percentage of the
population has low-income, lacks a high school diploma or is black or Hispanic. Those
studies that include usury ceilings find higher ceilings associated with a larger number of
AFSPs per capita, and those that include the locations of bank branches find a positive
relationship between the number of bank branches per capita and the number of AFSP
outlets per capita.
This study expands upon the existing research by examining the determinants of
AFSP location using county-level data for the entire country, estimating separate models
for urban and rural areas for each of three types of AFSP, and introducing some new
explanatory variables. Using county-level observations for the entire country allows for
an analysis that is at once more granular than that undertaken in previous nationwide
studies and more comprehensive than studies that focus on smaller geographic areas. The
new explanatory variables reflect two important factors – state laws and regulations
directly affecting AFSPs and the creditworthiness of the county population – that have
not been considered in previous studies.
The remainder of the paper is organized as follows: Section II provides a brief
description of each of the three segments of the alternative financial services industry
examined in the paper: pawn lending, check cashing, and payday lending. Section III
describes the regulatory requirements and constraints faced by each industry segment.
Section IV provides an overview of the existing literature on AFSP location. Sections V
4
and VI present evidence on the geographic distributions of various types of financial
service providers and an analysis of the determinants of AFSP locations, respectively.
Section VII concludes the paper.
II. Industry Background
A. Pawn Lending
Pawnshops make small, non-recourse loans collateralized by tangible personal
property, such as jewelry, consumer electronics, tools, musical instruments or firearms.
Pawnbrokers do not attempt to assess the creditworthiness of their customers; rather, they
rely upon the estimated value of the collateral in making their loan decisions. The
amount loaned is determined as a percentage of the estimated resale value of the pledged
collateral and, according to one large pawnshop operator, is typically between 25 and 65
percent.2 Pawnshop operators rely on a number of different sources for determining the
resale value of the pledged collateral, including catalogues, “blue books,” newspapers,
internet sites, and at least for some of the larger companies, their own proprietary
computerized valuation systems. The average size of a pawn loan is quite small – on the
order of $75 to $100 – and its term is typically one month.
Fees charged for pawn loans are typically stated as a percentage of the loan
amount, and can vary from as low as 12 percent to as high as 300 percent annually,
depending, to a large degree, on legal limits imposed by the state in which the loan is
made. At the time of the pawn transaction, the borrower receives a document, commonly
referred to as a pawn ticket, which includes the customer’s name and identifying
information (e.g., driver’s license number), the name and address of the pawnshop, a 2 Source: EZCORP, Inc. Form 10-K for the fiscal year ended September 30, 2007.
5
description of the pledged collateral, the amount of the loan, the maturity date of the loan,
the amount that must be paid to redeem the collateral at maturity, and the annual
percentage rate (APR). If the loan is not repaid at or prior to maturity, the customer is
given a grace period (typically 30 to 60 days) within which to redeem the pledged
property by paying the loan amount and all accrued charges. If, at the end of the grace
period, the customer has neither redeemed his property nor extended the loan, the
collateral is forfeited to the pawnshop. The pawnshop then sells the property to recover
the principal amount of the loan plus a profit margin.
The pawn lending business has a very long history, with informal pawnbroking
dating back to ancient times.3 Pawnbroking in America can be traced back to Colonial
times. By the early nineteenth century, pawnbrokers were active in New York City,
Philadelphia, and Boston; by the end of the century they were found in most urban areas
throughout the country. Pawnbroking went through a period of decline from about 1930
through the mid-1970s, followed by a period of rapid growth that lasted through the mid-
1990s.
Over the past decade, the number of pawnshops operating in the U.S. has
experienced a modest decline, which may be attributable to the rapid growth of payday
lending during this period. As of 2007, the number of pawnshops in the U.S. was
estimated to be between 10,000 and 15,000. Most of these shops were owned by small,
independent operators, each of whom owned between one and three locations. At the end
of 2007, Cash America International, Inc., the largest provider of pawn loans in the U.S.,
operated 499 pawnshops in 22 states, and the three largest publicly traded firms in the
pawn lending business (Cash America, EZPAWN, and First Cash Financial Services) 3 The information in this paragraph is derived from Caskey (1994 and 2003).
6
together operated a total of approximately 900 stores.4 All three of these companies
diversified into the payday lending business between 1998 and 2000.
B. Check Cashing
Check-cashing outlets cash checks in exchange for a fee that is typically a
percentage of the face value of the check. 5,6 Most of the checks that they cash are
paychecks or government-issued checks. Fees charged for cashing these types of checks
are generally between 1.5 and 3.5 percent of the face value of the check. Some check
cashers also cash personal checks; however, the fees charged for this service are usually
much higher to compensate for the greater risk that the check will bounce.
Check-cashing outlets first came into existence in the 1930s in Chicago and New
York City. The industry did not expand beyond the five or six largest urban areas of the
U.S. until the early 1970s. The number of check-cashing outlets grew rapidly from the
early 1980s through the mid-1990s, and more slowly in recent years. The slowdown in
growth over the past decade is at least partially attributable to a decline in demand for
check-cashing services, as the share of wage payments and government transfer payments
made by direct deposit has increased. As of 2005 there were approximately 13,000
check-cashing outlets in the U.S., most of which were owned by small, independent
4 Source: Cash America International, Inc. Form 10-K for the fiscal year ended December 31, 2007. 5 Much of the information in this paragraph and the next is derived from Caskey (1994 and 2003). 6 Note that throughout this essay the term “check-cashing outlet” is used to refer to establishments whose primary business is providing alternative financial services that include cashing checks for a fee. Other entities, among them banks, grocery stores, and liquor stores, often cash checks for a fee. Those entities are not included in any check cashing data referenced in this paper.
7
operators. The nine largest check-cashing companies accounted for about one third of
these outlets.7
C. Payday lending
A payday loan is a small, short-term, unsecured, single-payment, consumer loan.
The borrower writes a personal check to the lender, with the amount of the check equal to
the loan amount plus the finance charge. The lender agrees to hold the check for a
specified period of time (usually until the customer’s next payday) before depositing it.
The term of the loan is typically between seven and thirty days. The borrower can repay
the loan at or prior to its maturity by (i) paying the lender in cash the face value of the
check and retrieving the check from the lender, or (ii) allowing the lender to deposit the
check. If the borrower does not wish to repay the loan at maturity, the loan can often be
renewed or “rolled over” by paying the finance charge and having the lender agree to
hold the check for another specified period of time. Payday loans vary in size from $50
to $1000, with the average loan size being between $300 and $400. Finance charges,
which are subject to legal limits in many states, typically range from about $10 to $20 per
$100 borrowed. For a two-week loan, these fees translate into APRs ranging from 260 to
520 percent.
Payday loan customers are required to have a bank account and a job (or other
regular source of income). The largest payday lender in the U.S., Advance America,
reports that it does not undertake any evaluation of a customer’s creditworthiness in
7 Source: ACE Cash Express, Inc. Form 10-K for the fiscal year ended June 30, 2006. This is the most recent data that I could find on the number of check-cashing outlets. ACE Cash Express is no longer a publicly traded company and has not filed a Form 10-K since 2006.
8
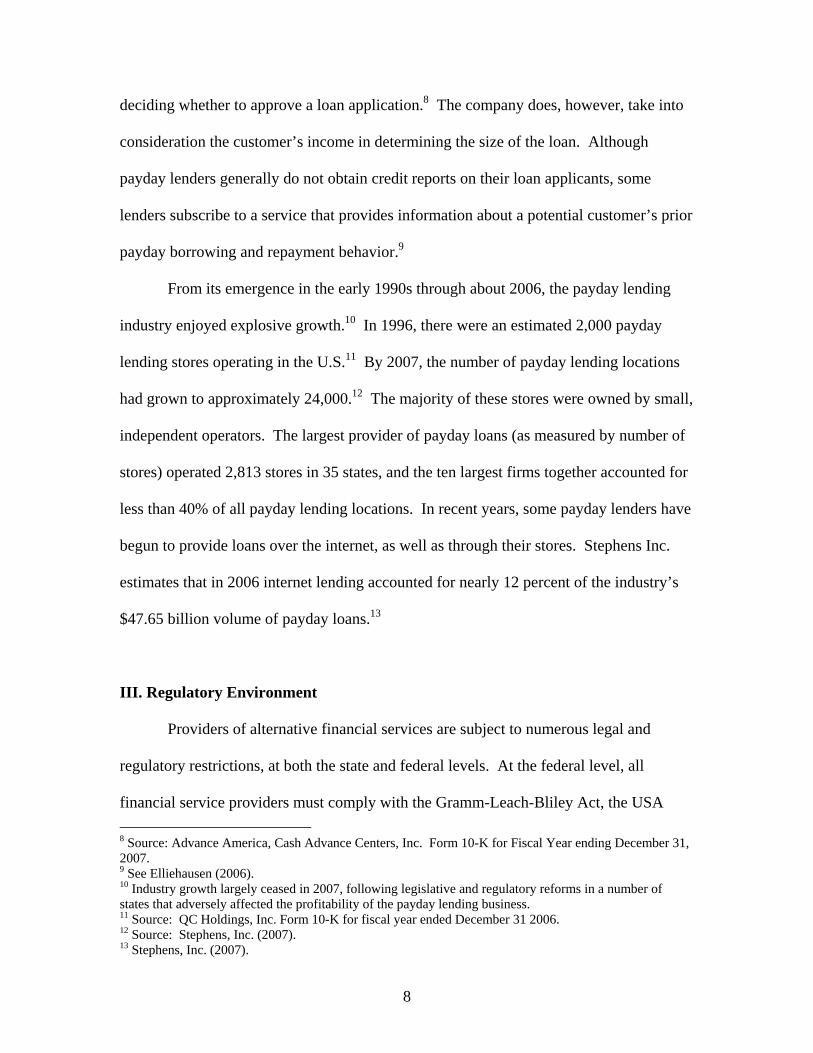
deciding whether to approve a loan application.8 The company does, however, take into
consideration the customer’s income in determining the size of the loan. Although
payday lenders generally do not obtain credit reports on their loan applicants, some
lenders subscribe to a service that provides information about a potential customer’s prior
payday borrowing and repayment behavior.9
From its emergence in the early 1990s through about 2006, the payday lending
industry enjoyed explosive growth.10 In 1996, there were an estimated 2,000 payday
lending stores operating in the U.S.11 By 2007, the number of payday lending locations
had grown to approximately 24,000.12 The majority of these stores were owned by small,
independent operators. The largest provider of payday loans (as measured by number of
stores) operated 2,813 stores in 35 states, and the ten largest firms together accounted for
less than 40% of all payday lending locations. In recent years, some payday lenders have
begun to provide loans over the internet, as well as through their stores. Stephens Inc.
estimates that in 2006 internet lending accounted for nearly 12 percent of the industry’s
$47.65 billion volume of payday loans.13
III. Regulatory Environment
Providers of alternative financial services are subject to numerous legal and
regulatory restrictions, at both the state and federal levels. At the federal level, all
financial service providers must comply with the Gramm-Leach-Bliley Act, the USA 8 Source: Advance America, Cash Advance Centers, Inc. Form 10-K for Fiscal Year ending December 31, 2007. 9 See Elliehausen (2006). 10 Industry growth largely ceased in 2007, following legislative and regulatory reforms in a number of states that adversely affected the profitability of the payday lending business. 11 Source: QC Holdings, Inc. Form 10-K for fiscal year ended December 31 2006. 12 Source: Stephens, Inc. (2007). 13 Stephens, Inc. (2007).
9
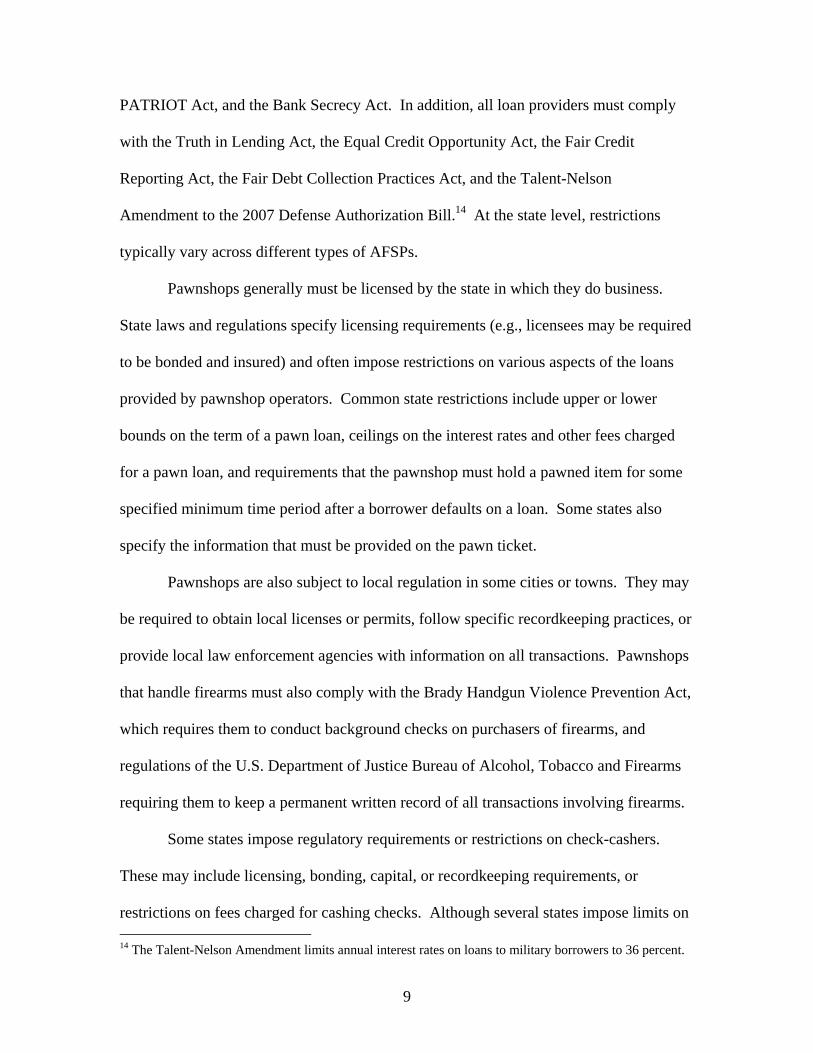
PATRIOT Act, and the Bank Secrecy Act. In addition, all loan providers must comply
with the Truth in Lending Act, the Equal Credit Opportunity Act, the Fair Credit
Reporting Act, the Fair Debt Collection Practices Act, and the Talent-Nelson
Amendment to the 2007 Defense Authorization Bill.14 At the state level, restrictions
typically vary across different types of AFSPs.
Pawnshops generally must be licensed by the state in which they do business.
State laws and regulations specify licensing requirements (e.g., licensees may be required
to be bonded and insured) and often impose restrictions on various aspects of the loans
provided by pawnshop operators. Common state restrictions include upper or lower
bounds on the term of a pawn loan, ceilings on the interest rates and other fees charged
for a pawn loan, and requirements that the pawnshop must hold a pawned item for some
specified minimum time period after a borrower defaults on a loan. Some states also
specify the information that must be provided on the pawn ticket.
Pawnshops are also subject to local regulation in some cities or towns. They may
be required to obtain local licenses or permits, follow specific recordkeeping practices, or
provide local law enforcement agencies with information on all transactions. Pawnshops
that handle firearms must also comply with the Brady Handgun Violence Prevention Act,
which requires them to conduct background checks on purchasers of firearms, and
regulations of the U.S. Department of Justice Bureau of Alcohol, Tobacco and Firearms
requiring them to keep a permanent written record of all transactions involving firearms.
Some states impose regulatory requirements or restrictions on check-cashers.
These may include licensing, bonding, capital, or recordkeeping requirements, or
restrictions on fees charged for cashing checks. Although several states impose limits on 14 The Talent-Nelson Amendment limits annual interest rates on loans to military borrowers to 36 percent.
10
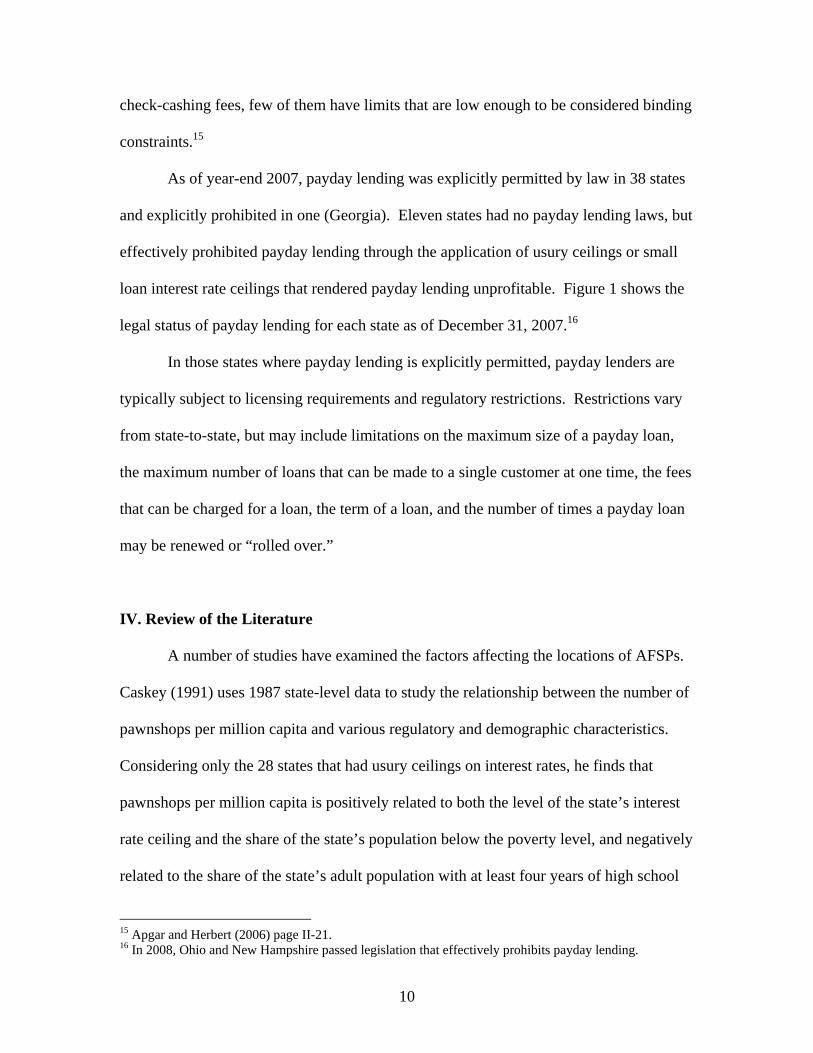
check-cashing fees, few of them have limits that are low enough to be considered binding
constraints.15
As of year-end 2007, payday lending was explicitly permitted by law in 38 states
and explicitly prohibited in one (Georgia). Eleven states had no payday lending laws, but
effectively prohibited payday lending through the application of usury ceilings or small
loan interest rate ceilings that rendered payday lending unprofitable. Figure 1 shows the
legal status of payday lending for each state as of December 31, 2007.16
In those states where payday lending is explicitly permitted, payday lenders are
typically subject to licensing requirements and regulatory restrictions. Restrictions vary
from state-to-state, but may include limitations on the maximum size of a payday loan,
the maximum number of loans that can be made to a single customer at one time, the fees
that can be charged for a loan, the term of a loan, and the number of times a payday loan
may be renewed or “rolled over.”
IV. Review of the Literature
A number of studies have examined the factors affecting the locations of AFSPs.
Caskey (1991) uses 1987 state-level data to study the relationship between the number of
pawnshops per million capita and various regulatory and demographic characteristics.
Considering only the 28 states that had usury ceilings on interest rates, he finds that
pawnshops per million capita is positively related to both the level of the state’s interest
rate ceiling and the share of the state’s population below the poverty level, and negatively
related to the share of the state’s adult population with at least four years of high school
15 Apgar and Herbert (2006) page II-21. 16 In 2008, Ohio and New Hampshire passed legislation that effectively prohibits payday lending.
11
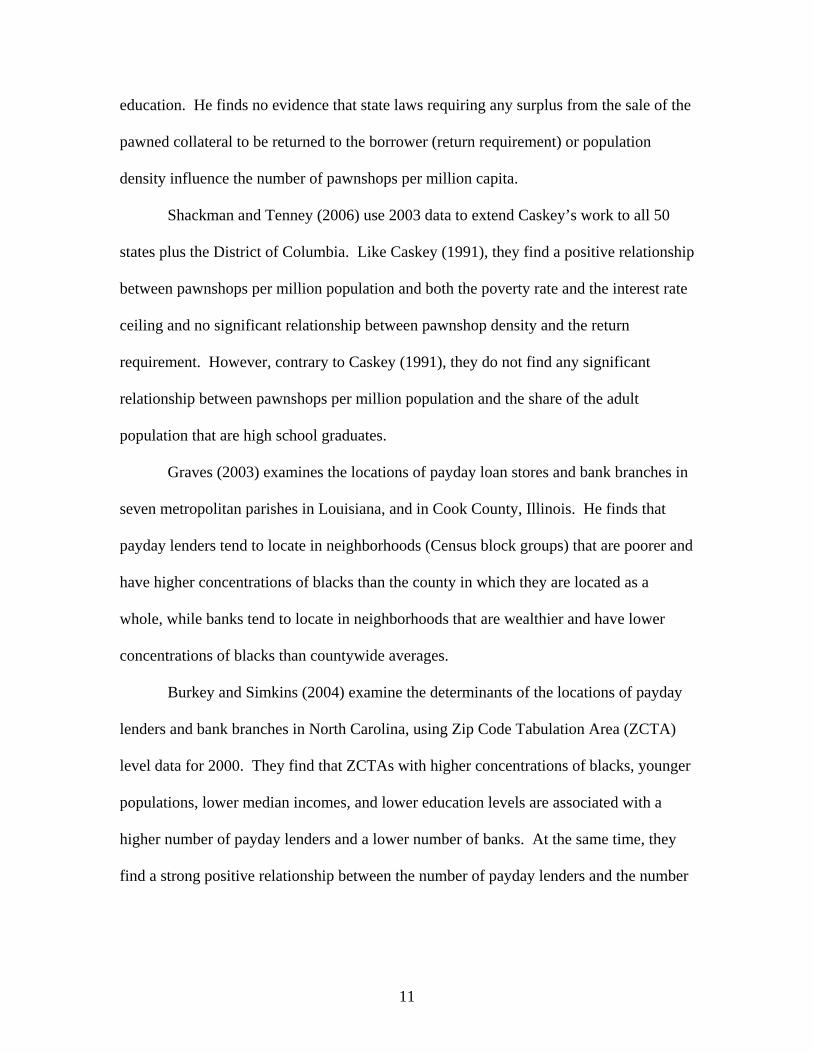
education. He finds no evidence that state laws requiring any surplus from the sale of the
pawned collateral to be returned to the borrower (return requirement) or population
density influence the number of pawnshops per million capita.
Shackman and Tenney (2006) use 2003 data to extend Caskey’s work to all 50
states plus the District of Columbia. Like Caskey (1991), they find a positive relationship
between pawnshops per million population and both the poverty rate and the interest rate
ceiling and no significant relationship between pawnshop density and the return
requirement. However, contrary to Caskey (1991), they do not find any significant
relationship between pawnshops per million population and the share of the adult
population that are high school graduates.
Graves (2003) examines the locations of payday loan stores and bank branches in
seven metropolitan parishes in Louisiana, and in Cook County, Illinois. He finds that
payday lenders tend to locate in neighborhoods (Census block groups) that are poorer and
have higher concentrations of blacks than the county in which they are located as a
whole, while banks tend to locate in neighborhoods that are wealthier and have lower
concentrations of blacks than countywide averages.
Burkey and Simkins (2004) examine the determinants of the locations of payday
lenders and bank branches in North Carolina, using Zip Code Tabulation Area (ZCTA)
level data for 2000. They find that ZCTAs with higher concentrations of blacks, younger
populations, lower median incomes, and lower education levels are associated with a
higher number of payday lenders and a lower number of banks. At the same time, they
find a strong positive relationship between the number of payday lenders and the number
12
of traditional banks in a ZCTA. This likely reflects the fact that ZCTA population is a
strong determinant of the locations of both payday lenders and banks.
Damar (2009) uses ZCTA-level data to look at the determinants of the locations
of new payday lending offices in Oregon in 2002-2004. He finds that payday lenders are
more likely to locate in areas that have more bank branches, larger populations, and
higher percentages of Hispanics. Unlike Graves (2003) and Burkey and Simkins (2004),
he does not find evidence that payday lenders are more likely to locate in areas with
higher concentrations of blacks.
Temkin and Sawyer (2004) use census tract-level data to investigate the locations
of payday lenders, check cashers and pawnshops in seven metropolitan counties
distributed across the country and in Washington, DC.17 They find that AFSPs are
disproportionately located in minority and low-income neighborhoods, while banks are
disproportionately located in non-Hispanic white and higher-income neighborhoods. At
the same time, they find that the majority of AFSPs are located in neighborhoods that are
also served by banks.
Apgar and Herbert (2004) examine factors that explain the locations of AFSPs
and bank branches in Dallas, Texas in 2003. They find that check cashers, pawnshops
and payday lenders are most likely to be found in census tracts with median incomes
between $23,000 and $45,000 and in tracts where a large fraction of the population is
Hispanic or of mixed race; however, they find that citizenship is a stronger predictor of
AFSP presence than race or ethnicity. They find that banks are least likely to locate in
census tracts where a high fraction of the population is black or Hispanic and most likely
17 The seven metropolitan counties are associated with the following cities: Chicago, IL; Atlanta, GA; Houston, TX; Kansas City, MO; Los Angeles, CA; Miami, FL; and Memphis, TN.
13
to locate in tracts with median incomes between $45,000 and $63,000. They also find a
positive relationship between the presence of bank branches and the presence of AFSPs.
Fellowes and Mabanta (2007) analyze data that they collected over the 2006-2007
time period containing the street addresses of approximately 108,000 bank and credit
union branches and 48,000 check cashers, payday lenders, and pawnshops throughout the
U.S. They find that more than 90 percent of AFSPs are located within one mile of a bank
or credit union branch, and that there are more bank and credit union branches per capita
in low-income neighborhoods than in high-income neighborhoods. Based on these
findings, they suggest that low- and moderate-income households could accumulate
considerable wealth by substituting lower-cost bank and credit union products for higher-
priced products obtained from AFSPs.
V. The Geographic Distribution of Financial Service Providers in 2006
I begin my analysis by examining the locations of payday lenders, pawn shops,
check cashers, and bank and thrift branches throughout the U.S., as of 2006. Fellowes
and Mabanta generously provided data on the number of payday lenders, pawnshops and
check cashers operating in each county. Data on the locations of bank and thrift branches
were obtained from the FDIC’s Summary of Deposits and the Office of Thrift
Supervision’s Branch Office Survey.
As of 2006, almost every county in the U.S. (98.9 percent of rural counties and
99.6 percent of urban counties) had at least one bank or thrift branch, and about two-
thirds of rural counties and ninety percent of urban counties had at least one alternative
financial service provider (pawnshop, check casher, or payday lender). The average rural
14
county in the U.S. had a population of about 33,000 and was served by 2.5 payday loan
stores, 1.2 pawnshops, 1.7 check-cashing outlets, and 10.7 bank and thrift branches. The
average urban county was home to about 220,000 people, 16.6 payday loan stores, 7.4
pawnshops, 21.2 check cashers, and 67.5 bank and thrift branches.
The geographic distributions of the numbers of payday lending stores, pawnshops,
and check-cashing outlets per million capita, at the county level, are shown in figures 2
through 4, respectively. The highest concentrations of payday lending stores on a per
capita basis are in those southern states that do not explicitly or effectively prohibit
payday lending – Alabama, South Carolina, Tennessee, Mississippi and Louisiana. The
number of pawnshops per capita is also relatively high in the south, particularly Georgia,
Alabama, Mississippi and Tennessee. The number of check-cashing outlets per capita
shows a somewhat different pattern, being highest in California, Delaware, Mississippi
and North Carolina.
The geographic distribution of the number of bank and thrift branches per million
capita, shown in figure 5, exhibits a very different pattern, being highest in the north
central part of the country, especially Kansas, Nebraska and North Dakota. Although
these maps might suggest a negative correlation between the number of bank branches
per capita and the number of each type of alternative financial service provider per capita,
the correlations are not significantly different from zero for check cashers and
pawnshops, and significantly positive for payday lending stores.18
18 The Pearson Correlation Coefficient between the number of bank branches per capita and the number of check-cashers per capita is 0.001, and that between the number of bank branches per capita and the number of pawnshops per capita is 0.008; both of these are statistically insignificant. The remaining correlations among different types of financial service providers per capita are all positive and significant at the 0.0001 level, with the following magnitudes: 0.37 between check-cashers and pawnshops, 0.57 between check-cashers and payday lenders, 0.40 between pawnshops and payday lenders, and 0.12 between banks and payday lenders.
15
Using credit score data obtained from Equifax, figure 6 shows the share of each
county’s population with either no credit score or a credit score that would typically place
them in the subprime market. The concentration of these credit-challenged individuals is
highest in some of the same states that have high concentrations of AFSPs, notably
Georgia, South Carolina and Mississippi. This suggests that AFSPs may tend to locate in
areas where demand for their services is likely to be high because a significant portion of
the population does not have access to more traditional sources of credit.
VI. Determinants of the Locations of AFSPs
In order to better understand the factors influencing the location decisions of
AFSPs, I model the number of AFSP outlets per million population in each county as a
function of various demographic characteristics of the county’s population (racial/ethnic
mix, age, education, poverty status, population density), measures of the population’s
creditworthiness, and variables reflecting the state regulatory environment.19 The
following reduced form equation is estimated separately for each type of alternative
financial service provider (payday lenders, pawnshops and check cashers), for both urban
and rural counties, using OLS:
Equation 1
0 1 2 3 4 5
6 7 8 9
10 11 12
i i i i i i
i i i i
i i i i
AFSP HISPANIC BLACK ASIAN YOUNG HSDIPLOMAPOVERTY NOSCORE LOWSCORE MEDSCOREPOPDENS CEILING NOPAYDAY
β β β β β ββ β β ββ β β ε
= + + + + ++ + + ++ + + +
19 The demographic data were obtained from the Census Bureau; the creditworthiness measures were constructed from credit score data obtained from Equifax; and the information on state laws and regulations was gathered from various state government websites.
16
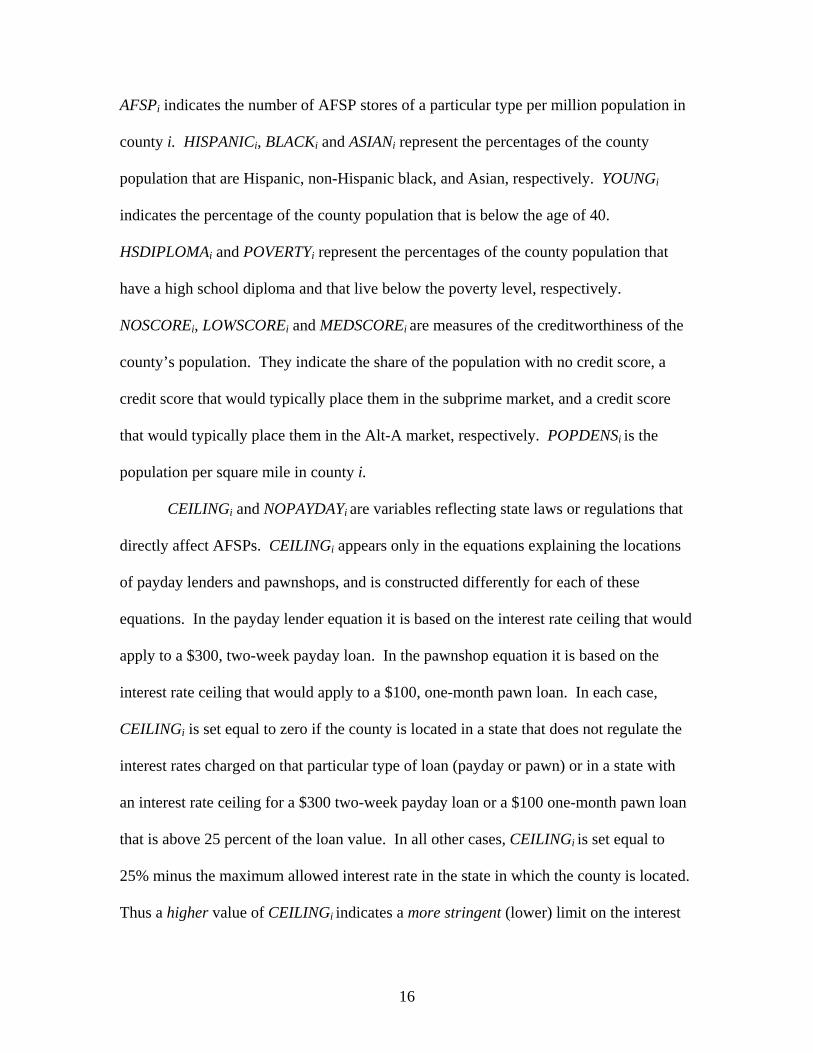
AFSPi indicates the number of AFSP stores of a particular type per million population in
county i. HISPANICi, BLACKi and ASIANi represent the percentages of the county
population that are Hispanic, non-Hispanic black, and Asian, respectively. YOUNGi
indicates the percentage of the county population that is below the age of 40.
HSDIPLOMAi and POVERTYi represent the percentages of the county population that
have a high school diploma and that live below the poverty level, respectively.
NOSCOREi, LOWSCOREi and MEDSCOREi are measures of the creditworthiness of the
county’s population. They indicate the share of the population with no credit score, a
credit score that would typically place them in the subprime market, and a credit score
that would typically place them in the Alt-A market, respectively. POPDENSi is the
population per square mile in county i.
CEILINGi and NOPAYDAYi are variables reflecting state laws or regulations that
directly affect AFSPs. CEILINGi appears only in the equations explaining the locations
of payday lenders and pawnshops, and is constructed differently for each of these
equations. In the payday lender equation it is based on the interest rate ceiling that would
apply to a $300, two-week payday loan. In the pawnshop equation it is based on the
interest rate ceiling that would apply to a $100, one-month pawn loan. In each case,
CEILINGi is set equal to zero if the county is located in a state that does not regulate the
interest rates charged on that particular type of loan (payday or pawn) or in a state with
an interest rate ceiling for a $300 two-week payday loan or a $100 one-month pawn loan
that is above 25 percent of the loan value. In all other cases, CEILINGi is set equal to
25% minus the maximum allowed interest rate in the state in which the county is located.
Thus a higher value of CEILINGi indicates a more stringent (lower) limit on the interest
17
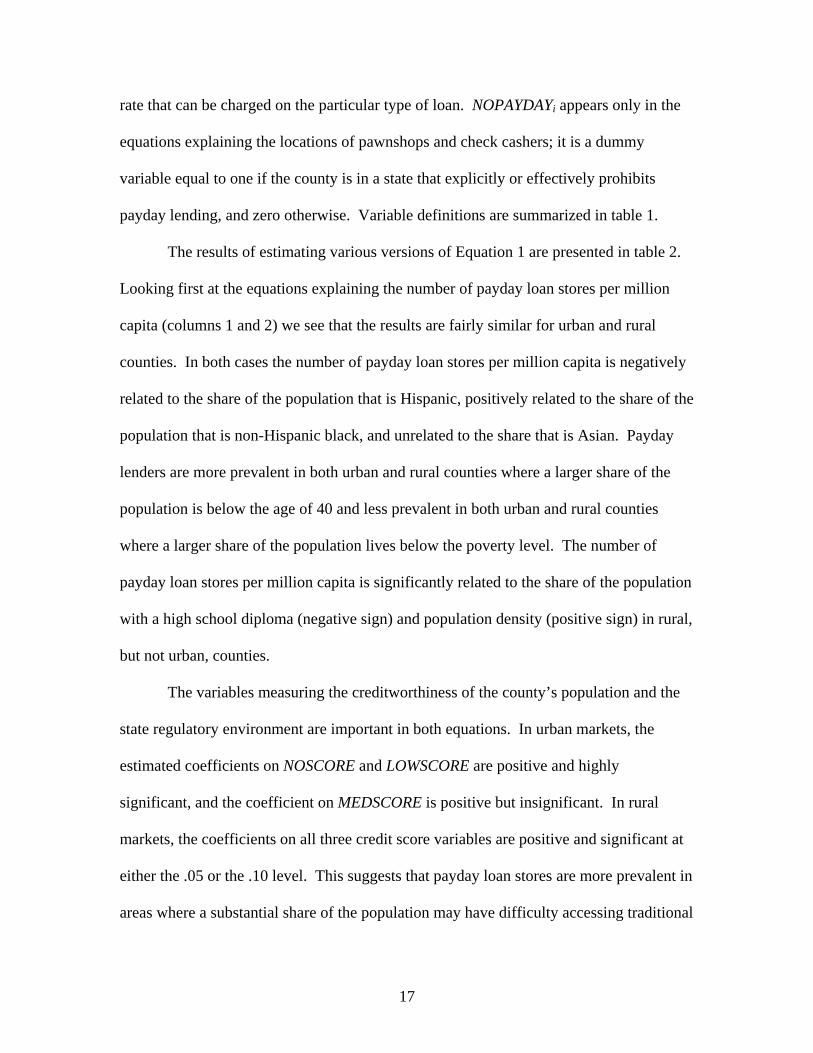
rate that can be charged on the particular type of loan. NOPAYDAYi appears only in the
equations explaining the locations of pawnshops and check cashers; it is a dummy
variable equal to one if the county is in a state that explicitly or effectively prohibits
payday lending, and zero otherwise. Variable definitions are summarized in table 1.
The results of estimating various versions of Equation 1 are presented in table 2.
Looking first at the equations explaining the number of payday loan stores per million
capita (columns 1 and 2) we see that the results are fairly similar for urban and rural
counties. In both cases the number of payday loan stores per million capita is negatively
related to the share of the population that is Hispanic, positively related to the share of the
population that is non-Hispanic black, and unrelated to the share that is Asian. Payday
lenders are more prevalent in both urban and rural counties where a larger share of the
population is below the age of 40 and less prevalent in both urban and rural counties
where a larger share of the population lives below the poverty level. The number of
payday loan stores per million capita is significantly related to the share of the population
with a high school diploma (negative sign) and population density (positive sign) in rural,
but not urban, counties.
The variables measuring the creditworthiness of the county’s population and the
state regulatory environment are important in both equations. In urban markets, the
estimated coefficients on NOSCORE and LOWSCORE are positive and highly
significant, and the coefficient on MEDSCORE is positive but insignificant. In rural
markets, the coefficients on all three credit score variables are positive and significant at
either the .05 or the .10 level. This suggests that payday loan stores are more prevalent in
areas where a substantial share of the population may have difficulty accessing traditional
18
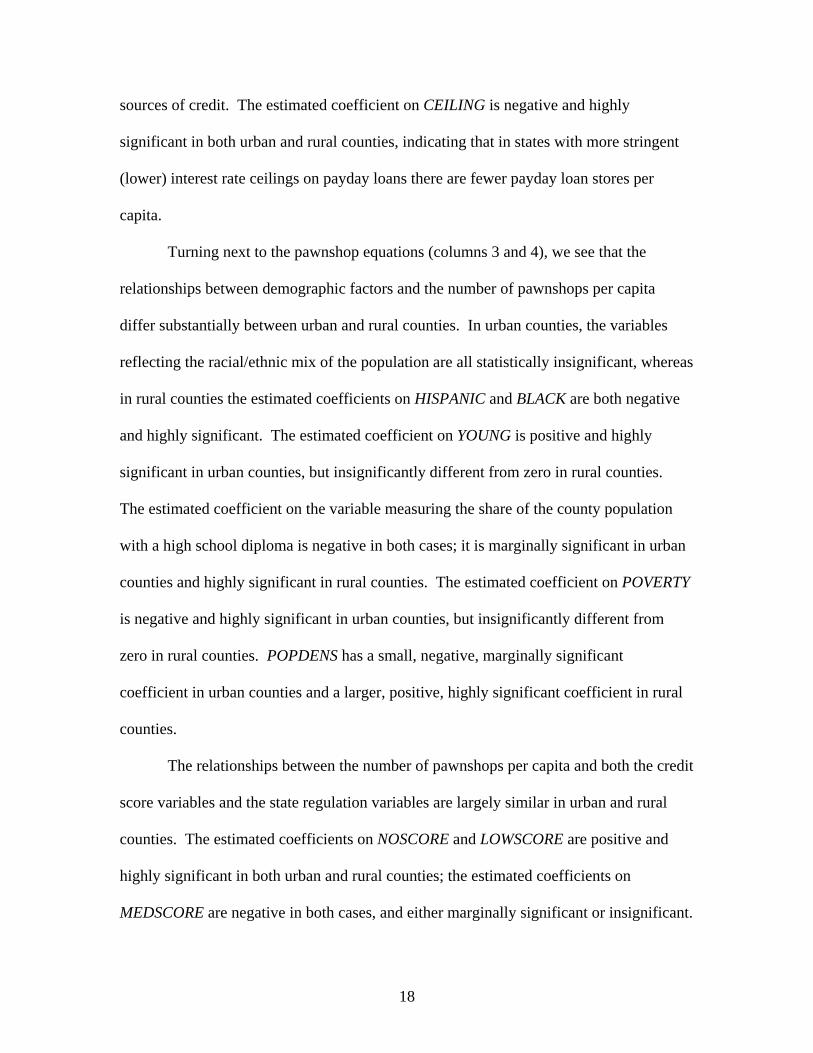
sources of credit. The estimated coefficient on CEILING is negative and highly
significant in both urban and rural counties, indicating that in states with more stringent
(lower) interest rate ceilings on payday loans there are fewer payday loan stores per
capita.
Turning next to the pawnshop equations (columns 3 and 4), we see that the
relationships between demographic factors and the number of pawnshops per capita
differ substantially between urban and rural counties. In urban counties, the variables
reflecting the racial/ethnic mix of the population are all statistically insignificant, whereas
in rural counties the estimated coefficients on HISPANIC and BLACK are both negative
and highly significant. The estimated coefficient on YOUNG is positive and highly
significant in urban counties, but insignificantly different from zero in rural counties.
The estimated coefficient on the variable measuring the share of the county population
with a high school diploma is negative in both cases; it is marginally significant in urban
counties and highly significant in rural counties. The estimated coefficient on POVERTY
is negative and highly significant in urban counties, but insignificantly different from
zero in rural counties. POPDENS has a small, negative, marginally significant
coefficient in urban counties and a larger, positive, highly significant coefficient in rural
counties.
The relationships between the number of pawnshops per capita and both the credit
score variables and the state regulation variables are largely similar in urban and rural
counties. The estimated coefficients on NOSCORE and LOWSCORE are positive and
highly significant in both urban and rural counties; the estimated coefficients on
MEDSCORE are negative in both cases, and either marginally significant or insignificant.
19
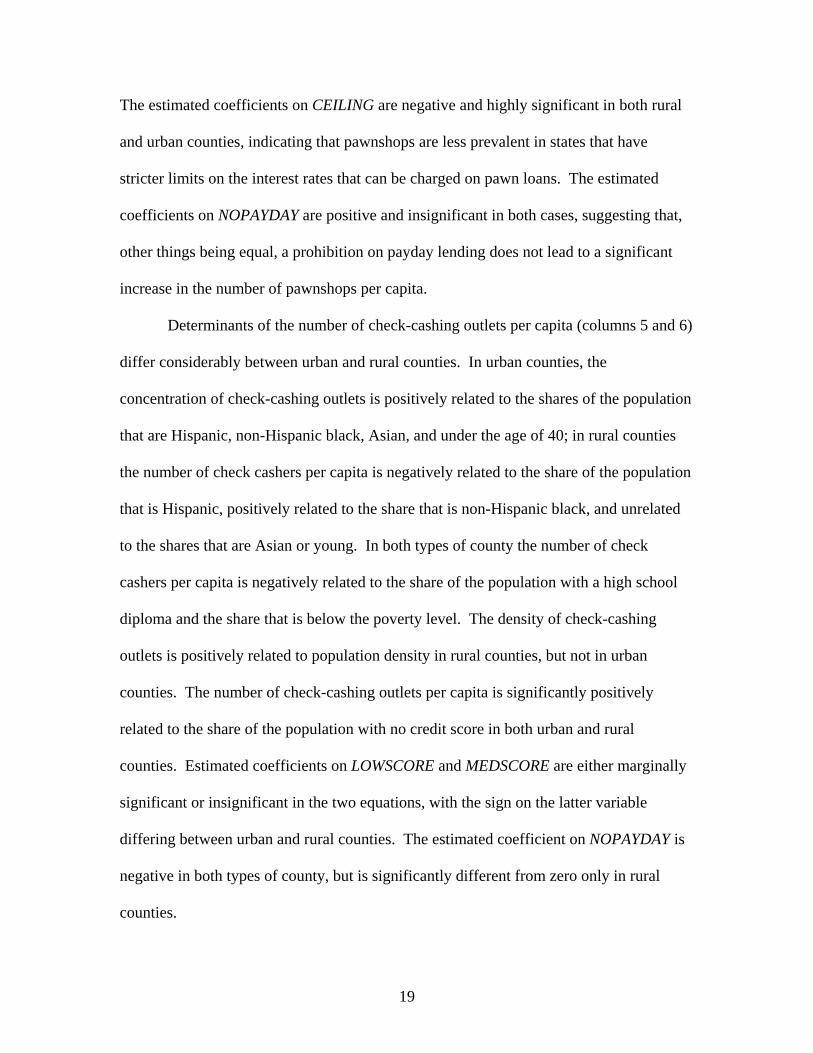
The estimated coefficients on CEILING are negative and highly significant in both rural
and urban counties, indicating that pawnshops are less prevalent in states that have
stricter limits on the interest rates that can be charged on pawn loans. The estimated
coefficients on NOPAYDAY are positive and insignificant in both cases, suggesting that,
other things being equal, a prohibition on payday lending does not lead to a significant
increase in the number of pawnshops per capita.
Determinants of the number of check-cashing outlets per capita (columns 5 and 6)
differ considerably between urban and rural counties. In urban counties, the
concentration of check-cashing outlets is positively related to the shares of the population
that are Hispanic, non-Hispanic black, Asian, and under the age of 40; in rural counties
the number of check cashers per capita is negatively related to the share of the population
that is Hispanic, positively related to the share that is non-Hispanic black, and unrelated
to the shares that are Asian or young. In both types of county the number of check
cashers per capita is negatively related to the share of the population with a high school
diploma and the share that is below the poverty level. The density of check-cashing
outlets is positively related to population density in rural counties, but not in urban
counties. The number of check-cashing outlets per capita is significantly positively
related to the share of the population with no credit score in both urban and rural
counties. Estimated coefficients on LOWSCORE and MEDSCORE are either marginally
significant or insignificant in the two equations, with the sign on the latter variable
differing between urban and rural counties. The estimated coefficient on NOPAYDAY is
negative in both types of county, but is significantly different from zero only in rural
counties.
20
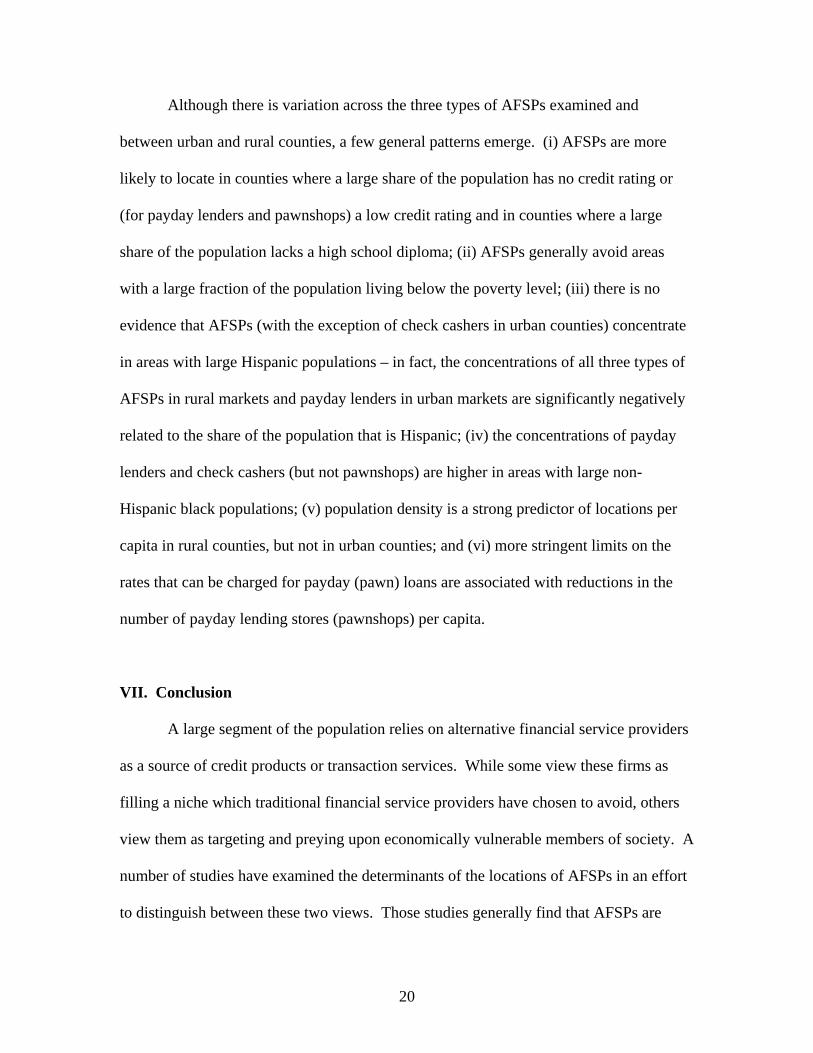
Although there is variation across the three types of AFSPs examined and
between urban and rural counties, a few general patterns emerge. (i) AFSPs are more
likely to locate in counties where a large share of the population has no credit rating or
(for payday lenders and pawnshops) a low credit rating and in counties where a large
share of the population lacks a high school diploma; (ii) AFSPs generally avoid areas
with a large fraction of the population living below the poverty level; (iii) there is no
evidence that AFSPs (with the exception of check cashers in urban counties) concentrate
in areas with large Hispanic populations – in fact, the concentrations of all three types of
AFSPs in rural markets and payday lenders in urban markets are significantly negatively
related to the share of the population that is Hispanic; (iv) the concentrations of payday
lenders and check cashers (but not pawnshops) are higher in areas with large non-
Hispanic black populations; (v) population density is a strong predictor of locations per
capita in rural counties, but not in urban counties; and (vi) more stringent limits on the
rates that can be charged for payday (pawn) loans are associated with reductions in the
number of payday lending stores (pawnshops) per capita.
VII. Conclusion
A large segment of the population relies on alternative financial service providers
as a source of credit products or transaction services. While some view these firms as
filling a niche which traditional financial service providers have chosen to avoid, others
view them as targeting and preying upon economically vulnerable members of society. A
number of studies have examined the determinants of the locations of AFSPs in an effort
to distinguish between these two views. Those studies generally find that AFSPs are
21
more likely to locate in areas where the population is disproportionately poor, minority,
and poorly educated. At the same time, a small number of studies that include a measure
of bank presence find a positive relationship between the number of bank branches and
the number of AFSP outlets.
The present study expands upon the existing literature by using a new, more
comprehensive data set to study AFSP location and by introducing some important new
variables to the analysis. The results support some of the findings from previous studies,
but contradict others. Consistent with the prior research, I find that AFSPs are more
prevalent in areas where a large percentage of the population is black or lacks a high
school diploma. However, contrary to previous studies, I find that AFSPs generally
avoid the poorest areas and areas with high concentrations of Hispanics. Credit scores
are found to be a strong predictor of AFSP concentration: counties where a larger
percentage of the population has no credit score have a greater density of all three types
of AFSPs examined, while counties where a larger percentage of the population has a
credit score that would place them in the subprime category have increased
concentrations of both payday lenders and pawnshops. This finding suggests that AFSPs
may simply locate where the demand for their services is likely to be greatest because a
significant portion of the population does not qualify for more mainstream (and less
expensive) forms of credit. However, further research is needed to more fully assess the
competing claims made by industry critics and supporters regarding the behavior of
AFSPs. Finally, state laws and regulations governing AFSPs appear to have a significant
effect on the number of AFSPs per capita. More stringent limits on the interest rates that

22
can be charged on payday loans (pawn loans) are associated with significantly fewer
payday lenders (pawnshops) per capita.
23
References
Apgar, William C., Jr. and Christopher E. Herbert. “Subprime Lending and Alternative Financial Service Providers: A Literature Review and Empirical Analysis,” Prepared for U.S. Department of Housing and Urban Development, Office of Policy Development and Research by Abt Associates, Inc., Cambridge, MA, 2004.
Burkey, Mark L. and Scott P. Simkins. “Factors Affecting the Location of Payday
Lending and Traditional Banking Services in North Carolina,” Review of Regional Studies, 34(2), 2004, pp. 191-205
Caskey, John P. Fringe Banking: Check-Cashing Outlets, Pawnshops, and the Poor,
Russell Sage Foundation, New York, 1994. Caskey, John P. “Fringe Banking a Decade Later,” unpublished manuscript, 2003. Caskey, John P. “Pawnbroking in America: The Economics of a Forgotten Credit
Market,” Journal of Money, Credit and Banking 23(1), 1991, pp. 85-99. Damar, H. Evren. “Why Do Payday Lenders Enter Local Markets? Evidence from
Oregon,” Review of Industrial Organization 34(2), 2009, pp. 173-191. Elliehausen, Gregory. “Consumers’ Use of High-Price Credit Products: Do They Know
What They Are Doing?” Networks Financial Institute At Indiana State University Working Paper 2006-WP-02, May 2006.
Fellowes, Matt and Mia Mabanta. “Banking on Wealth: America’s New Retail Banking
Infrastructure and Its Potential for Building Wealth,” Brookings Institution, unpublished mansucript, October 2007.
Graves, Steven M. “Landscapes of Predation, Landscapes of Neglect: A Location
Analysis of Payday Lenders and Banks,” The Professional Geographer, 55(3) 2003, pp. 303-317.
Shackman, Joshua D. and Glen Tenney. “The Effects of Government Regulations on the
Supply of Pawn Loans: Evidence from 51 Jurisdictions in the U.S.” Journal of Financial Services Research, 30(1), 2006, pp. 69-91.
Stephens, Inc. Payday Loan Industry Annual Industry Update, 2007. Temkin, Kenneth and Noah Sawyer. “Analysis of Alternative Financial Service
Providers,” Prepared for The Fannie Mae Foundation by the Urban Institute Metropolitan Housing and Communities Policy Center, 2004.

Table 1: Variable Definitions
HISPANIC Share of county population that is Hispanic (%) BLACK Share of county population that is non-Hispanic black (%) ASIAN Share of county population that is Asian (%) YOUNG Share of county population below the age of 40 (%) HSDIPLOMA Share of county adult population with a high school diploma (%) POVERTY Share of county population living below the poverty level (%) NOSCORE LOWSCORE MEDSCORE
Share of county population that does not have a credit score (%) Share of county population with a credit score that would typically place them in the subprime market (%) Share of county population with a credit score that would typically place them in the Alt-A market (%)
POPDENS Population per square mile in the county CEILING (Payday or Pawn)
Defined separately for payday and pawn loans. Based on interest rate ceiling applied to a $300, 2-week payday loan or a $100, 1- month pawn loan. Equal to zero if county does not regulate interest rates on payday (pawn) loans or has a rate ceiling greater than 25% of the loan value; equal to 25% minus maximum allowed interest rate if county is in a state that has a rate ceiling of 25% or less.
NOPAYDAY Dummy variable equal to 1 if county is in a state that explicitly or
effectively prohibits payday lending; zero otherwise
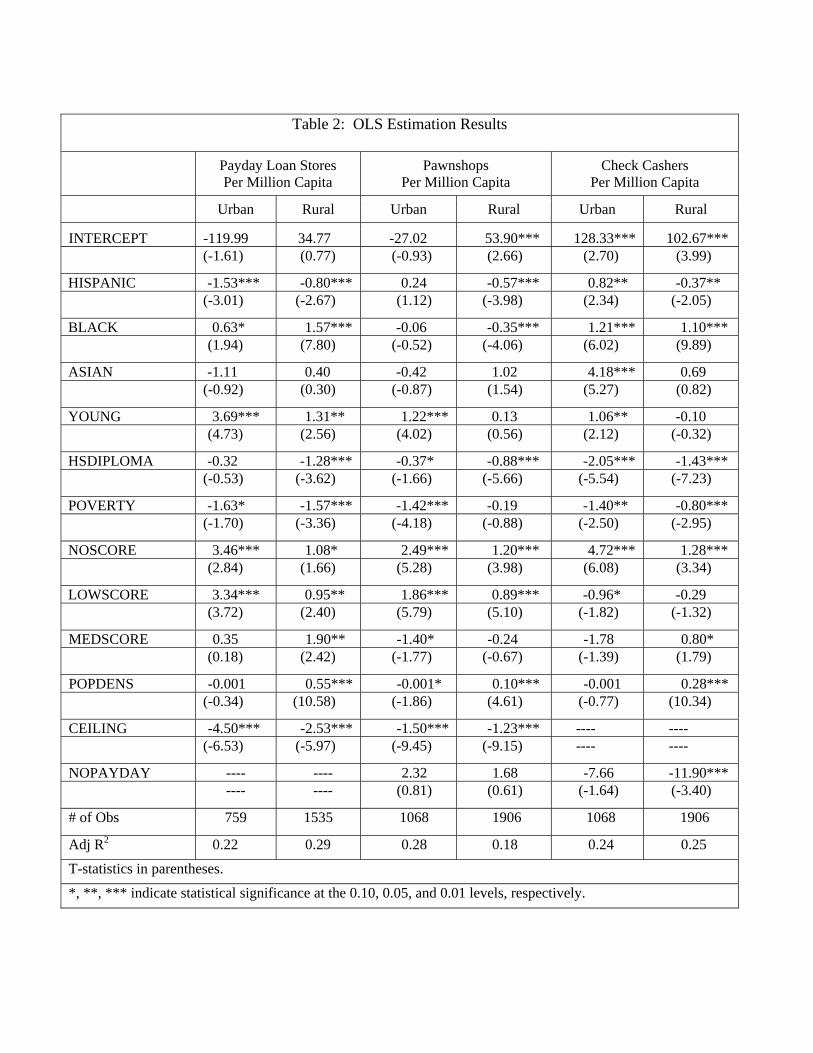
Table 2: OLS Estimation Results
Payday Loan Stores
Per Million Capita Pawnshops
Per Million Capita Check Cashers
Per Million Capita
Urban Rural Urban Rural Urban Rural
INTERCEPT -119.99 34.77 -27.02 53.90*** 128.33*** 102.67*** (-1.61) (0.77) (-0.93) (2.66) (2.70) (3.99)
HISPANIC -1.53*** -0.80*** 0.24 -0.57*** 0.82** -0.37** (-3.01) (-2.67) (1.12) (-3.98) (2.34) (-2.05)
BLACK 0.63* 1.57*** -0.06 -0.35*** 1.21*** 1.10*** (1.94) (7.80) (-0.52) (-4.06) (6.02) (9.89)
ASIAN -1.11 0.40 -0.42 1.02 4.18*** 0.69 (-0.92) (0.30) (-0.87) (1.54) (5.27) (0.82)
YOUNG 3.69*** 1.31** 1.22*** 0.13 1.06** -0.10 (4.73) (2.56) (4.02) (0.56) (2.12) (-0.32)
HSDIPLOMA -0.32 -1.28*** -0.37* -0.88*** -2.05*** -1.43*** (-0.53) (-3.62) (-1.66) (-5.66) (-5.54) (-7.23)
POVERTY -1.63* -1.57*** -1.42*** -0.19 -1.40** -0.80*** (-1.70) (-3.36) (-4.18) (-0.88) (-2.50) (-2.95)
NOSCORE 3.46*** 1.08* 2.49*** 1.20*** 4.72*** 1.28*** (2.84) (1.66) (5.28) (3.98) (6.08) (3.34)
LOWSCORE 3.34*** 0.95** 1.86*** 0.89*** -0.96* -0.29 (3.72) (2.40) (5.79) (5.10) (-1.82) (-1.32)
MEDSCORE 0.35 1.90** -1.40* -0.24 -1.78 0.80* (0.18) (2.42) (-1.77) (-0.67) (-1.39) (1.79)
POPDENS -0.001 0.55*** -0.001* 0.10*** -0.001 0.28*** (-0.34) (10.58) (-1.86) (4.61) (-0.77) (10.34)
CEILING -4.50*** -2.53*** -1.50*** -1.23*** ---- ---- (-6.53) (-5.97) (-9.45) (-9.15) ---- ----
NOPAYDAY ---- ---- 2.32 1.68 -7.66 -11.90*** ---- ---- (0.81) (0.61) (-1.64) (-3.40)
# of Obs 759 1535 1068 1906 1068 1906
Adj R2 0.22 0.29 0.28 0.18 0.24 0.25
T-statistics in parentheses.
*, **, *** indicate statistical significance at the 0.10, 0.05, and 0.01 levels, respectively.
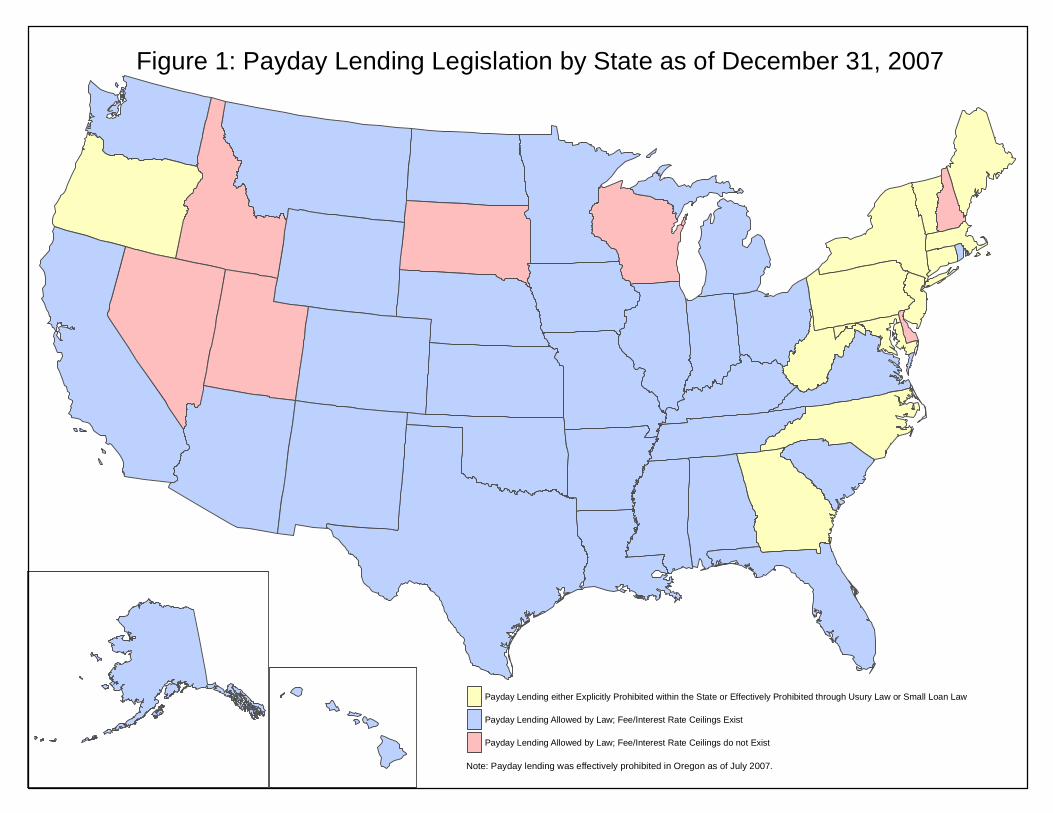
Payday Lending either Explicitly Prohibited within the State or Effectively Prohibited through Usury Law or Small Loan Law
Payday Lending Allowed by Law; Fee/Interest Rate Ceilings Exist
Payday Lending Allowed by Law; Fee/Interest Rate Ceilings do not Exist
Figure 1: Payday Lending Legislation by State as of December 31, 2007
Note: Payday lending was effectively prohibited in Oregon as of July 2007.
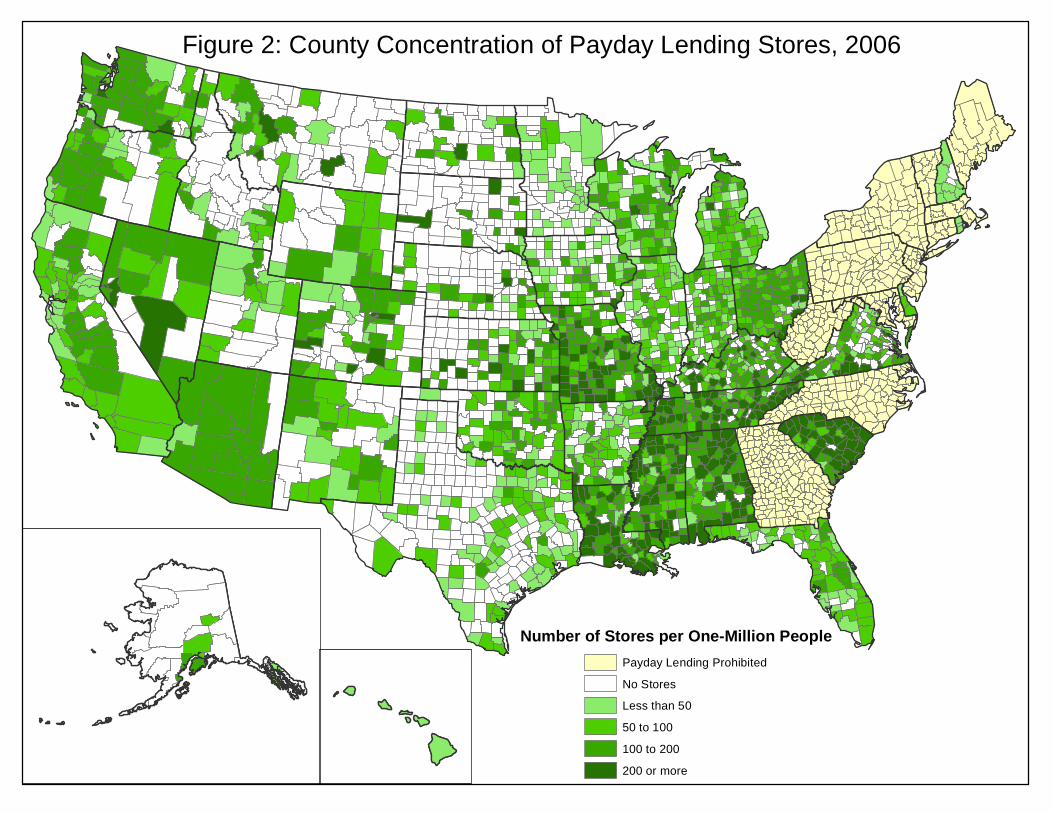
Figure 2: County Concentration of Payday Lending Stores, 2006
Number of Stores per One-Million PeoplePayday Lending ProhibitedNo StoresLess than 5050 to 100100 to 200200 or more
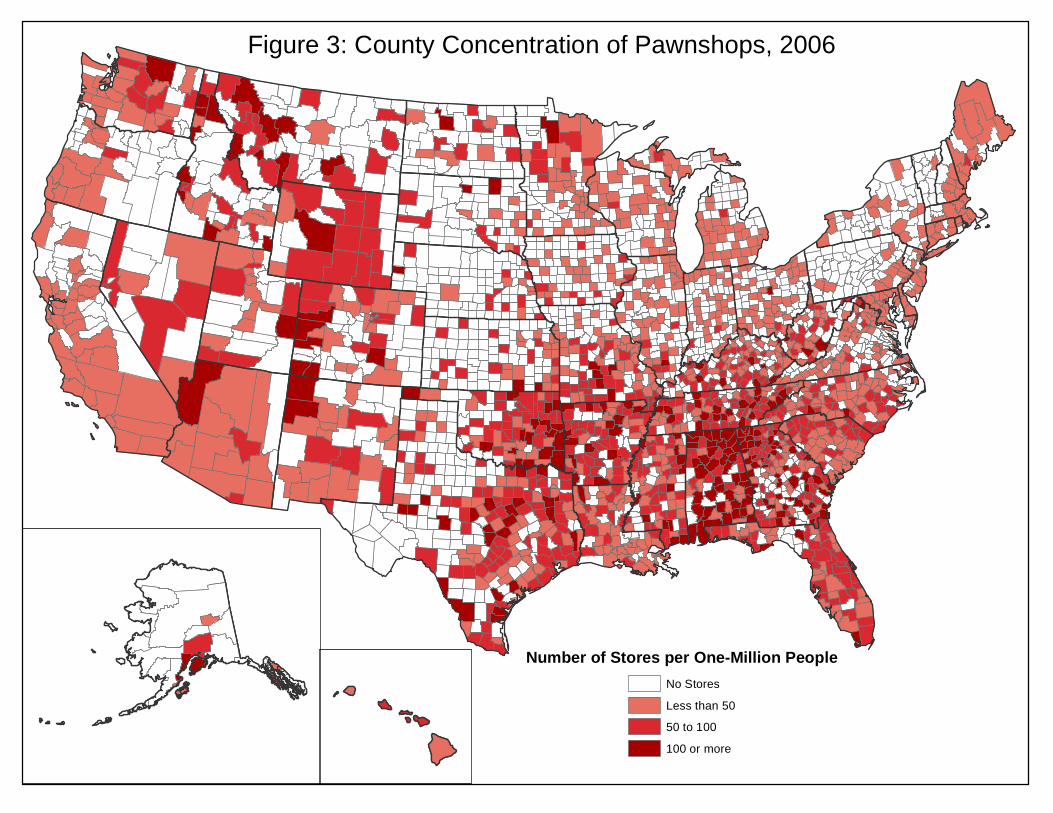
Figure 3: County Concentration of Pawnshops, 2006
Number of Stores per One-Million PeopleNo StoresLess than 5050 to 100100 or more
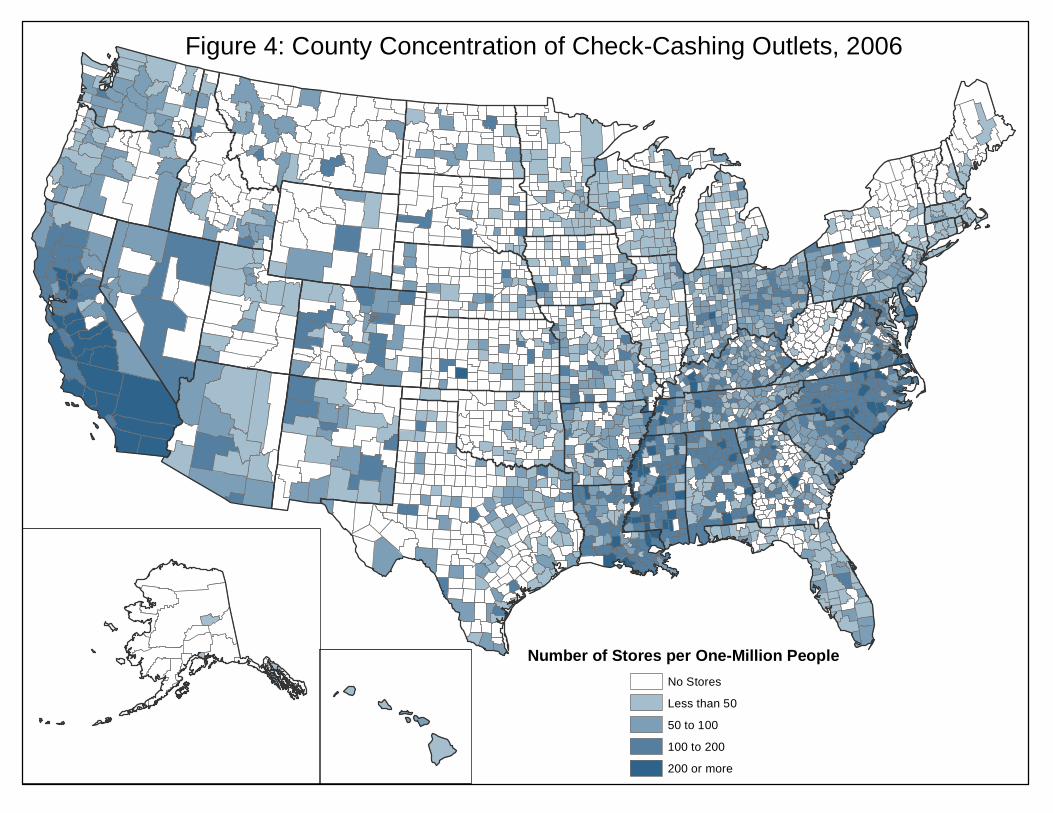
Figure 4: County Concentration of Check-Cashing Outlets, 2006
Number of Stores per One-Million PeopleNo StoresLess than 5050 to 100100 to 200200 or more
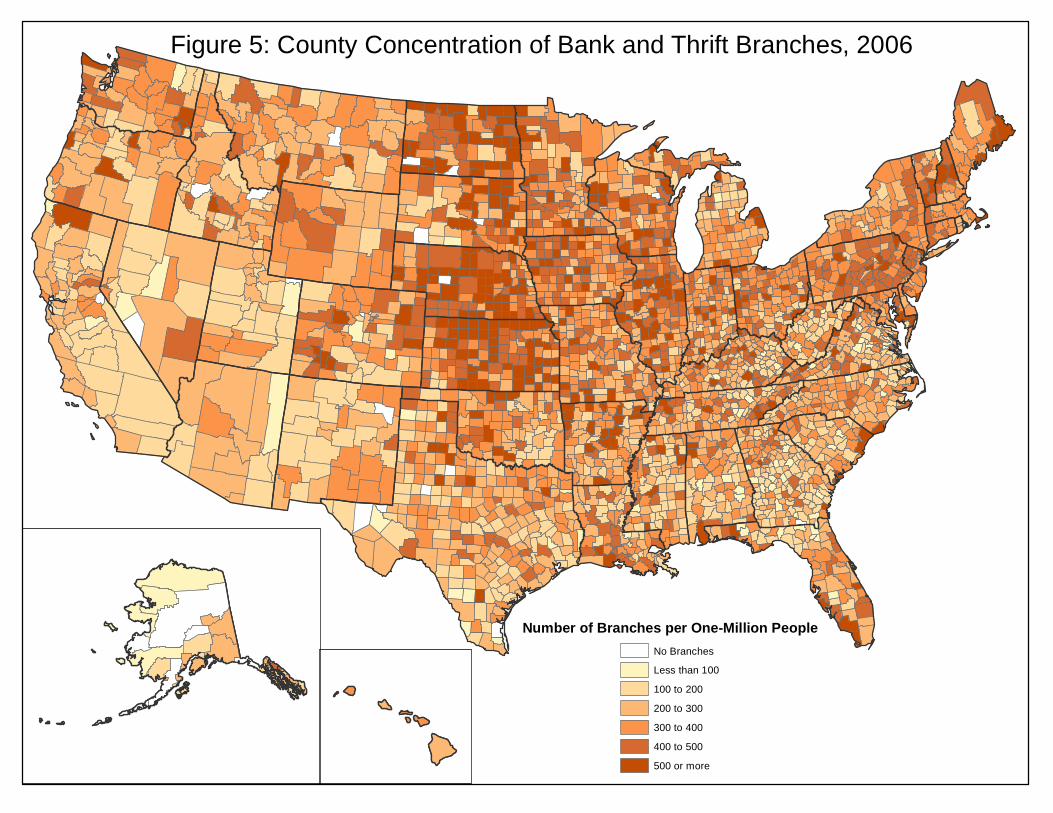
Figure 5: County Concentration of Bank and Thrift Branches, 2006
Number of Branches per One-Million PeopleNo BranchesLess than 100100 to 200200 to 300300 to 400400 to 500500 or more
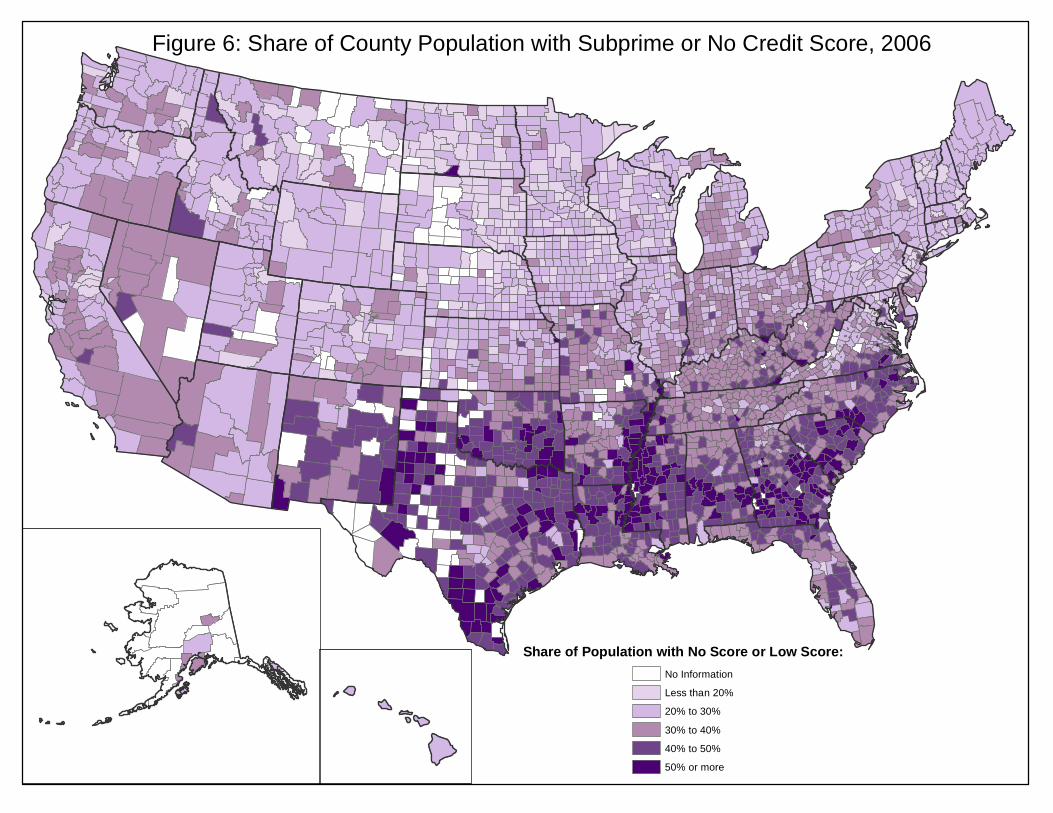
Figure 6: Share of County Population with Subprime or No Credit Score, 2006
Share of Population with No Score or Low Score:No InformationLess than 20%20% to 30%30% to 40%40% to 50%50% or more
Recommended