Determining correlates of Human-elephant conflict reports within
fringe villages of Kaziranga National Park, Assam
Martina M. I. Di Fonzo
30 August 2007
A thesis submitted in partial fulfilment of the requirements for the degree of Masters of
Research of the University of London and the Diploma of Imperial College

Determining correlates of Human-elephant conflict reports within fringe villages of
Kaziranga National Park, Assam
ABSTRACT
Human-elephant conflict (HEC) is a key example of the growing competition
between people and wildlife for space and resources throughout Africa and Asia. This
study explores the correlates of reported HEC incidents within 20 villages between 0 and
10 km from the boundary of Kaziranga National Park, Assam. I find a highly significant
negative association between proportions of forest cover and reported houses damaged,
based upon which I recommend Joint Forest Management as an alternative income
generation activity. Furthermore, my analyses show that mitigation techniques are mainly
used out of tradition rather than effectiveness, indicating that there is much scope for
trying further low-cost, active deterrence methods. My study also shows that HEC does
not lessen with increasing distance from the park boundary, indicating that additional
research must be carried out on a larger spatial scale to encompass the elephant’s entire
range. I detect intense respect towards elephants by local people, which is of
considerable importance to their conservation. Overall, although HEC is a definite issue
within this region, I conclude that is not as high as in other areas of Assam.
INTRODUCTION
As the human population encroaches upon natural habitat, animals find
themselves increasingly in competition with people for space and resources (Pimm et al.
1995; Balmford et al. 2001). Large herbivores and carnivores are particularly affected by
this conflict and are either critically endangered or rapidly declining as a result of it
(Woodroffe & Gindsberg, 1998). Human-elephant conflict (HEC) is a key example of
such an interaction. It describes occurrences of elephant crop raiding, infrastructural
damage (Fig. 1) and disturbance of daily activities, which can result in injury or death of
people and elephants alike (Hoare, 2000). HEC arises in rural areas of Africa and Asia,
posing equally significant problems to local communities, elephants and wildlife
managers (Sitati et al. 2003).

Fig. 1. House damage caused by raiding elephants.
For the dwindling populations of the Asian elephant (Elephas maximus), HEC is a
progressively serious issue. Compared to 300,000 to 600,000 African elephants
(Loxodonta Africana), there are only 44,000 Asian elephants distributed across 13 nations
(India, Bangladesh, Malaysia, Sri Lanka, Bhutan, Indonesia, Laos, Nepal, Thailand,
Burma, Cambodia, China and Vietnam; Asian Nature Conservation Foundation, 2006).
Within India, an estimated 23,900 to 32,400 individuals make up a series of small
populations ranging over 200,000 km² of fragmented landscape (Kempf & Santiapillai,
2005; Asian Nature Conservation Foundation, 2006). Assam is considered a fundamental
conservation area for the Asian elephant (LahiriChoudhury, 1980; Santiapillai & Jackson,
1990; Choudhury, 1991, 1999; Bist, 2002; Talukdar et al. 2004). Specifically, it gives
refuge to approximately 20% of India’s elephant population, thus exceeding the number
of individuals found in any other South East Asian country (Talukdar & Barman, 2004;
Asian Nature Conservation Foundation, 2006). However, the elephant’s natural habitat
in Assam is rapidly diminishing because of increased land clearance for cultivation and
industrial use (Talukdar et al. 2006). Indeed, forest cover in Golaghat region has
decreased by 85% between 1977 and 2004 due to such developmental activities
(Talulkdar et al. 2007). Human encroachment has forced elephants to forage in non-
protected areas, thus augmenting the likelihood of disturbing local people (Talukdar et al.
2006). The increased opportunity for human-elephant interactions has resulted in many
elephants being killed both accidentally (i.e. by road accidents or electrocution) and
purposely (i.e. through poisoning), causing the population in Golaghat to decline from
500 individuals in 1973 to between 160 and 190 in 2006 (Talukdar et al. 2007).
To secure the survival of the Asian elephant, it is critical that we obtain a more
comprehensive understanding of their raiding patterns. So far, several definite trends in
HEC have been identified. Elephant disturbance usually takes place between dusk and
dawn and it is strongly seasonal, corresponding with crop harvesting periods (Hoare
1999, 2000; Sukumar, 2003; Osborn & Hill, 2005). Moreover, conflict is usually highest
closer to protected areas that act as elephant refuges (Naughton-Treves et al. 1998;
Hoare, 2000). Studies carried out near Manas National Park (MNP) and in Golaghat
district of Assam confirm these tendencies (Lakhar et al. 2007; Talukdar et al. 2007).
Elephant raiding was found to peak during specific times of year when rice paddy (Oryza
sativa) becomes more palatable and nourishing as it approaches harvesting (Sukumar,
1990). Specifically, this takes place between June and August (for aahu paddy) and
October to November (for xali paddy) (Lakhar et al. 2007). The difference between these
local rice types is that xali is cultivated in shallow-water, while aahu requires deeper
water levels (J. Boruah, Aaranyak, pers. comm.). The distance at which villages were
located from the park also influenced HEC intensity, with decreasing conflict incidents as
the distance from the forest boundary increases (Lakhar et al. 2007). Based on this
information it could be possible to predict the seasons and areas of high intensity elephant
disturbance.
HEC is a complex problem, which cannot be mitigated through reliance on a
single mitigation technique (Sitati & Walpole, 2006). Each field site requires specific
deterrence strategies. Moreover, an extensive range of mitigation techniques has shown
to be more effective in driving away raiders compared to the use of only a few, as it
reduces the possibility of habituation (Hoare, 2001; Parker & Osborn, 2003). The
practices employed by farmers in Assam to deter elephants are also wide ranging. Close
to MNP, these generally consist in the use of active traditional deterrents such as
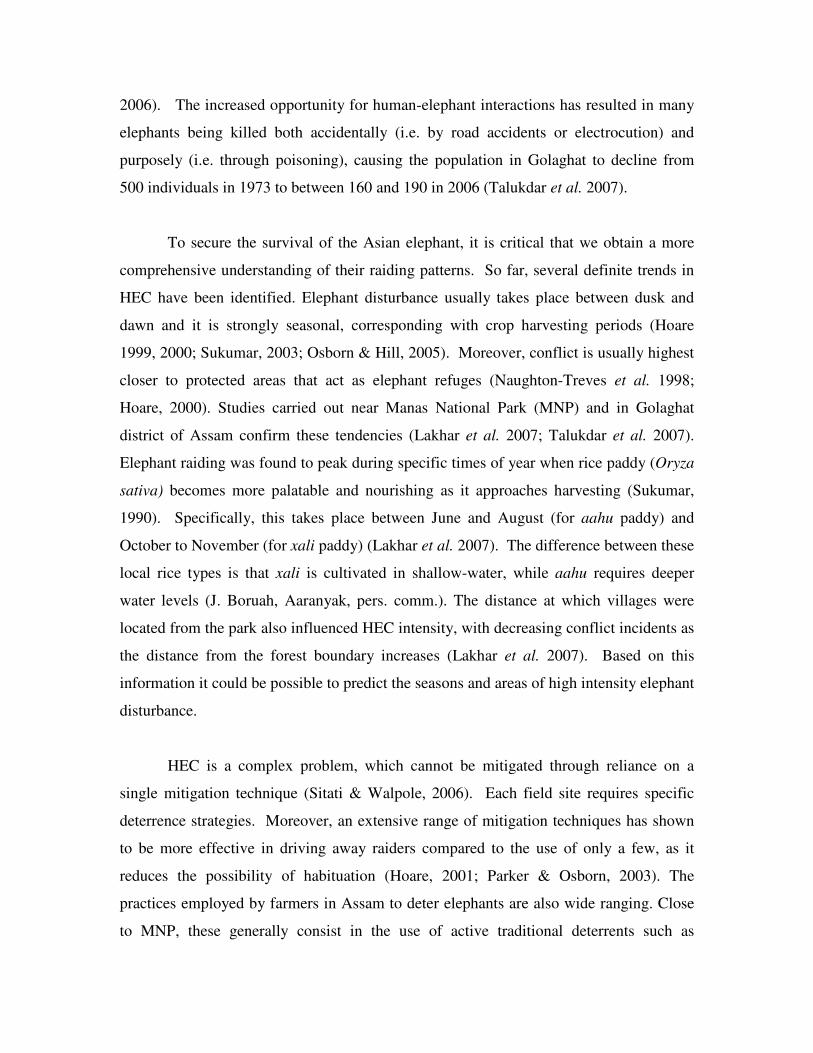
shouting, drum beating, bursting firecrackers, shining torch lights, and setting fire to raw
jute or tires fixed at the end of bamboo sticks, known as “bolem” (Fig. 1A; Lahkar et al.
2007).
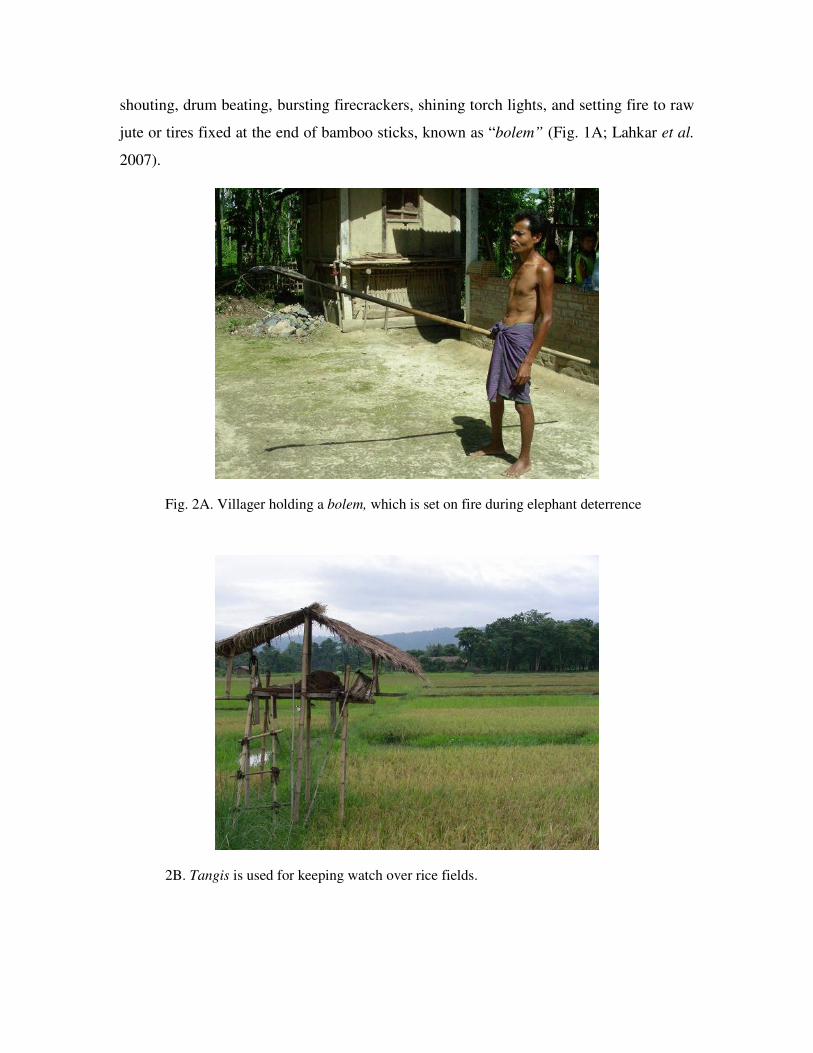
2B. Tangis is used for keeping watch over rice fields.
Fig. 2A. Villager holding a bolem, which is set on fire during elephant deterrence
Usually, farmers guard their crops on their own, however during peak raiding
season two to three neighbouring farmers form groups and construct “tangis” as look-out
points (temporary tree houses; Fig. 1B; Lahkar et al. 2007). Additionally, forest
department officials may aid in mitigating human-elephant conflict by firing shots in the
air as well as using domestic elephants to drive away crop raiders (Lahkar et al. 2007).
In areas of high conflict, certain villages near MNP have recently begun cultivating
alternative crops to those preferred by elephants, such as patchouli (Pogostemon cablin),
jetrofa (Jetrofa curcas) and Citrus spp. (Lahkar et al. 2007).
The cost of conserving large animals, like elephants, is often born excessively by
farmers living closest to wildlife (Nyhus et al. 2005). Recognition of this imbalance has
led to the idea of compensation schemes, which in addition to spreading the economic
loss should also increase lenience towards wildlife and support for conservation amongst
local people (Nyhus et al. 2005). Although theoretically attractive, there is little empirical
evidence supporting the success of such programmes (Nyhus et al. 2005). The
compensation system for elephant damage in Assam is generally regarded by farmers as
unsatisfactory due to its “lengthy and faulty procedure” (Lahkar et al. 2007). At present,
the budget provided from Government Central Assistance is “too meagre” to cover
cultivators’ outstanding claims (M. C. Malakar, Chief Wildlife Warden, Assam, pers.
comm.). For this reason, only human deaths resulting from elephant conflict are
immediately compensated with Rs. 40,000 – approximately £500. Further claims of crop
loss, property damage and injuries are recorded with the hope of reimbursement over the
following years (M. C. Malakar, pers. comm.).
This study aims to elucidate correlates for HEC incidents across villages on the
fringes of Kaziranga National Park (KNP), Assam, by integrating GIS data on land-use
and elephant movement patterns collected by Aaranyak: A Society for Biodiversity
Conservation in North East India (NGO) with local information on crop loss and house
damage obtained through interviews. Specifically I ascertain whether variables exist to
account for discrepancies in intensity within the surveyed area. Additionally, this study
analyses local mitigation techniques as well as attitudes towards HEC with a view to

suggesting further non-lethal methods of control and possible alternate sources of
income. I use the results of my report to recommend future strategies and further
research to ameliorate HEC mitigation within this region.
STUDY AREA
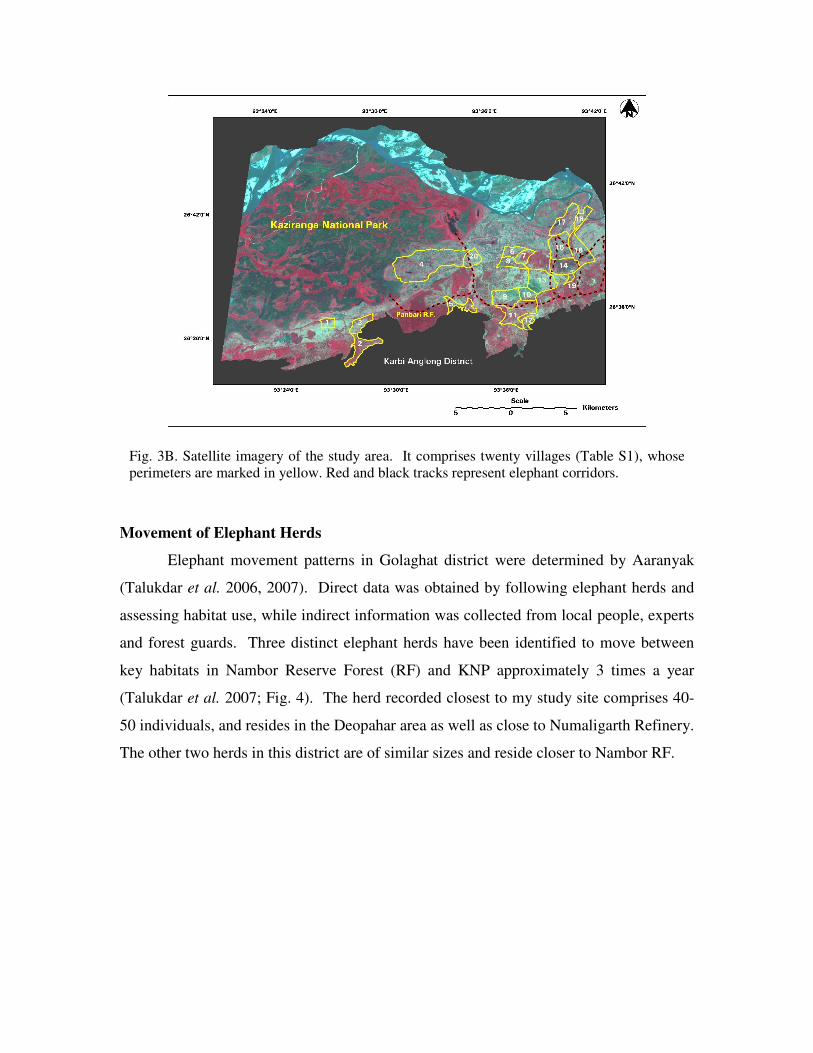
The study area comprises 20 villages in Bokakhat circle, Golaghat district, Assam
(26° 42’ – 26° 33’ N, 93° 26’ - 93° 41’ E; Fig. 3A and B). It covers 32904 ha of which
83.3% is cultivated land and 4.1% forest cover (Agricultural Department, Bokakhat
subdivision, 2006). 45.8% of this area is flood prone, while 4.9% is affected by drought
(Agricultural Department, Bokakhat subdivision, 2006). Average rainfall within
Golaghat district is between 2005-2300 mm and average temperature in winter season is
8°c rising up to 37 °c in summer. Relative humidity is 60-95% (Agricultural Department,
Golaghat District, 2006). Kaziranga National Park (KNP; 26° 30’ – 26° 45’ N, 93° 08’ -
93° 36’ E) is found adjacent to Bokakhat circle and is one of the principal habitats for
Asian elephants within this region (Supplementary Information I; Eastern Assam Wildlife
Division, Bokakhat, 2007).
Fig. 3A. The study area is located within Bokakhat circle, Golaghat district, Assam, India
Kaziranga National Park (KNP; 26° 30’ – 26° 45’ N, 93°
Movement of Elephant Herds
Elephant movement patterns in Golaghat district were determined by Aaranyak
(Talukdar et al. 2006, 2007). Direct data was obtained by following elephant herds and
assessing habitat use, while indirect information was collected from local people, experts
and forest guards. Three distinct elephant herds have been identified to move between
key habitats in Nambor Reserve Forest (RF) and KNP approximately 3 times a year
(Talukdar et al. 2007; Fig. 4). The herd recorded closest to my study site comprises 40-
50 individuals, and resides in the Deopahar area as well as close to Numaligarth Refinery.
The other two herds in this district are of similar sizes and reside closer to Nambor RF.
Fig. 3B. Satellite imagery of the study area. It comprises twenty villages (Table S1), whose
perimeters are marked in yellow. Red and black tracks represent elephant corridors.

METHODS
Questionnaire Survey
Information on the intensity of Human-elephant conflict (HEC) and on variables
which could be used to predict it was collected from 20 villages throughout June 2007.
In order to select my study villages, all villages in Bokhakat circle were stratified
according to aerial distance from KNP. Approximate distances were provided by a local
journalist, Mr. Uttam Saika. Specifically, four villages at 0-2km, four at 2-4 km, three at
4-6 km, five at 6-8 km and four at 8-10 km from the park were randomly sampled. I
chose to stratify by distance since previous studies on HEC showed a relationship with
Fig. 4. Major elephant corridors and habitats of central Golaghat district, Assam. Figure from
Talukdar et al. 2007. Red box indicates my study area.

distance from park boundary (Naughton-Treves et al. 1998; Hoare 2000; Lakhar et al.
2007). The latitude and longitude points for each sampled village were recorded using a
Global Position System (GPS) receiver.
To determine correlates for variation in HEC throughout Bokakhat circle, I
collected the following information from each village on: (a) agricultural practices (i.e.
crop types, harvesting periods), (b) loss to animal depredation (i.e. types of raiding
species and rankings of problem wildlife, timing of increased depredation, proportion of
crop loss and house damage), (c) mitigation techniques (i.e. order of use) and
compensation, (d) characteristics of HEC and attitudes towards it (i.e. change in HEC
over time, responsibility for controlling it, further suggestions for its mitigation,
perception of threat from elephants).
The above information was collected by semi-structured interviews with both
open-ended and structured questions (Milner-Gulland and Rowcliffe, 2007;
Supplementary Information II). This interview method was used in order to obtain both
quantitative and qualitative data on variation in HEC. When I asked informants to rank
certain responses not every response category was mentioned in each village.
Furthermore, categories could be ranked the same if so perceived. Interviews were
carried out with village leaders and their families through the help of translators. I chose
these as my key informants in order to obtain reliable information at the village-level,
thus enabling HEC to be analysed on a larger spatial scale. Before collecting data, a pilot
study was carried out with the headman of a village which not part of my sample, so as to
assess the feasibility of my questions and acquire a notion for the types of answers I
would obtain. I was able to assess how long my questionnaire would take as well as add
further questions that would be of interest.
Land-use pattern analysis
Satellite data from IRS (Indian Resource Satellite) 1D/LISS III bearing 112/53
(Path/Row) was employed to visualise the land-use patterns in Bokakhat circle. The date
of the satellite pass was 16th
March 2004. Using ERDAS Imagine v. 8.5, the satellite
image was georeferenced into the latitude/longitude coordinate system by Aaranyak
(Talukdar et al. 2006). Principal landscape element types were digitised and GPS points
for each village were superimposed. Proportion of land-use patterns were calculated for
each village using ERDAS Imagine v. 8.5.
Data analysis
Data were managed and coded with Microsoft Excel and analysed using R v.
2.4.0 (R Development Core Team, 2006). The response variables for this study were:
average proportion of crop loss per year and proportion of house damage over the last 12
months. I was unable to collect information regarding crop loss over the preceding year,
as there had been a severe drought causing low agricultural produce. Thus it would have
not been sufficiently representative. Explanatory variables are given in Table 1. I
represented my all proportion data as counts out of 100 for my statistical analyses.
Non-parametric, chi square tests were carried out to analyse differences in
response variables between villages. Spearman’s rank correlation was used to test for
associations between spatial explanatory variables. I determined significant differences
between ranked data by comparing the mean and standard error rankings for each
category. Generalised linear models (GLMs) with Poisson or quasipoisson errors were
employed for univariate analyses (Crawley, 2007). I carried out multivariate analyses to
determine whether any interactions existed between explanatory variables which could
influence either indices of HEC. My saturated models included the three terms that
explained the highest amount of variation (r²) within the univariate analyses of my
response variables. The models were simplified by deleting non-significant terms and I
checked for changes in model fit using a chi-squared goodness-of-fit test. Significance
was determined for all analyses at p=0.05.

Table 1. Explanatory variables analysed in relation to proportion of crop loss and
houses damaged.
Type Name
Spatial Distance from park boundary (km)
Spatial Length of corridor within village (km)
Spatial Village area (km²)
Spatial Proportion of cropland (km²)
Spatial Proportion of agriplantation (km²)
Spatial Proportion of forested land (km²)
Spatial Proportion of water-logged land (km²)
Village characteristics Village size (number of households)
Village characteristics Literacy level (%)
Village characteristics Dependency on agriculture (% households that are cultivators)
Village characteristics Type of rice grown
HEC characteristics Type of herd
HEC characteristics Point of origin of herd
HEC characteristics Timing of visit
HEC characteristics Frequency of visits during periods of highest intensity
HEC characteristics Were neighbours notified?
HEC characteristics Was the Forest Department called?
HEC characteristics Did the Forest Department arrive right away?
HEC characteristics Was the torchlight used first?
HEC characteristics Were tangis (lookout points) used?
HEC characteristics Was damage recorded?
HEC characteristics Did they receive compensation?
HEC characteristics Do elephants have a right to enter their cultivated land?
HEC characteristics Are elephants ranked as the most dangerous threat?
HEC characteristics Was the forest department reported to be responsible for controlling HEC?

RESULTS
Crop loss
Of the 20 villages sampled, 17 were subject to annual crop loss by wild animals
(Fig. 5). I found animal depredation was an important issue, as half reported it as their
only cause for crop loss.
Fig. 5. Causes of crop loss within the sampled villages (1=most important). The number in
brackets represents the total respondents in each category.
All respondents reported that rice paddy was the principal crop consumed by wild
animals in this region. Every village surveyed grew xali, while boro was grown in six
villages, and aahu in four. Like aahu, boro is harvested during monsoon season,
however it requires a higher water level than aahu to grow. Overall, within villages
affected by depredation, the average annual reported loss of rice paddy to animals ranged
from 5 to 75%, with a mean of 28.12 + 12.81% (n=17). Indeed, there is a significant
difference in proportion of crops loss between villages ( Χ² = 244.41, d.f. =16, p=***).
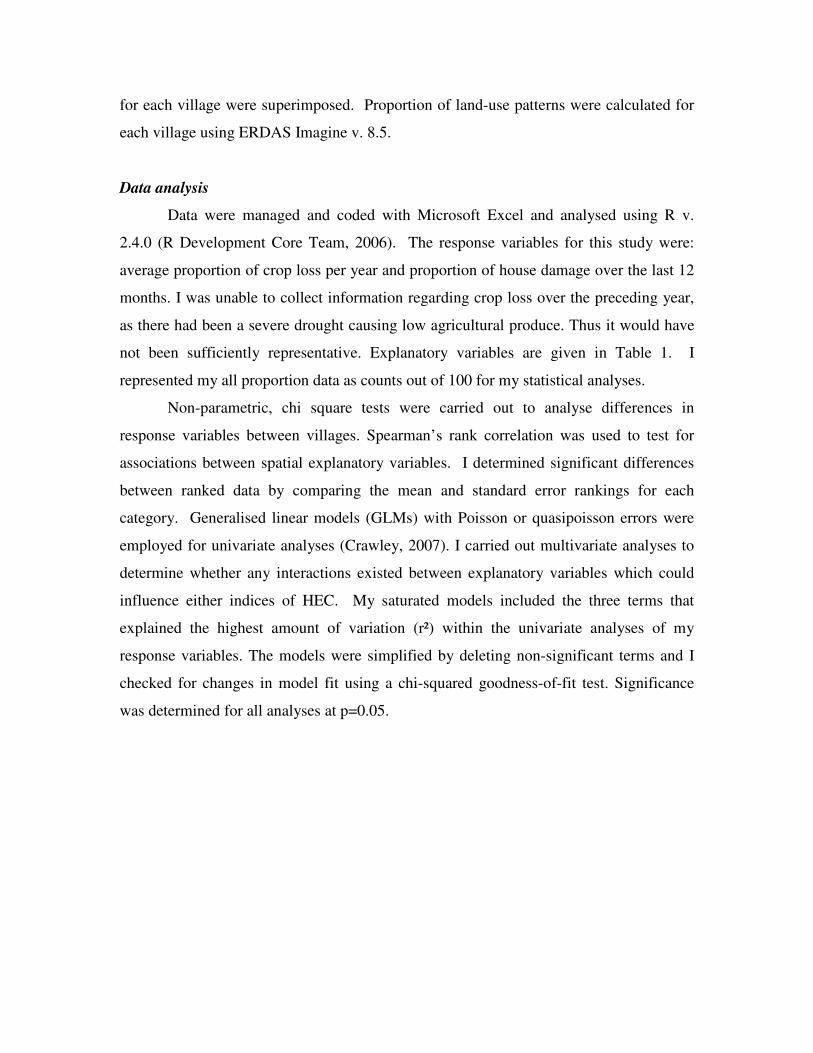
Respondents reported seven principal raiding species: Asian elephants, Asiatic
wild buffalo (Bubalus arnee), Greater one-horned rhinoceros (Rhinoceros unicornus),
Hog deer (Axis porcinus), Rhesus macaque (Macaca mulatta) and Rose-ringed parakeet
(Psittacula krameri). The number of villages in which each species were reported varied
significantly; with elephants being mentioned more often than other species (Fig. 6;
Table S1). The annual loss specifically attributed to elephants ranged from 2 to 50% with
a mean of 17.12 + 6.95 % (n=17). This differed significantly between villages (Χ² =
220.81, d.f. =16, p=***; Fig. 7). Moreover, elephant depredation explained 54.69% of the
variance between villages in total crop loss (GLM with quasipoisson errors; B= 1.03 +
1.01; t=4.20, d.f. =15, p=***).
Fig. 6. Frequency of villages in which each raiding species is reported. Stars represent significant
differences between collapsed categories (GLM with Poisson errors for interactions between reports
of depredation for each species; minimum adequate model simplified from the original in which
each species was represented separately; “**”for p<0.01 and “***” for p<0.001).
Fig. 7. Elephant crop-depredation varies in intensity within villages on the fringes of KNP
(Low= between 1-10%, Moderate=between 10-20% and High=over 20% crop loss). See Table
S2 for corresponding HEC intensity village ID.

I found that the proportion of damage reported varied amongst species (Fig. 8).
Elephants were responsible for most crop loss, followed by Wild boar, whose damage
levels are not significantly different. However, while elephants depredate at high
intensity mainly over just a few months of the year (Fig. 9; Table S3), the damage caused
by Wild boars is reported to be lower, but continuous. Periods of frequent depredation
were mostly reported to occur during the post-monsoon months of October to December,
which coincides with the harvesting of xali. The months during which aahu and boro
rice varieties are harvested (June – July) were also mentioned slightly more often as
periods of increased raiding frequency, however the frequency of reports is not
significantly different from winter and pre-monsoons months.
Fig. 8. Mean proportion of depredation caused by each species. Error bars represent the standard
error of the mean, “n” indicates the total number of respondents who mentioned the particular
category.
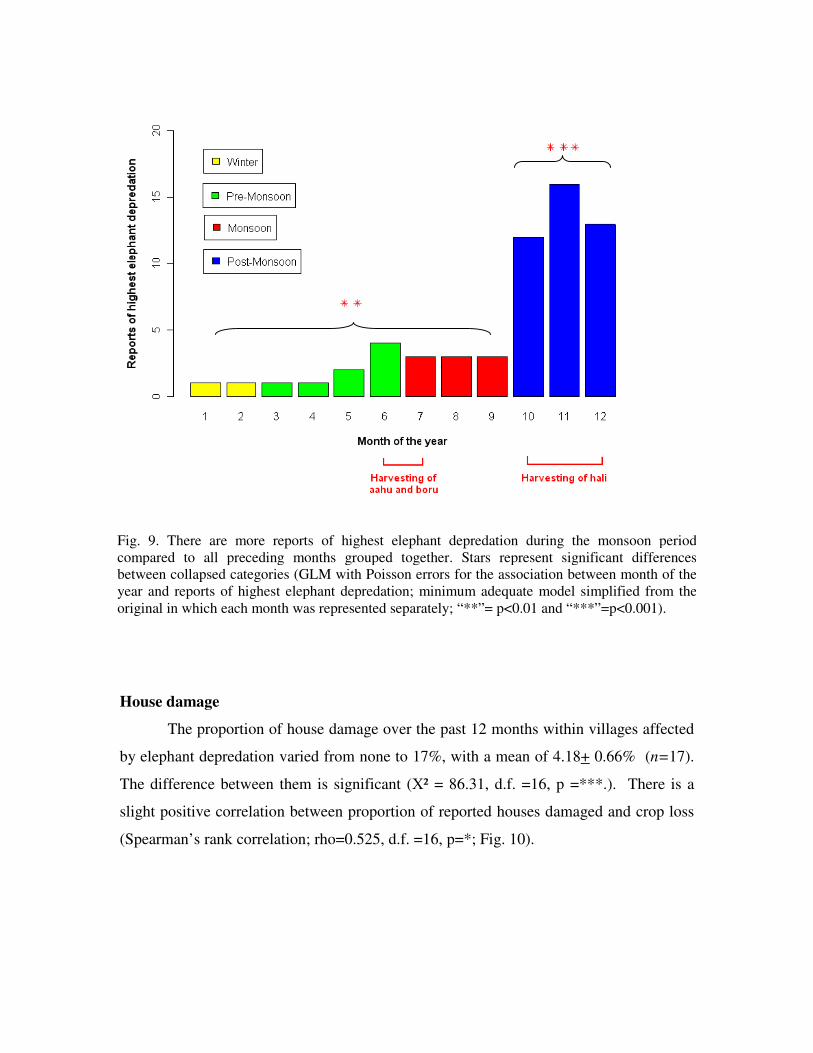
House damage
The proportion of house damage over the past 12 months within villages affected
by elephant depredation varied from none to 17%, with a mean of 4.18+ 0.66% (n=17).
The difference between them is significant (Χ² = 86.31, d.f. =16, p =***.). There is a
slight positive correlation between proportion of reported houses damaged and crop loss
(Spearman’s rank correlation; rho=0.525, d.f. =16, p=*; Fig. 10).
Fig. 9. There are more reports of highest elephant depredation during the monsoon period
compared to all preceding months grouped together. Stars represent significant differences
between collapsed categories (GLM with Poisson errors for the association between month of the
year and reports of highest elephant depredation; minimum adequate model simplified from the
original in which each month was represented separately; “**”= p<0.01 and “***”=p<0.001).
Fig. 10. There is a positive correlation between crop loss and houses damaged (GLM with
quasipoisson errors; B= 1.05 + 0.04, t=1.180, d.f.= 15, p=n.s., r²=8.02%).
Spatial correlates of HEC
Spatial variables (Table 2) for each village were analysed to determine differences
amongst villages as well as relationships between explanatory variables. I analysed
differences in land-use patterns between villages since water, shade and nutritious
cropland are known to influence elephant movement (Sukumar, 2003). Correlations
between spatial variables are listed in Table S4.

Table 2. Spatial correlates measured for each village.
Spatial variables Mean + S.E. (n=20)
Aerial distance from park boundary (km) 5.32 + 0.25
Length of elephant corridor (km) 0.68 + 0.03
Village area (km²) 2.98 + 0.18
Cropland area (km²) 1.13 + 0.06
Agriplantation (km²) 0.97 + 0.02
Forested area (km²) 0.22 + 0.001
Water-logged land area (km²) 0.48 + 0.001
There are no significant relationships between reported crop loss and the spatial
correlates listed above (Table S5). The only variable to which house damage is
significantly associated in a negative relationship is the proportion of forested area per
village (Fig. 11). Moreover, proportion of forest cover has a strong influence on extent of
house damage, as it explains 49.32% of the variance.
Fig. 11. There is a negative correlation between house damage and forest cover (GLM with
quasipoisson errors; B=-0.84 + 1.04, =-3.87, d.f. =15, p=**, r²=49.32%).

Village correlates of HEC
There is no correlation between any of the village-level characteristics (Table 3;
Table S6). Since it has previously been shown that villages that are habituated to farming
amidst elephants are also less quick to blame elephants for crop depredations (Fernando
et al. 2005), I looked at the relationship between elephant damage and age of village in
my study area, however found no correlation (Table S7). I also did not find any
associations between other village characteristics and the response variables.
Table 3. Village characteristic variables.
Village characteristics Mean + S.E. (n=20)
Size (number of households) 324 + 1769.5
Age (years) 136.30 + 299.81
Literacy level (%) 58.25 + 13.17
Dependency on agriculture (%) 69.6 + 17.32
General characteristics of HEC
Most villages reported that elephants raided in groups during night time and
during months of increased frequency this mainly occurred every day. I find no
significant trend in the origin of raiding herds (Fig. 12). All respondents reported they
knew elephants were raiding since they witnessed the occurrence directly. Usually, they
reported first hearing elephant movement and feeding, which would alert them of their
presence. Moreover, respondents are warned by a particular smell emitted from the
animals. When elephants broke into houses, the informants said that the main reason was
to reach rice stores. All village households are informed when elephants are raiding.
However, in only two cases were neighbouring villages also alerted (Fig. 12). Of 17
respondents, most said they called Forest Department when elephants started to raid (Fig.
12). When the Forest Department was notified, 12 respondents out of 15 mentioned that
forest guards came immediately to help drive elephants away (Fig. 12). Overall,
although there are distinct patterns in most of the above characteristics, I find nothing to

support the hypothesis that villages that do not display these trends were affected by a
significantly different level of HEC (Table S8).
HEC mitigation
All respondents reported using active deterrence methods that involve scarring
animals with either bright lights (i.e. bolem, torchlight, oil lamp) or loud sounds (i.e.
shouting, sound bomb and drumming). Additionally, nine informants mentioned that they
constructed tangis during harvest season, from which they guarded their fields at night.
This was always carried out in groups. Bolem, torchlight, shouting and sound bombs are
widely used throughout my study area, followed by the construction of seasonal tangis.
Drumming and oil lamps are used the least, perhaps because the more popular techniques
are usually employed first (Fig. 13; Table S9).
Fig. 12. Responses to questions regarding the behaviour of raiding individuals. Each section
of the columns represents different types of responses for each question.

Specifically, torchlight is used first above of all other practices, followed by
shouting, and then bolem (Fig. 14). Shouting is such an important practice that five
respondents even said they shout continuously throughout their efforts to deter raiding
elephants. Oil lamps, sound bombs and drumming are used as a last resort, perhaps
because they are more expensive than other deterrence methods. Although torchlights
are mainly used first in driving the elephants away, I found that there was no reduction in
crop loss or house damage if they were instead used later on (Table S10). Whether or not
villages constructed tangis to aid in guarding their fields also did not affect HEC levels
(Table S10).
Fig. 13. Extent to which each technique is used throughout the study area. Stars represent
significant differences between collapse categories (GLM with Poisson errors for the association
between mitigation technique and order of use; minimum adequate model simplified from the
original in which all techniques were represented separately; “***” for p<0.001, “n.s.”for p>0.05).

HEC compensation and attitudes
Almost all villages stated that they recorded the extent of elephant damage in at
Forest Department Offices in Bokakhat (Fig. 15). One respondent said his village did not
record loss because there would be “no benefit in doing so”, another because “they had
no idea they could receive any”. Another informant reported that his village only
recorded house damage, since “crop loss was never compensated”. Of those who reported
their loss, the majority did not receive reimbursement (Fig. 15). A few villages, however,
were compensated for injuries. One respondent reported that their village did receive
compensation also for house damage; however this was from the Civil Administration
rather than the Forest Department. Respondents from all villages within the study area
reported that they received no benefit from having elephants nearby, and that instead,
they represented a detriment to their agricultural production. Nevertheless, most
strongly agreed that elephants had a right to pass through their area (Fig. 15), mainly out
of their respect for the Hindu deity, Ganesha, which is represented as man with an
elephant head. The only respondent who disagreed did so because he believed that
elephants should “stay in the jungle”. Three were unsure about whether elephants had the
Fig. 14. Mean order in which mitigation techniques are used during elephant depredation. Error bars
represent the standard error of the mean, “n” indicates the total number of respondents who mentioned
the particular category.

right to cross their land on account of the extent of damage which they cause. When
asked whether there had been any change in HEC over the past 10 years, informants
principally reported that it had either stayed the same or increased (Fig. 15). Interestingly,
three respondents said that HEC had decreased, which could suggest a change in elephant
home range since two of these are from villages that are located next to one another
(Village ID 14-15).
Out of the above responses, the only significant association with HEC indices that
I found was between those who were compensated for their loss and the extent of
reported crop loss (r²= 59.77%; Table S10). Whether one was compensated or not
explained 59.77% of the variation in crop loss between villages. Specifically,
respondents whose villages were not compensated for the damage loose a significantly
lesser amount of their crops to elephants per year (mean= 9.27 + 2.01%, n=11) than those
who are compensated (mean=33 + 19.5%, n=4). This suggests that although the
compensation scheme is generally unsatisfactory, those that are more heavily affected by
HEC do receive some aid.
Fig. 15. Responses to questions regarding how elephant damage compensation is managed as well as
perceptions of elephant depredation. Each section of the columns represents different types of
responses for each question.

In order to determine to what extent respondent’s considered elephants a danger
to their personal safety, I asked them to rank various types of threat (Fig. 16). I found that
road accidents were more of an issue than elephant damage. Moreover, elephant-related
accidents were not a significantly higher threat than agricultural injuries or damage
provoked by flooding. I found no association between extent of elephant damage and
whether elephants were reported as the most important threat (Table S10).
There is a clear difference in the extent to which the Forest department (FD) are
held responsible for controlling HEC compared to other suggested parties (Fig. 17). The
FD is perceived as accountable for dealing with this issue because elephants are generally
considered by local people as the “forest department’s animals” (Lakhar et al. 2007).
Interestingly, I find no correlation between placing the responsibility on the FD and
reported intensity of elephant damage, demonstrating that it is not because they have
higher losses that they blame the forest officials for unsatisfactory levels of patrolling
(Table S7). Other suggestions for responsible bodies include: the general public, the
government, the villagers themselves and the United Liberation Front of Assam (ULFA),
who was said to “hide in forest areas, therefore pushing out the elephants from their
Fig. 16. Comparing mean ranking for threat types (1=most dangerous). Error bars represent
the standard error of the mean, “n” indicates the total number of respondents who mentioned
the particular category.

natural habitat”. One respondent also suggested the illegal loggers should take
responsibility for the degrading natural habitat.
When respondents were asked if they had any suggestions to improve HEC
mitigation in their village, ten ideas were put forward (Fig. 18). However, no idea was
mentioned significantly more times compared to others. Of the suggestions put forward,
five respondents reported that they thought it would help if the FD could increase
patrolling in their area, reiterating their idea of elephants being “forest department
animals”. Interesting ideas for mitigation include selling kerosene at a subsided price for
lighting bolem, creating fences using teagardens, digging trenches, using electric fencing,
shining large halogen lights on rice paddy and providing villages with more deterrence
equipment. Five respondents said that in order for long-term mitigation, there is need to
“improve elephant habitat”.
Fig. 18. Respondent suggestions for how HEC mitigation could be improved. Informants
often mentioned more than one suggestion.
Fig. 17. Respondent views on who should be responsible for controlling HEC. Informants often
mentioned more than one responsible party.
Multivariate analysis
I modelled reported crop loss as a function of proportion of forested land, whether
villagers were compensated and whether they believed elephants had a right to cross their
agricultural land in a saturated model. Through model simplication, I found no
interactions between these terms. The minimum adequate model only included
compensation as its explanatory term. For my multivariate analysis of reported house
damage, I incorporated proportion of forested area, origin of the herd and whether the
villagers used a torchlight first as my explanatory variables within a saturated model.
Again, there were no interactions between terms, and my minimum adequate model
comprised of only the proportion of forested land as its explanatory variable. The above
results indicate that there are no other factors influencing the significant associations
between the proportions of reported crop loss with compensation, and reported house
damage with forested area.
DISCUSSION
Spatial correlates of HEC
My analyses confirm that Human-elephant conflict (HEC) represents a definite
issue within the fringe villages of Kaziranga National Park (KNP). Not only were
elephants reported to cause damage in 17 out of 20 sampled villages, but they also
brought about the highest amount of crop loss compared to other depredating species.
Moreover, my study confirms the widespread characteristics of both seasonal and
nocturnal raiding across Africa and Asia. Similarly to Hoare et al. (1999), but in contrast
to most studies on HEC around protected areas (PAs; Naughton-Treves et al. 1998;
Hoare, 2000; Lakhar et al. 2007), I discovered that discrepancies in crop loss and house
damage did not decrease with greater distance from the park boundary. Elephant home
ranges are on average 150 km² (Sukumar, 2003), hence the scale of my study area
(between 0 – 10 km from KNP) may be too small to detect any differences in HEC
intensity. Alternatively, problem elephants in this region may not originate directly from
KNP. Rather, HEC could occur while elephants migrate from KNP to Nambor Reserve

Forest (RF) using established, forested corridors that are adjacent to human settlements.
In order to accurately establish the provenance and habitat use patterns of depredating
herds it would be necessary to tag individuals and follow them over extended time-
periods.
Elephant raiding patterns are known to be notoriously unpredictable (Naughton-
Treves, 1998). Indeed, of all the spatial variables measured for this study, the only
relationship which I found is between proportions of house damage and forested area.
Specifically, a higher proportion of house damage is reported in villages with lower forest
cover, corroborating the positive association between extents of transformed land and
level of problem elephant activity (Sukumar, 1991). As the elephant’s natural habitat
decreases, HEC could take place if individuals continue to treat encroached land as part
of their home range (Sukumar, 2003). Moreover, reductions in forest cover will result in
decreases in palatable browse species, thus potentially attracting elephants to nutritious
grain stores (Sukumar, 2003). To ascertain whether there is a definite association
between degraded forest and HEC incidents, a more detailed vegetation analysis is
required. Through such a study it would be possible to make recommendations regarding
which browse species could be re-planted in order to aid in satisfying the elephant’s
nutritional requirements.
Interestingly, the proportion of reported crop loss is not significantly related to
any of the spatial variables within this study. This may be because village-level crop loss
is harder to quantify than house damage, which could result in slightly inaccurate
measures. Furthermore, there is an inherent bias in reported crop loss as affected
individuals are likely to increase their deficits (Nyhus et al. 2005). House damage, on the
other hand, may be harder to falsify, as this information is generally well known within
small villages. In order to reduce this issue, future studies could involve monthly
questionnaire surveys to determine average crop loss over shorter time periods (Milner-
Gulland and Rowcliffe, 2007).

Evaluating mitigation techniques
The mitigation techniques employed by farmers in Bokakhat circle are similar to
the short term, active deterrence methods used for controlling HEC throughout Africa
and Asia (O’Connell-Rodwell et al. 2000; Osborn & Parker, 2003; Sukumar et al. 2003;
Osborn & Hill, 2005). Both shouting and using fire in order to scare elephants away are
traditional techniques, practiced for centuries (Osborn & Parker, 2003). Interestingly,
although within Bokakhat circle, using torchlight is the most widespread and important
type of deterrence method, I found no evidence to suggest that it was more effective than
other techniques. This indicates that farmers may use this technique mainly out of
tradition rather than efficiency. Hence, I would recommend that further, simple, active
deterrence strategies be tried out in this region. This has proven to be an especially useful
strategy where government support for HEC is lacking (Osborn & Parker, 2003). It is
well known that Chillies (Capsicum spp.) have been effective in discouraging African
elephants from raiding crops (Parker & Osborn, 2006; Sitati & Walpole, 2006).
Although previous trials with Chillies have been unsuccessful in Assam (B. Talukdar,
Aaranyak, pers. comm.), I would suggest testing these again on a larger scale.
Specifically, the use of “pepper dung” should be re-evaluated (Osborn & Anstey, 2002).
This practice entails mixing elephant dung with ground chillies and drying them in the
sun. These are then burnt along field boundaries in order to create a noxious smoke
(Osborn & Anstey, 2002). An increase in guarding also has shown to be especially
beneficial in reducing HEC as it provides early warning to farmers (Sitati & Walpole,
2003). Organised guarding does not currently take place in the study villages, and it may
be that a more organised approach may improve mitigation. My study did not show a
relationship between the use of lookout points (tangis) and HEC, indicating that they may
not be well positioned. Further studies could be carried out in this region to determine
where best to construct these posts.
Respondents suggested a wide range of potential mitigation strategies in order to
improve HEC within their region. Three of these short-term possibilities are passive
methods of deterrence, such as putting in place electric fencing, digging trenches around
their land, and creating “tea plantation fencing”. Electric fencing is technically effective

(Taylor, 1999), however the materials, installation and maintenance costs are impractical
for large-scale applications in developing countries (Osborn & Parker 2003). The use of
trenches to prevent individuals traversing cropland is not a better option, since calves
often fall inside and become stranded from their mothers (A. Swargowari., Indian Forest
Service, pers. comm.). The idea of using tea plantation as natural fencing could act as a
buffer zone by putting more distance between the forest and agricultural land.
Respondents suggested that both the forest department and local NGOs should provide
them with equipment for deterrence. Specifically, they asked for a halogen light to shine
on their fields in order to deter potential raiders. This may not be an effective strategy
since the elephants are likely to become habituated (Sitati & Walpole, 2006). However,
there is scope for NGOs providing equipment for elephant deterrence since, in 2006,
Aaranyak supplied villages in Golaghat district with a jeep, searchlights, crackers and
kerosene oil for burning bolem amongst other items. To determine whether NGO support
can reduce raiding incidents as well as improve attitudes towards HEC it would be
beneficial to assess the situation of these villages after a few years.
Reimbursing the loss
A further interesting relationship, which my study reveals, is the association
between reported crop loss and compensation. Although the compensation system in
Assam is not particularly well regarded, I find that villages that have been compensated
are affected by higher crop loss. Interestingly, most of these report having received
reimbursement for injuries rather than actually for their agricultural produce. However,
since higher crop loss should also correspond to more human-elephant interactions there
is still a link between these two factors. Mitigating HEC through compensation schemes
is an important method for aiding subsistence farmers, however when government funds
are lacking, such a system is difficult to run.
Since I have found forest cover to be negatively correlated with reports of house
damage, a potential source of revenue for villages with low forest cover could be
practicing Joint Forest Management (JFM; Malhotra et al. 2004). The principal aim of
JFM is to promote active participation and collaboration between communities and forest
officials in protecting and managing forests. Not only can this strategy improve elephant
habitat, but it could also aid communities in generating income from the forest by
harvesting certain plants in a sustainable manner. Specifically, the forest department aids
villagers during the initial stages of JFM by providing seeds for long rotational timber
species such as Tectona grandis, Gmelina arborea and Michelia champaca, which can
only be harvested after 50-60 years (A. Swargowari., pers. comm.). During this period,
villagers are able to make use of short rotational non-timber forest products, such as
bamboo (Bambusa spp.) and fig trees (Ficus hispida) for fodder, and local medicinal
plants like Cinchona ledgeriana, Aegeles marmelos, and Plantago ovata, since these are
suitable for growth in elephant habitat (Malhotra et al. 2007). The main issue with JFM
is that is it hard to convince villagers to accept this strategy, as it would involve changing
their traditional way of life (Malhotra et al. 2004).
Attitudes towards HEC
Similarly to most studies on HEC (Osborn & Hill, 2005), I found that within
Bokakhat circle it was common to bestow the responsibility of controlling HEC upon
Forest Department guards. In order to improve HEC mitigation, it has been suggested
that there is need to decentralise the responsibility for controlling elephant damage to the
farmers (Osborn & Parker, 2003). However, this shift can only take place if substantial
local strategies exist to combat the issue (Osborn & Parker, 2003). In contrasts with most
studies on HEC (Osborn & Hill, 2005). I find that is that local people believe elephants
“have a right” to pass through their agricultural land. As previously mentioned, this may
be due primarily to their respect for the Hindu god Ganesha. Their reverence is
demonstrated by the fact that none of the villages that reported elephant depredation
stated that elephants were harmed or killed during conflict incidents. This feeling of
respect is extremely important for the conservation of the Asian elephant, and should be
encouraged by local researchers within this area.
Interestingly, I find that elephants are not considered as severe a threat to personal
safety compared to road or agricultural accidents. This could suggest that, within my

study area, HEC is not as serious an issue as in other parts of Assam. To support this
hypothesis, there is evidence that out of the three herds that have been recorded moving
within Golaghat district, those causing most damage are located closer to Nambor RF
(Talukdar et al. 2007). Furthermore, reports of HEC within the fringe villages of Manas
National Park (MNP) are considerably higher (Lakhar et al. 2007). While the average
proportions of reported crop raiding and house damage in Bokakhat circle were 17.12%
and 4.18% respectively, those caused by herds between 0 to 6 km from the boundary of
MNP were approximately 60% and 40% (Lakhar et al. 2007). To further substantiate
the intensity of man-elephant interactions within Bokakhat circle a more extensive study
should be carried out comprising a greater sample at varying distances from the park.
Concluding remarks
Overall, this study contributes to Aaranyak’s ongoing analysis of HEC patterns
within Golaghat district. I highlight the negative association between proportion of
reported house damage and forest cover, thus providing an incentive for further analyses
concerning the elephant’s preferred food types. This relationship also leads on to
recommending Joint Forest Management as an alternative income generation activity.
Furthermore, my analyses show that the principal mitigation techniques within this region
are not used because of their efficiency but mainly out of tradition, indicating that there is
much scope for trying out simple, low-cost active deterrence methods such as burning
“pepper dung” or increased guarding. Lastly, I demonstrate that, on the whole, HEC
intensity within Bokakhat circle is not as high as other areas of Assam. This should be
taken into consideration when proposing site-specific mitigation strategies.
A weakness of this study is that it has been carried out on too small a spatial scale
to detect differences in intensity throughout the whole of the elephant’s range. Thus, it
would be advisable for future studies to administer questionnaire surveys on villages
distributed between the two principal elephant habitats of KNP and Nambor RF.
Moreover, to determine more specifically the origin of raiding herds as well as their
movement patterns, it would be ideal to tag individuals. Additional research on this topic

should try to reduce the bias which reports of crop loss may be subject to by carrying out
surveys within shorter time intervals. Lastly, it would be interesting to continue to assess
the local people’s attitude to HEC, which could give an indication of the effectiveness of
new mitigation techniques and livelihood strategies. Human-elephant conflict in Assam
has taken place since the advent of agriculture, and will carry on if our burgeoning human
population continues to encroach upon natural habitat. For the conservation of the Asian
elephant it is imperative that researchers continue investigating correlates of elephant
damage so as to improve present relations as well as prevent conflict from occurring in
the future.
ACKNOWLEDGEMENTS
I would like to greatly thank Prof. E.J. Milner-Gulland for her guidance in preparing my
questionnaire survey as well as for her valuable comments on earlier drafts of this report.
Thank you to Prof. Mick Crawley, Owen Jones and Nils Bunnefeld for their advice in
statistics. I would also like to thank very much Dr. Bibhab Talukdar, Secretary General
of Aaranyak, for welcoming me to Assam and facilitating my stay there. Thanks to Dr.
Jayanta Boruah, Niranjan Bhuyan and Monjit for their translation and transport assistance
during my time interviewing villagers in Bokakhat circle. Furthermore, I would like to
thank Uttam Saika for his help in providing agricultural and demographic information on
Bokakhat circle. Many thanks to Pranjit Sarma for GIS maps. I am deeply appreciative
also for the company and friendship of everyone I met in Aaranyak’s Guwahati office.
For this, thank you Bibhuti Lakhar, Namita Brahma, Firoz Ahmed, Anil Das, Chatrapati,
Jyoti Das, Ajoy Das, Ashok Dey, Santanu Dey, Pranjit Sarma, Subhankar Chakravorty,
Moonmoon Hiloidhari, Nirupam Hazarika, Naba Nath, Purnima Devi, Farhana and many
others that I have not mentioned here. My stay would not have been the same without
your kindness. Last but not least, thank you so much to the families in Bokakhat circle
who gave their time to answering my questions. Without their cooperation this project
would not have been possible.

REFERENCES
Asian Elephant Specialist Group 1996. Elephas maximus. 2006 IUCN Red List of
Threatened Species.
www.iucnredlist.org [Accessed on 01 June 2007]
Balmford, A., Moore, J. L., Brooks, T., Burgess, N., Hansen, L., Williams, P. & Rahbek,
C. (2001) Conservation conflicts across Africa. Science, 291, 2616-2619.
Bist, S. (2002) Conservation of Elephants in NE India: Past, Present and Future.
Newsletter of the Rhino Foundation for Nature in NE India, 4, 7-10.
Choudhury, A. (1991) Status of Wildlife elephants in Cachar and N.C. Hills, Assam - a
preliminary investigation. .Journal of Bombay Natural History Society, 88, 512-221.
Choudhury, A. (1999) Status and conservation of the Asian elephant Elephas maximus in
north-eastern India. Mammal Review, 29, 141-173.
Das, D. (2002) Fish farming in rice environments of North Eastern India. Aquaculture
Asia, 7, 43-47.
Fernando, P., Wikramanayake, E., Weerakoon, D., Jayasinghe, I., Gunawardene, M. &
Janaka, H. (2005). Perceptions and patterns of human-elephant conflict in old and new
settlements in Sri Lanka: insights for mitigation and management. Biodiversity and
Conservation, 14, 2465-2481.
Hajra, P. & Jain, S. (1978) Botany of Kaziranga and Manas. International Publications,
Dehra Dun, India.
Hoare, R. (1999) Determinants of human-elephant conflict in a land-use mosaic. Journal
of Applied Ecology, 36, 689-700.
Hoare, R. (2000) African elephants and humans in conflict: the outlook for coexistence.
Oryx, 34, 34-38.
Kemf, E & Santiapillai, C. (2000) Asian Elephants in the Wild. 2000- A WWF Species
Status Report. WWF International, Switzerland.
LahiriChoudhury, D. (1980) An interim report on the status and distribution if elephants
in north-east India. In The status of the Asian elephant in the Indian sub-continent (ed. J.
Daniel), pp. 43-58. IUCN/SSC report, BNHS, Bombay.
Lahkar, B., Das, J., Nath, N., Brahma, N. & Sarma, P. (2007) A study of habitat
utilization patterns of Asian elephant Elephas maximum and current status of human
elephant conflict in Manas National Park within Chirang-Ripu Elephant Reserve, Assam.
A technical report prepared by Aaranyak.

Malhotra, K., Barik, S., Tiwari, B., Tripathi, R. (2004). Joint Forest Management in
North-East India: A Trainer’s Resource Book. Regional Centre, National Afforestation
and Eco-Development Board, North-Eastern Hill University, Shillong, Assam.
Milner-Gulland, E.J., Rowcliffe, J.M. (2007) Conservation and Sustainable Use: A
Handbook of Techniques. Oxford University Press.
Naughton-Treves, L. (1998) Predicting the patterns of crop damage by wildlife around
Kibale National Park, Uganda. Conservation Biology, 12, 156-158.
Nyhus, P., Osofsky, S., Ferraro, P., Madden, F., & Fischer, H. (2005) Bearing the costs of
human-wildlife conflict: the challenges of compensation schemes. In People and
Wildlife: Conflict and Coexistence (eds. R. Woodroffe, S. Thirgood & A. Rabinowitz),
pp. 107-121. Cambridge University Press, Cambridge, UK.
O’Connell-Rodwell, C., Rodwell, T., Rice, M. & Hart, L. (2000) Living with the modern
conservation paradigm: can agricultural communities co-exist with elephants? A five-
year case study in East Caprivi, Namibia. Biological Conservtion, 93, 381-391.
Osborn, F.V. and Anstey, S. (2002). Mid Zambezi Elephant Project Consultancy for
WWF/SARPO.
Osborn, F. & Hill, C. (2005) Techniques to reduce crop loss: human and technical
dimensions in Africa. In People and Wildlife: Conflict and Coexistence (eds. R.
Woodroffe, S. Thirgood & A. Rabinowitz), pp. 72-85. Cambridge University Press,
Cambridge, UK.
Osborn, F. & Parker, G. (2002) Community-based methods to reduce crop loss to
elephants: experiments in the communal lands of Zimbabwe. Pachyderm, 33, 22-31.
Osborn, F. & Parker, G. (2003) Towards an integrated approach for reducing the conflict
between elephants and people: a review of current research. Orynx, 37, 80-84.
Parker, G. & Osborne, F. (2006) Investigating the potential for chilli Capsicum spp. to
reduce human-wildlife conflict in Zimbabwe. Orynx, 40, 343-346.
Pimm, S., Russell, G., Gittleman, J. and Brooks, T. (1995) The future of biodiversity.
Science, 269, 347-350.
R Development Core Team. (2006) R: A language and environment for statistical
computing. R foundation for statistical computing, Vienna, Austria. www.R-project.org.
Santiapillai, C. & Jackson, P. (1990) The Asian elephant: an action plan for its
conservation. IUCN/SSC Action Plans, Gland.

Sekhar, N. (1998) Crop and livestock depredation caused by wild animals in protected
areas: the case of Sariska Tiger Reserve, Rajasthan, India. Environmental Conservation,
25, 160-171.
Sitati, N, Walpole, M., Smith, R., & Leader-Williams, N. (2003) Predicting spatial
aspects of human-elephant conflict. Journal of Applied Ecology, 40, 667-677.
Sitati, N. & Walpole, M. (2006) Assessing farmer-based measures for mitigating human-
elephant conflict in Transmara District, Kenya. Orynx, 40, 279-286.
Sukumar, R. (1989) The Asian Elephant: Ecology and Management. Cambridge
University Press, Cambridge, U.K.
Sukumar, R. (1990) Ecology of the Asian elephant in southern India II: feeding habits
and crop raiding patters. Journal of Tropical Ecology, 6, 33-53.
Sukumar, R. (1991) The management of large mammals in relation to male strategies and
conflict with people. Biological Conservation, 55, 93-102.
Sukumar, R. (2003) The Living Elephants: Evolutionary Ecology, Behaviour and
Conservation. Oxford University Press, Inc. New York.
Taylor, R. (1999) A Review of Problem Elephant Policies and Management Options in
Southern Africa. Human-Elephant Conflict Task Force, IUCN African Elephant
Specialist Group, Nairobi, Kenya.
Talukdar, B. & Barman, R. (2004) Current state of Man-Elephant Conflict in Assam:
Solution still elusive. In Endangered Elephant, past, present and future. (ed. J.
Jayewardene), pp. 228. Proceedings of the Symposium on Human Elephant Relationships
and Conflicts, Sri Lanka, September 2003. Biodiversity and Elephant Conservation Trust,
Colombo.
Talukdar, B., Baruah. J., Lahkar. B. (2005) “Human – elephant conflict in Assam: Quest
for feasible solution. Published by Aaranyak, Guwahati, Assam.
Woodroffe, R. & Ginsberg, J. (1998) Edge effects and the extinction of populations
inside protected areas. Science, 280, 2126-2128.

SUPPLEMENTARY INFORMATION
I. Information on Kaziranga National Park.
Kaziranga National Park was inscribed in the list of World Natural Heritage Sites
in 1985. It has had an important influence on the 74 villages within Bokakhat circle since
it became a Reserve Forest in 1908. It comprises 430 km² south of the Brahmaputra
River, in which alluvial inundated grasslands and tropical wet evergreen and
semievergreen forests (Hajra & Jain, 1978) harbour a diverse range of species, including
the endangered One-horned rhinoceros (Rhinoceros unicornus), Asian elephant (Elephas
maximus), Bengal Tiger (Panthera tigris), Swamp deer (Cervus duvaucelii), Wild buffalo
(Bubalus arnee), Hoolock gibbon (Hoolock leuconedys), Gangetic dolphin (Platanista
gangetica), Bengal florican (Housbaropsis bengalensis) and the Great Indian Hornbill
(Buceros bicornis; Eastern Assam Wildlife Division, Bokakhat, 2007).
II. Questionnaire on Agricultural Production
NB. I chose to describe only the most pertinent responses in this report; 1 bigha = 0.137
ha =13.7 km².
General
1) How many households in this village?
2) What are the ethnic groups living in this village?
3) How long has this village been here?
4) In general, what is the education level of this village?
• What educational institute is in this village?
• What is the literacy level?
5) What are the main professions of this village? How many people in each profession?
6) What is the number of types of houses in this village?
• Bamboo houses
• Assam-type houses (stone and concrete with tin roofs)
• High-rise RCC (rock, concrete and cement).
7) How long does it take you to reach Bokakhat?
8) What mode of transport do you use?
9) How many people have Mobile phones?

Cultivated crops
10) What is the total cultivated area of this village?
11) What crops/vegetables/fruit are cultivated in this village? How many bigha each?
12) How much land does each household own?
13) Is the same area of land always cultivated or do you move your crops around?
14) Do you follow certain agricultural practices at specific times of the year?
15) How much do these different crops contribute to the village income? List for each
crop-type.
• All
• Distinct percentage (ask which percentage)
• None
16) What are the reasons for crop-loss? Please rank.
17) How many bigha of crops have you lost over past 12 months? and for each crop-
type?
18) What is the average crop-loss per year?
19) How many households have been affected by crop loss over the past 12 months?
20) During which months does most loss occur? Does this vary between crops?
21) Are roughly the same amount of crops lost every year? If not, why?
• Yes
• No
• Don’t know
22) Compared to 10 years ago has the crop-loss pattern changed?
• Increased
• Decreased
• Same
Animal depredation
23) If animal depredation has been mentioned, do you know by which animals the crops
are depredated? How many bigha of crop-loss attributed to each animal over past 12
months? Rank by importance.

24) How do you know that it is that specific animal?
• Signs – if so, which ones?
• Direct observation
• Don’t know
25) Does animal depredation vary throughout the year? When is it greater? Do different
animals depredate more at different times?
26) During months of increased frequency, how often does raiding take place in a month?
27) Compared to 10 years ago, have you seen any changes in the crop-raiding pattern of
animals?
28) Do you reserve any part of your crops especially for animals?
If elephants are mentioned
29) Do villagers usually see the elephants grazing on crops?
• Yes
• No
• Sometimes
• Don’t know
30) Can you show me where the raids have taken place? Is there an area which is usually
raided?
31) What is usually the composition of raiding groups?
• Tusker – adult with tusks, usually part of herd.
• Makhna – adult lone male, without tusks.
• Entire herd
32) When does this usually take place?
• Morning
• Afternoon
• Night
33) If this is not witnessed, what signs are attributed to elephant depredation?
• Droppings
• Crops damaged in a certain way
• Debarkation.
Elephants were known to be nearby
• Don’t know
34) Have you ever noticed crop raiding to take place more frequently following a certain
type of weather?
35) How many injuries have elephants caused to members of this village over past 12
months? Minor (scratch, sprain) or major (bone fracture, head injury).
36) Were they \ accidental encounters or were elephants provoked when trying to drive
away?
37) How many properties damaged over past 12 months? - what type? Residential
houses, grocery shops? Which area of village (use GPS)?
38) How many human/elephant casualties over past 12 months? Where?
39) Compared to 10 years ago has the number and type of HEC incidents changed?
40) Who should be responsible for preventing these incidents?
41) Have you received any compensation?
42) Do you record your crop-loss in the forest department?
43) What are the elephant-deterrence methods practiced in this village?
(list of methods practiced in the area, Rank by most used).
44) Has the village always used these methods?
45) Are these carried out alone or in a group?
46) Are other members in the village informed when an elephant is raiding or are only
those whose crops are being eaten involved?
47) Do you inform other villages when this is taking place?
48) Do you know what other types of mitigation techniques are used by other villages?
49) Any suggestions about how it could be possible to further reduce elephant
depredation?
50) Would you consider trying out growing alternative crops, that are less palatable to
elephants, to reduce HEC?
Attitudes towards HEC
51) In general, what are the benefits of living in this particular area? Any other costs
apart from animal depredation?

52) Any benefits of having elephants nearby? Any costs apart from crop depredation?
53) Do you think elephants have a right to be here? If not, why not
• Strongly agree
• Agree
• Netural
• Disagree
• Strongly disagree
54) Please rank which threats are more important to your personal safety:
Road accidents
• Elephants
• Agricultural accidents
• Natural calamities (forest fire or flood)
III. Statistical results
N.B. Significance levels are represented by: “n.s.” for p>0.1, “.” for p<0.1, “*” for
p<0.05, “**” for p<0.01 and “***” for p<0.001.
Table S1. GLM with Poisson errors for interactions between reports of depredation for
each species (minimum adequate model).
Explanatory factor levels z-value d.f. p-value
Intercept (Elephant) 11.682 3 ***
Rhino, Wild boar and Wild buffalo -2.604 3 **
Macaque -3.790 3 ***
Hog deer and Parakeet -2.770 3 **

Table S2. Village ID for Fig. 2B and 5.
ID Name HEC intensity HEC intensity
village ID
1 Lukhurakhonia Low 1
2 Panbari N.C. Medium 2
3 Geleka Mikic Low 2
4 Dipholupathar Medium 1
5 Borbhetta High 3
6 Kumaraniati None 3
7 Ikorajangrant None 2
8 Basagaon Medium 3
9 Jugigaon Low 3
10 Daffaloda Gaon Low 4
11 Naharjan T.E. High 2
12 Naharjan Gaon High 4
13 Gormur Medium 4
14 Rajabari High 1
15 Khotialhuli Low 7
16 Nepalikhuti Low 6
17 Juganiati None 1
18 Paranganiati No.1 Low 8
19 Lokhowjan Gaon Low 5
20 Agaratoli Low 9
Table S3. GLM with Poisson errors for the association between month of the year and
reports of highest elephant depredation (minimum adequate model).
Explanatory factor levels z-value d.f. p-value
Intercept (Months 1-9) 3.257 10 **
Months 10-12 6.730 10 ***

Table S4. Spearman’s rank correlations between spatial variables. Significant
associations are bolded and italicised.
Variable a Variable b rho p-value
Village area Cropland 0.24 n.s.
Village area Agriplantation 0.08 n.s.
Village area Forest -0.004 .
Village area Water body -0.43 n.s.
Village area Distance from KNP -0.19 n.s.
Village area Corridor length 0.73 **
Cropland Agriplantation 0.02 n.s.
Cropland Forest -0.55 *
Cropland Water body -0.33 n.s.
Cropland Distance from KNP 0.06 n.s.
Cropland Corridor length 0.02 n.s.
Agriplantation Forest -0.04 n.s.
Agriplantation Water body -0.2 n.s.
Agriplantation Distance from KNP 0.13 n.s.
Agriplantation Corridor length -0.02 n.s.
Forest Water body 0.37 n.s.
Forest Distance from KNP -0.40 .
Forest Corridor length 0.01 n.s.
Water body Distance from KNP -0.13 n.s.
Water body Corridor length -0.41 .
Distance from KNP Corridor length 0.18 n.s.
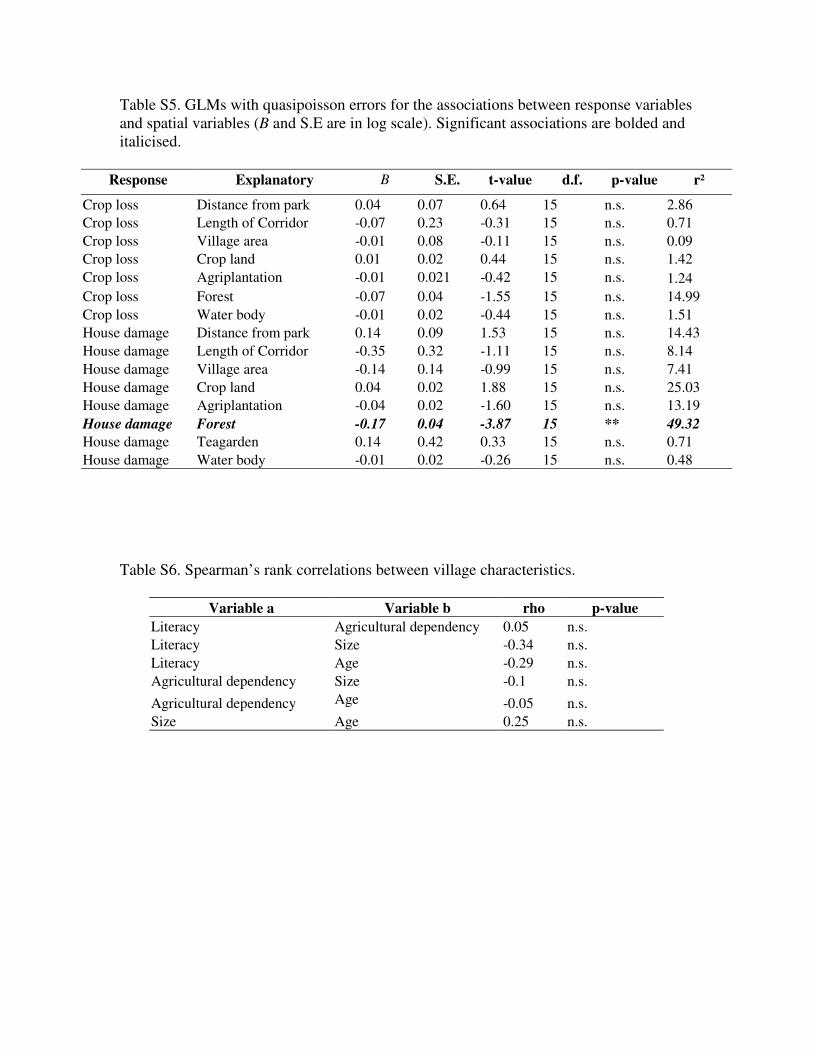
Table S5. GLMs with quasipoisson errors for the associations between response variables
and spatial variables (B and S.E are in log scale). Significant associations are bolded and
italicised.
Response Explanatory B S.E. t-value d.f. p-value r²
Crop loss Distance from park 0.04 0.07 0.64 15 n.s. 2.86
Crop loss Length of Corridor -0.07 0.23 -0.31 15 n.s. 0.71
Crop loss Village area -0.01 0.08 -0.11 15 n.s. 0.09
Crop loss Crop land 0.01 0.02 0.44 15 n.s. 1.42
Crop loss Agriplantation -0.01 0.021 -0.42 15 n.s. 1.24
Crop loss Forest -0.07 0.04 -1.55 15 n.s. 14.99
Crop loss Water body -0.01 0.02 -0.44 15 n.s. 1.51
House damage Distance from park 0.14 0.09 1.53 15 n.s. 14.43
House damage Length of Corridor -0.35 0.32 -1.11 15 n.s. 8.14
House damage Village area -0.14 0.14 -0.99 15 n.s. 7.41
House damage Crop land 0.04 0.02 1.88 15 n.s. 25.03
House damage Agriplantation -0.04 0.02 -1.60 15 n.s. 13.19
House damage Forest -0.17 0.04 -3.87 15 ** 49.32
House damage Teagarden 0.14 0.42 0.33 15 n.s. 0.71
House damage Water body -0.01 0.02 -0.26 15 n.s. 0.48
Table S6. Spearman’s rank correlations between village characteristics.
Variable a Variable b rho p-value
Literacy Agricultural dependency 0.05 n.s.
Literacy Size -0.34 n.s.
Literacy Age -0.29 n.s.
Agricultural dependency Size -0.1 n.s.
Agricultural dependency Age -0.05 n.s.
Size Age 0.25 n.s.
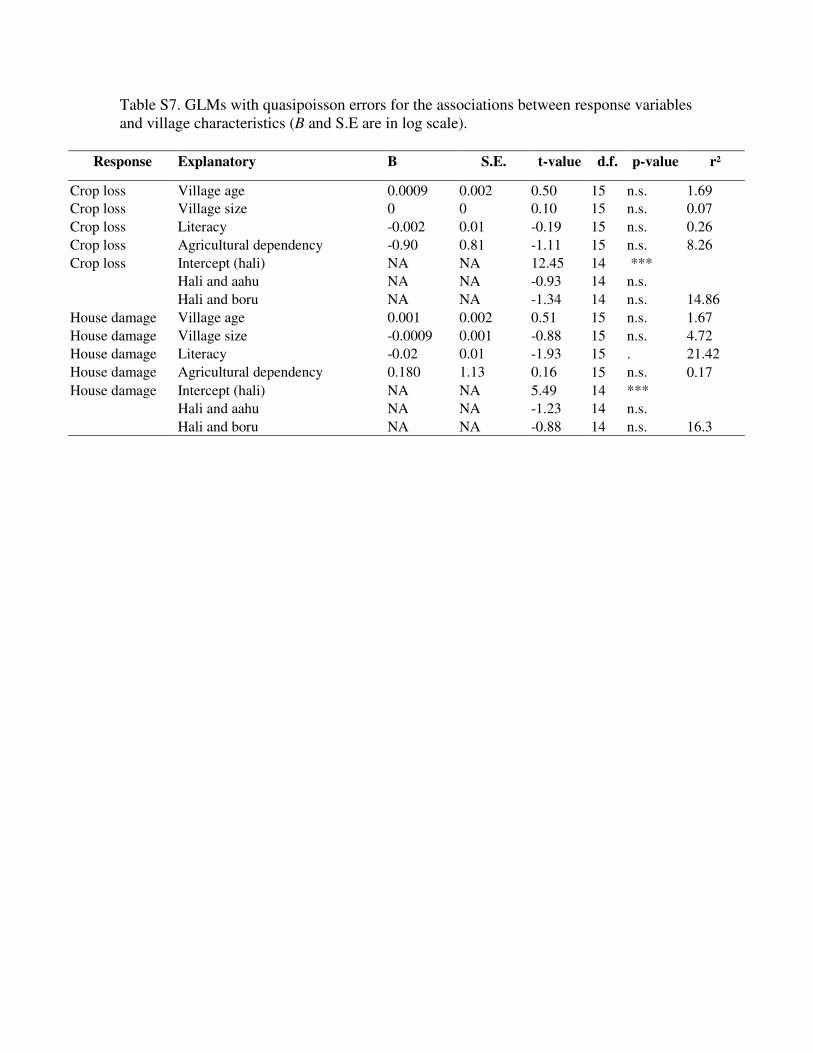
Table S7. GLMs with quasipoisson errors for the associations between response variables
and village characteristics (B and S.E are in log scale).
Response Explanatory B S.E. t-value d.f. p-value r²
Crop loss Village age 0.0009 0.002 0.50 15 n.s. 1.69
Crop loss Village size 0 0 0.10 15 n.s. 0.07
Crop loss Literacy -0.002 0.01 -0.19 15 n.s. 0.26
Crop loss Agricultural dependency -0.90 0.81 -1.11 15 n.s. 8.26
Crop loss Intercept (hali) NA NA 12.45 14 ***
Hali and aahu NA NA -0.93 14 n.s.
Hali and boru NA NA -1.34 14 n.s. 14.86
House damage Village age 0.001 0.002 0.51 15 n.s. 1.67
House damage Village size -0.0009 0.001 -0.88 15 n.s. 4.72
House damage Literacy -0.02 0.01 -1.93 15 . 21.42
House damage Agricultural dependency 0.180 1.13 0.16 15 n.s. 0.17
House damage Intercept (hali) NA NA 5.49 14 ***
Hali and aahu NA NA -1.23 14 n.s.
Hali and boru NA NA -0.88 14 n.s. 16.3

Table S8. GLMs with quasipoisson errors for the associations between response variables
and characteristics of HEC incidents.
Response Explanatory factor levels t-value d.f. p-value r²
Crop loss Intercept (Group) 12.88 15 ***
Crop loss Single -0.69 15 n.s. 3.79
Crop loss Intercept (Both KA and KNP) 8.90 14 ***
Crop loss Only KA 0.10 14 n.s.
Crop loss Only KNP -0.51 14 n.s. 2.67
Crop loss Intercept (Evening visits) 5.87 15 ***
Crop loss Night -0.73 15 n.s. 3.59
Crop loss Intercept (Everyday) 11.95 14 ***
Crop loss Frequently -0.92 14 n.s. 6.52
Crop loss Intercept (Neighbours not
notified)
10.2 15 ***
Crop loss Notified 0.46 15 n.s. 1.41
Crop loss Intercept (Did not call FD) 6.78 15 ***
Crop loss Called FD -1.03 15 n.s. 6.03
Crop loss Intercept (Did not come right
away)
4.55 14 ***
Crop loss Came right away 0.43 14 n.s. 1.58
House damage Intercept (Group) 5.53 15 ***
House damage Single -0.83 15 n.s. 6.07
House damage Intercept (Both KA and KNP) 3.15 14 **
Only KA 1.88 14 .
House damage Only KNP -1.16 14 n.s. 33.57
House damage Intercept (Evening visits) 1.87 15 . 0
House damage Night -0.10 15 n.s. 0.07
House damage Intercept (Everyday) 3.53 14 ** 0
House damage Frequently 0.69 14 n.s. 3.07
House damage Intercept (Neighbours not
notified)
4.98 15 ***
0
House damage Notified -0.66 15 n.s. 3.04
House damage Intercept (Did not call FD) 1.88 15 . 0
House damage Called FD -0.10 15 n.s. 0.07
House damage Intercept (Did not come right
away)
0.96 14 n.s.
0
House damage Came right away 0.72 14 n.s. 4.41

Table S9. GLM with Poisson errors for the association between mitigation technique and
order of use (minimum adequate model).
Explanatory factor levels z-value d.f. p-value
Intercept (Bolem, Torchlight, Shouting and Sound bomb) 20.976 4 ***
Tangis -1.429 4 n.s.
Drumming and Oil lamp -3.902 4 ***

Table S10. GLMs with quasipoisson errors for the associations between response
variables and HEC mitigation, compensation and attitudes towards it.
Response Explanatory factor levels t-value d.f. p-value r²
Crop loss Intercept (Not torch first) 10.14 15 ***
Crop loss Torch first -1.02 15 n.s. 7.05
Crop loss Intercept (Did not use tangis) 6.29 15 ***
Crop loss Used tangis 1.87 15 n.s. 21.20
Crop loss Intercept (No compensation) 10.31 13 ***
Crop loss Compensation 4.41 13 *** 59.77
Crop loss Intercept (Only house damage
recorded)
0.10 14 n.s.
Crop loss Do not record loss 1.04 14 n.s.
Crop loss Record loss 0.73 14 n.s. 12.22
Crop loss Intercept (Do not have right) 1.53 14 n.s.
Unsure 1.28 14 n.s.
Crop loss Have right 0.49 14 n.s. 35.95
Crop loss Intercept (Not ranked as 1st threat) 9.36 15 ***
Crop loss Ranked as 1st threat 1.11 15 n.s. 7.39
Crop loss Intercept ( FD not responsible) 9.27 15 ***
Crop loss FD responsible -0.60 15 n.s. 2.52
House damage Intercept (Not torch first) 7.58 15 ***
House damage Torch first -2.67 15 * 36.32
House damage Intercept (Did not use tangis) 2.44 15 *
House damage Used tangis 0.85 15 n.s. 4.94
House damage Intercept (No compensation) 1.96 13 .
House damage Compensation 0.97 13 n.s. 9.46
House damage Intercept (Only house damage
recorded)
0 14 n.s.
House damage Do not record loss 0.96 14 n.s.
House damage Record loss 0.54 14 n.s. 19.90
House damage Intercept (Do not have right) 3.49 14 **
House damage Unsure -0.81 14 n.s.
House damage Have right -1.62 14 n.s. 17.14
House damage Intercept (Not ranked as 1st threat) 3.18 15 **
House damage Ranked as 1st threat 1.09 15 n.s. 7.07
House damage Intercept ( FD not responsible) 2.50 15 ***
House damage FD responsible 0.65 15 n.s. 2.82
Recommended