
DEVELOPING A SPATIAL DECISION SUPPORT SYSTEM FOR TELECOM
WIRELINE INFRASTRUCTURE FOR ANKARA CITY
A THESIS SUBMITTED TO
THE GRADUATE SCHOOL OF NATURAL AND APPLIED SCIENCES
OF
THE MIDDLE EAST TECHNICAL UNIVERSITY
BY
AHMET DABANLI
IN PARTIAL FULFILMENT OF THE REQUIREMENT FOR THE DEGREE
OF MASTER OF SCIENCE
IN
THE DEPARTMENT OF GEODETHIC AND GEOGRAPHIC INFORMATION
TECHNOLOGIES
MAY 2010

Approval of the thesis:
DEVELOPING A SPATIAL DECISION SUPPORT SYSTEM FOR TELECOM
WIRELINE INFRASTRUCTURE FOR ANKARA CITY
submitted by Ahmet DABANLI in partial fulfillment of the requirements for the
degree of Master of Science in Geodetic and Geographic Information
Technologies Department, Middle East Technical University by,
Prof. Dr. Canan ÖZGEN _____________________
Dean, Graduate School of Natural and Applied Sciences
Assoc. Prof. Dr. Mahmut Onur KARSLIOĞLU _____________________
Head of Department, Geodetic and Geographic Inf. Tech.
Assoc. Prof. Dr. Zuhal AKYÜREK _____________________
Supervisor, Civil Engineering Department, METU
Tuncay KÜÇÜKPEHLĠVAN _____________________
Co-Supervisor, Başar Bilgisayar Sistemleri
Examining Committee Members:
Prof. Dr. Ali Ünal ġORMAN _____________________
Civil Engineering Dept., METU
Assoc. Prof. Dr. S. Zuhal AKYÜREK _____________________
Civil Engineering Dept., METU
Prof. Dr. G. M. Vedat TOPRAK _____________________
Geological Engineering Dept., METU
Assoc. Prof. Dr. AyĢegül AKSOY _____________________
Environmental Engineering Dept., METU
Tuncay KÜÇÜKPEHLĠVAN _____________________
General Manager, BaĢar Bilgisayar Sistemleri
Date: 05/05/2010

iii
I hereby declare that all information in this document has been obtained and
presented in accordance with academic rules and ethical conduct. I also declare
that, as required by these rules and conduct, I have fully cited and referenced all
material and results that are not original to this work.
Name, LastName : Ahmet DABANLI
Signature :
iv
ABSTRACT
DEVELOPING A SPATIAL DECISION SUPPORT SYSTEM FOR TELECOM
WIRELINE INFRASTRUCTURE of ANKARA CITY
Dabanlı, Ahmet
M.Sc. Department of Geodethic and Geographic Information Technologies
Supervisor: Assoc. Prof. Dr. Zuhal Akyürek
Co-Supervisor: Tuncay Küçükpehlivan
May 2010, 107 pages
This thesis covers database creation, system design and application development for
wire line telecom infrastructure within Geographical Information Systems (GIS) and
concentrates on spatial decision support applications and serving wire line subscriber
coordinates for emergency calls in Ankara. The main mission of the
Telecommunication in the past was to serve for voice communication activities.
Currently voice, internet, data and video communications are available. These new
services need better bandwidth capacity and/or renewal of infrastructure with Fiber
Optical cables. Telecom has a complex wire line infrastructure, both in physical and
logical topology. It is important to manage this complex infrastructure to give better
services with new installation and update activities. Due to these requirements
Telecom infrastructure needs to be managed with GIS, which visually provide
physical and logical relationships.
In this study it’s aimed to build a GIS system for Turk Telekom (TT) including
digitization of wire line cable infrastructure, geocoding subscribers and serving the
coordinates of subscribers. The data layers are stored in Oracle Spatial Data Option
(SDO) and spatial data information is kept in MapInfo MapCatalog. The data
schemes for 81 provinces are created. The applications are developed with Borland
Delphi version 7 and Microsoft Visual Studio 2008 .NET Framework. There are
several GIS applications developed so far for the infrastructure of TT, since TT needs

v
to know the location and quality of the infrastructure already present in the field and
needs spatially to decide on areas that need maintenance including improvement,
replacement, and new installations to improve the service. This study is presented as
an alternative spatial decision support system for the improvement of the current
infrastructure and services given to the customers, by using digitized network and
geocoded subscriber data that is stored in GIS system. This study is carried out with
customer participation and on site development with Telecom staff.
Keywords: Telecom, wire line, GIS, Spatial Decision Support System.
vi
ÖZ
TELEKOM KABLO ALTYAPISI ĠÇĠN MEKANSAL KARAR DESTEK SĠSTEMĠ
GELĠġTĠRMESĠ, ANKARA ÖRNEĞĠ
Dabanlı, Ahmet
Yüksek Lisans, Jeodezi ve Coğrafi Bilgi Teknolojileri Anabilim Dalı
Tez Yöneticisi: Yrd. Doç. Dr. Zuhal Akyürek
OrtakTez Yöneticisi: Yüksek Müh. Tuncay Küçükpehlivan
Mayıs 2010, 107 sayfa
Bu tez telekom kablo altyapısı için Coğrafi Bilgi Sistemleri (CBS) ile veritabanı
oluĢturma, sistem tasarımı ve uygulama geliĢtirmeyi kapsamakta ve mekansal karar
destek uygulamaları ve haritalandırılmıĢ sabit telefon abonelerinin koordinatlarının
acil çağrılar için sağlanması üzerine de yoğunlaĢmıĢtır. Eskiden
Telekomunikasyonun ana görevi ses iletiĢim aktivitelerini sağlamaktı. Günümüzde
ise ses, internet, veri ve görüntü iletiĢimi yapılabilmektedir. Bu yeni servisler daha
geniĢ kapasiteli altyapı döĢenmesini ve/veya varolan altyapının Fiber Optik
kablolarla değiĢtirilmesi gerktirmektedir. Telekom hem fiziksel hemde mantıksal
iliĢkileri ile çok karmaĢık bir altyapıya sahiptir. Yeni yatırımlar ve değiĢiklik
aktiviteleri ile daha iyi servis verebilmek için bu altyapıyı iyi yönetmek önemlidir.
Bu ihtiyaçlardan dolayı tlekom altyapısı görsel olarak fiziksel ve mantıksal iliĢkileri
gösteren CBS ile yönetilmelidir.
Bu çalıĢma, Turk Telekom (TT) için kabloların sayısallaĢtırılması, abonelerin harita
üzerine yerleĢtirilmesi ve koordinatlarının servis edilebilmesini içeren CBS sistemi
kurulmasını amaçlamaktadır. Harita verileri Oracle Spatial Data Eklendisi (SDO) ile
tutulmakta, mekansal veri bilgileri ise MapInfo MapCatalogda tutulmaktadır. 81 ilin
veri Ģemaları oluĢturulmuĢtur. Uygulamalar Borland Delphi versiyon 7 ve Microsoft
.NET framework ile geliĢtirilmiĢtir. ġimdiye kadar TT için sahada mevcut
altyapısının yerini ve kalitesini bilmesi ve servislerini iyileĢtirebilmek için nerelerin

vii
değiĢtirme, iyileĢtirme ve yeni inĢaata ihtiyacının olduğuna mekansal olarak karar
verebilmesi için birçok uygulama geliĢtirilmiĢtir. Bu çalıĢma, mevcut altyapının ve
müĢterilere verilen hizmetlerin iyileĢtirilmesi için CBS ortamında sayısallaĢtırılan
Ģebeke ve haritaya yerleĢtirilen abone dataları kullanılarak alternatif bir mekansal
karar destek sistemi olarak sunulmuĢur. ÇalıĢma müĢterinin yerinde ve Telekom
elemanları ile birlikte geliĢtirilmiĢtir.
Anahtar Kelimeler: Telekom, kablo altyapı, CBS, mekansal karar destek sistemi.

viii
To my son

ix
ACKNOWLEDGEMENTS
I would like to express my sincere thanks to my supervisor Assoc. Prof. Dr. S. Zuhal
Akyürek for her great guidance and insight throughout this study.
Also thanks to Tolga Pusatlı and Tuncay Küçükpehlivan for their valuable support.
I would also thanks to Engineers and Managers of Turk Telekom.
I would also thanks to my colleagues Mehmet Çiftçi, Alper Değirmenci, my cousine
Sezer Dabanlı and Necla Ağırman for their support on the implementation of the
system.
I would also thanks to Riza Fikret Yıkmaz for his support.
Finally thanks to my family for their understanding.
x
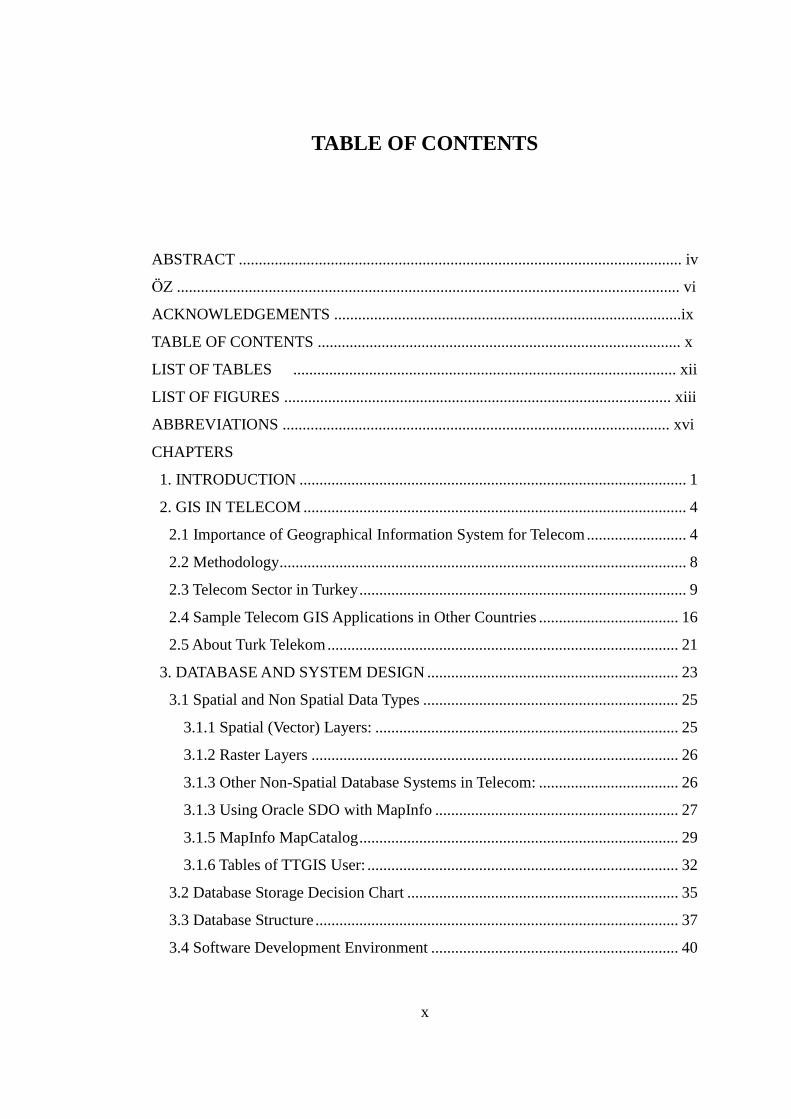
TABLE OF CONTENTS
ABSTRACT ............................................................................................................... iv
ÖZ .............................................................................................................................. vi
ACKNOWLEDGEMENTS .......................................................................................ix
TABLE OF CONTENTS ........................................................................................... x
LIST OF TABLES ................................................................................................ xii
LIST OF FIGURES ................................................................................................. xiii
ABBREVIATIONS ................................................................................................. xvi
CHAPTERS
1. INTRODUCTION ................................................................................................. 1
2. GIS IN TELECOM ................................................................................................ 4
2.1 Importance of Geographical Information System for Telecom ......................... 4
2.2 Methodology ...................................................................................................... 8
2.3 Telecom Sector in Turkey .................................................................................. 9
2.4 Sample Telecom GIS Applications in Other Countries ................................... 16
2.5 About Turk Telekom ........................................................................................ 21
3. DATABASE AND SYSTEM DESIGN ............................................................... 23
3.1 Spatial and Non Spatial Data Types ................................................................ 25
3.1.1 Spatial (Vector) Layers: ............................................................................ 25
3.1.2 Raster Layers ............................................................................................ 26
3.1.3 Other Non-Spatial Database Systems in Telecom: ................................... 26
3.1.3 Using Oracle SDO with MapInfo ............................................................. 27
3.1.5 MapInfo MapCatalog ................................................................................ 29
3.1.6 Tables of TTGIS User: .............................................................................. 32
3.2 Database Storage Decision Chart .................................................................... 35
3.3 Database Structure ........................................................................................... 37
3.4 Software Development Environment .............................................................. 40

xi
4. GIS APPLICATIONS .......................................................................................... 41
4.1 As Built Drawing and Data Entry Application (Spot) ..................................... 42
4.2 Cable Drawing and Data Entry Applications .................................................. 44
4.2.1 Infrastructure and Accessories .................................................................. 44
4.2.2 Copper Cable Drawing Application .......................................................... 45
4.2.3 Fiber Optic Cable Drawing Application ................................................... 49
4.3 Project Preparation Application ....................................................................... 51
4.4 Web Monitoring and Spatial Decision Support Application ........................... 56
4.5 ADSL Capacity Application ............................................................................ 67
4.6 Coordinate of Fix Phone Subscriber ................................................................ 68
4.6.1 Offered System ......................................................................................... 68
4.6.2 Success of the system................................................................................ 71
4.6.3 Steps Followed in the System ................................................................... 71
4.6.4 Returned XML format ............................................................................... 72
5. DISCUSSIONS .................................................................................................... 74
6. CONCLUSIONS AND RECOMMENDATIONS ............................................... 81
6.1 Conclusions ..................................................................................................... 81
6.2 Recommendations ........................................................................................... 82
REFERENCES .......................................................................................................... 84
APPENDICES
A. UPLOADING MAPINFO LAYERS TO ORACLE BY USING EASY LOADER
APPLICATION ....................................................................................................... 88
B. CONTENT OF MAPINFO TAB FILE DOWNLOADED FROM ORACLE ... 91
C. SETTING UP MAPINFO CATALOG INFORMATION IN ORACLE ............. 93
D. DEVELOPING INTEGRATED MAPINFO APPLICATION ............................ 95
D.1 MapInfo OLE Integration with C#: ................................................................ 95
D.2 MapInfo OLE Integration with Delphi: ........................................................ 104
D.2.1 Initializing and communicating with MapInfo ...................................... 104
D.2.2 Login Form and Logging of User Events .............................................. 107
xii
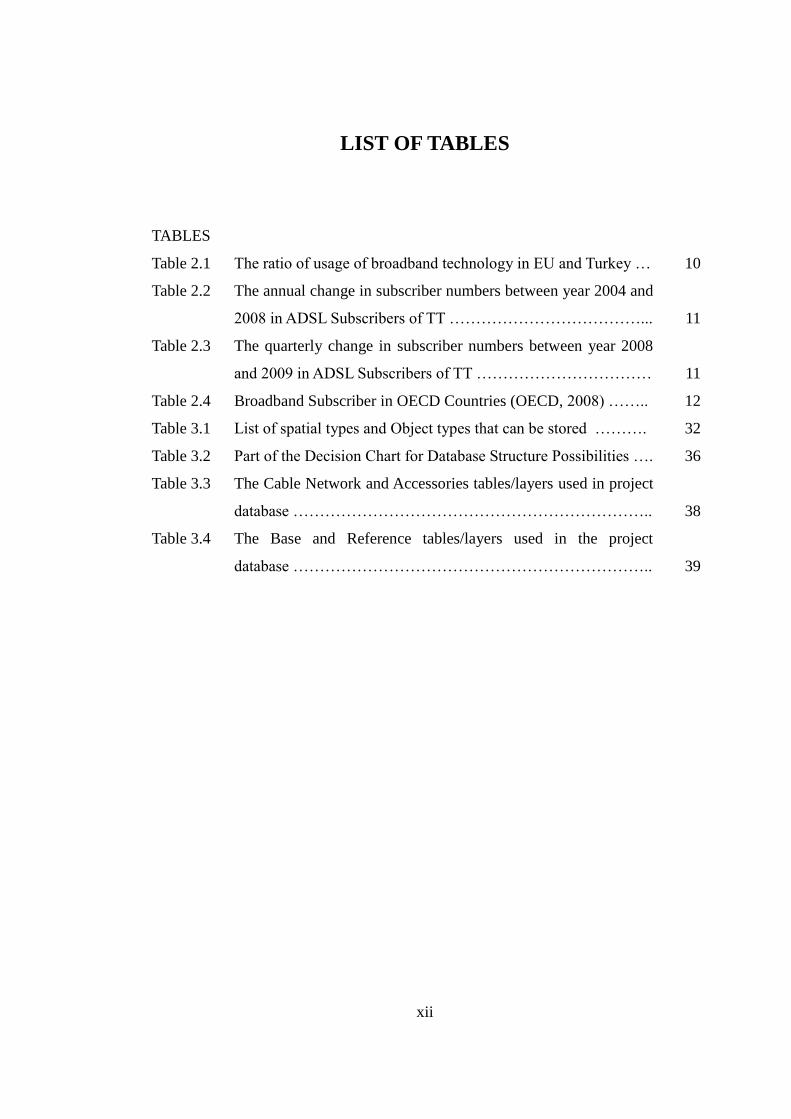
LIST OF TABLES
TABLES
Table 2.1 The ratio of usage of broadband technology in EU and Turkey … 10
Table 2.2 The annual change in subscriber numbers between year 2004 and
2008 in ADSL Subscribers of TT ………………………………...
11
Table 2.3 The quarterly change in subscriber numbers between year 2008
and 2009 in ADSL Subscribers of TT ……………………………
11
Table 2.4 Broadband Subscriber in OECD Countries (OECD, 2008) …….. 12
Table 3.1 List of spatial types and Object types that can be stored ………. 32
Table 3.2 Part of the Decision Chart for Database Structure Possibilities …. 36
Table 3.3 The Cable Network and Accessories tables/layers used in project
database …………………………………………………………..
38
Table 3.4 The Base and Reference tables/layers used in the project
database …………………………………………………………..
39
xiii
LIST OF FIGURES
FIGURES
Figure 2.1 Total Broadband Subscribers by Country for year 2008 ……... 13
Figure 2.2 Configuration of a cable infrastructure GIS system of IBISS ... 17
Figure 2.3 Benefits of GIS system and integration with other systems ….. 18
Figure 2.4 Integration of GIS with other work management systems …... 18
Figure 2.5 Vector and multimedia files displayed in GeoTT ……………. 20
Figure 2.6 Raster data scanned from different scale maps displayed in
GeoTT ………………………………………………………...
20
Figure 3.1 OGC Feature Geometry Schema (OGC Geometry) …………. 26
Figure 3.2 Oracle Spatial Data Option technology components ………… 28
Figure 3.3 Explanation of Oracle SDO Geometry Object Type Elements . 29
Figure 3.4 List of TTGIS tables and information in MapInfo_Mapcatalog 31
Figure 3.5 The tables of the Ankara user and sample SDO coordinates
stored in manhole table ……………………………………….
32
Figure 3.6 SQL statement shows the spatial information stored in Oracle 33
Figure 3.7 MapInfo Oracle Connection dialog ………………………….. 34
Figure 3.8 TTGIS System Architecture …………………………………. 37
Figure 3.9 A part of TTGIS database relations diagram …………………. 40
Figure 4.1 Spot Application Use Case Diagram …………………………. 43
Figure 4.2 Spot Application User Case Diagram with Data Entry ………. 43
Figure 4.3 A sample drawing of central, manhole/pole, field box, service
box etc ………………………………………………………..
46
Figure 4.4 Drawing of a sample Repatitor within Central Building …….. 46
Figure 4.5 Choosing the Central Region to make editing in that region … 47
Figure 4.6 The Use Case Scheme of the Copper Cable Infrastructure
Drawing ……………………………………………………….
47

xiv
Figure 4.7 The Workflow Diagram of the Cable Drawing Application …. 48
Figure 4.8 Fiber Optical Cable Application, a) The main form b) The
data entry form of the F/O cable ……………………………
50
Figure 4.9 Project boundary and setting of project area …………………. 51
Figure 4.10 Project Area selection by field box numbers and project
boundary information entry …………………………………...
52
Figure 4.11 Existing network elements in the project area is loaded ……... 52
Figure 4.12 The list of exiting boundaries and selected project info
entrance ……………………………………………………….
53
Figure 4.13 Planned objects are drawn in separate layers in red color ……. 54
Figure 4.14 List of element types, amounts listed project interim report …. 55
Figure 4.15 Exporting project elements for local usage by contractors ...… 55
Figure 4.16 Scaled print out preparation with the legend specific to TT …. 56
Figure 4.17 The Web Monitoring Application Interface ……..…………… 57
Figure 4.18 Analysis of Number of Fix Line and ADSL Subscriber in each
Field Box region ………………………………………………
60
Figure 4.19 Distance Analysis of Field Boxed to the Central …………….. 61
Figure 4.20 Distance Analysis of Field Box Regions to the Central ……… 62
Figure 4.21 ADSL Speed Analysis of subscribers ………………………… 63
Figure 4.22 ADSL Speed Analysis of Out Site Plant Subscribers ………… 64
Figure 4.23 ADSL Speed Analysis of transmission network ……………... 65
Figure 4.24 Cost calculations for changing a region into OSP system …… 66
Figure 4.25 Location the subscriber ………………………………………. 69
Figure 4.26 The address and location of the subscriber is shown in the
system …………………………………………………………
70
Figure 4.27 Mobile Positioning …………………………………………… 70
Figure 4.28 The location of the subscriber is send to connected navigable
device …………………………………………………………
72
Figure A.1 MapInfo Easy Loader Dialog used to upload map data to
Oracle …………………………………………………………
88

xv
Figure A.2 Oracle Spatial Login Dialog ………………………………….. 89
Figure A.3 The tables in MapInfo Table List will be created in Oracle ….. 89
Figure A.4 Options for uploading to Oracle Spatial ……………………… 90
Figure C.1 The DBMS Catalog Menu in MapInfo Professional …………. 93
Figure C.2 a) DBMS DBA Functions dialog, b) New connection dialog 94
Figure C.3 Oracle Native connection dialog within MapInfo ……………. 94

xvi
ABBREVIATIONS
BT: British Telecom
CAD: Computer Aided Drawings
DBA: Database Administrator
DSL/ADSL: Digital Subscriber Line/ Asynchronized Digital Subscriber Line
FTTH: Fiber To the Home
F/O: Fiber Optic
FTTX: Fiber To the Home/Business etc
GIS: Geographical Information System
GSM: Global System for Mobile Telecom
IP TV: Internet Protocol TV Broadcast
ISP: In Site Plant
OLE: Object Linking and Embedding
OSP: Out Site Plant
PSTN: Fix line Telecom Subscription
SDO: Spatial Data Option of Oracle Database System
TMS: Telecom Management System
TT: Turk Telekom Company
TTGIS: Turk Telekom Geographical Information System, also named as TTCBS
VOD :Video On Demand
1
CHAPTER 1
INTRODUCTION
Computer and related technologies, especially communication technologies, are
growing with a tremendous speed since beginning of the 21st century. Because the
barriers existed about three decades ago became to be solved in the last decade they
become possible to solve. It also became possible to access many of the services by
today’s communication technologies.
The main mission of telecom’s infrastructure was to serve for communication
activities. One of the main problems to overcome in the telecom history was to
connect Europe with America. Mr. Gisborne from Atlantic Cable (Atlantic
Telegraph) Company, was looking far away and saying “When we can whisper
mutual words of friendship through the mystic voice of electricity, even though
ocean rolls between us” (Cookson, 2003). Later, the continents were connected by
wires successfully and this was a revolution in the human history.
Currently, telecom infrastructure is also used for many different services such as
Dial-up Internet, Cable TV, High Speed Internet and Internet Protocol TV (IP TV).
New technologies need bigger data transmissions both in size and speed. More data
transmissions need improved infrastructure and management. It is needed to use
information systems, especially Geographical Information Systems (GIS) in the
current technology era. Due to these facts, telecom companies are encouraged to
build GIS not to only answer the most of the current requirements but also potential
ones, and also to maximize savings for maintenance of the existing infrastructure.
Since telecom has infrastructure maps and customer location data, they should
2
use the telecom technology in life saving emergency services and location-based
services in different ways. Whenever a telecom company can serve the coordinates
of the customers to the emergency agents, there would be more chance to save lives
and assets. Location information can be served for many different location based
customer inquiries such as “Find me the nearest facility to me” or business inquiries
like “Where are my customers located?” It is not enough to locate subscribers on the
map; additionally, such data needs to be updated as cancellations, moving, and new
subscriptions are common in the domain of telecom.
The research question of this study is searching the possibility of building a live
GIS system in Turk Telekom (TT), supporting the decision of the new infrastructure
installations and spatially serving the geocoded subscriber data for emergency
studies. The scope of the study is to design the system applicable to the whole
country and develop applications for Ankara, the capital of Turkey. A proper database
was created and the applications indicating the use of GIS in editing/updating the
system and supporting the decision-making on new investments were developed
The thesis is organized as follows:
Chapter 1 gives a short introduction of the thesis along with the purpose,
scope of the work and introduces the research question.
In Chapter 2, the requirements for the GIS and the usage of it in the telecom
sector are explained. Similar GIS applications are examined from other
countries; moreover the telecom sector in Turkey and GIS history of TT are
given.
In Chapter 3 the database and the system design for TT are explained.
Working with multiple users on the same projects that utilize both spatial and
non-spatial data, and cataloging of the spatial data are presented.
The GIS applications developed for TT, are explained in Chapter 4. As-built
and cable digitization applications of the current inventory are described. The
project applications for updating the system, monitoring and spatial decision

3
support applications for managers, ADSL capacity calculation for Telecom
engineers are presented. Moreover, geocoding of subscribers and serving
their coordinates for emergency system are offered.
In Chapter 5, the results obtained from the developed applications are
discussed.
Conclusions and recommendations are given in Chapter 6.
4
CHAPTER 2
GIS IN TELECOM
2.1 Importance of Geographical Information System for Telecom
2.1.1 Importance of Geographical Information System for Telecom
Importance of Geographical Information System (GIS) can be explained in
terms of problems due to complexity of telecom network infrastructure, competition
in the market, effectiveness and having a modern system for a better vision.
According to Albrecht (2007) “there are two main reasons why geographical data
cannot be adequately represented by simple geometries used in popular CAD
programs. The first is that projects covering more than few square kilometers have to
deal with curvature of the earth. The other reason is that even for smaller areas,
where curvature could be neglected, the need to combine the data from different
sources, especially satellite imagery – requires matching coordinates from different
coordinate systems”.
Ciciora (1999) says, “The primary emphases of cable telephony and internet
access services via cable, as well as digital video transmission. Factor making cable
an attractive medium, include economy, speed and connectionless service”. Telecom
network management must be organized in a good system due to the requirements of
having economical, fast and connectionless services.
Geographic Information Systems are computerized systems for managing data
5
about spatially referenced objects. GIS differ from other types of information
systems in that they manage huge quantities of data, require complex concepts to
describe the geometry of objects and specify complex topological relationships
between them (Mitrovic, 1993).
Bartlett (2000) says, “Fiber Optical technology as applied to Cable TV system
was just what was needed and at the right time. Cable systems were expanding their
bandwidth with the upper limit approaching one GHz. … Because more cable plant
devices and connectors caused increased signal leakage problems, all contributing to
increased plant maintenance and escalating costs. A coaxial cable with one of the
lowest losses of 1000 MHz has 43 Db/km loss, but a F/O has 0.2 Db/km. It is
imperative that Cable TV systems considering staying in the business along time,
must add fiber optic technology to their systems in order to compete in the
telecommunications enterprises during the next century”.
Raghavendran (2003) defines the importance of Broadband technologies.
“Broadband technology has not only given a new meaning for information exchange,
but has also been the building blocks for the so-called Information Superhighway.
Besides fostering a new class of consumer and business related services such as IP
based telephone and video conferencing services, Video On Demand (VOD), home
networking etc., it has also resulted in increased cable modem penetration and
deployment of cable telephony services, making cities digitally intelligent”.
The need for GIS system in telecom was emphasized by Deshpande (2003) as
“Unlike the map and survey data, Telecom network inventory and connectivity
involves complicated logical relationships, which are difficult to capture on CAD
platform. Migration of such data to GIS platform is also very complex, error prone
and does not lead to cost, efforts or time reduction. Therefore, network inventory is
created directly on selected GIS platform, using telecom application.”
Some of the main requirements expected to be met by the GIS / Telecom
6
application are:
Plan, design and engineer network and expansion
Modeling of OutSide Plant (OSP) and InSide Plant (ISP) items up to port
level
Placement of Trenches, Cables, Structures and facilities in the OSP
Facility layouts, equipment placement and port-to-port connectivity
Inventory management including equipment assignment
Repository of As Built and survey data
Provide network data to OSS / BSS systems
Answer service activation / provisioning queries
Cable fault localization
Several Sales, Marketing and Service fulfillment related functions
(Deshpande, 2003)
Like many other similar companies, TT has complex infrastructure and it is
difficult to maintain. TT has many paper maps of the infrastructure. The maps have
many versions for the same area and inconsistencies between each other. Bartlett
(2000) says that, “As cable systems age, the cable system trunk and distribution
system changes along with the subscriber growth in the community. More cables,
passive, amplifies and power supplies are added. When the plant expands, it becomes
hardly recognizable from the original build”.
Desphande (2003) has also reported that “Building on migrated data: OSP
Survey data with trench, man-hole and hand-hole details, number and alignment of
ducts is migrated from AutoCAD platform. Correct models of span and ducts are
populated. Cables are also drawn using models developed on telecom application.
Further, cross-sectional views of the trench are added and cables are associated with
ducts. Cable splicing / connection and slack loop addition are carried out and lastly,
as built data of cable optical and run length is entered.”

7
It is also important to improve the quality of the system. Quality of the system is
a relative concept, according to Albrecht (2007). Albrecht says “Nothing is or has
innate quality; rather quality is related to purpose. Spatial data quality is therefore
described along characterizing dimensions such as positional accuracy, or thematic
precision. Other dimensions are completeness consistency, lineage, semantics and
time”.
According to Stojanovic, (1996), Stoimenov et al. (1993), Daosheng, (1995)
following parameters determined the quality estimation criteria of the system.
Geographic accuracy
- discretization accuracy
- raster map layer correctness,
- position accuracy,
- displayed vector entity precision
- distance precision
Attribute accuracy
- attribute precision,
- attribute completeness,
- attribute (uniformity).
Logical consistency
- geographic consistency
- correction of topological relation
Graphic’s quality
- raster map graphic quality
- vector data quality
- symbol and annotation quality
The TT company is privatized for 30 years, and each year the Contractor
company must make investments on it. They can prove the installations easily by
using GIS. As Campbell (2001) stated, “maps have credibility, someone consulting a
8
map expects an objective representation of the regions it cover and the topic it
presents”.
Brown (2006) says “Google Maps and Google Earth are so useful, it enables you
to create applications that combine mapping or earth information with your own set
of data so that you can build customized views of information. To make the best of
this functionality, however, you need to change the way you think”.
TTGIS system supplies the following information and more as theoretically GIS
systems are designed for:
Spatially store, query, analyze, update and print out the graphical and non
graphical assets
Unique, seamless, consistent and secure database for entire organization
Having proper functions for operator, analyst and managers to update and
monitor the system
Integrating with other systems
Using multi user environment and relational database
Storing countywide network elements up to the most detailed sections,
including the subscriber location.
2.2 Methodology
This study has been done by the following methodologies. First of all the papers
have been examined. After that the congress and books have been searched. For a
wider research and finding the current developments, internet has been searched.
After all of the above researches, direct participation has been done with the TT
engineers and managers on the site.
In literature, it has been found that there was no study carried out for telecom
9
GIS system in Turkey. This study has been done since GIS is applicable to telecom
wire line infrastructure.
2.3 Telecom Sector in Turkey
Change in the communication technology affects our life. In all around the world
there are huge changes in telecom sector, especially in mobile world. With respect to
International Telecommunication Union’s (ITU) report, the mobile subscription and
broadband connection will be more than the fixed subscription (Bitdünyası 1). This
prediction has already happened in Turkey. The mobile subscribers in Turkey
increased approximately to 65 million whereas wire-line subscribers decreased from
24 million to 16.8 million by 2009 (Bitdünyası 2).
The number of mobile telecom subscriptions increased but fixed line subscribers
and number of new DSL subscriptions declined in Turkey in recent years. Moreover
3G wireless networks are also started to operate since June 2009, which may cause a
decline in number of fixed wire-line DSL subscriptions. Finally there is no more
compulsion to have a fixed line subscription for having a DSL connection.
The mobile telecom companies in Turkey, use GIS for planning, field tests for
their cellular network coverage and network quality. Also they are giving services for
“Where am I?” (such as Turkcell NEREDEYIM 7777) and “Where is the nearest
facility to me?” (such as Acaba NEREDE 5255, Avea KimNerede?). The precision of
mobile locating will be discussed in Chapter 5.
Turkey, like the rest of the world, was economically and socially affected and
will be affected more due to these new communication technologies spread all over
the world as it is also stated by Bouras et al. (2009): “Before the implementation of
the broadband network the local economy was based mainly in the lead mining and
forestry. The development of the broadband network contributed to the creation of
10
new jobs. The faster and better communication infrastructure attracted many car
manufactures to create their winter testing facilities in Arjeplog. The above had a
significant result in the reduction of the unemployment in Arjeplog.” Change in
communication means is changing the opportunities for people, public and
government sectors and for telecom companies.
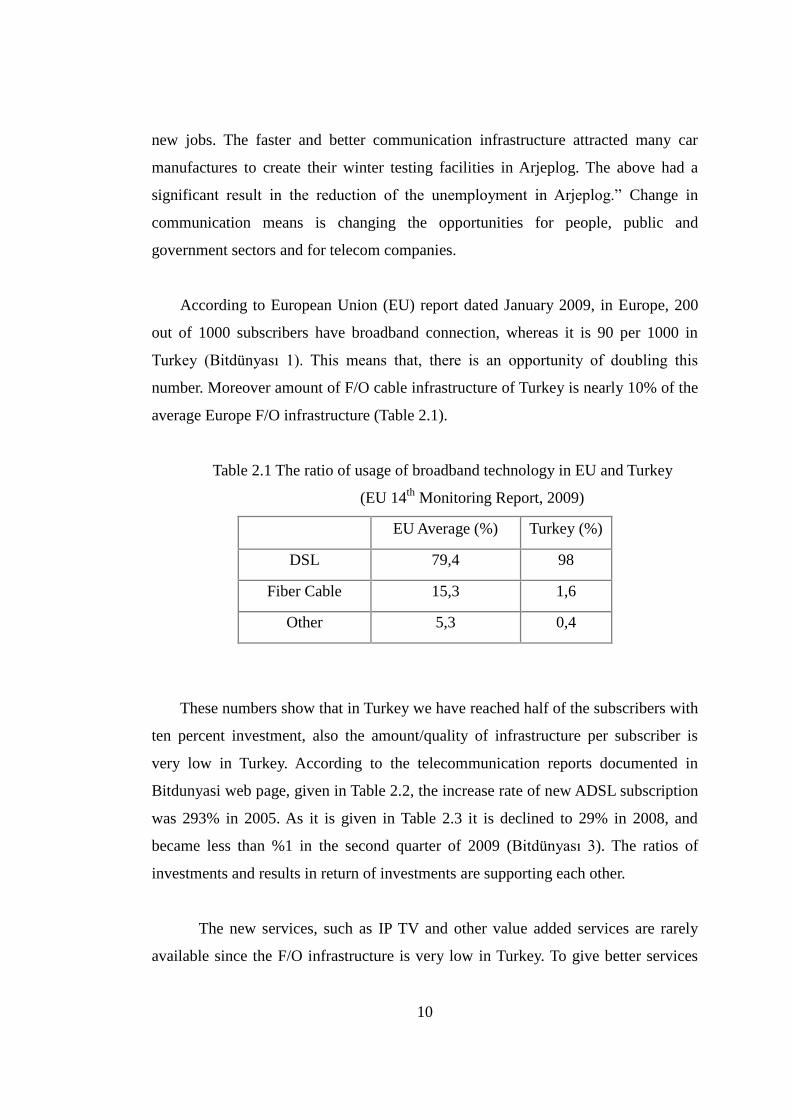
According to European Union (EU) report dated January 2009, in Europe, 200
out of 1000 subscribers have broadband connection, whereas it is 90 per 1000 in
Turkey (Bitdünyası 1). This means that, there is an opportunity of doubling this
number. Moreover amount of F/O cable infrastructure of Turkey is nearly 10% of the
average Europe F/O infrastructure (Table 2.1).
Table 2.1 The ratio of usage of broadband technology in EU and Turkey
(EU 14th
Monitoring Report, 2009)
EU Average (%) Turkey (%)
DSL 79,4 98
Fiber Cable 15,3 1,6
Other 5,3 0,4
These numbers show that in Turkey we have reached half of the subscribers with
ten percent investment, also the amount/quality of infrastructure per subscriber is
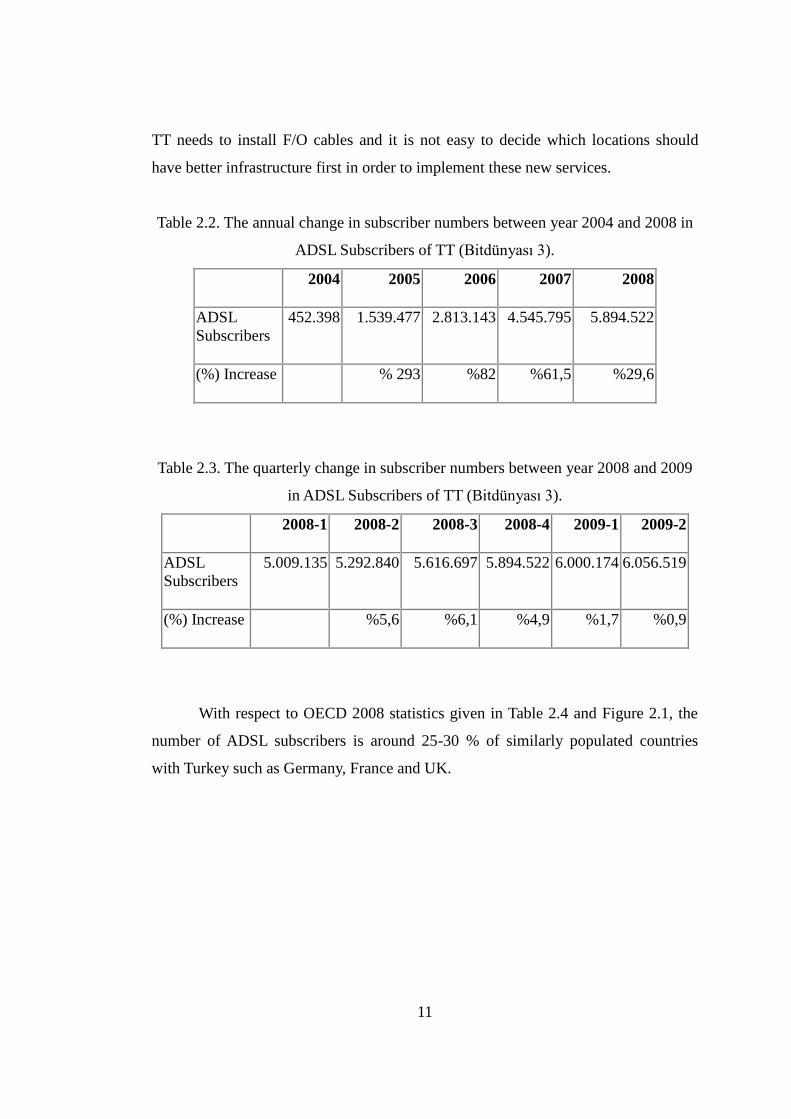
very low in Turkey. According to the telecommunication reports documented in
Bitdunyasi web page, given in Table 2.2, the increase rate of new ADSL subscription
was 293% in 2005. As it is given in Table 2.3 it is declined to 29% in 2008, and
became less than %1 in the second quarter of 2009 (Bitdünyası 3). The ratios of
investments and results in return of investments are supporting each other.
The new services, such as IP TV and other value added services are rarely
available since the F/O infrastructure is very low in Turkey. To give better services
11
TT needs to install F/O cables and it is not easy to decide which locations should
have better infrastructure first in order to implement these new services.
Table 2.2. The annual change in subscriber numbers between year 2004 and 2008 in
ADSL Subscribers of TT (Bitdünyası 3).
2004 2005 2006 2007 2008
ADSL
Subscribers
452.398 1.539.477 2.813.143 4.545.795 5.894.522
(%) Increase % 293 %82 %61,5 %29,6
Table 2.3. The quarterly change in subscriber numbers between year 2008 and 2009
in ADSL Subscribers of TT (Bitdünyası 3).
2008-1 2008-2 2008-3 2008-4 2009-1 2009-2
ADSL
Subscribers
5.009.135 5.292.840 5.616.697 5.894.522 6.000.174 6.056.519
(%) Increase %5,6 %6,1 %4,9 %1,7 %0,9
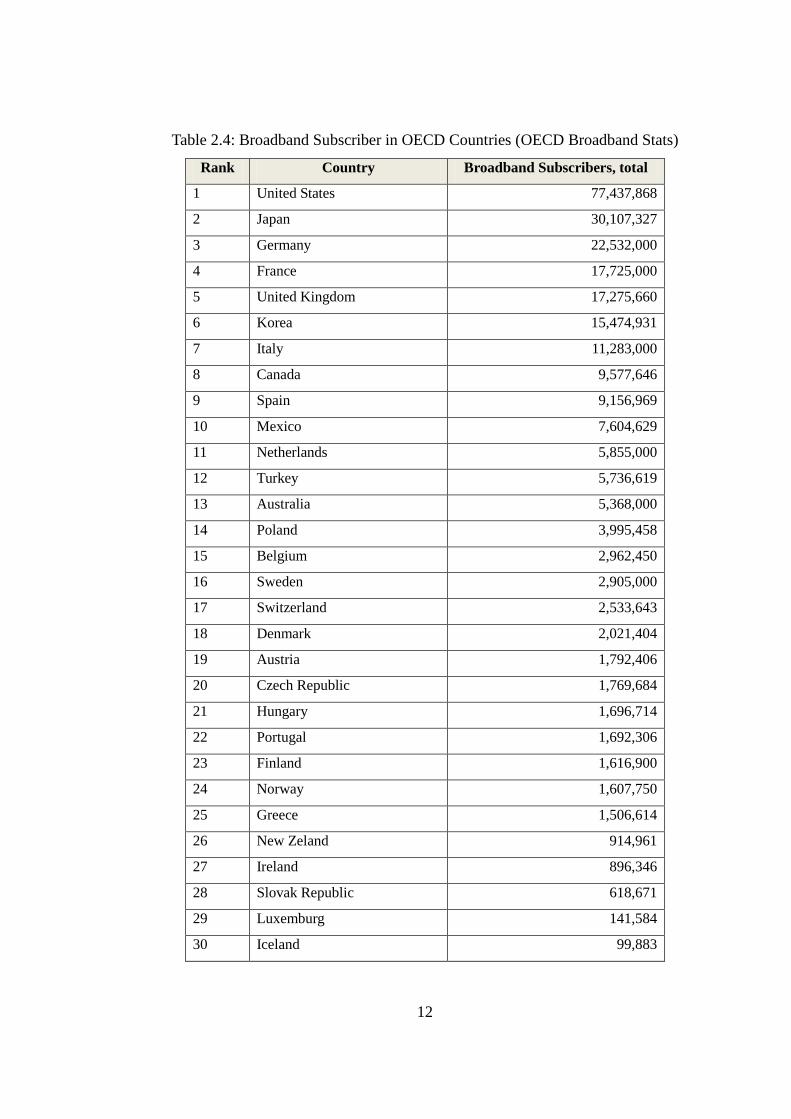
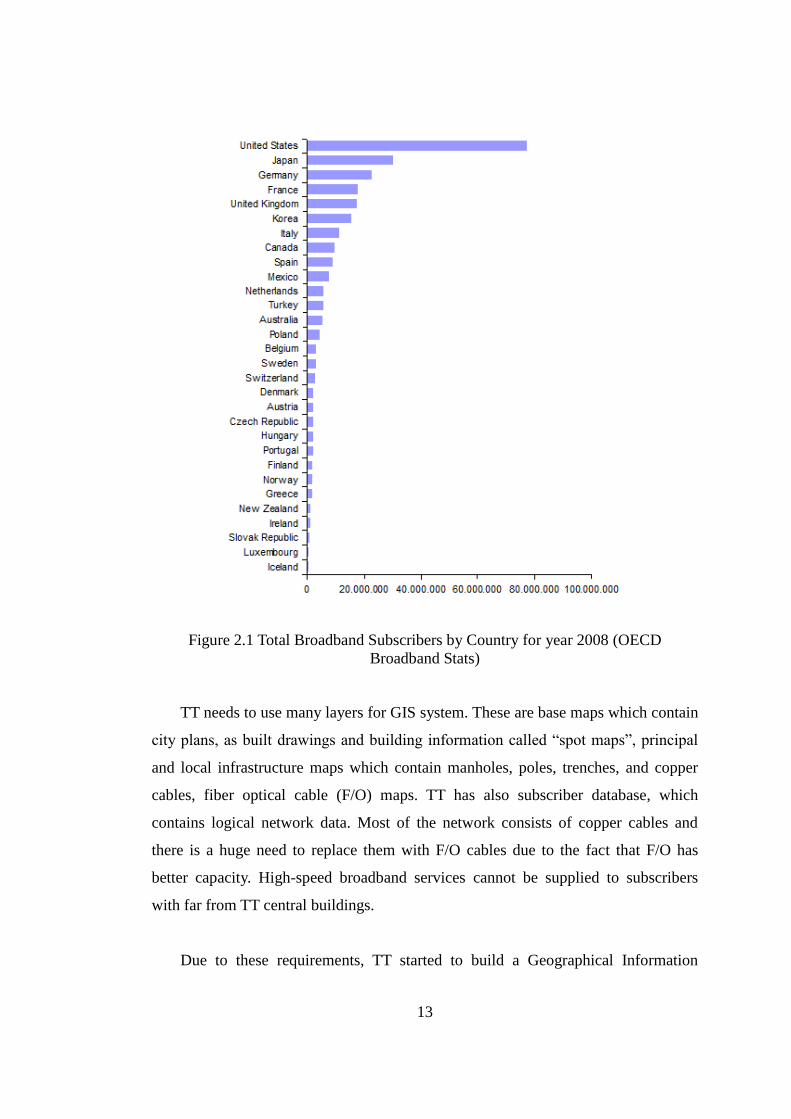
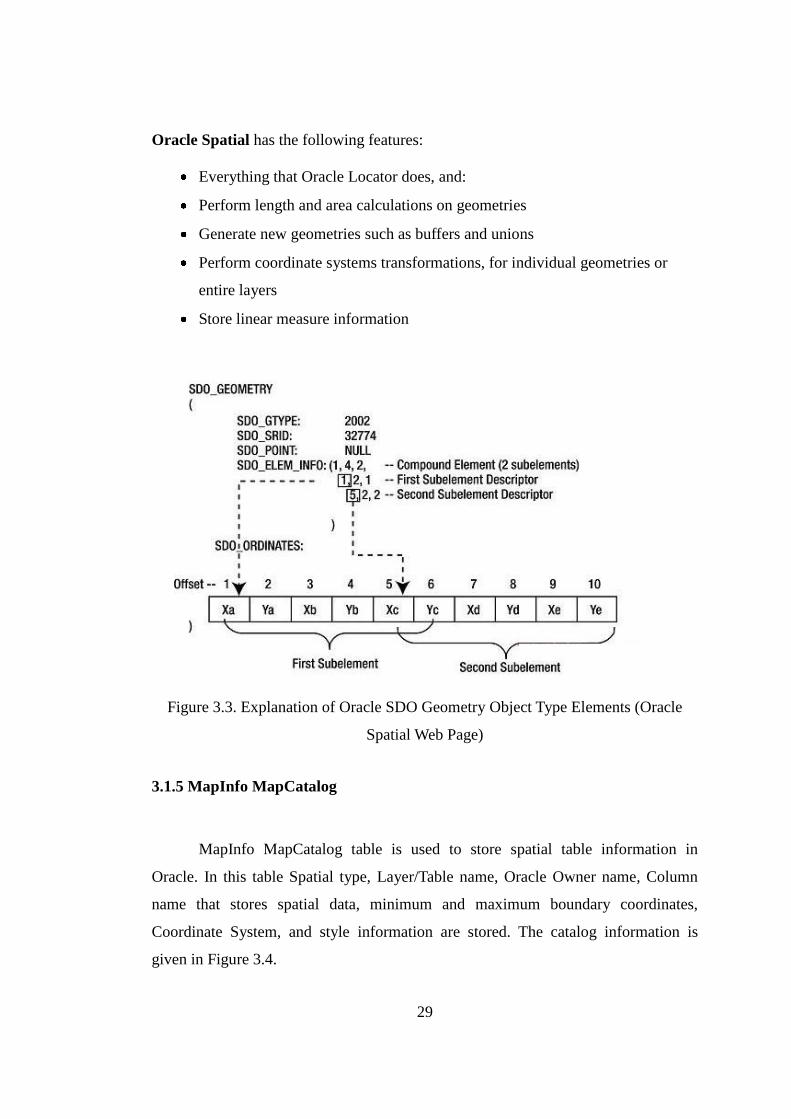
With respect to OECD 2008 statistics given in Table 2.4 and Figure 2.1, the
number of ADSL subscribers is around 25-30 % of similarly populated countries
with Turkey such as Germany, France and UK.
12
Table 2.4: Broadband Subscriber in OECD Countries (OECD Broadband Stats)
Rank Country Broadband Subscribers, total
1 United States 77,437,868
2 Japan 30,107,327
3 Germany 22,532,000
4 France 17,725,000
5 United Kingdom 17,275,660
6 Korea 15,474,931
7 Italy 11,283,000
8 Canada 9,577,646
9 Spain 9,156,969
10 Mexico 7,604,629
11 Netherlands 5,855,000
12 Turkey 5,736,619
13 Australia 5,368,000
14 Poland 3,995,458
15 Belgium 2,962,450
16 Sweden 2,905,000
17 Switzerland 2,533,643
18 Denmark 2,021,404
19 Austria 1,792,406
20 Czech Republic 1,769,684
21 Hungary 1,696,714
22 Portugal 1,692,306
23 Finland 1,616,900
24 Norway 1,607,750
25 Greece 1,506,614
26 New Zeland 914,961
27 Ireland 896,346
28 Slovak Republic 618,671
29 Luxemburg 141,584
30 Iceland 99,883
13
Figure 2.1 Total Broadband Subscribers by Country for year 2008 (OECD
Broadband Stats)
TT needs to use many layers for GIS system. These are base maps which contain
city plans, as built drawings and building information called “spot maps”, principal
and local infrastructure maps which contain manholes, poles, trenches, and copper
cables, fiber optical cable (F/O) maps. TT has also subscriber database, which
contains logical network data. Most of the network consists of copper cables and
there is a huge need to replace them with F/O cables due to the fact that F/O has
better capacity. High-speed broadband services cannot be supplied to subscribers
with far from TT central buildings.
Due to these requirements, TT started to build a Geographical Information
14
System (GIS) for digitizing her infrastructure on paper or Computer Aided Design
(CAD) environment. With a proper GIS system and database, these data can be used
in TT in a variety of applications, services and decision support system. After
digitizing the data TT will have ability to control, improve and locate her inventory
easily.
Turk Telekom (TT) was the only telecommunication company in Turkey until
the monopoly ended in 2004. TT was the sole owner of the voice, data and video
communications. However, there are new competitors in the market. TT can make
better competition with other new companies if her engineers and managers know
their assets installed already in the field and they can easily decide the locations for
new installations. Currently these replacements and new installation are due with
organizational knowledge, without a spatial decision support system. TT has already
have F/O cable network but the major part of the network consists of copper cables.
By the year 2009 some companies, such as Türksat A.ġ and Superonline, started
to serve high-speed (100MB) Fiber to the home (FTTH) internet, initiated in the
largest cities such as Istanbul, Ankara and Izmir. Superonline had spent millions TL
to increase F/O cable infrastructure from 4,000 km to 10,000 km in the last year. TT
must use new technologies to compete with them.
Valuable information is gathered from GIS System. The digitization process will
continue until whole network is created in the sub provinces and villages and the
updates will be made on this system. The different departments in telecom can use
these valuable data. For example the field team can use it for faster failure fixing
similar to British Telecom (BT).
GIS technology can also help TT in digitizing the inventory of the network, to
maximize the utilization of the current capacity, to minimize the inactive elements,
better planning, to increase the satisfaction of customers both in failure response
times and calculation of available ADSL speed, helps to give more services (such as
15
yellow pages) and locate the emergency calls in map by supplying coordinate of the
caller to the emergency hotline (Police, Ambulance, Fire etc.). GIS will also help to
decrease the expenses and increase the revenues.
Some of the advantages of using GIS technology in TT infrastructure are listed
as below:
Many paper and CAD formatted infrastructure investment and the
replacements were occurred during the last 30 years. They will be digitized
and stored in a geographically intelligent database system, which will also
help to correct and to update the edge matching and inconsistent data
problems during the digitization.
It will be easy to calculate and tell the correct speed and service
quality for Asynchronized Digital Subscriber Line (ADSL), Internet
Television (IP-TV) or similar services.
It will be easy to report the location and the path for new installations
or replacements of Fiber Optical (F/O) cables.
Digital Maps will be helpful to maintenance teams for fixing failures.
The route from subscriber to the central can be traced, which will
decrease the time required to fix a failure or will help to understand the
problems in the voice quality and internet speed. These kinds of services will
make the subscribers happier.
The coordinate of the customer could be provided with a service in
case of emergency, without asking it to the customer.
It will be easy to report the empty, unused or unnecessary cables and
infrastructure laid down in the field. It will be easy to report the empty holes
in the trench in case of new requirements of installing new cables, no need to
dig new areas.
Also it will help to serve value added services of voice, data and video
for subscribers and advertisers such as games, entertainment, security,
education, health, etc.
16
2.4 Sample Telecom GIS Applications in Other Countries
There are many Telecom Companies in the world built GIS systems, or
developing several applications for different departments. Some departments need
infrastructure data for services, planning, operations, installations, marketing and
sales department. Similar telecom GIS systems were built in different countries.
BT implemented a nationwide program to equip its 17,000 field service
engineers with a comprehensive location based solution using GIS technology in
2001. It enables them to respond to and rectify network problems faster than ever
before and is part of an overall initiative aimed at reducing the amount of time spent
locating customers premises and in pinpointing faults, culminating in a predicted £23
million saving over the next five years.
BT staff was often called to a location, but did not necessarily have the relevant
information to hand to solve the problem. This resulted in them having to drive back
to one of BT’s exchanges to obtain a copy of the network diagram, which was time
consuming. They were also relying on local street maps to locate customers, which
did not always provide the detail they needed.
The location-based solution enables engineers to first locate a property and then
progressively zoom in to view road networks and local plant and network details, the
location of underground ducts and finally the individual cables within these. In
addition, engineers can see the proximity of the network to the customer, search by
customer’s address and postcode and plot the shortest route to get there, all saving
further time and effort.
A similar GIS system was built by IMMCO Company in India, and the system is
named as Intelligent Broadband Information System (iBISS). The system is
developed for the following departments of telecoms:
17
The Network Operations Center (NOC) use IBISS for trouble ticket
dispatch at a quicker pace
The Engineering department plan before they dig up, as the network plant
data is made available overlaid with appropriate GIS land-base layers in
IBISS.
The Accounting department for the inventory report on its valuable assets
out in the field has to simply pick the fields on which they wish to generate
the reports and the powerful report generation option in IBISS does the rest.
The Marketing and Sales department can use IBISS to locate their “Best
Customers” based on specific criteria.
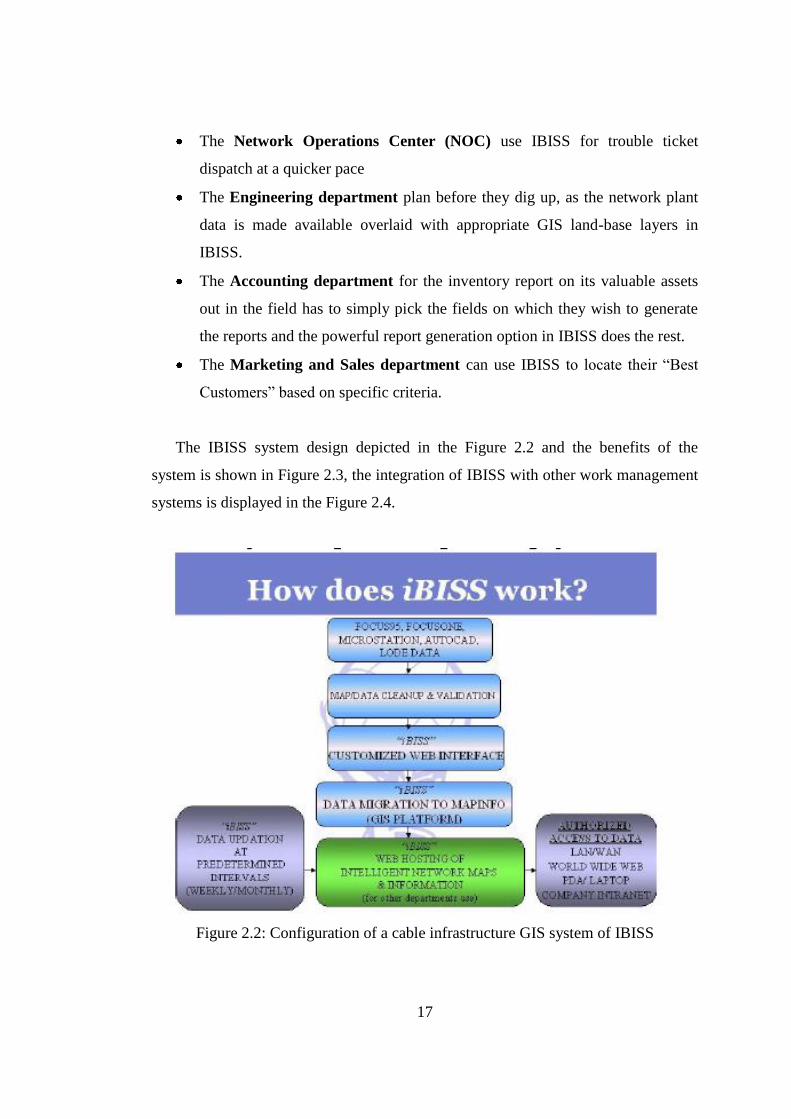
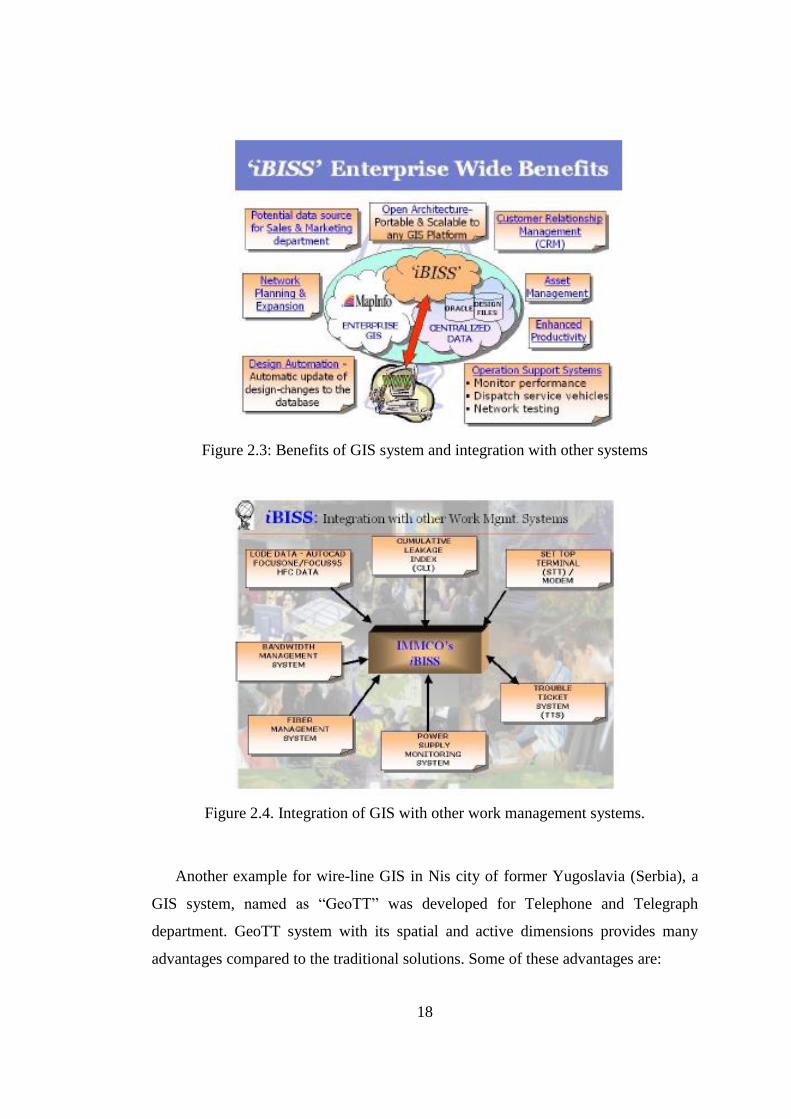
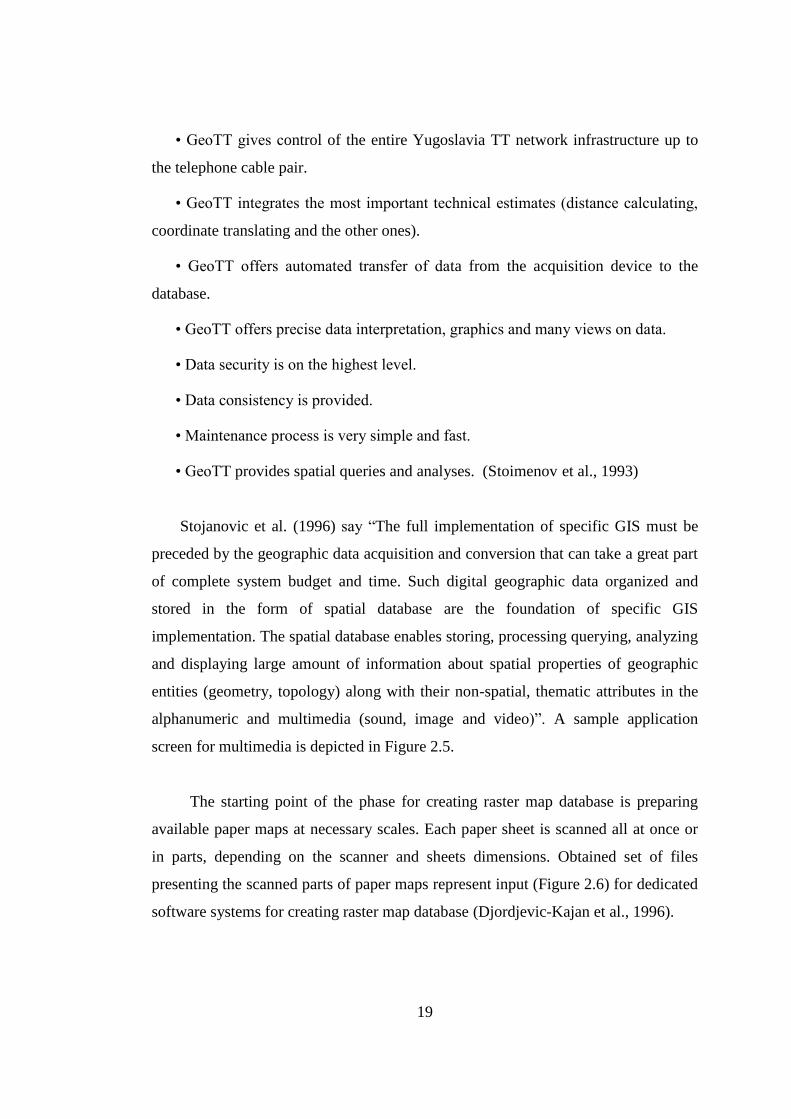
The IBISS system design depicted in the Figure 2.2 and the benefits of the
system is shown in Figure 2.3, the integration of IBISS with other work management
systems is displayed in the Figure 2.4.
Figure 2.2: Configuration of a cable infrastructure GIS system of IBISS
18
Figure 2.3: Benefits of GIS system and integration with other systems
Figure 2.4. Integration of GIS with other work management systems.
Another example for wire-line GIS in Nis city of former Yugoslavia (Serbia), a
GIS system, named as “GeoTT” was developed for Telephone and Telegraph
department. GeoTT system with its spatial and active dimensions provides many
advantages compared to the traditional solutions. Some of these advantages are:
19
• GeoTT gives control of the entire Yugoslavia TT network infrastructure up to
the telephone cable pair.
• GeoTT integrates the most important technical estimates (distance calculating,
coordinate translating and the other ones).
• GeoTT offers automated transfer of data from the acquisition device to the
database.
• GeoTT offers precise data interpretation, graphics and many views on data.
• Data security is on the highest level.
• Data consistency is provided.
• Maintenance process is very simple and fast.
• GeoTT provides spatial queries and analyses. (Stoimenov et al., 1993)
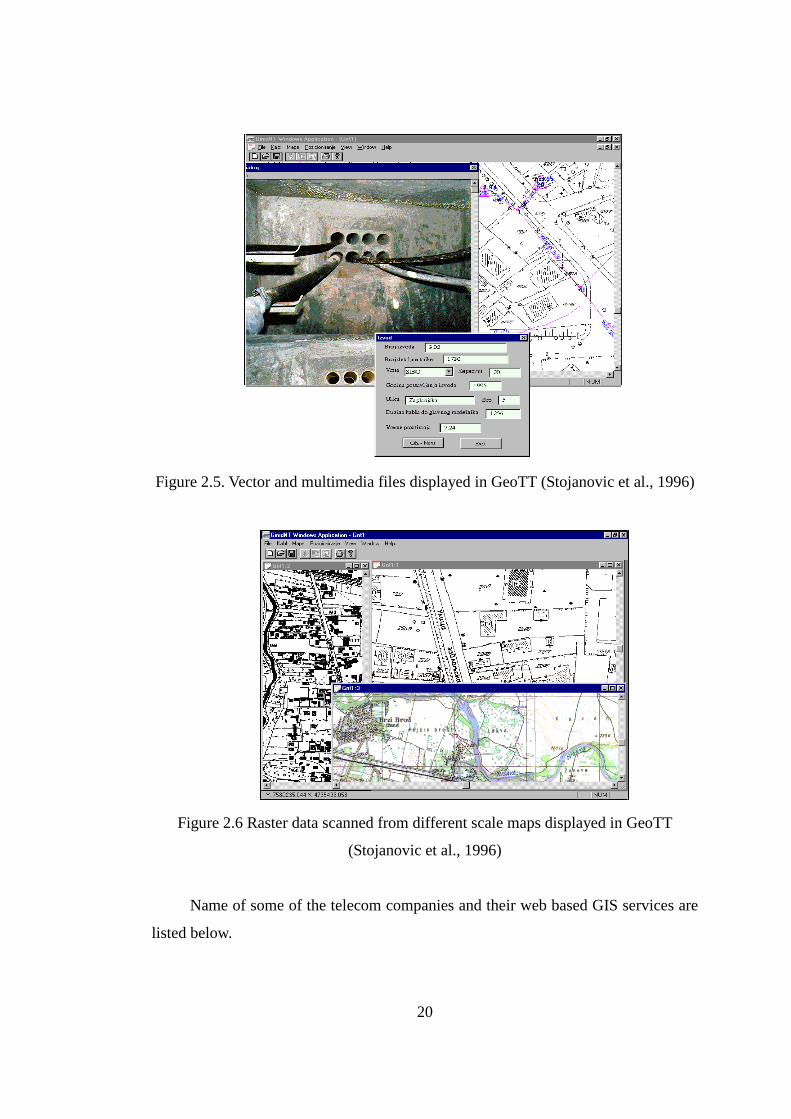
Stojanovic et al. (1996) say “The full implementation of specific GIS must be
preceded by the geographic data acquisition and conversion that can take a great part
of complete system budget and time. Such digital geographic data organized and
stored in the form of spatial database are the foundation of specific GIS
implementation. The spatial database enables storing, processing querying, analyzing
and displaying large amount of information about spatial properties of geographic
entities (geometry, topology) along with their non-spatial, thematic attributes in the
alphanumeric and multimedia (sound, image and video)”. A sample application
screen for multimedia is depicted in Figure 2.5.
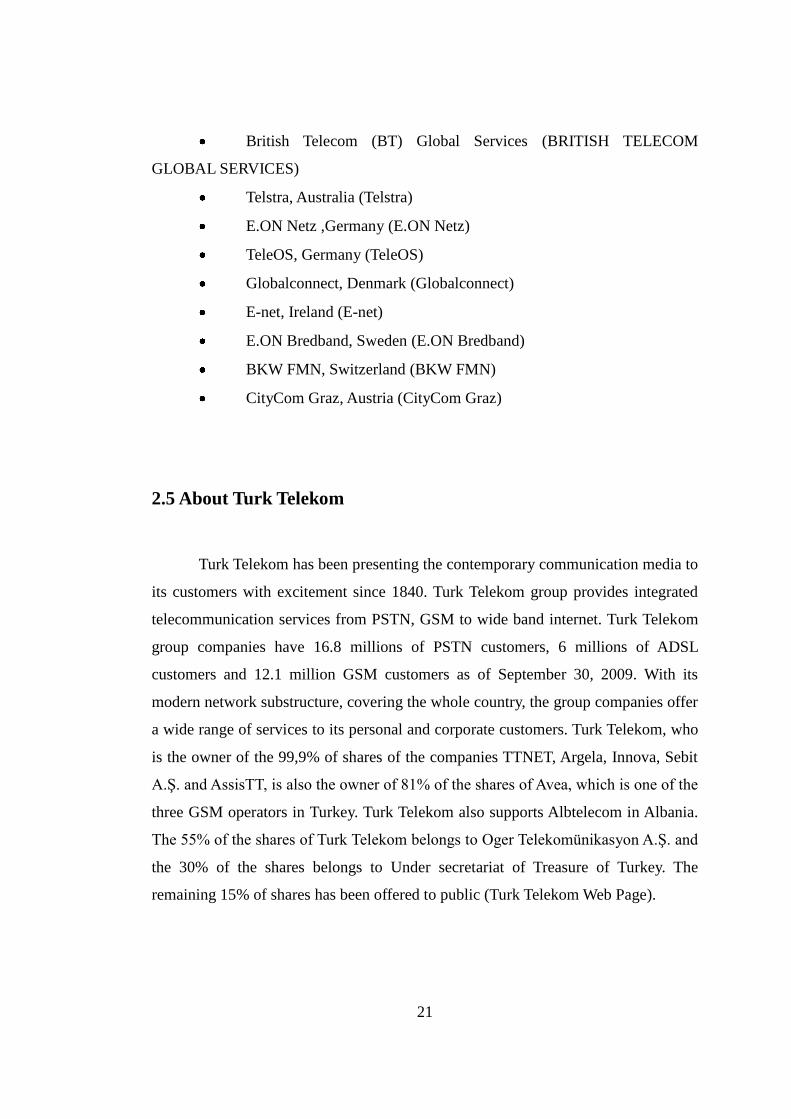
The starting point of the phase for creating raster map database is preparing
available paper maps at necessary scales. Each paper sheet is scanned all at once or
in parts, depending on the scanner and sheets dimensions. Obtained set of files
presenting the scanned parts of paper maps represent input (Figure 2.6) for dedicated
software systems for creating raster map database (Djordjevic-Kajan et al., 1996).
20
Figure 2.5. Vector and multimedia files displayed in GeoTT (Stojanovic et al., 1996)
Figure 2.6 Raster data scanned from different scale maps displayed in GeoTT
(Stojanovic et al., 1996)
Name of some of the telecom companies and their web based GIS services are
listed below.
21
British Telecom (BT) Global Services (BRITISH TELECOM
GLOBAL SERVICES)
Telstra, Australia (Telstra)
E.ON Netz ,Germany (E.ON Netz)
TeleOS, Germany (TeleOS)
Globalconnect, Denmark (Globalconnect)
E-net, Ireland (E-net)
E.ON Bredband, Sweden (E.ON Bredband)
BKW FMN, Switzerland (BKW FMN)
CityCom Graz, Austria (CityCom Graz)
2.5 About Turk Telekom
Turk Telekom has been presenting the contemporary communication media to
its customers with excitement since 1840. Turk Telekom group provides integrated
telecommunication services from PSTN, GSM to wide band internet. Turk Telekom
group companies have 16.8 millions of PSTN customers, 6 millions of ADSL
customers and 12.1 million GSM customers as of September 30, 2009. With its
modern network substructure, covering the whole country, the group companies offer
a wide range of services to its personal and corporate customers. Turk Telekom, who
is the owner of the 99,9% of shares of the companies TTNET, Argela, Innova, Sebit
A.ġ. and AssisTT, is also the owner of 81% of the shares of Avea, which is one of the
three GSM operators in Turkey. Turk Telekom also supports Albtelecom in Albania.
The 55% of the shares of Turk Telekom belongs to Oger Telekomünikasyon A.ġ. and
the 30% of the shares belongs to Under secretariat of Treasure of Turkey. The
remaining 15% of shares has been offered to public (Turk Telekom Web Page).
22
Turk Telekom (TT), made many Research and Development studies for
Geographical Information System (GIS) since 1998. Sample projects were made by
using MapInfo, Smallworld and ESRI. Speed of data production, easiness of usage,
cost of total ownership, integration with other systems and customizability of
software, multi user editing were analyzed. Several projects initiated such as data
production in Ankara, Ġstanbul and Antalya, fiber optic (F/O) drawing and unknown
numbers service (Dial 118) by using MapInfo Professional GIS product. In those
projects the weak points of the architecture were analyzed. The main problems were
storage of GIS data, integration with other applications and extending the
applications within the TT departments.
Data transmission speed in network was also a major concern at the
beginning of the project. Currently all of the cities are connected to the TT General
Management Building and Computer Center with high speed connection, whereas in
1998 the speed was not suitable for GIS applications, but it was suitable for text
based data transmission for example subscriber information.
In 2008 TT has made a contract to develop the current GIS applications and
to get services for infrastructure digitization. In 2009, second phase of the project
was initiated to get service for digitization of infrastructure, support for the existing
applications and build new applications. However the system implemented so far
does not support decisions on new implementations and service of the coordinates of
subscribers.
23
CHAPTER 3
DATABASE AND SYSTEM DESIGN
In this chapter, the spatial and non-spatial data types, decision chart for the
system design and database structure of TTGIS project are explained.
Some of the infrastructures were in paper format and those papers were
scanned and digitized. Some of them were in CAD files and those files were
converted into GIS format. The related information on the drawings was entered to
the GIS objects. Standard types and categories were stored in look up tables.
According to Shi et al. (2009) “Geographic Information System manages the
following: (a) spatial information, (b) temporal information, (c) attribute information
and (d) topological relations. Spatial information describes the location and shape of
geographic objects in which the user is interested. Attribute information describes the
property, quality and characteristics of geographic objects. Temporal information
describes the changes over time in geographic objects, while topologic relations
describe the spatial relationship between geographic objects”.
According to Stojanovic (1996), “the spatial components of digital
geographic data consist of two kinds of spatial information: raster and vector. These
geographic data completely describe spatial properties of geographic entities of
interest including their geometry (shape, size, location) and topology (relationships
with other entities). Also geographic entity is described by their non-spatial, thematic
attributes describing their quantitative and/or qualitative properties and traits in the
form of text, numbers, graphic symbols, sounds, images, video records and so on. In
order to fully represent some important aspects of the geographic world, the spatial
24
database must be modeled and developed to include, store and appropriate organize
all these data about geographic entities constituting this geographical aspect”.
Telecom GIS application was designed to store, spatial, attribute and topological
information. The changes and time of change information were also logged in the
system.
According to Vanikar et al. (1996) the spatial and non-spatial data should be
kept together. “The telecommunications services have been computerized since about
a decade and all this information was maintained in tabular form. The spatial
information is being maintained in carefully hand drawn maps which are of several
levels/kinds and innumerable. Whenever any changes are to be made in the telephone
cables like diverting a telephone cable to another nearby pillar or erecting a new
pillar, a lot of time is wasted in drawing the new maps or updating the already drawn
maps. The personnel of the telephone department also have to take into consideration
the existing telephone facilities that have been laid down i.e. they have to have the
tabular information alongside while planning such changes. Hence, a need has been
felt to explore the possibility of transferring the map information in digital format
and to design and develop a software package to provide query based access using
the available technology of GIS; where the spatial and non-spatial data could reside
under a common umbrella”.
The database tables were created in relational format. The logical database
structure is designed for storing each different network element in a separate table
and data of each province is stored in a separate schema. The users can connect to
download and display their central region. In many provinces there are more than
one user who may edit the same area. So a primary key field is defined and on each
insert of database, this number is increased with a sequence numbering called within
a triggering function. For multi user editing Oracle database is chosen. Oracle
Management tools are used together with PLSQL Developer program for creating
tables, relations, indexing and granting for tables. The desktop applications are
developed on MapInfo with MapBasic, Borland Delphi and Microsoft .NET. Web
25
based applications were developed with Microsoft .NET on MapInfo MapXtreme.
3.1 Spatial and Non Spatial Data Types
In GIS projects several layers/tables are created. Vector, raster and text tables
are used in the projects. The vector layers contain Point, Line, Region spatial objects
types, but raster layers contain pixels/colors information. The text databases do not
contain coordinates, but mostly contain coded or free type address information,
whereas the spatial database contains both spatial and textual information in the same
table.
3.1.1 Spatial (Vector) Layers:
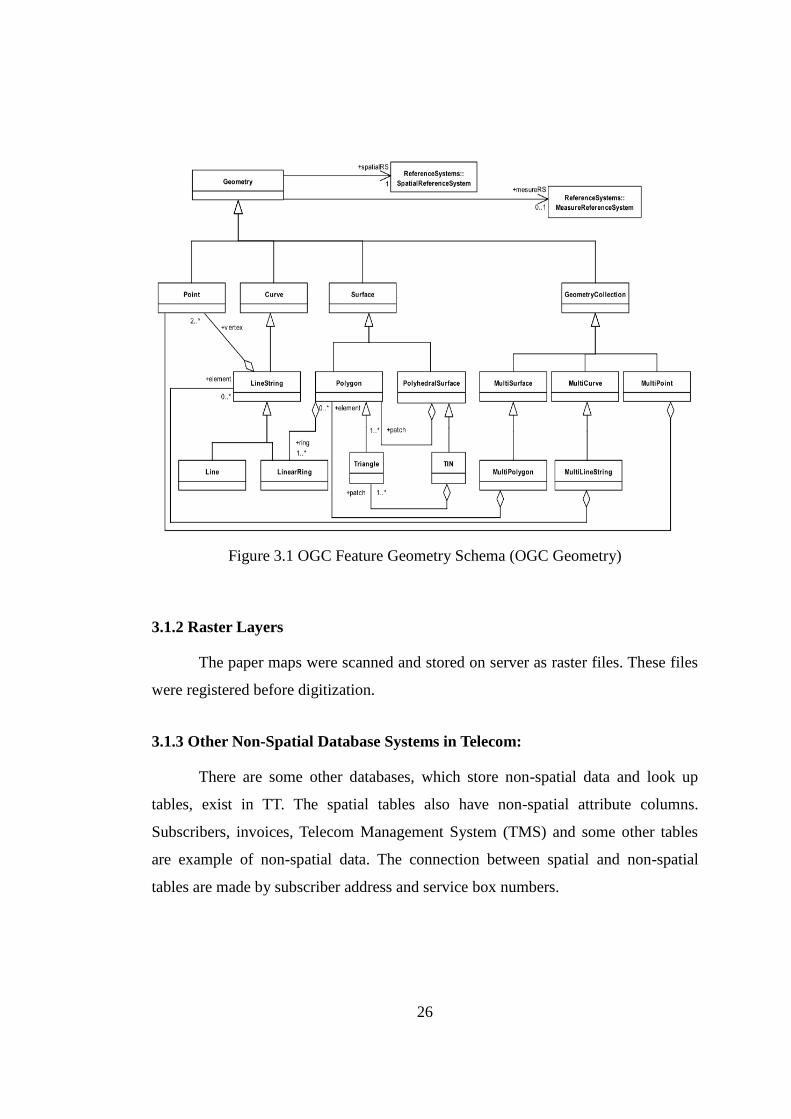
In many GIS books, the standard vector objects are divided into three groups:
Point, Line and Region. Due to the needs of the GIS sector, there are several new
types recorded in Open GIS Consortium (Figure 3.1). Some of those types are listed
below:
Point: X, Y, Style
Line: X1, Y1, X2, Y2, Style
Poly-line, Line-string: X1,Y1, ...XN,YN, Style
Surface/Region: X1,Y1, ...Xn,Yn, X1,Y1
Multipoint: Combination of 2 or more points
MultiCurve: Combination of 2 or more curves ( line or line string)
MultiSurface: Combination of 2 or more polygons
GeometryCollection: Combination of Line, Region and Point objects or
Block Object.
CAD files in local coordinate system are transformed by using affine
parameters obtained from local municipality or Cadastral Departments.
26
Figure 3.1 OGC Feature Geometry Schema (OGC Geometry)
3.1.2 Raster Layers
The paper maps were scanned and stored on server as raster files. These files
were registered before digitization.
3.1.3 Other Non-Spatial Database Systems in Telecom:
There are some other databases, which store non-spatial data and look up
tables, exist in TT. The spatial tables also have non-spatial attribute columns.
Subscribers, invoices, Telecom Management System (TMS) and some other tables
are example of non-spatial data. The connection between spatial and non-spatial
tables are made by subscriber address and service box numbers.
27
3.1.3 Using Oracle SDO with MapInfo
Oracle have spatial database component named Spatial Data Option (SDO),
since version 8.5. MapInfo can connect and use SDO tables with a direct connection.
The spatial data definitions and parameters are stored in a separate table named as
MapInfo_MapCatalog explained in Section 3.1.5.
“Oracle Locator is a feature of Oracle Database Standard and Enterprise
Editions that provides core location functionality needed by most customer
applications. Oracle Spatial is an option for Oracle Enterprise Edition that provides
advanced spatial features to support high-end GIS and LBS solutions” (Oracle
Spatial Web Page).
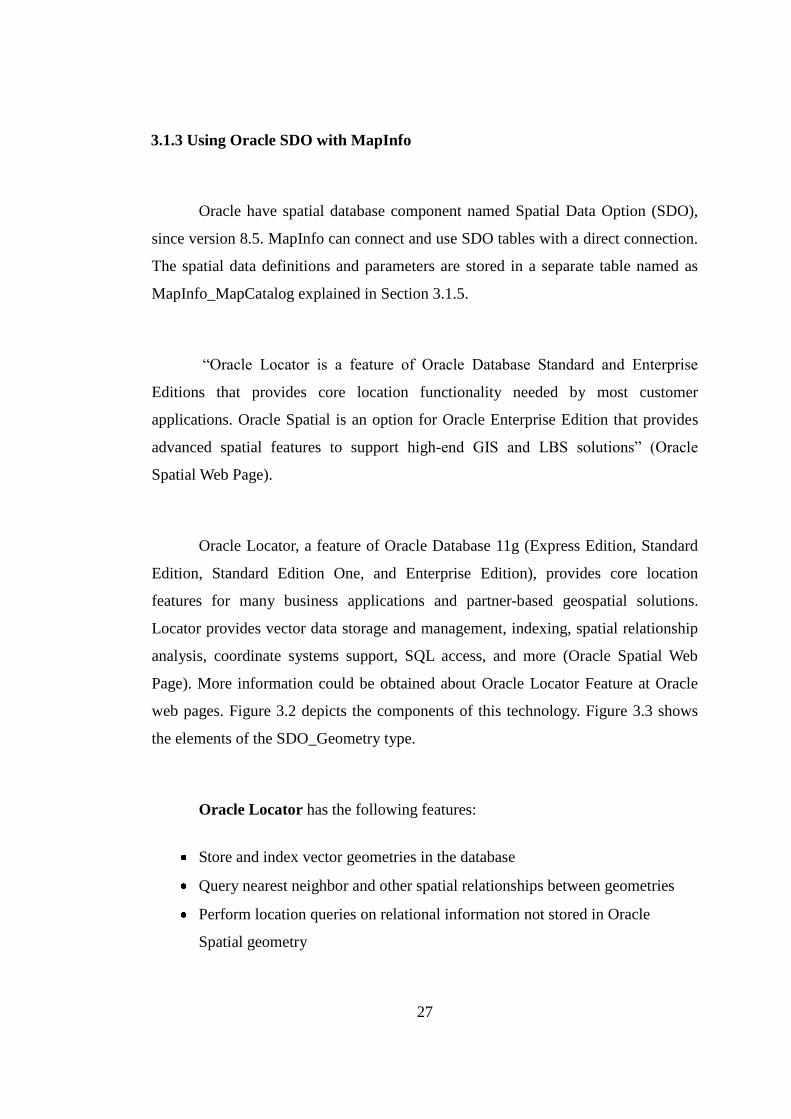
Oracle Locator, a feature of Oracle Database 11g (Express Edition, Standard
Edition, Standard Edition One, and Enterprise Edition), provides core location
features for many business applications and partner-based geospatial solutions.
Locator provides vector data storage and management, indexing, spatial relationship
analysis, coordinate systems support, SQL access, and more (Oracle Spatial Web
Page). More information could be obtained about Oracle Locator Feature at Oracle
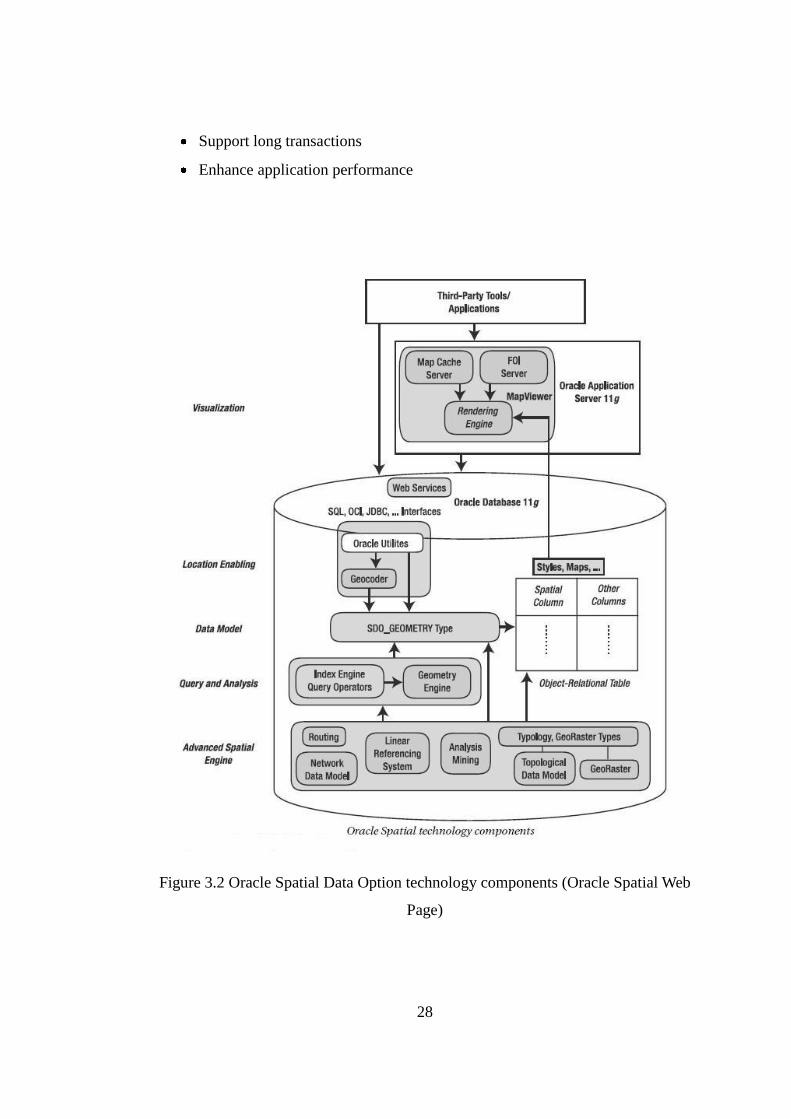
web pages. Figure 3.2 depicts the components of this technology. Figure 3.3 shows
the elements of the SDO_Geometry type.
Oracle Locator has the following features:
Store and index vector geometries in the database
Query nearest neighbor and other spatial relationships between geometries
Perform location queries on relational information not stored in Oracle
Spatial geometry
28
Support long transactions
Enhance application performance
Figure 3.2 Oracle Spatial Data Option technology components (Oracle Spatial Web
Page)
29
Oracle Spatial has the following features:
Everything that Oracle Locator does, and:
Perform length and area calculations on geometries
Generate new geometries such as buffers and unions
Perform coordinate systems transformations, for individual geometries or
entire layers
Store linear measure information
Figure 3.3. Explanation of Oracle SDO Geometry Object Type Elements (Oracle
Spatial Web Page)
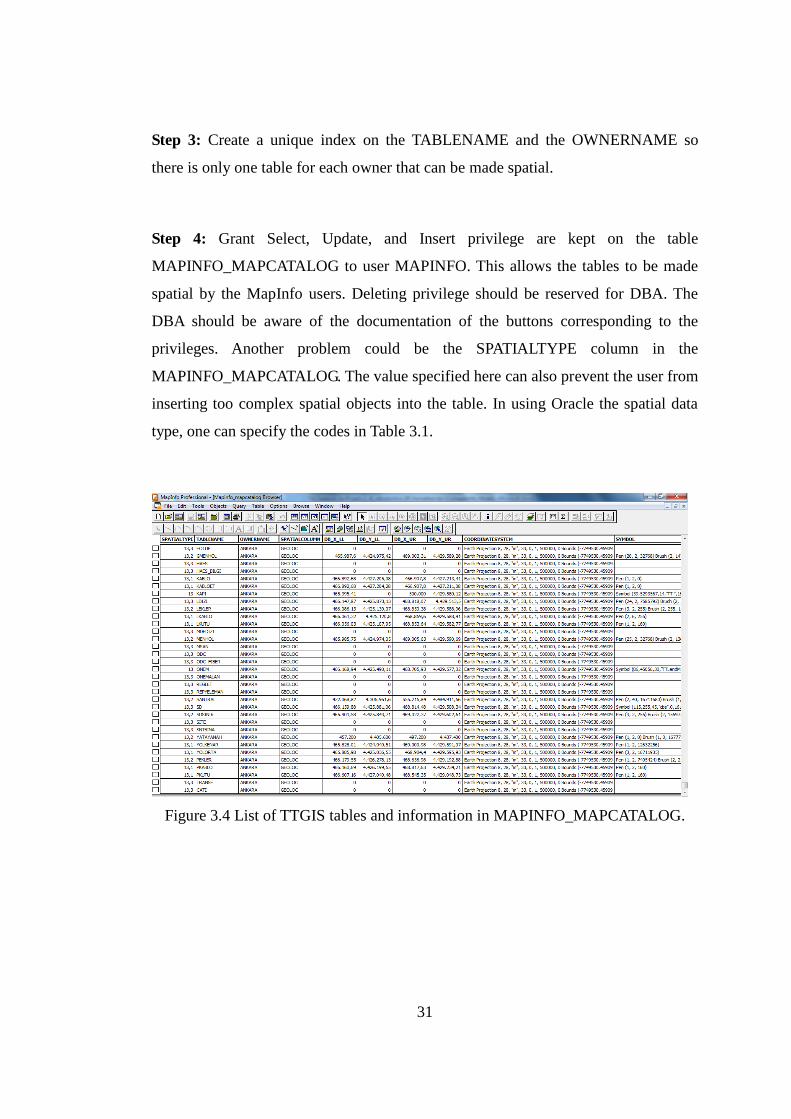
3.1.5 MapInfo MapCatalog
MapInfo MapCatalog table is used to store spatial table information in
Oracle. In this table Spatial type, Layer/Table name, Oracle Owner name, Column
name that stores spatial data, minimum and maximum boundary coordinates,
Coordinate System, and style information are stored. The catalog information is
given in Figure 3.4.

30
The steps of manual creation of MapInfo MapCatalog are explained as
follows.
Step 1: Login to database with a user, which has Database Administrator (DBA)
access rights. Create a user named “MAPINFO” with password “MAPINFO” in the
database where the mappable tables will be located.
Create User MAPINFO identified by MAPINFO
Step 2: Create the table named MAPINFO_MAPCATALOG in the database. The
Create table statement needs to be equivalent to this MapInfo create statement for the
specific remote database. It is important to have the structure of the table exactly like
the given statement.
Create Table MAPINFO_MAPCATALOG (
SPATIALTYPE Float,
TABLENAME Char(32),
OWNERNAME Char(32),
SPATIALCOLUMN Char(32),
DB_X_LL Float,
DB_Y_LL Float,
DB_X_UR Float,
DB_Y_UR Float,
COORDINATESYSTEM Char(254),
SYMBOL Char(254),
XCOLUMNNAME Char(32),
YCOLUMNNAME Char(32) )
31
Step 3: Create a unique index on the TABLENAME and the OWNERNAME so
there is only one table for each owner that can be made spatial.
Step 4: Grant Select, Update, and Insert privilege are kept on the table
MAPINFO_MAPCATALOG to user MAPINFO. This allows the tables to be made
spatial by the MapInfo users. Deleting privilege should be reserved for DBA. The
DBA should be aware of the documentation of the buttons corresponding to the
privileges. Another problem could be the SPATIALTYPE column in the
MAPINFO_MAPCATALOG. The value specified here can also prevent the user from
inserting too complex spatial objects into the table. In using Oracle the spatial data
type, one can specify the codes in Table 3.1.
Figure 3.4 List of TTGIS tables and information in MAPINFO_MAPCATALOG.
32
Table 3.1 List of spatial data types codes and Object types that can be stored
SPATIALTYPE Code Object Types
13.0 Only Points
13.1 Only Lines
13.2 Only Regions/Polygons
13.3 Mixture of object types is possible
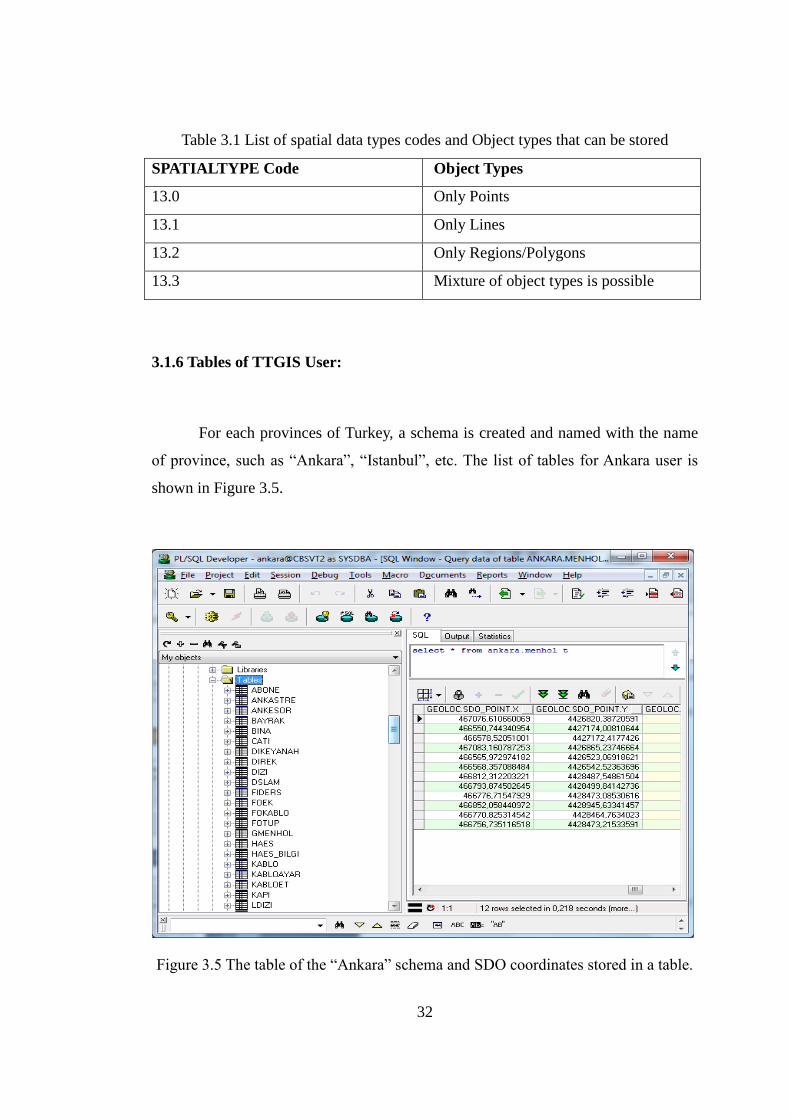
3.1.6 Tables of TTGIS User:
For each provinces of Turkey, a schema is created and named with the name
of province, such as “Ankara”, “Istanbul”, etc. The list of tables for Ankara user is
shown in Figure 3.5.
Figure 3.5 The table of the “Ankara” schema and SDO coordinates stored in a table.
33
The operators have a username and password to connect to the system. The
users are granted to select, insert, delete and update tables either by Oracle user
management tools or in batch mode.
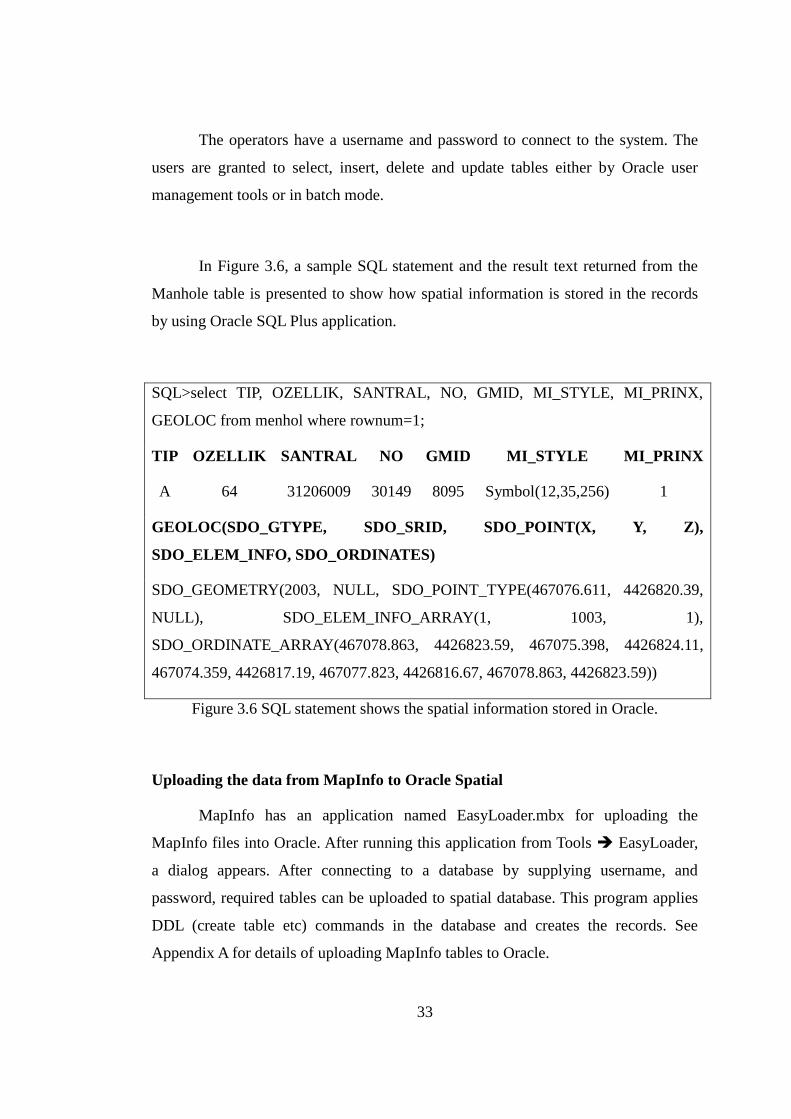
In Figure 3.6, a sample SQL statement and the result text returned from the
Manhole table is presented to show how spatial information is stored in the records
by using Oracle SQL Plus application.
SQL>select TIP, OZELLIK, SANTRAL, NO, GMID, MI_STYLE, MI_PRINX,
GEOLOC from menhol where rownum=1;
TIP OZELLIK SANTRAL NO GMID MI_STYLE MI_PRINX
A 64 31206009 30149 8095 Symbol(12,35,256) 1
GEOLOC(SDO_GTYPE, SDO_SRID, SDO_POINT(X, Y, Z),
SDO_ELEM_INFO, SDO_ORDINATES)
SDO_GEOMETRY(2003, NULL, SDO_POINT_TYPE(467076.611, 4426820.39,
NULL), SDO_ELEM_INFO_ARRAY(1, 1003, 1),
SDO_ORDINATE_ARRAY(467078.863, 4426823.59, 467075.398, 4426824.11,
467074.359, 4426817.19, 467077.823, 4426816.67, 467078.863, 4426823.59))
Figure 3.6 SQL statement shows the spatial information stored in Oracle.
Uploading the data from MapInfo to Oracle Spatial
MapInfo has an application named EasyLoader.mbx for uploading the
MapInfo files into Oracle. After running this application from Tools EasyLoader,
a dialog appears. After connecting to a database by supplying username, and
password, required tables can be uploaded to spatial database. This program applies
DDL (create table etc) commands in the database and creates the records. See
Appendix A for details of uploading MapInfo tables to Oracle.
34
Opening Oracle Data in MapInfo
Before connecting to Oracle using any application someone will need to:
Install the Oracle Client, preferably the Oracle Instant Client 10.x.
Setup the client by building TNSNAMES.ORA file.
Connecting to Oracle Databases to download tables
In order to retrieve a table from a remote database, an Oracle spatial
connection needs to be performed. The new DBMS connection is made as follows:
1. File > Open DBMS Connection should be chosen. Open DBMS Connection
dialog box displays.
2. ODBC or Oracle Spatial option is chosen from the Connection Type drop-down
list. If only one driver type is available the control is disabled and the Select Data
Source dialog box can be used directly otherwise:
3. New button is pressed. MapInfo Oracle Connect dialog box displays.
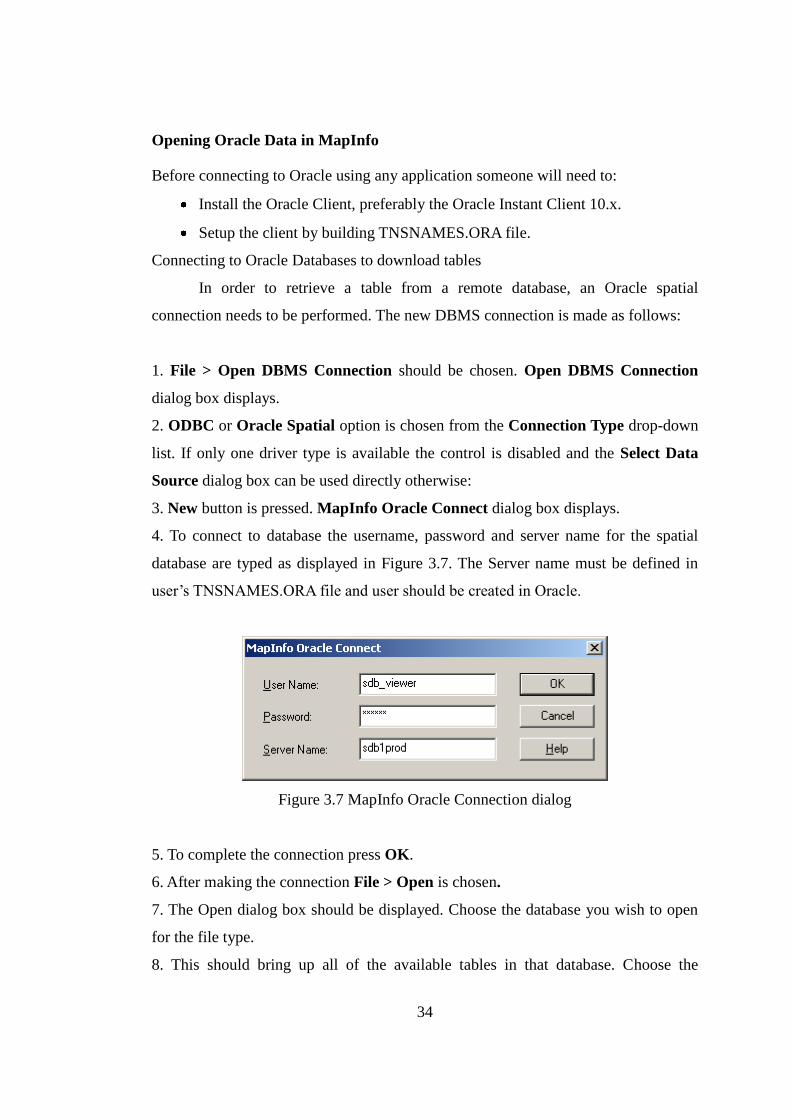
4. To connect to database the username, password and server name for the spatial
database are typed as displayed in Figure 3.7. The Server name must be defined in
user’s TNSNAMES.ORA file and user should be created in Oracle.
Figure 3.7 MapInfo Oracle Connection dialog
5. To complete the connection press OK.
6. After making the connection File > Open is chosen.
7. The Open dialog box should be displayed. Choose the database you wish to open
for the file type.
8. This should bring up all of the available tables in that database. Choose the
35
connected username as in the Owner: select box at the top of the dialogue.
9. The layer that is needed to download is chosen.
10. The Open DBMS table option dialog box will appear. Choose standard mode,
download the data (link table) for the options and define a destination location for the
TAB file.
11. Click OK to complete.
The structure of the TAB file is shown in Appendix B.
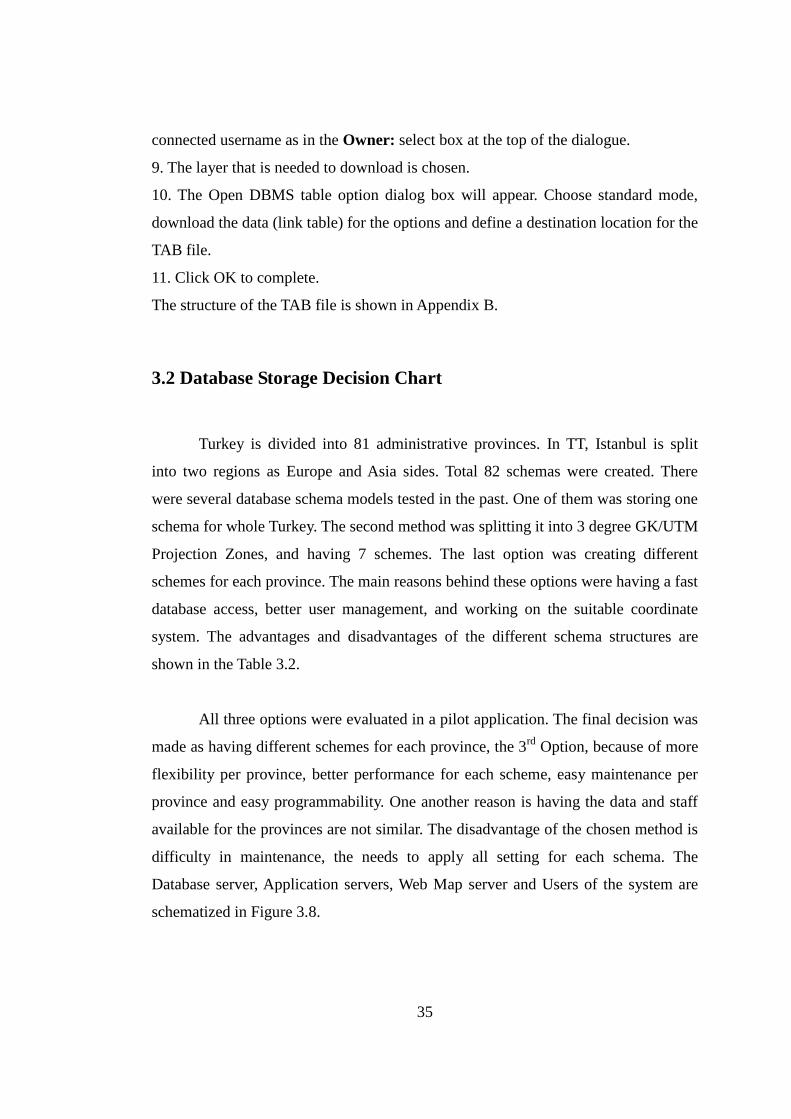
3.2 Database Storage Decision Chart
Turkey is divided into 81 administrative provinces. In TT, Istanbul is split
into two regions as Europe and Asia sides. Total 82 schemas were created. There
were several database schema models tested in the past. One of them was storing one
schema for whole Turkey. The second method was splitting it into 3 degree GK/UTM
Projection Zones, and having 7 schemes. The last option was creating different
schemes for each province. The main reasons behind these options were having a fast
database access, better user management, and working on the suitable coordinate
system. The advantages and disadvantages of the different schema structures are
shown in the Table 3.2.
All three options were evaluated in a pilot application. The final decision was
made as having different schemes for each province, the 3rd
Option, because of more
flexibility per province, better performance for each scheme, easy maintenance per
province and easy programmability. One another reason is having the data and staff
available for the provinces are not similar. The disadvantage of the chosen method is
difficulty in maintenance, the needs to apply all setting for each schema. The
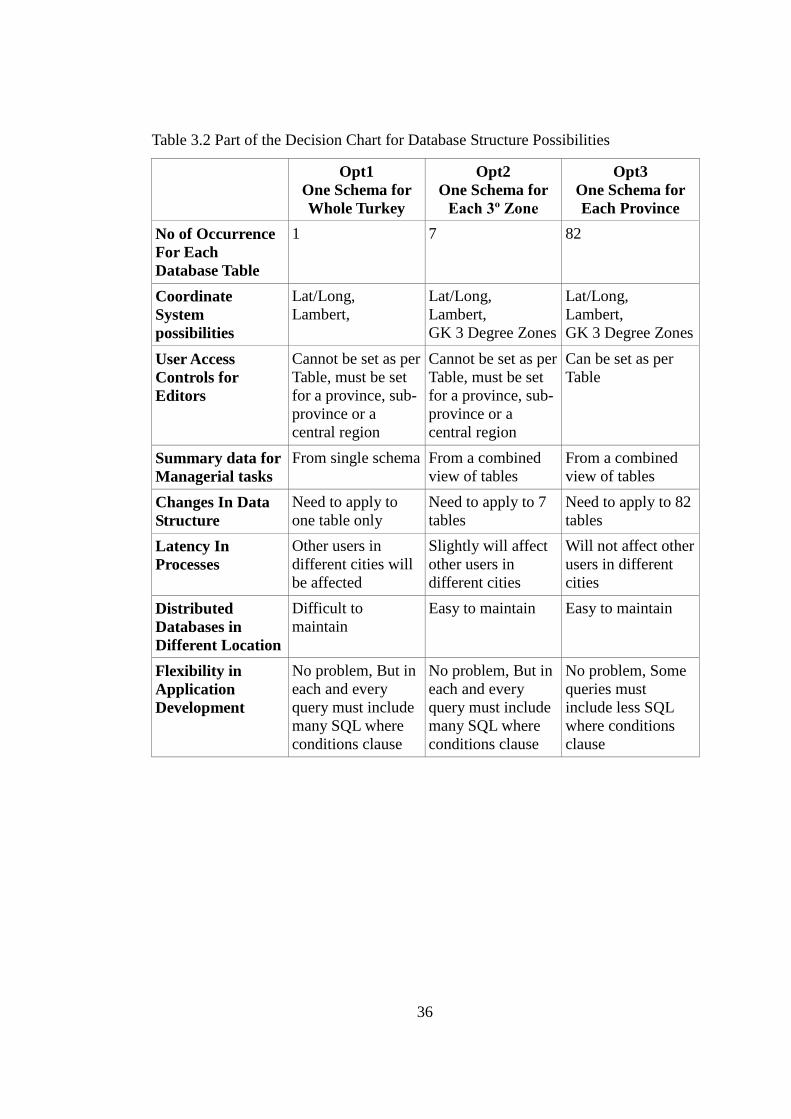
Database server, Application servers, Web Map server and Users of the system are
schematized in Figure 3.8.
36
Table 3.2 Part of the Decision Chart for Database Structure Possibilities
Opt1
One Schema for
Whole Turkey
Opt2
One Schema for
Each 3º Zone
Opt3
One Schema for
Each Province
No of Occurrence
For Each
Database Table
1 7 82
Coordinate
System
possibilities
Lat/Long,
Lambert,
Lat/Long,
Lambert,
GK 3 Degree Zones
Lat/Long,
Lambert,
GK 3 Degree Zones
User Access
Controls for
Editors
Cannot be set as per
Table, must be set
for a province, sub-
province or a
central region
Cannot be set as per
Table, must be set
for a province, sub-
province or a
central region
Can be set as per
Table
Summary data for
Managerial tasks
From single schema From a combined
view of tables
From a combined
view of tables
Changes In Data
Structure
Need to apply to
one table only
Need to apply to 7
tables
Need to apply to 82
tables
Latency In
Processes
Other users in
different cities will
be affected
Slightly will affect
other users in
different cities
Will not affect other
users in different
cities
Distributed
Databases in
Different Location
Difficult to
maintain
Easy to maintain Easy to maintain
Flexibility in
Application
Development
No problem, But in
each and every
query must include
many SQL where
conditions clause
No problem, But in
each and every
query must include
many SQL where
conditions clause
No problem, Some
queries must
include less SQL
where conditions
clause
37
Figure 3.8 TTGIS System Architecture
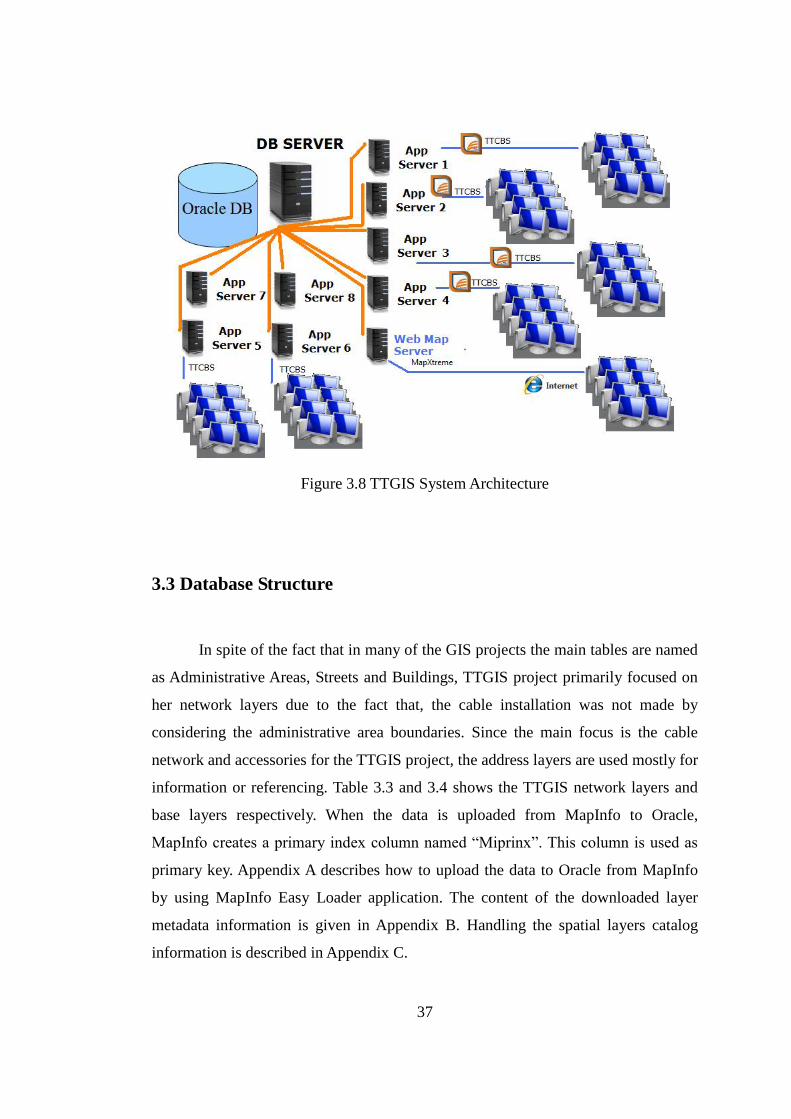
3.3 Database Structure
In spite of the fact that in many of the GIS projects the main tables are named
as Administrative Areas, Streets and Buildings, TTGIS project primarily focused on
her network layers due to the fact that, the cable installation was not made by
considering the administrative area boundaries. Since the main focus is the cable
network and accessories for the TTGIS project, the address layers are used mostly for
information or referencing. Table 3.3 and 3.4 shows the TTGIS network layers and
base layers respectively. When the data is uploaded from MapInfo to Oracle,
MapInfo creates a primary index column named “Miprinx”. This column is used as
primary key. Appendix A describes how to upload the data to Oracle from MapInfo
by using MapInfo Easy Loader application. The content of the downloaded layer
metadata information is given in Appendix B. Handling the spatial layers catalog
information is described in Appendix C.
38
Table 3.3 The Cable Network and Accessories tables/layers used in project database:
Name In
Turkish
Table Name Description/ Usage Primary
Key
Object
Type
Ankastre Ankastre The mechanism of
building telecom cable
infrastructure
Miprinx Point
Ankesor Ankesor Phones in the
Streets/Public Areas
Miprinx Point
Bayrak Flag The holes within the
trench
Miprinx Point
Cati Roof Repartitor detail Miprinx Point
Direk Pole Pole Miprinx Point
Dizi Sequence Local cable
sequence(A,B)
Fider Feeders The feeders from box to
building
Miprinx Line
Gmenhol Real Manhole The real manhole
location.
Miprinx Point
Kablo Cable The cable path and
information
Miprinx Line
Kabloayar CableSettings Cable settings lookup
table
Id -
KabloEt CableThickness Cable Thickness lookup Id -
Kapi Building Entries Door number Miprinx Point
Menhol Manhole Manhole Layer Miprinx
Proje Projects Project Layer Miprinx Line
ProjeSinir ProjectBoundary Project Boundary Layer Miprinx Area
Santral Central Region Central region layer Miprinx,
Santral_ID
Region
SD FieldBox Field Service Box Miprinx, Point
SDSinir Field Box
Service Region
Field Box Boundary Miprinx, Region
SntBina Central Building Central Building layer Miprinx, Region
Transe Trench Trench that carries cables Miprinx, Line
39
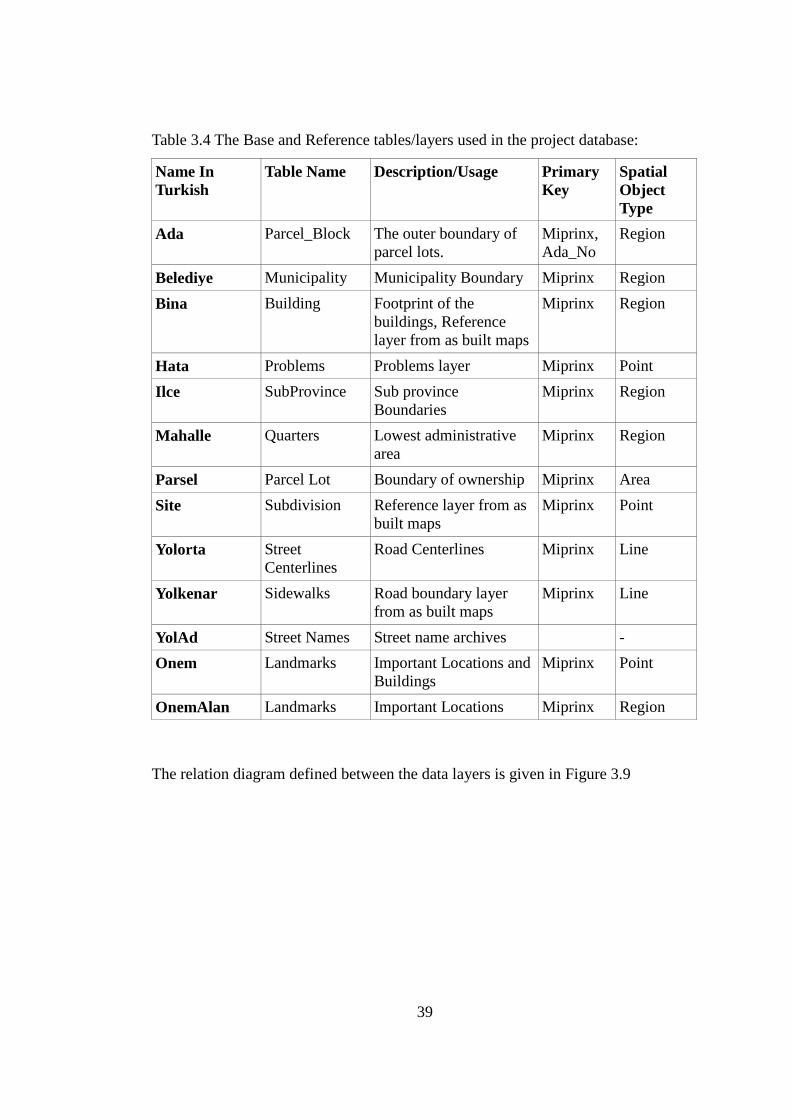
Table 3.4 The Base and Reference tables/layers used in the project database:
Name In
Turkish
Table Name Description/Usage Primary
Key
Spatial
Object
Type
Ada Parcel_Block The outer boundary of
parcel lots.
Miprinx,
Ada_No
Region
Belediye Municipality Municipality Boundary Miprinx Region
Bina Building Footprint of the
buildings, Reference
layer from as built maps
Miprinx Region
Hata Problems Problems layer Miprinx Point
Ilce SubProvince Sub province
Boundaries
Miprinx Region
Mahalle Quarters Lowest administrative
area
Miprinx Region
Parsel Parcel Lot Boundary of ownership Miprinx Area
Site Subdivision Reference layer from as
built maps
Miprinx Point
Yolorta Street
Centerlines
Road Centerlines Miprinx Line
Yolkenar Sidewalks Road boundary layer
from as built maps
Miprinx Line
YolAd Street Names Street name archives -
Onem Landmarks Important Locations and
Buildings
Miprinx Point
OnemAlan Landmarks Important Locations Miprinx Region
The relation diagram defined between the data layers is given in Figure 3.9
40
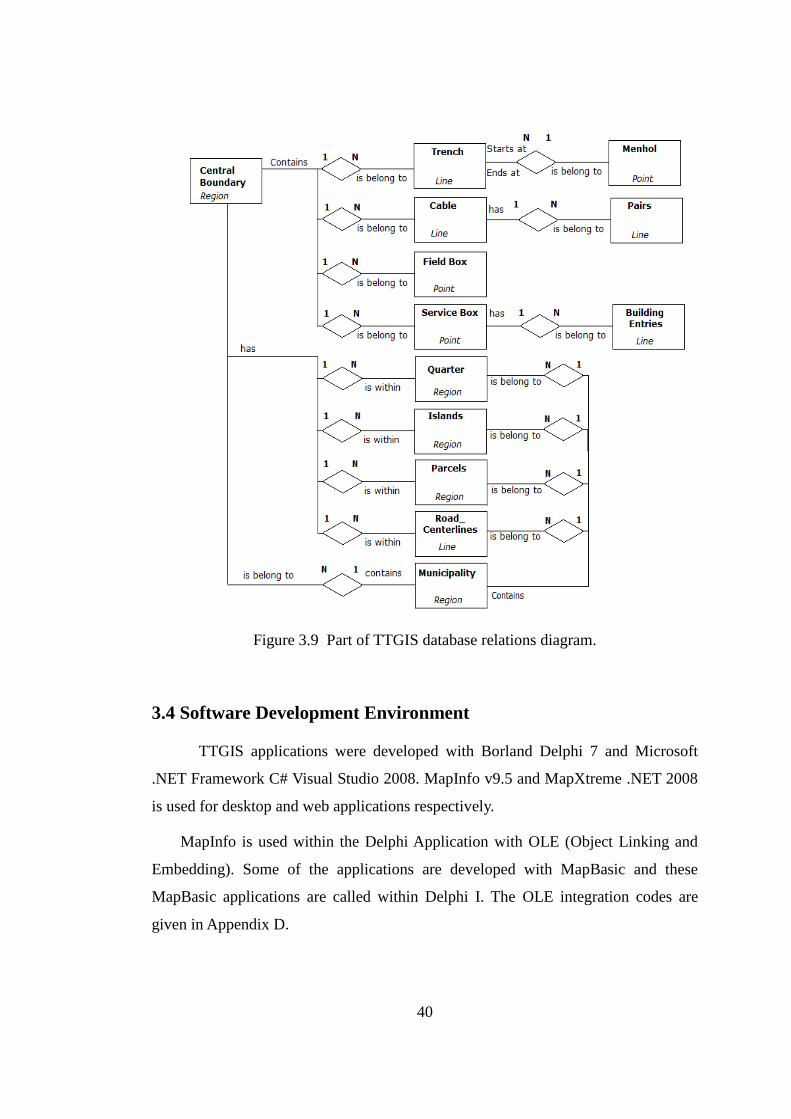
Figure 3.9 Part of TTGIS database relations diagram.
3.4 Software Development Environment
TTGIS applications were developed with Borland Delphi 7 and Microsoft
.NET Framework C# Visual Studio 2008. MapInfo v9.5 and MapXtreme .NET 2008
is used for desktop and web applications respectively.
MapInfo is used within the Delphi Application with OLE (Object Linking and
Embedding). Some of the applications are developed with MapBasic and these
MapBasic applications are called within Delphi I. The OLE integration codes are
given in Appendix D.
41
CHAPTER 4
GIS APPLICATIONS
In this study, several applications depending on the organization of TT
departments are developed. There are data entering people in TT. The first group of
staff is drawing spot maps, another group was drawing infrastructure elements and
cables. A third group was working on drawing Fiber Optical cables. A separate group
was working on new projects, and they needed a special application for cost
calculations. For managers, web-monitoring application has been developed which is
used to view either the whole Turkey infrastructure, or only a city or a part of
database, and to make spatial analysis on them. The web monitoring application is
also used for spatial decision support system.
After drawing the physical network of the system, it became possible to calculate
the ADSL speeds on real network and a calculation tool is developed. This tool is
also used for spatial decision support system whether or not to replace the
infrastructure with F/O cables.
TT has got many contracts for implementation of security systems called
MOBESE (Mobile Information and Electronic System Integration) for security
departments. MOBESE systems use security cameras installed in the important
locations of the city. The Dial 155 Police hotline department uses these cameras.
They need to know the location of the camera. They also need to know the location
of the caller. The fix phone subscribers are geo-coded by using their addresses and
service box numbers. Subscriber coordinates could be provided to other emergency
department hotlines since subscribers are located on the map. This tool needs a
hardware installation on the hotline central, to convert dialer number into digital

42
format, so the application can automatically asks the coordinate of the caller.
The main applications in TTGIS system are listed below.
As Built Drawing and Data Entry Application (Spot)
Cable Drawing and Data Entry Applications
- Infrastructure Drawing
- Copper Cable
- Fiber Optic Cable
Project Preparation Application
Web Monitoring Application
ADSL Capacity Application
Providing Coordinate of Fix Phone Number as a Service
4.1 As Built Drawing and Data Entry Application (Spot)
This application is used to:
Draw buildings and roads from as-built maps and plans which are scanned or
translated from CAD into GIS format
Enter building type, no of floors, no of flats and no of shops in the building
Enter street name
Draw boundaries of municipalities, central service regions
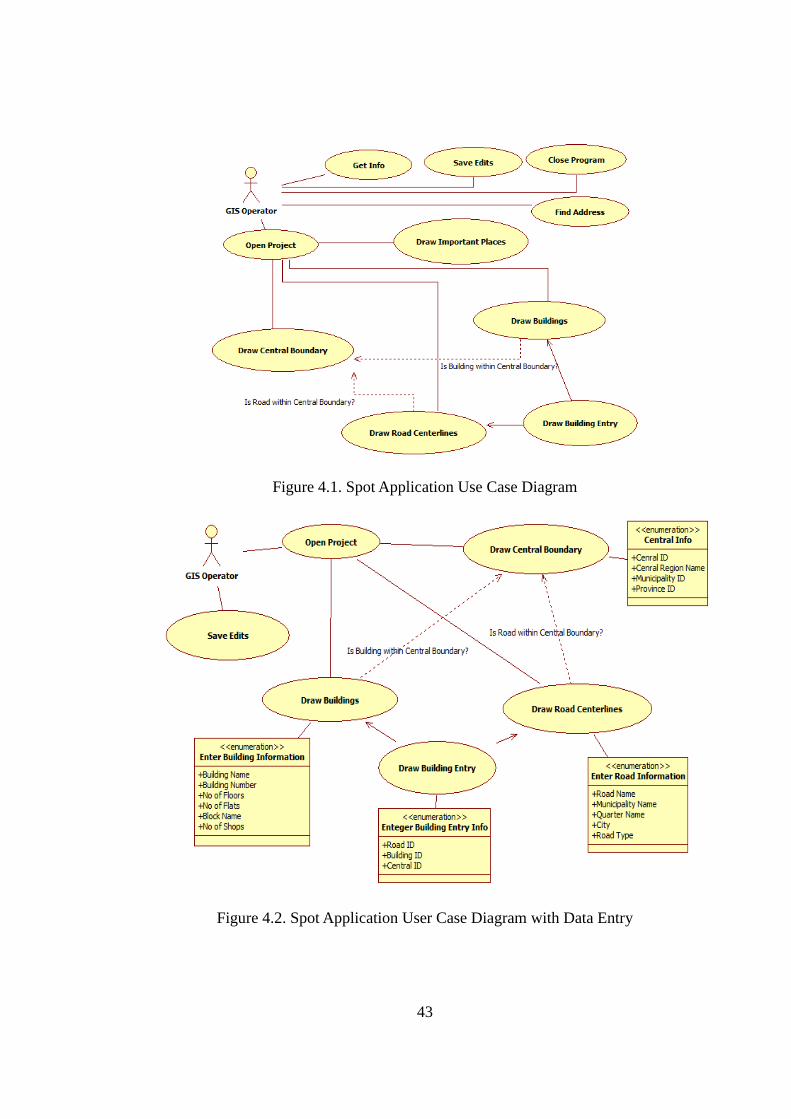
The user case UML diagram for spot application is given in Figure 4.1 and user
case data entry diagram is given in Figure 4.2.
43
Figure 4.1. Spot Application Use Case Diagram
Figure 4.2. Spot Application User Case Diagram with Data Entry

44
4.2 Cable Drawing and Data Entry Applications
Copper cables are divided into two groups as local and principal cables.
Principal cables between the centrals and local cables are from centrals to the field
boxes.
4.2.1 Infrastructure and Accessories
Manhole, Trench, Field Box, Service Box, Pole and their detailed drawings
are made in the application. Each item is stored in a proper table with its attribute
table. The drawing procedure is given in Figure 4.3.
The drawing starts with Central Building Boundary, and it is drawn by a
super user or moderator. Central Building is drawn first, then Repartitor is drawn (see
Figure 4.4), Manhole and trench are drawn, and then Fuses are drawn (1 to 18 with
1800 pair capacity for each fuse, named from A to U), Field box and Principal cables
(between Central building and Field Box) are drawn, then Field box Series are drawn
(A, B, C to O). Each Letter conveys 100 pairs, and each 10 pair is represented with a
number from A-1 to A-10, then service box and local cable between SB and Field
box are drawn. Then ankastre is drawn and it is connected to service box. The
telephone, fax, internet, cable TV etc are connected to the ankastre from each flat.
There is another type of cable called Rigid Cable infrastructure drawing,
which is explained below:
Central Building is drawn,
Repartitor is drawn,
Manholes and trenches are drawn

45
Fuse and principle cables are drawn,
Rigid cables are drawn to Subscriber Service Box directly.
4.2.2 Copper Cable Drawing Application
The copper cables consist of principal and local cables. The cable could be
buried in trenches or hanged between the poles. The cable consists of several “pairs”
divided into groups of hundreds and tens. As an example: a cable exit from Central
Building, with a capacity of 1800 pairs, it will split into several branches of hundreds
and each branch split into tens and end in the building service box. The tens of pairs
are connected to the flats as one or more pairs.
This application is used to split and distribute the cables along the trenches
and field boxes. Each branch has a naming convention such as A, B,C ...etc. Then it
is split into A1, A2, A3, etc. The drawings are made in a topological order so each
customer connection could be traced up to the main central. A real object
representation of the drawing is depicted in Figure 4.3. The application and sample
drawing of a Central is shown in Figure 4.4.
To start drawing an infrastructure element, the Region of the Central must be
defined first (Figure 4.5). The Use Case and the work flow diagram of the cable
drawing application are shown in Figure 4.6 and Figure 4.7 respectively. The user’s
responsibility area must be defined in User Rights table. The drawing should start
from Building of the Central and continue by adding Manholes, Poles, Field Boxes,
Service Boxes, Feeders and Trenches between the manholes. The cables between all
of the above elements should be drawn from Source to destination (e.g. from
Pole/Manhole to Pole/Manhole, from Pole/Manhole to Field Box, From Field Box to
Service Box, the Feeders) should be drawn from service box to building.
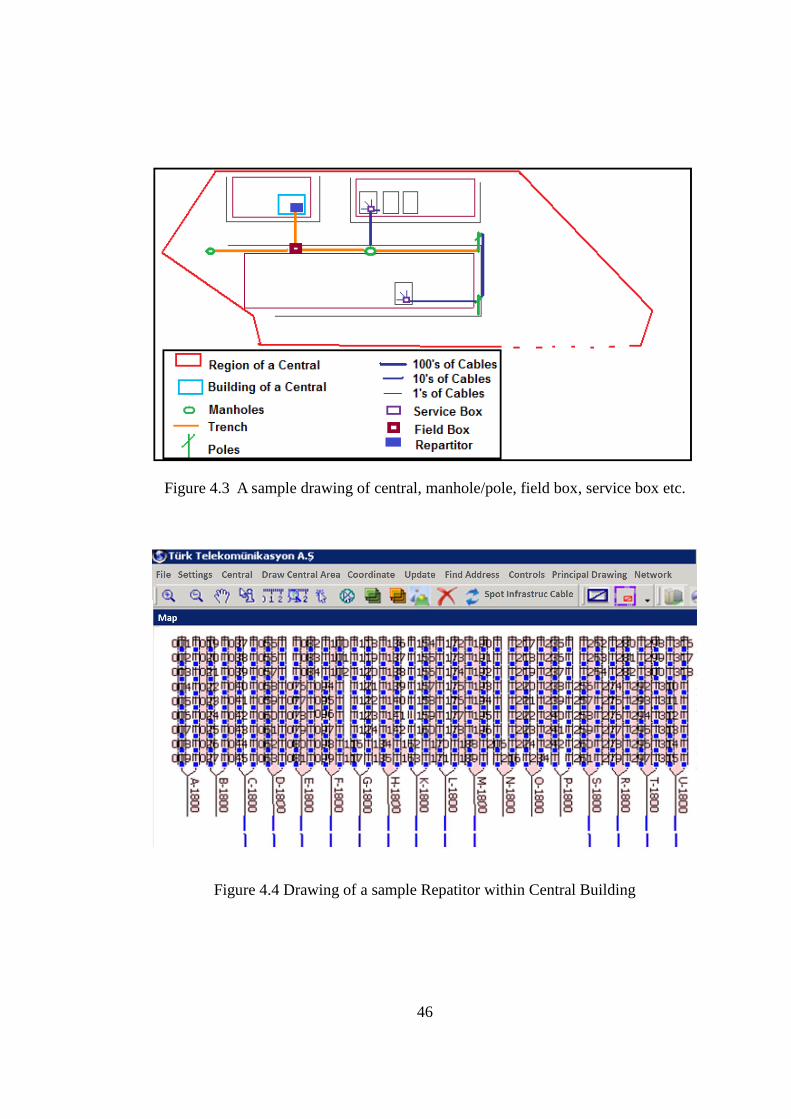
46
Figure 4.3 A sample drawing of central, manhole/pole, field box, service box etc.
Figure 4.4 Drawing of a sample Repatitor within Central Building
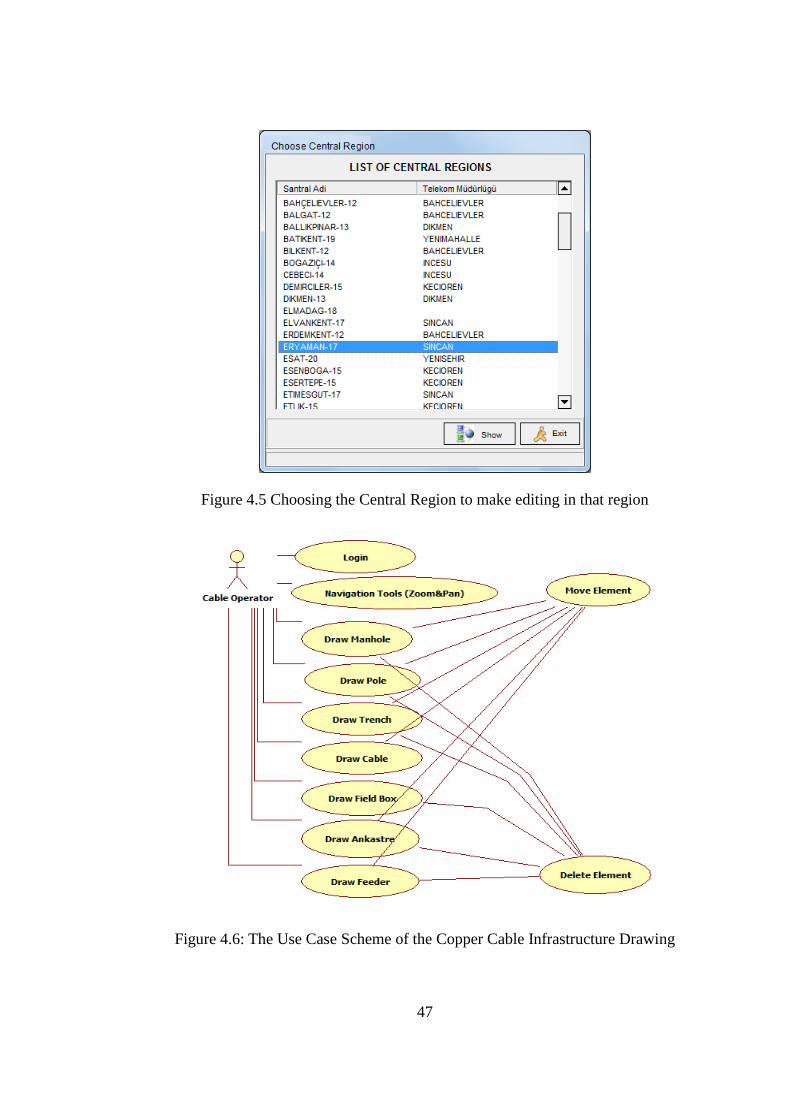
47
Figure 4.5 Choosing the Central Region to make editing in that region
Figure 4.6: The Use Case Scheme of the Copper Cable Infrastructure Drawing
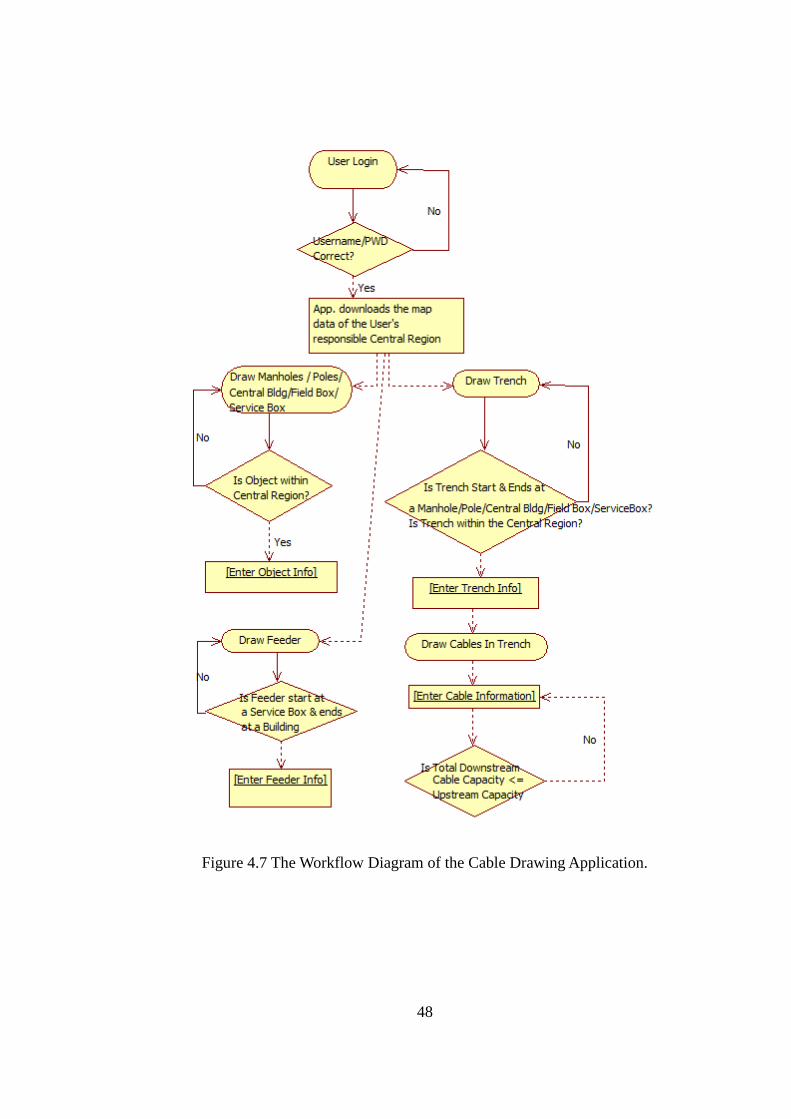
48
Figure 4.7 The Workflow Diagram of the Cable Drawing Application.

49
4.2.3 Fiber Optic Cable Drawing Application
Fiber Optic module (Figure 4.8 a and b) is created to digitize F/O cable
infrastructure. An optical fiber (or fibre), which is a glass or plastic fiber, that carries
light along its length. Fiber optic is the overlap of applied science and engineering
concerned with the design and application of optical fibers. Optical fibers (which
permits transmission over longer distances and at higher bandwidths or data rates
than other forms of communications) are widely used in fiber-optic communications.
Fibers are used instead of metal wires because signals travel along them with less
loss, and they are also immune to electromagnetic interference. Fibers are also used
for illumination, and are wrapped in bundles so they can be used to carry images,
thus allowing viewing in tight spaces. Specially designed fibers are used for a variety
of other applications, including sensors and fiber lasers.
Fiber optical cables does not have pairs and can be freely connected to
another F/O cable, and due to that tracing logic is different than the one for copper
cable network. Unlike the Copper Cable, which allows only one connection over a
pair of cables, F/O cables can serve many connections over each fiber.
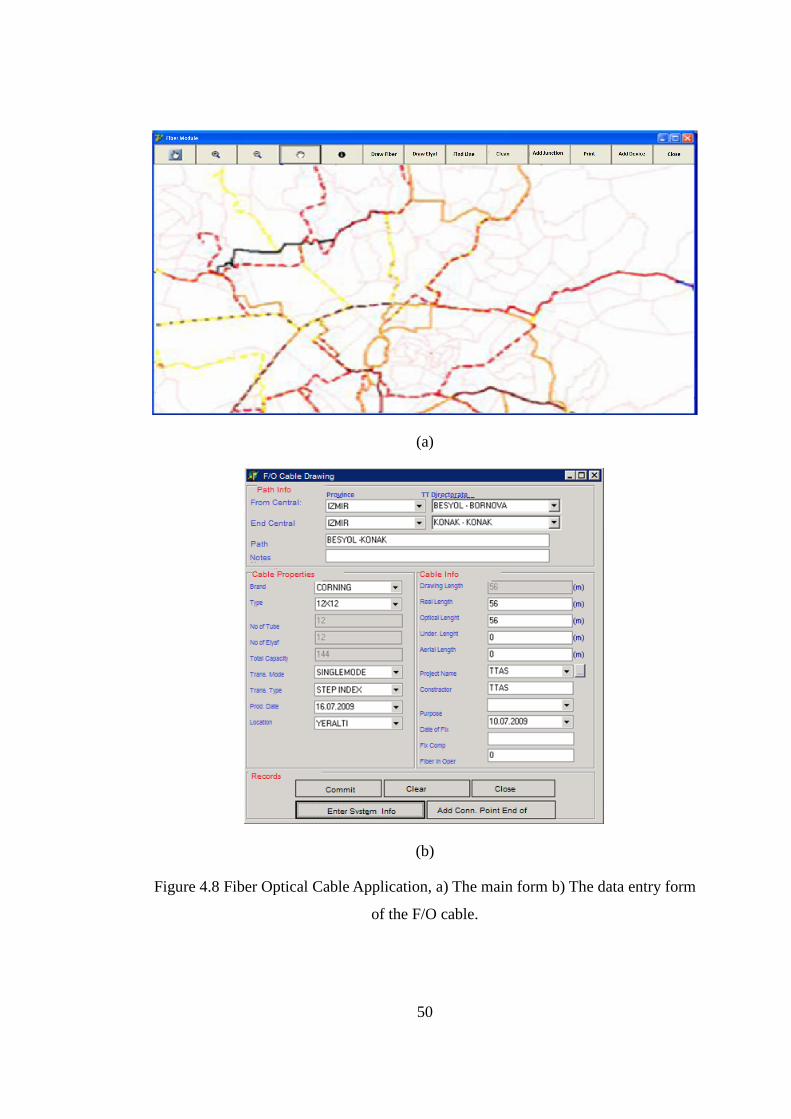
50
(a)
(b)
Figure 4.8 Fiber Optical Cable Application, a) The main form b) The data entry form
of the F/O cable.
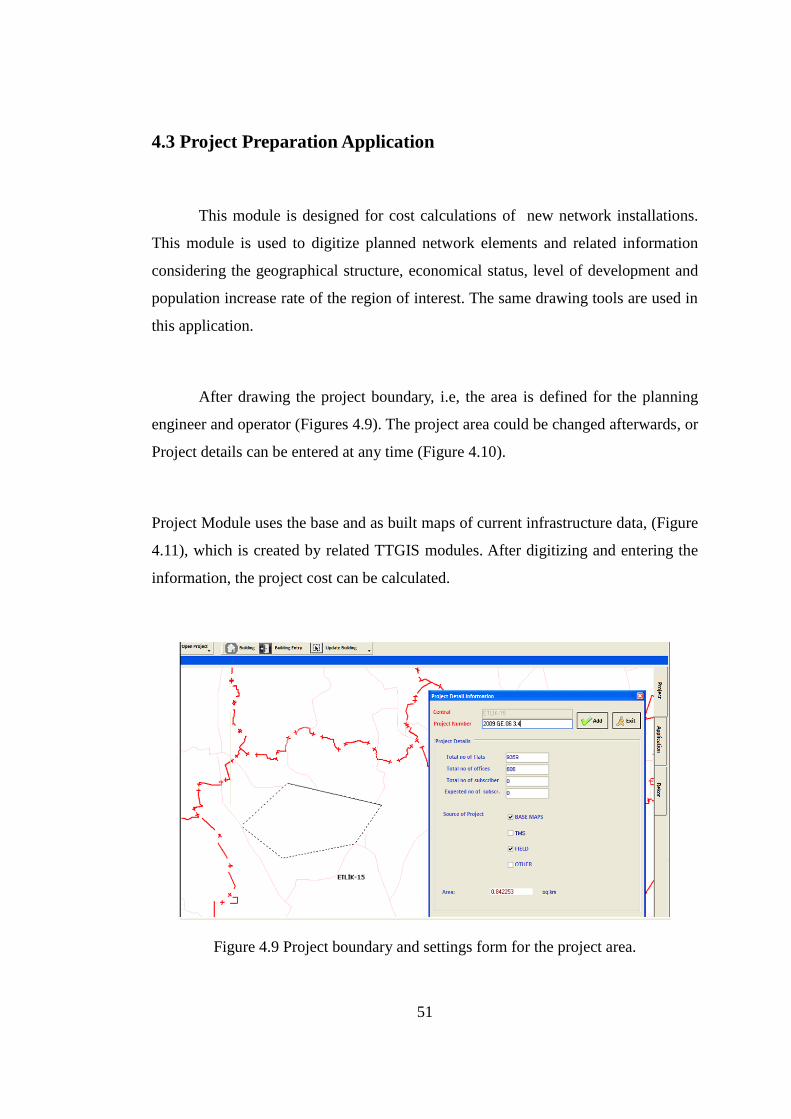
51
4.3 Project Preparation Application
This module is designed for cost calculations of new network installations.
This module is used to digitize planned network elements and related information
considering the geographical structure, economical status, level of development and
population increase rate of the region of interest. The same drawing tools are used in
this application.
After drawing the project boundary, i.e, the area is defined for the planning
engineer and operator (Figures 4.9). The project area could be changed afterwards, or
Project details can be entered at any time (Figure 4.10).
Project Module uses the base and as built maps of current infrastructure data, (Figure
4.11), which is created by related TTGIS modules. After digitizing and entering the
information, the project cost can be calculated.
Figure 4.9 Project boundary and settings form for the project area.
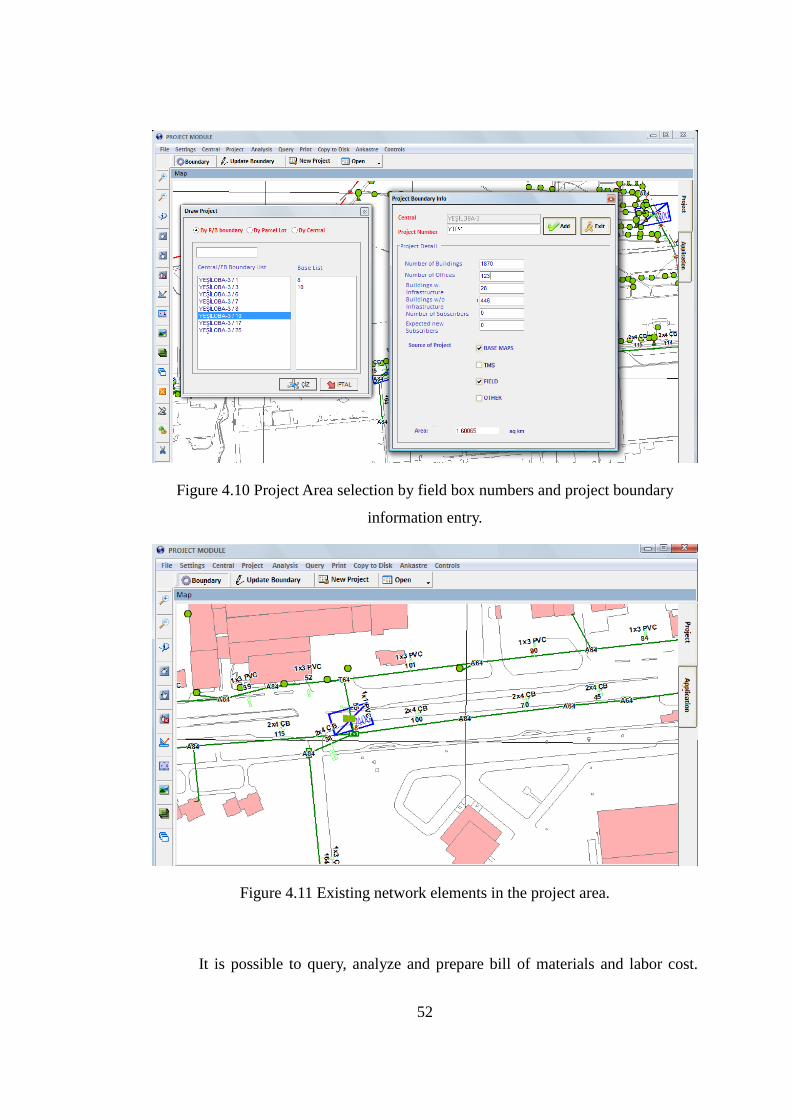
52
Figure 4.10 Project Area selection by field box numbers and project boundary
information entry.
Figure 4.11 Existing network elements in the project area.
It is possible to query, analyze and prepare bill of materials and labor cost.
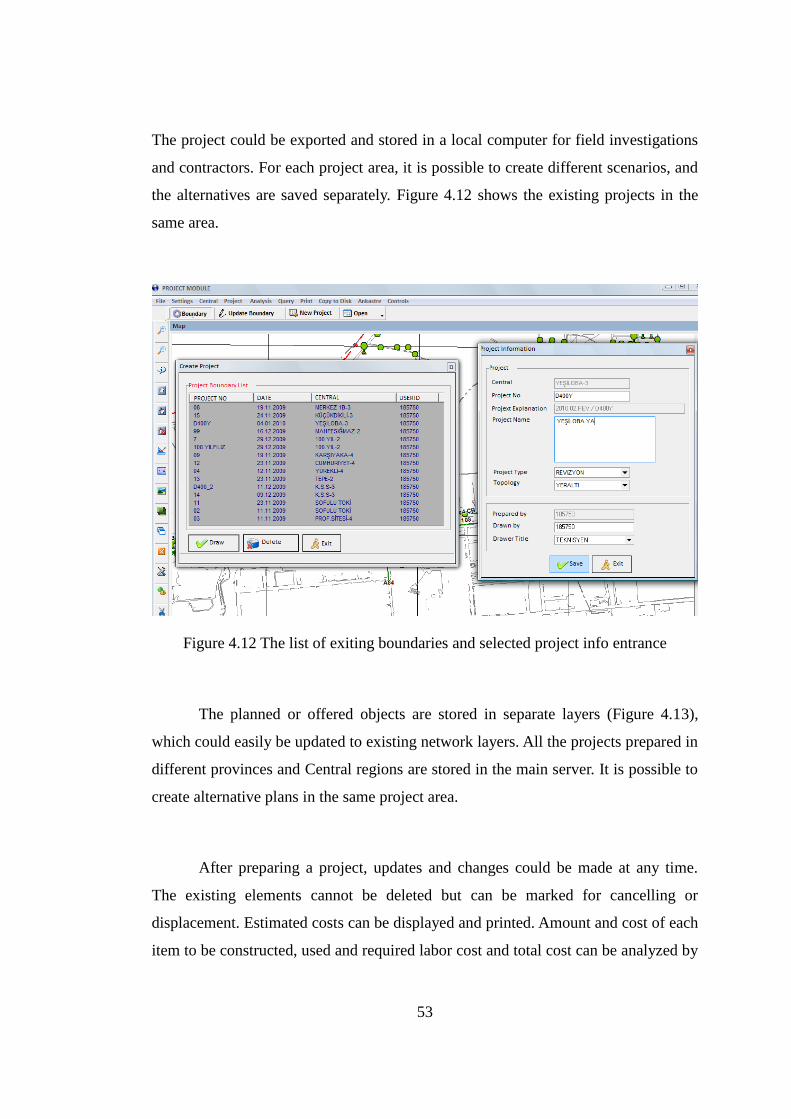
53
The project could be exported and stored in a local computer for field investigations
and contractors. For each project area, it is possible to create different scenarios, and
the alternatives are saved separately. Figure 4.12 shows the existing projects in the
same area.
Figure 4.12 The list of exiting boundaries and selected project info entrance
The planned or offered objects are stored in separate layers (Figure 4.13),
which could easily be updated to existing network layers. All the projects prepared in
different provinces and Central regions are stored in the main server. It is possible to
create alternative plans in the same project area.
After preparing a project, updates and changes could be made at any time.
The existing elements cannot be deleted but can be marked for cancelling or
displacement. Estimated costs can be displayed and printed. Amount and cost of each
item to be constructed, used and required labor cost and total cost can be analyzed by
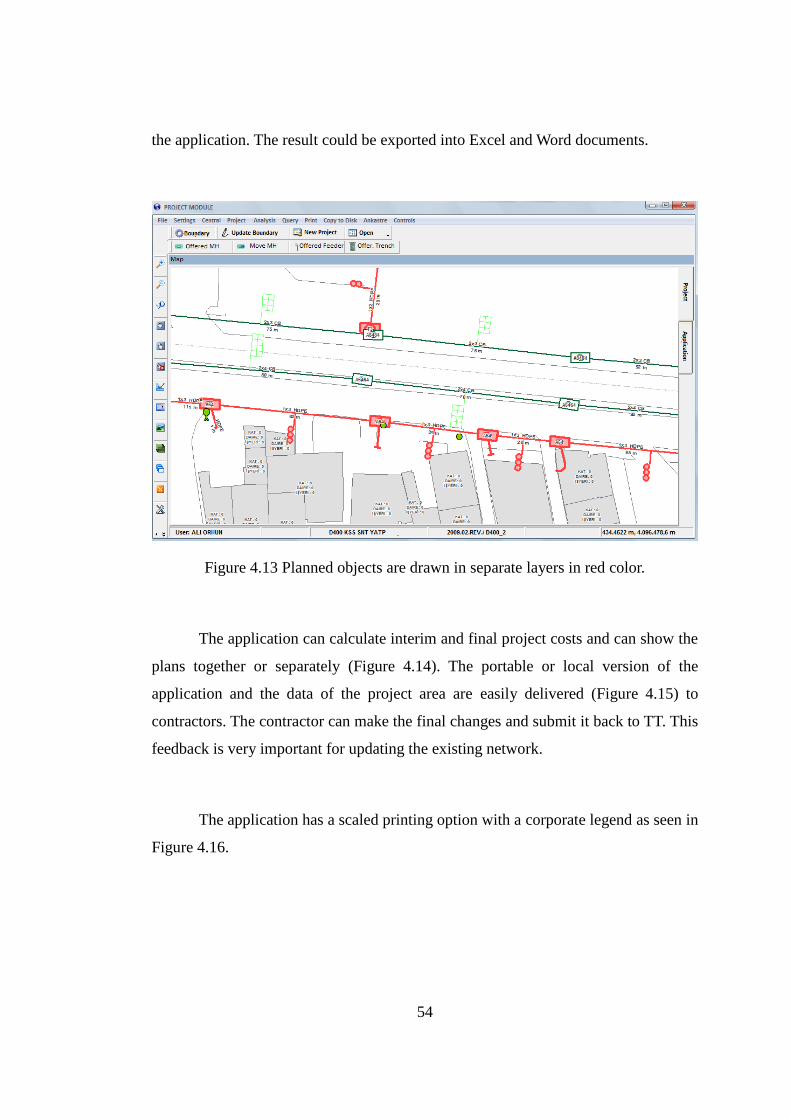
54
the application. The result could be exported into Excel and Word documents.
Figure 4.13 Planned objects are drawn in separate layers in red color.
The application can calculate interim and final project costs and can show the
plans together or separately (Figure 4.14). The portable or local version of the
application and the data of the project area are easily delivered (Figure 4.15) to
contractors. The contractor can make the final changes and submit it back to TT. This
feedback is very important for updating the existing network.
The application has a scaled printing option with a corporate legend as seen in
Figure 4.16.
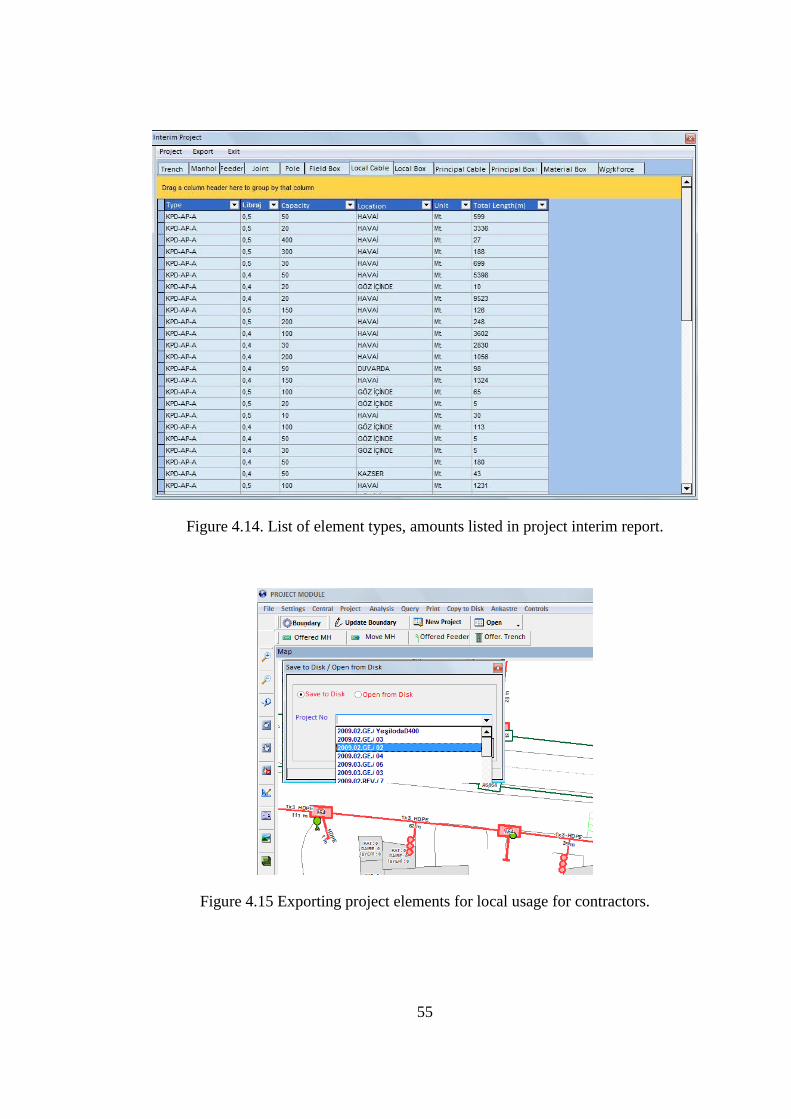
55
Figure 4.14. List of element types, amounts listed in project interim report.
Figure 4.15 Exporting project elements for local usage for contractors.

56
Figure 4.16. Scaled print out preparation with the legend specific to TT
4.4 Web Monitoring and Spatial Decision Support Application
This module is designed for managerial purposes and used for spatial
decision support system. The whole network coverage in Turkey can be monitored
within this application. The complete TT infrastructure of Turkey, or any region, any
province, any municipality, any Central region or any street can be seen and queried
by using this application.
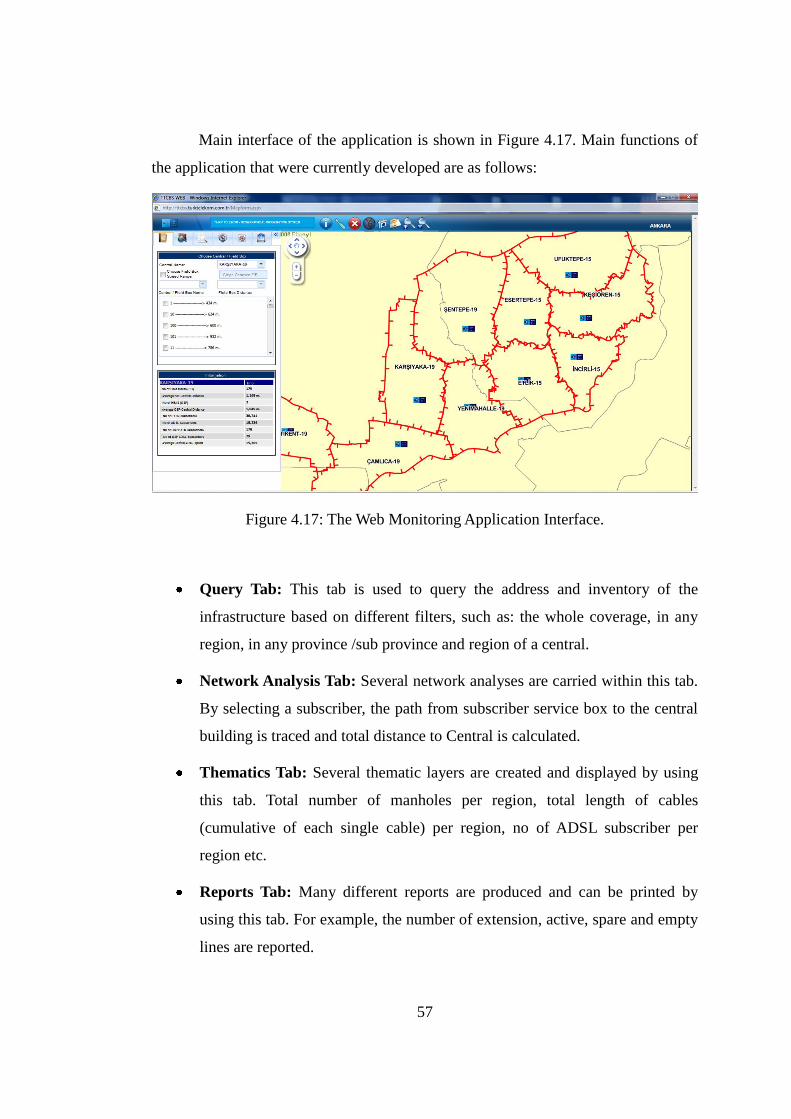
57
Main interface of the application is shown in Figure 4.17. Main functions of
the application that were currently developed are as follows:
Figure 4.17: The Web Monitoring Application Interface.
Query Tab: This tab is used to query the address and inventory of the
infrastructure based on different filters, such as: the whole coverage, in any
region, in any province /sub province and region of a central.
Network Analysis Tab: Several network analyses are carried within this tab.
By selecting a subscriber, the path from subscriber service box to the central
building is traced and total distance to Central is calculated.
Thematics Tab: Several thematic layers are created and displayed by using
this tab. Total number of manholes per region, total length of cables
(cumulative of each single cable) per region, no of ADSL subscriber per
region etc.
Reports Tab: Many different reports are produced and can be printed by
using this tab. For example, the number of extension, active, spare and empty
lines are reported.

58
Layer Control Tab: This tab is used to open and close layers at current
viewing scale.
There are several functions existing in Web Monitoring Application and there
will be enhancements due to the new inquiries received from different TT
Departments. Several analyses could be prepared with the web monitoring
application. Some of them are shown as listed below.
• Number of PSTN and ADSL Subscribers (Figure 4.18): To see how many fix
phone and internet subscriber exists in each field box service region, or in a
central region, this analysis can be used.
• Distance from Field Boxed to the Central (Figure 4.19): It is important to see
the range and average distance of subscriber from his/her home/office to the
field box. This distance affects the quality and speed of internet connection.
• Distance from Field Box Regions to the Central (Figure 4.20): It is also
important to see the range and average distance of field box to the central. If
the distances are high, then there the areas should be split or F/O cable
installation is needed.
• ADSL Speed Analysis of subscribers (Figure 4.21): To see the real status and
speed of the internet speed of the customers, this application is used.
• ADSL Speed Analysis of OSP (Figure 4.22): This tool is used to know speed
of customers having high-speed external internet connection, this tool is used.
• ADSL Speed Analysis of transmission network (Figure 4.23): This tool is
used to see the speed of ADSL transmission network.
• Cost calculations for replacement with OSP (Figure 4.24): One of the most
important question can be solved for cost calculation in case of changing the
infrastructure to F/O, or not to change it to F/O.
By using this GIS infrastructure also the following analysis can be done:

59
• Number of Total Field Box SD in each Central Region
• Number of OSP (HAES) per region
• Average SOP to Central distance
• Number of PSTN subscriber serviced with OSP
• Number of ADSL subscriber serviced with OSP
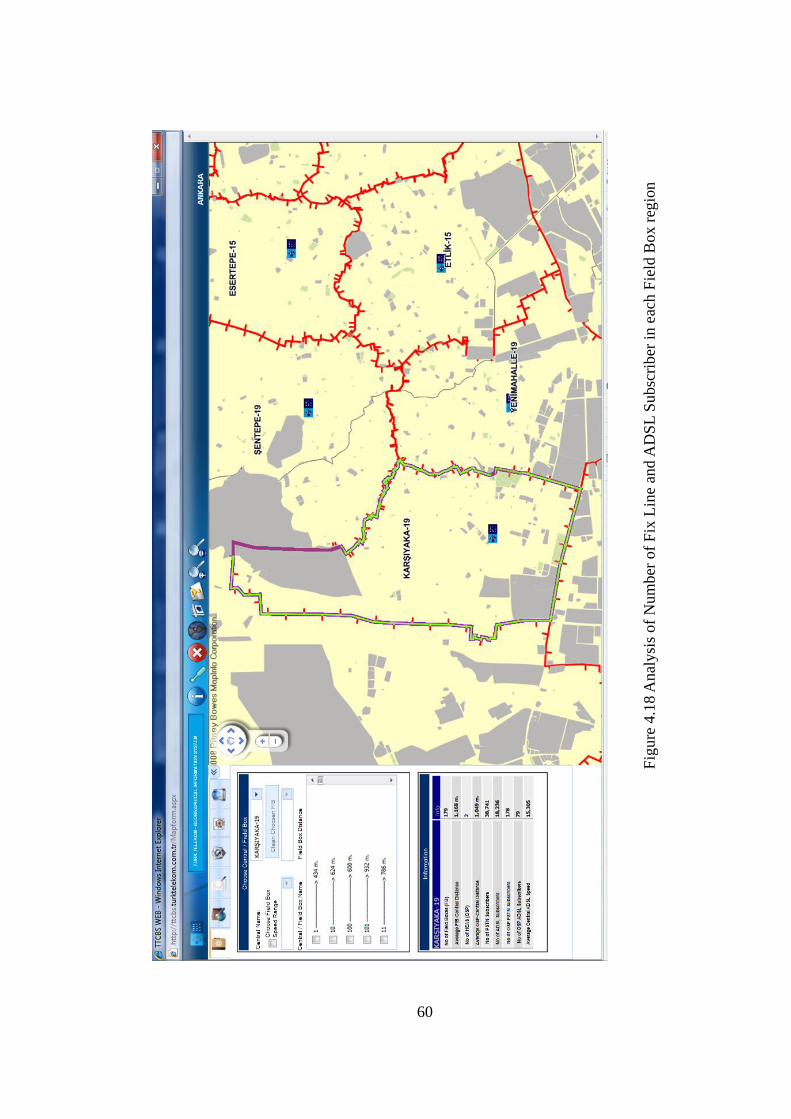
60
Fig
ure
4.1
8 A
nal
ysi
s of
Num
ber
of
Fix
Lin
e an
d A
DS
L S
ubsc
riber
in e
ach
Fie
ld B
ox r
egio
n
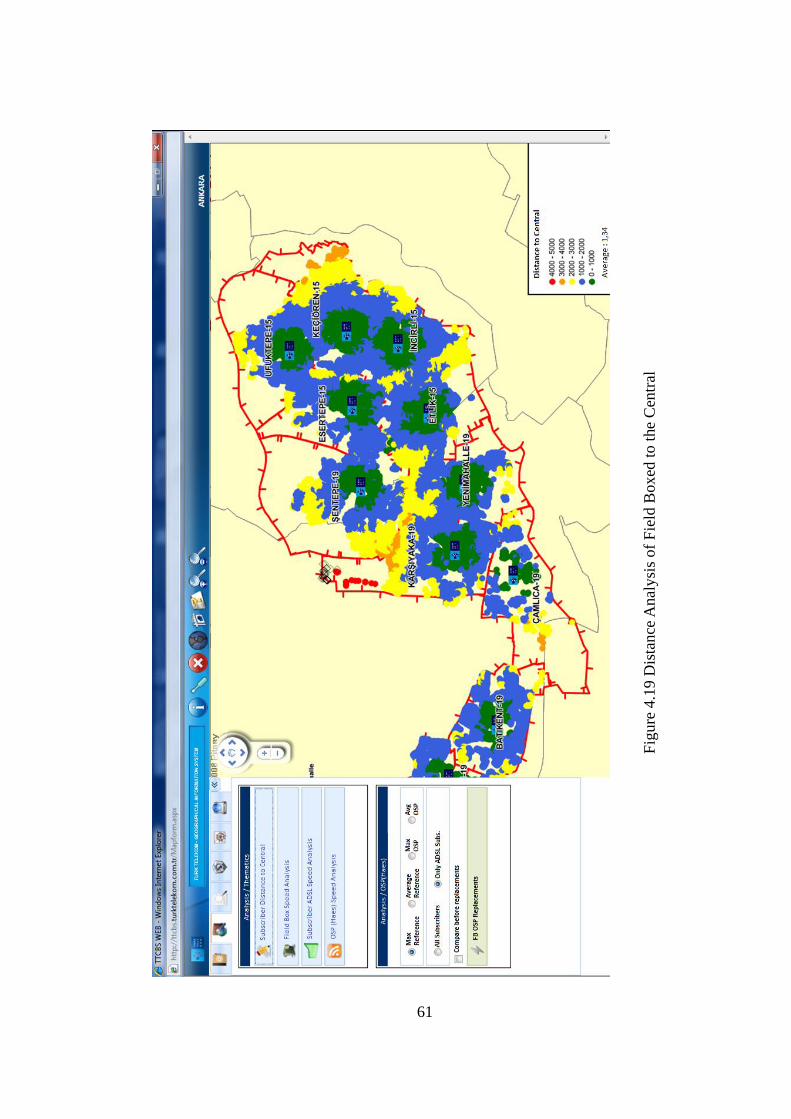
61
Fig
ure
4.1
9 D
ista
nce
Anal
ysi
s of
Fie
ld B
oxed
to t
he
Cen
tral
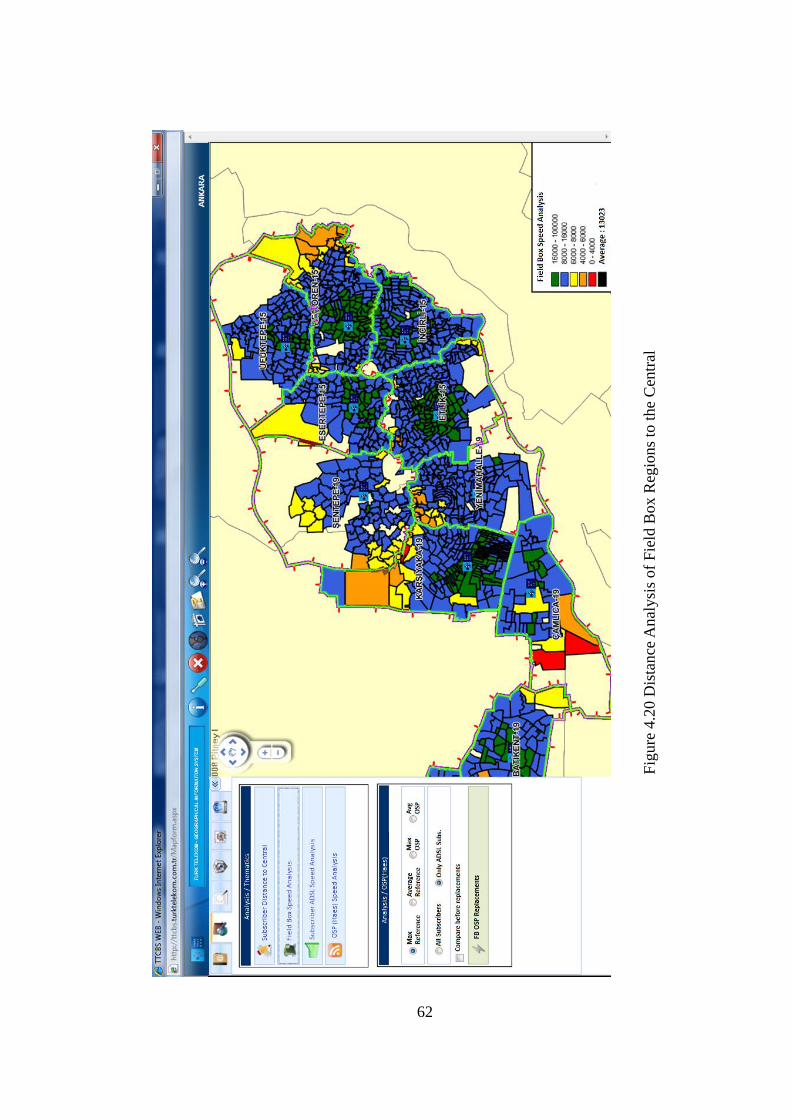
62
Fig
ure
4.2
0 D
ista
nce
Anal
ysi
s of
Fie
ld B
ox R
egio
ns
to t
he
Cen
tral
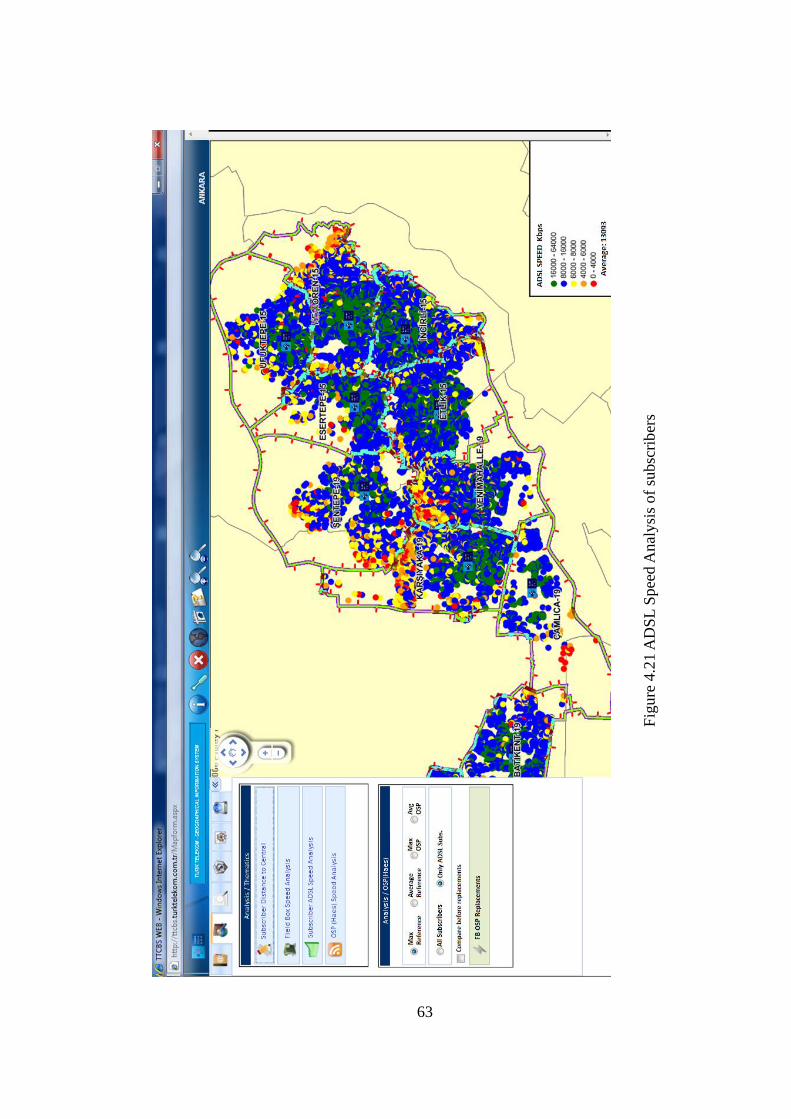
63
Fig
ure
4.2
1 A
DS
L S
pee
d A
nal
ysi
s of
subsc
rib
ers
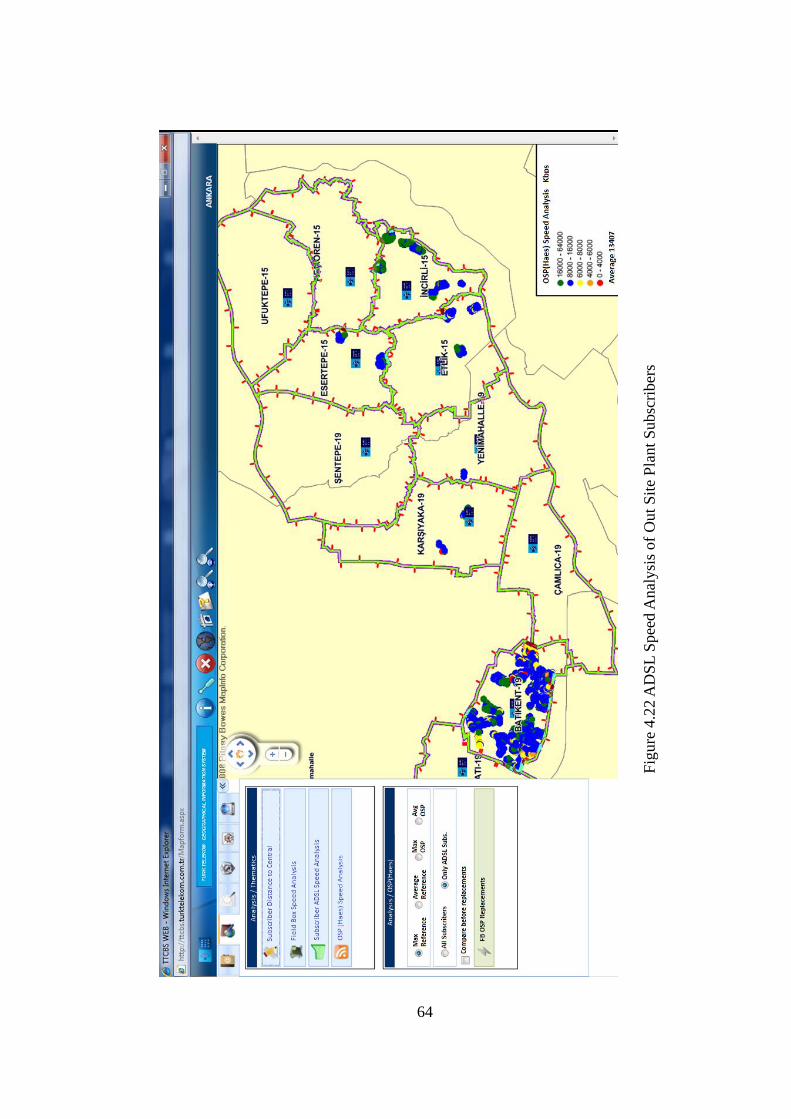
64
Fig
ure
4.2
2 A
DS
L S
pee
d A
nal
ysi
s of
Out
Sit
e P
lant
Subsc
riber
s
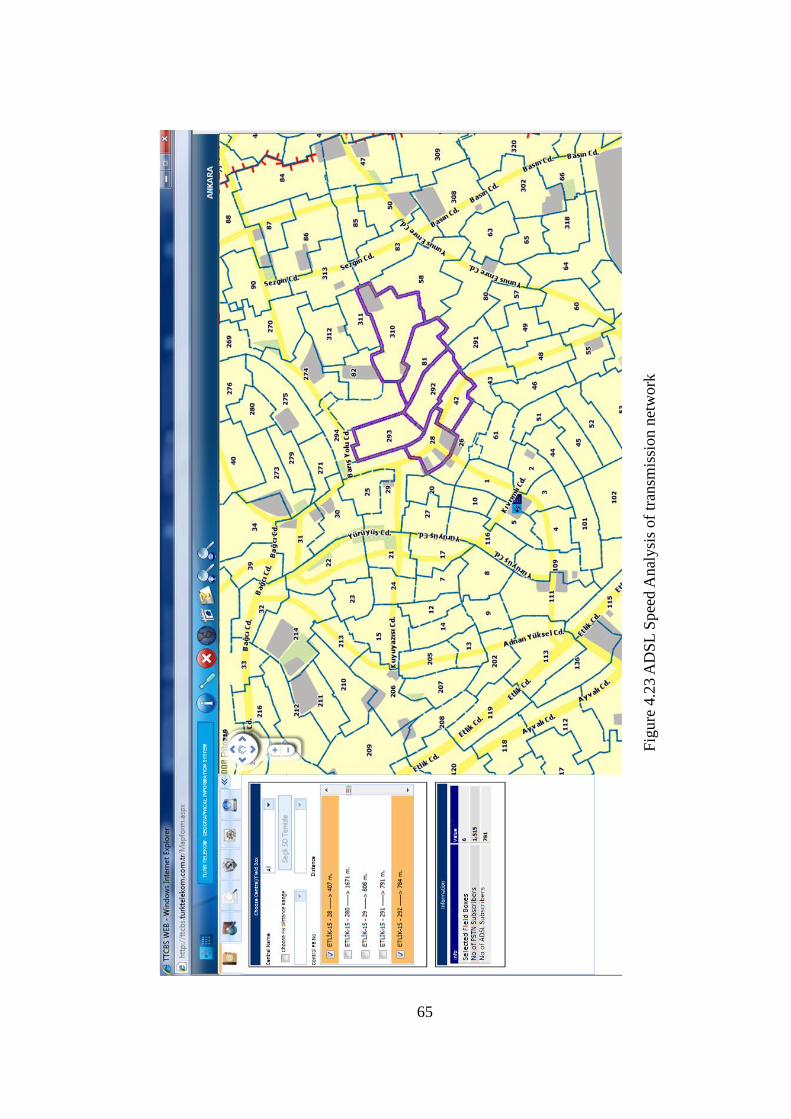
65
Fig
ure
4.2
3 A
DS
L S
pee
d A
nal
ysi
s of
tran
smis
sion n
etw
ork
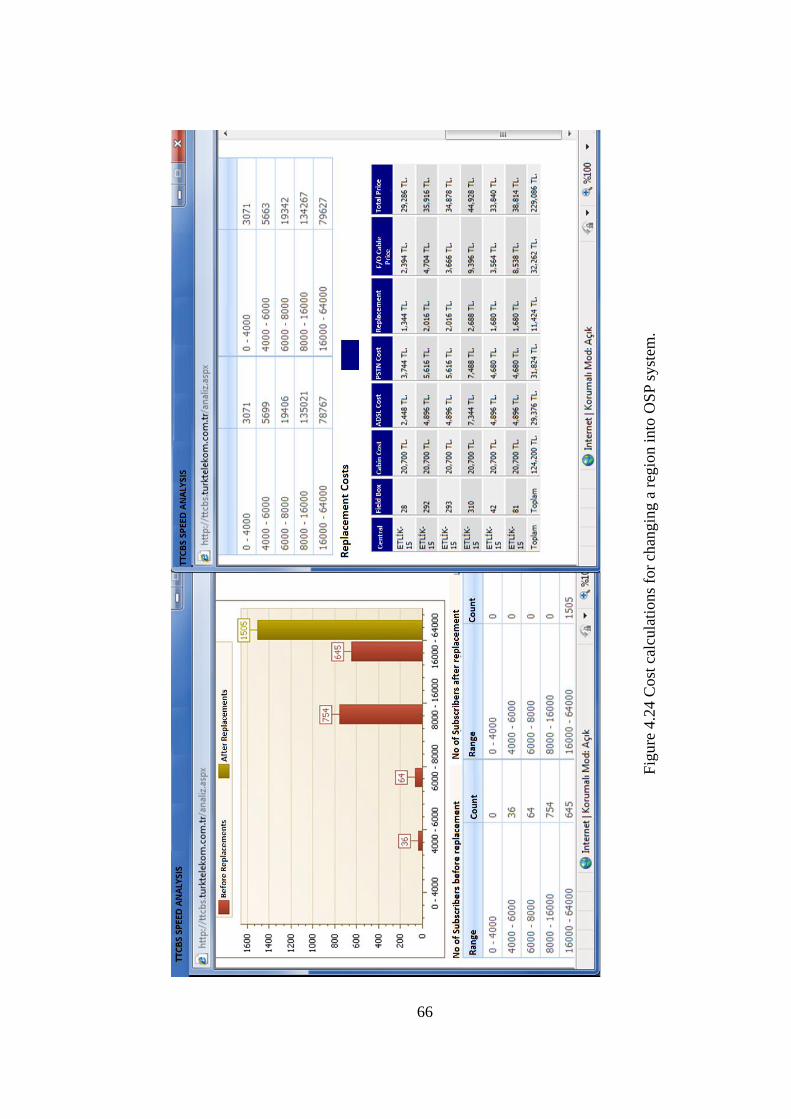
66
Fig
ure
4.2
4 C
ost
cal
cula
tions
for
chan
gin
g a
reg
ion i
nto
OS
P s
yst
em.

67
4.5 ADSL Capacity Application
This module is used to calculate average/maximum ADSL data upload /
download speed limit for any ADSL applicant. The total distance from home to the
Service box or Field box is calculated by using real cable network infrastructure real
path, not the Cartesian distance between two points.
Algorithm of ADSL Speed Calculation is given below:
Step 1: Find any address and select a building
Step 2: Find the Service Box of that building
Step 3: Trace up to Field Box,
◦ Calc. the total length of cables (L = ΣL) between Service Box and Field Box,
◦ Calc. the total loss in each connection element ml = Σml
Step 4: If the Cable connected to OSP (Outdoor Fiber Connected Field Box) then goto step 8
else goto step 5
Step 5: Trace up to Central Building and calculate the sum of length of cables between FB
and CB and add to previous cable length( L = L + ΣL), Calculate each connection element
losses and add to previous losses ml = ml + Σml of b/w FB and CB
Step 6:Goto Step 8
Step 7: Step 5: Trace up to Central Building, FL = ΣFL of fiber between FB and CB , ml = ml
+ Σmli of each connection element b/w FB and CB
Step 8: Total Loss = L * kc + FL*kf+ ml
Step 9: Subsciriber Speed = Speed At Central – Total Loss
where
L: is the legth of copper cables in meters
ml: Minor Losses due to fittings and connections in bps
kc: copper cable loss multiplies in bps/m
kf: fiber optic cable loss multiplier in bps/m (very low, pprox. zero)
SB: ServiceBox FB: FieldBox
CB: CentralBuilding
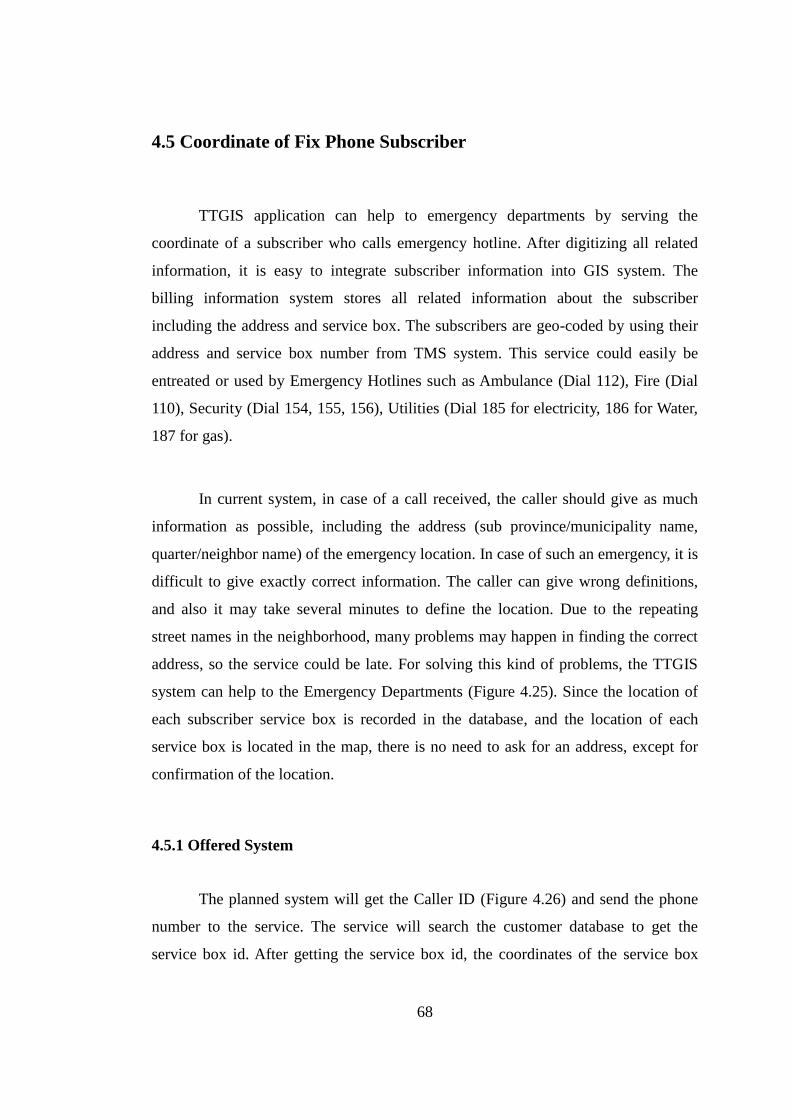
68
4.5 Coordinate of Fix Phone Subscriber
TTGIS application can help to emergency departments by serving the
coordinate of a subscriber who calls emergency hotline. After digitizing all related
information, it is easy to integrate subscriber information into GIS system. The
billing information system stores all related information about the subscriber
including the address and service box. The subscribers are geo-coded by using their
address and service box number from TMS system. This service could easily be
entreated or used by Emergency Hotlines such as Ambulance (Dial 112), Fire (Dial
110), Security (Dial 154, 155, 156), Utilities (Dial 185 for electricity, 186 for Water,
187 for gas).
In current system, in case of a call received, the caller should give as much
information as possible, including the address (sub province/municipality name,
quarter/neighbor name) of the emergency location. In case of such an emergency, it is
difficult to give exactly correct information. The caller can give wrong definitions,
and also it may take several minutes to define the location. Due to the repeating
street names in the neighborhood, many problems may happen in finding the correct
address, so the service could be late. For solving this kind of problems, the TTGIS
system can help to the Emergency Departments (Figure 4.25). Since the location of
each subscriber service box is recorded in the database, and the location of each
service box is located in the map, there is no need to ask for an address, except for
confirmation of the location.
4.5.1 Offered System
The planned system will get the Caller ID (Figure 4.26) and send the phone
number to the service. The service will search the customer database to get the
service box id. After getting the service box id, the coordinates of the service box
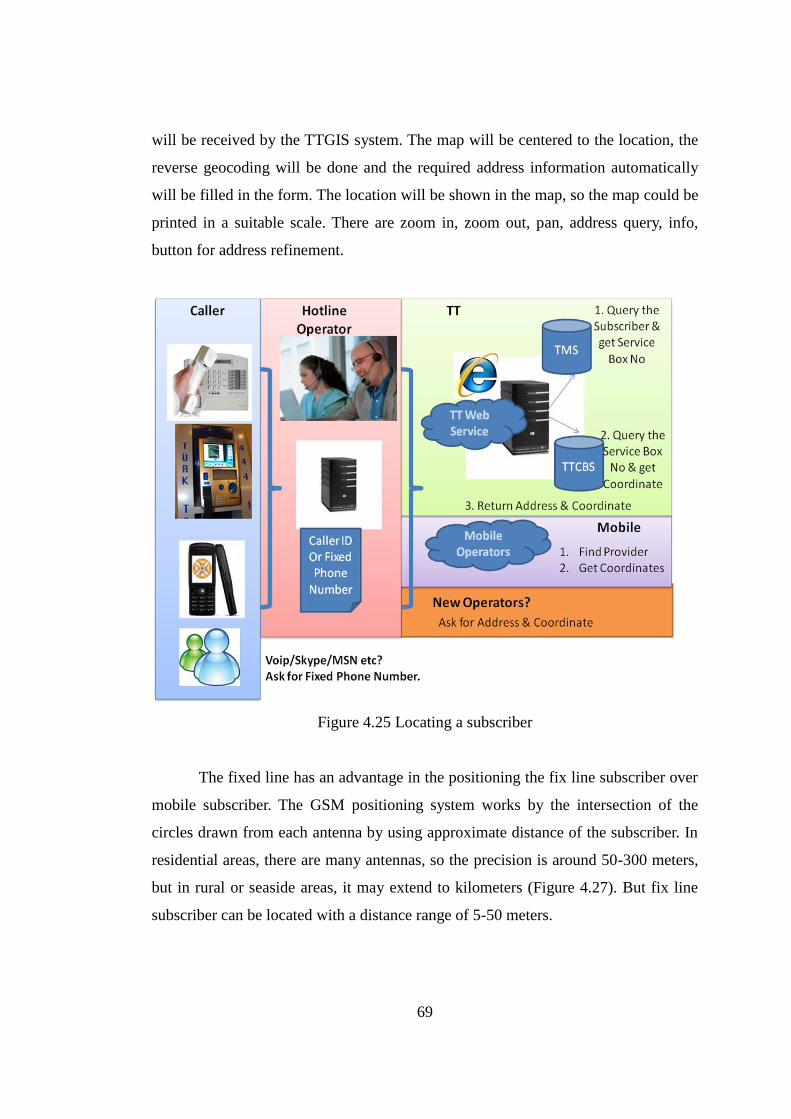
69
will be received by the TTGIS system. The map will be centered to the location, the
reverse geocoding will be done and the required address information automatically
will be filled in the form. The location will be shown in the map, so the map could be
printed in a suitable scale. There are zoom in, zoom out, pan, address query, info,
button for address refinement.
Figure 4.25 Locating a subscriber
The fixed line has an advantage in the positioning the fix line subscriber over
mobile subscriber. The GSM positioning system works by the intersection of the
circles drawn from each antenna by using approximate distance of the subscriber. In
residential areas, there are many antennas, so the precision is around 50-300 meters,
but in rural or seaside areas, it may extend to kilometers (Figure 4.27). But fix line
subscriber can be located with a distance range of 5-50 meters.
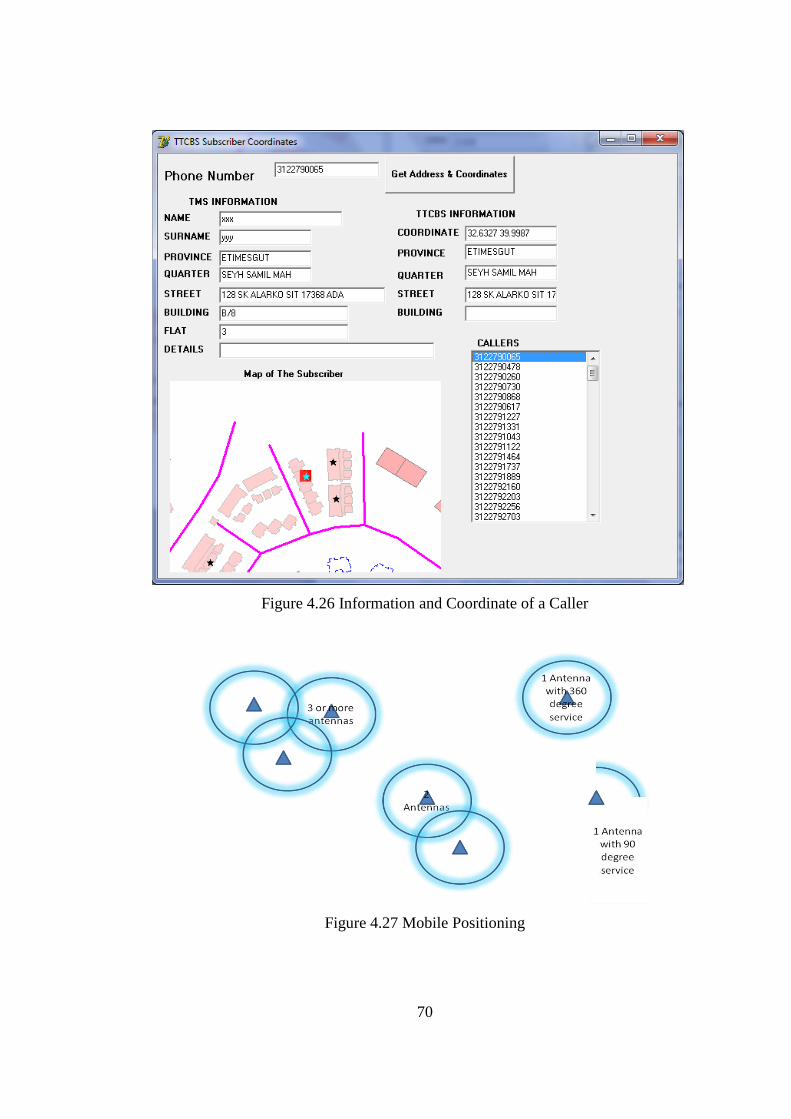
70
Figure 4.26 Information and Coordinate of a Caller
Figure 4.27 Mobile Positioning

71
4.5.2 Success of the system
Success of the system will depend on the following two criteria: accuracy and
up-to-date of the TMS and GIS. Up-to-dateness of the Subscribers phone number and
service box id. For example, if a subscriber move to another location and the phone
number is not changed, but the service box no is changed, the new service box
number must be updated with the new one.
In case the call is made from a mobile phone or somebody else is calling, the
operator can ask the fixed phone number of the emergency location to easily access
to that address. Also the coordinates of the Mobile subscribers can be get from the
GSM Operators by a service and integrated to the system.
4.5.3 Steps Followed in the System
New Call from Fixed Phone (If not a fixed phone or the emergency is related
to another location, get the relevant number)
Automatically Get Caller ID: 0 312 1234567 (or type the relevant number)
Press Get Caller Address Button
The system will connect to TTGIS Web based service: Such as
www.turktelekom.com.tr/SubscriberLocation?No=03122131413&UserID=X.
The service will return the Subscriber Name and Address, and Service Box
No from TMS database,
Then the service will query the TTGIS system and location of the service
box, that has got from TMS database, the Address of the Service box will be
returned.
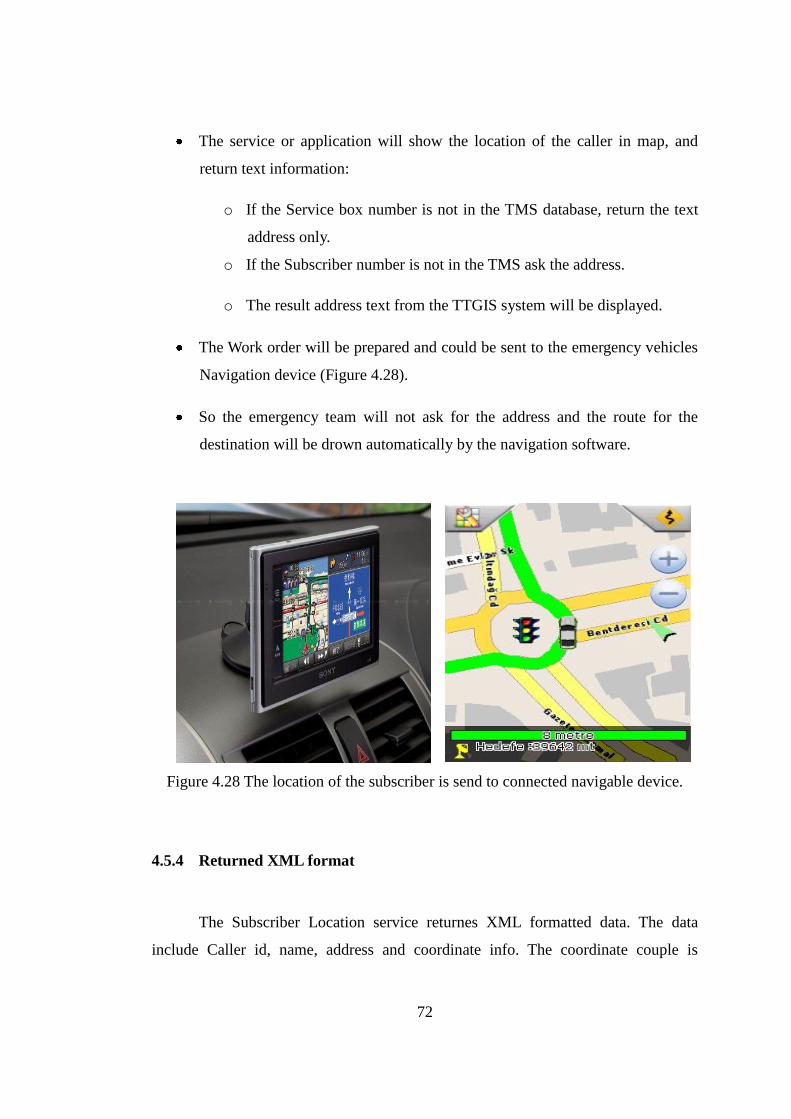
72
The service or application will show the location of the caller in map, and
return text information:
o If the Service box number is not in the TMS database, return the text
address only.
o If the Subscriber number is not in the TMS ask the address.
o The result address text from the TTGIS system will be displayed.
The Work order will be prepared and could be sent to the emergency vehicles
Navigation device (Figure 4.28).
So the emergency team will not ask for the address and the route for the
destination will be drown automatically by the navigation software.
Figure 4.28 The location of the subscriber is send to connected navigable device.
4.5.4 Returned XML format
The Subscriber Location service returnes XML formatted data. The data
include Caller id, name, address and coordinate info. The coordinate couple is

73
formatted as North and Easth. The structure is as follows.
<xml>
<name>
<Address and Coordinates of Caller ID: 00 90 312 1234567>
</name>
<Address>
<coordinates>39.91368, 32.975945, 0</coordinates>
<Province>Ankara</Province>
<SubProvince>Etimesgut</SubProvince>
<Neighbour>Eryaman</Neighbour>
<Street>128 Sk</Street>
<Building>5/A</Building>
<Details>5/A</Details>
</Address>
…
Here there may be some more information added.
…
</xml>

74
CHAPTER 5
DISCUSSIONS
In this thesis the following questions have been studied and tried to be solved.
What are the benefits of digitizing the paper networks and building a GIS system for
telecommunication companies? What kind of new services can be given by using the
coordinate information? What is the advantage of having such a system in the
competitive telecom sector? How to analyze and improve an existing network? The
results of the study and the answers to those questions are as follows.
System Design and Database Creation:
In this study, database creation, system design and developed applications are
explained for the Turk Telekom GIS system. The methodology was developed
depending on the site expectations. Therefore the applications were developed with
the TT engineers. MapInfo Pro 9.5 was used as the GIS software. The applications
were developed with Borland Delphi v7 and Visual Studio 2008 .NET Framework
software. There are several GIS software that can open or use the TTGIS database,
such as ESRI, Autodesk, Intergraph. Since the applications are developed with
MapInfo technology, switching to another GIS Software requires recoding. The
Oracle Spatial 10g system was chosen for database management system. There are
also some other commercial or open source spatial database systems exits such as
MS SQL Server 2008 and PostGIS. The Web monitoring system is developed with
Mapxtreme .NET technology, and Internet Explorer, Firefox browsers are
compatible.
75
One of the main problems, designing a system and storing the database tables,
has been solved. TT operates nationwide infrastructure, and Turkey is a large country
with 81 provinces. There are 4 UTM (6 degree) zones and 7 GK zones (3 degree)
exist in Turkey. One of the biggest requirements is to store the data in 3 degree
UTM/GK projection zones. It is also possible to store whole country in one
layer/table in Geographical Latitude/Longitude or Lambert Conformal Conic
projections. This problem has been solved with the developed different schemas for
each province and proper coordinate system has been chosen for each province.
Another problem was maintenance and management of the database. It is preferred to
have minimum number of tables for database maintenance. But it is better to have
small sized tables for performance issues. It is better to create one schema for each
province for security and credentials, so users of one province cannot see and alter
the data of another province. Separate schemas for each province were created for
combining the projection, database maintenance and security issues. The
performance of the separate schemas must be checked in the future when all the data
for the whole Turkey are gathered.
Applications:
In Chapter 4, first two applications discussed in this study are for digitization of
the as built and cables maps. These applications were already exist within the
available system. It is one of the most important applications, because it is used to
create all the inventory of the TT. The F/O Cable drawing application is used to
digitize the fiber cables installed on the field. With these two applications, TT has a
unique, seamless, up to date, controlled nationwide data. This data can be updated,
printed with the same applications and it can be queried in monitoring applications.
While these applications are developed, the working methodology of different cities
are analyzed and unified.

76
The web monitoring application is important for the managers and planning
engineers. By this application any staff with more or less understanding of map or
GIS, can easily use and analyze the system, can see good or badness of the
infrastructure, which cannot be supplied by list or graphical reports. Also by using
analysis exist in the application, the current situation in the field can be seen, and it
was not possible in the past.
The Project Preparation Application is needed for planning the future,
calculating the costs of installations. This application is also used to track the
changes, by showing location of the old cables and planned new cables. By this
application the companies making plans for new installation can easily see what exist
in the field and what will be installed as new. The final plan data can easily be copied
to the GIS system, which will shorten time to update the system.
The ADSL Capacity application is another important applications, which is used
to calculate the maximum speed of the internet allowed by the existing infrastructure
when a new application is made. By this application, TT engineers or staff can easily
reply the inquiries at the application time. This was not possible before and it was
needed some days to calculate the speed of the system. This is very important for
customer trust also. When customer applies for a higher capacity and if TT declares it
is possible, but if it cannot be served actually, the credibility of the company
declines. By this application this kind of problems will be reduced.
The last application, which is developed in this study is the serving the
coordinate of the customers to emergency or related companies. TT can easily give
this service with the current GIS system. Since telecom has the latest and up to date
subscriber data, the location of the subscriber is automatically updated. This is an
important application providing the safety of people at their home. Also the field
77
team can use it for faster failure fixing. Also several location-based services can be
supplied to the subscribers. One of the major problems in this application is the
issues about security of the data and rights of the subscribers. Some subscribers
apply to TT for not being listed in the directories. This application can be served the
same as the directory service, except for the emergency cases. Currently the telecom
subscribers are geocoded for some city security and surveillance systems (which are
called KGYS or MOBESE). But this is done only one time in an offline separate
database. The change and movement of subscribers are not tracked daily. When TT
starts giving the coordinate information of subscribes as online service, the security
systems will use directly the latest and up-to-date subscriber location data.
A similar system can be applied to other telecom companies, the system is
portable, and can be implemented in another Telecom company here or abroad. There
will be some limitations due to the different standards of the countries or working
cultures. For other infrastructure systems like gas, water, electricity, it is needed to
make changes both in the database and the applications, since the requirements and
systems are different. However, several functions on the applications can be used
directly.
Turk Telekom, has the biggest infrastructure in Turkey. TT needs to know where
the assets are located, otherwise there will be unnecessary investments and
installations will be made and unused inventory will be useless. Before starting to
digitize her network, all the information was supplied by local staff of the city. As the
time past, due to changes in staff, network and city plans, there are many information
becoming useless or wrong. GIS implementation provides TT to know the location,
amount and quality of her infrastructure.
The system provides less objective and proper decisions making for the new
plans, which will be made by using GIS applications. The service quality and number
78
of applications for new and/or better services will be used for planning.
Many mistakes, which were observed during the application, have been found.
These errors were checked by the engineers and corrected either in the office or at
the site. Since duplicate copies can exists for some paper maps, different departments
can have old or wrong information about the field. With the new system all the
information is centrally stored and the latest information could be easily supplied to
the TT staff. The amount of installation and number of subscribers and amount of
revenues can be analyzed regionally. The amount of installation, such as how many
meters or kilometers of cables, trenches, amount of manholes, field boxes can be
seen from the map, and can be compared with the amount of money paid to
constructor for the installations.
After privatization of TT, many employees quit their work, or went to another
government office, and some of them retired. The local knowledge of the TT was
mostly on their staff. With this system the local knowledge also will stay in the
system.
Limitations:
Building a GIS system does not mean all the necessary steps are done. It is
important to build all related updating mechanisms for the system to make it alive
and trustable. For updates, project application was developed and with this
application all the new installations can be updated. Another managerial rule to apply
is to integrate other departments to use the GIS data as input, in reporting and
statistics creation.
GIS system cannot answer many questions. Especially this GIS system is the
79
first and only system in countrywide wire-line telecom infrastructure. For the future
requirements system can be expanded and extended, but the current version of the
applications and database structure and design may need to be changed or improved.
By the help of the GIS system, the whole inventory in the paper maps are started
to be digitized and all the inconsistencies became visible and the missing updates are
done before finishing the digitization. The 1/1000 scale maps were combined and
became seamless drawing. The smaller scaled maps will be printed directly from the
base data. There will be no more different scaled maps with different data. After this
system is started to be used, there won’t be many versions of the paper maps with
different revisions. In the old system, the network in the paper maps, and the
inventory in the Telecom Management System (TMS) was not matching. Now two
systems are compared and the differences are corrected.
The difficulties of the GIS system are the local solutions generated for some
local problems. The paper maps were organized with respect to those problems.
When the applications designed with respect to regulations and common know how
of the engineers, those non-common tasks became a problem to be solved.
The applications can be analyzed in terms of “Usability” measures, and the user
interface of the system can be improved. The mostly used functions can be designed
as easily accessible menus or buttons, and also the designs of forms can be unified to
have common buttons at the same appearance and positions, such as OK and Cancel
buttons.
The “Subscriber Coordinate Serving Application”, can be better used if TT made
the digitization of the whole cables and subscriber boxes in whole Turkey. TT is
planning to complete this task as soon as possible.

80
For the Caller ID visibility, almost all of the infrastructures of TT is digital. So
all of the caller ids will be visible in the system. If the system is not digital yet, the
caller id will not be visible on the screen, so the system will not work. This can be
overcome by asking the telephone number of the subscriber.

81
CHAPTER 6
CONCLUSIONS AND RECOMMENDATIONS
While searching an answer to the research question already presented in Chapter
1, we have seen that there are several results and findings associated with this study
are given in Chapter 5; apparently, those findings are subject to limitations upto a
reasonable level; fortunately, those limitations encouraged us to discover further
study avenues. The chapter concludes the thesis by presenting those results, findings,
limitations, future works and an answer to the research question.
6.1 Conclusions
The motivation of the study was to explain benefits of building a GIS system for
Turk Telekom’s wire line infrastructure system. After building a GIS system, it is
also important to use and serve this location based data in different managerial and
engineering spatial decision support system applications, which was not possible
before or not easily done before. It is also important to use the network and geocoded
subscriber data in life saving technologies.
As a result of the study, it is founded out that, GIS systems and functionalities
supplied by GIS with tailored applications help managing telecom infrastructure, GIS
can be used in Telecom wire line infrastructure.
82
6.2 Recommendations
We can recommend several tasks to be done in the future studies. Some of
them are as follows.
TT can serve several Location Based Services (LBS) by using its inventory
and information of the subscriber. Such as a map enabled Business Finder (Where is
nearest X and what is the phone number) services. These services must protect the
privacy policies. The data produced in this project can support investments and these
data can be used in finance department of the company.
One of the next step can be the integration with Address Based National
Citizenship Records (ADNKS) address codes. The ADNKS has five levels of
administrative areas, the streets, buildings and individual units (like flat). These
levels are for Province (il), Sub Province(ilçe), City(Bucak), Village(Köy),
Neighbour or Quarter(Mahalle). The current address level for the telecom consist of
three level namely Province, Sub Province and Quarter. The streets passing more
than one quarter, or defines the boundary of the quarter have one unique code for
each quarter. In reality it is a single street. The buildings in the left of the street and
right of the street will have different street codes if the quarter areas are different.
This integration will be essential for future subscriptions. It is important especially
for controlling the name and address of the subscriber from the ADNKS.
The field teams may use network maps on the field, and make updates from
the field, this will reduce time to find and understand the network,
Another future work can be the digitization of the village infrastructures in
the system. This will supply a unique, seamless, countrywide database for the TT.
83
The historical data later can be used for spatio-temporal analysis. Especially it
will be interesting to see the changes in the inventory within last 10 or 20 years. The
transition from Cupper to F/O cables can be analyzed by adding the financial
parameters.
The current system was designed in 2D. The Oracle Spatial Data structure
supports also 3D information. Upgrading the system into 3D (even 4D since time
information is stored for changes) is possible. This can be even done by utilizing
Google Earth in the future, because of the fact that Google introduced neo-geography
to GIS world and changed the way of presentation layers.
In the next phases of the system, there may be more mobile applications
developed for field staff, and engineers and managers can have chance to response
faster, can make better scenario management in the field visits and faster decision
taking in the emergency cases. Currently the information in the GIS system can be
reached by using a laptop with an internet connection.
There are several different spatial database systems exits, such as MS SQL
Server Spatial and open source PostGIS. The GIS system could be made compatible
with these databases.

84
REFERENCES
Albrecht, J., Key Concepts & techniques in GIS, pp13-18, Los Angeles, Sage
Publications, 2007
Bartlett, E. R., Cable television handbook, pp100-123, McGraw-Hill, New York,
2000
Bitdunyasi 1, http://www.bitdunyasi.com/tr/?Sayfa=Detay&Id=1118, Last visited
on 07/10/2009.
Bitdunyasi 2, http://www.bitdunyasi.com/tr/?Sayfa=Detay&Id=1979, Last visited
on 18/08/2009
Bitdunyasi 3, http://www.bitdunyasi.com/tr/?Sayfa=Detay&Id=785, Last visited
on 18/08/2009
BKW FMN, Switzerland, http://www.bkw-fmb.ch, Last visited on 11/01/2010
Bouras, C., Gkamas, A., Papagiannopoulos, J., Theophilopoulos, G., Tsiatsos, T.,
Broadband municipal optical networks in Greece: A suitable business model,
Telematics and Informatics 26, 2009, pp 391–409
British Telecom Global Services, http://www.btglobalservices.com, Last visited
on 11/01/2010
Brown, C. M., Hacking Google Maps and Google Earth, Page 4, Indianapolis,
IN, Wiley Pub., 2006
85
Campbell, J. Map use & analysis, Boston, McGraw-Hill, 4th
Ed, 2001, p245.
Ciciora, W, Farmer, J. Large, D., Adams, M., Modern Cable Television
Technology: video, voice, and data communications, pp162, McGraw-Hill, San
Francisco, California, Morgan Kaufmann Pub, 1999
CityCom Graz, Austria, http://www.citycom.co.at, Last visited on 11/01/2010
Cookson, G., The Cable, The Wire that Change the World, p- 31, Tempus
Publications, Gloucestershire, 2003
Daosheng, D. “Introduction to Data Quality Standard for Digital Topographic
Map Product”, 17th
Intern. Cartographic Conference and 10th
General Assembly
of the ICA/ACI, 3-9. September 1995, Barcelona, pp. 2411-2415.
Deshpande, M., Telecom GIS: An Integrated Approach, MapIndia 2003
Mumbai, India, 2003
Djordjevic-Kajan, S., Petkovic, M., Stoimenov, L., Rancic, D., Mitrovic, A.,
Mladenovic, S., Tosic, M., GIS in Nis PTT, In Proc. GIS/LIS’95-96, Budapest,
pp.92-101, 1996.
E-net, Ireland, http://www.e-net.ie, Last visited on 11/01/2010
E.ON Bredband, Sweden,
http://www.eon.se/templates/StartPageEON.aspx?id=45881, Last visited on
11/01/2010
E.ON Netz ,Germany, http://www.eon-netz.com/EONNETZ_eng.jsp, Last
visited on 12/01/2010
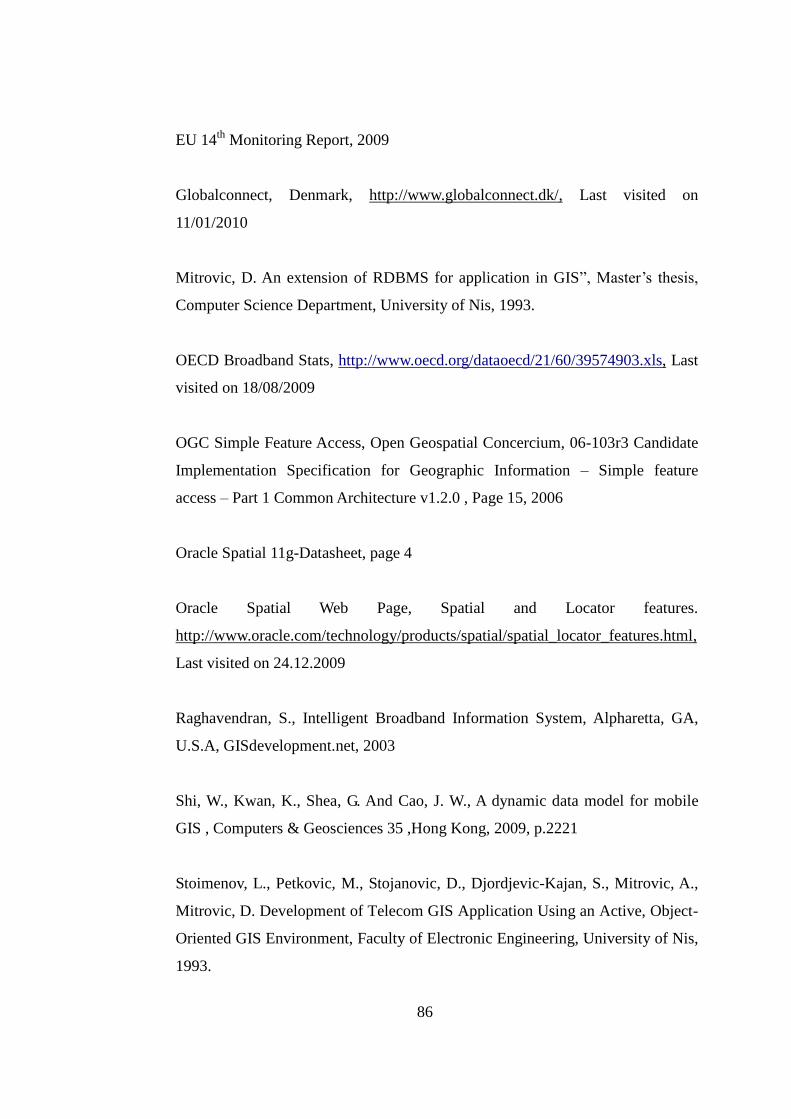
86
EU 14th
Monitoring Report, 2009
Globalconnect, Denmark, http://www.globalconnect.dk/, Last visited on
11/01/2010
Mitrovic, D. An extension of RDBMS for application in GIS”, Master’s thesis,
Computer Science Department, University of Nis, 1993.
OECD Broadband Stats, http://www.oecd.org/dataoecd/21/60/39574903.xls, Last
visited on 18/08/2009
OGC Simple Feature Access, Open Geospatial Concercium, 06-103r3 Candidate
Implementation Specification for Geographic Information – Simple feature
access – Part 1 Common Architecture v1.2.0 , Page 15, 2006
Oracle Spatial 11g-Datasheet, page 4
Oracle Spatial Web Page, Spatial and Locator features.
http://www.oracle.com/technology/products/spatial/spatial_locator_features.html,
Last visited on 24.12.2009
Raghavendran, S., Intelligent Broadband Information System, Alpharetta, GA,
U.S.A, GISdevelopment.net, 2003
Shi, W., Kwan, K., Shea, G. And Cao, J. W., A dynamic data model for mobile
GIS , Computers & Geosciences 35 ,Hong Kong, 2009, p.2221
Stoimenov, L., Petkovic, M., Stojanovic, D., Djordjevic-Kajan, S., Mitrovic, A.,
Mitrovic, D. Development of Telecom GIS Application Using an Active, Object-
Oriented GIS Environment, Faculty of Electronic Engineering, University of Nis,
1993.

87
Stojanovic, D., Djordjevic-Kajan, S., Petkovic, M., Stoimenov, L., Development
and Quality Control of the Spatial Database for Telecom Network Management
GIS, Computer Science Department, University of Nis, Yugoslavia, 1996
TeleOS, Germany, http://www.teleos.de, Last visited on 12/01/2010
Telstra, Australia, http://www.webmap.o2.co.uk, Last visited on 11/01/2010
Vanikar Y.V., Patel M.N., Kharod K. P., Matieda I.C., Telephone exchange
information and planning system – A case study of Vastrapur telephone
exchange, Ahmedabad, India, 1996
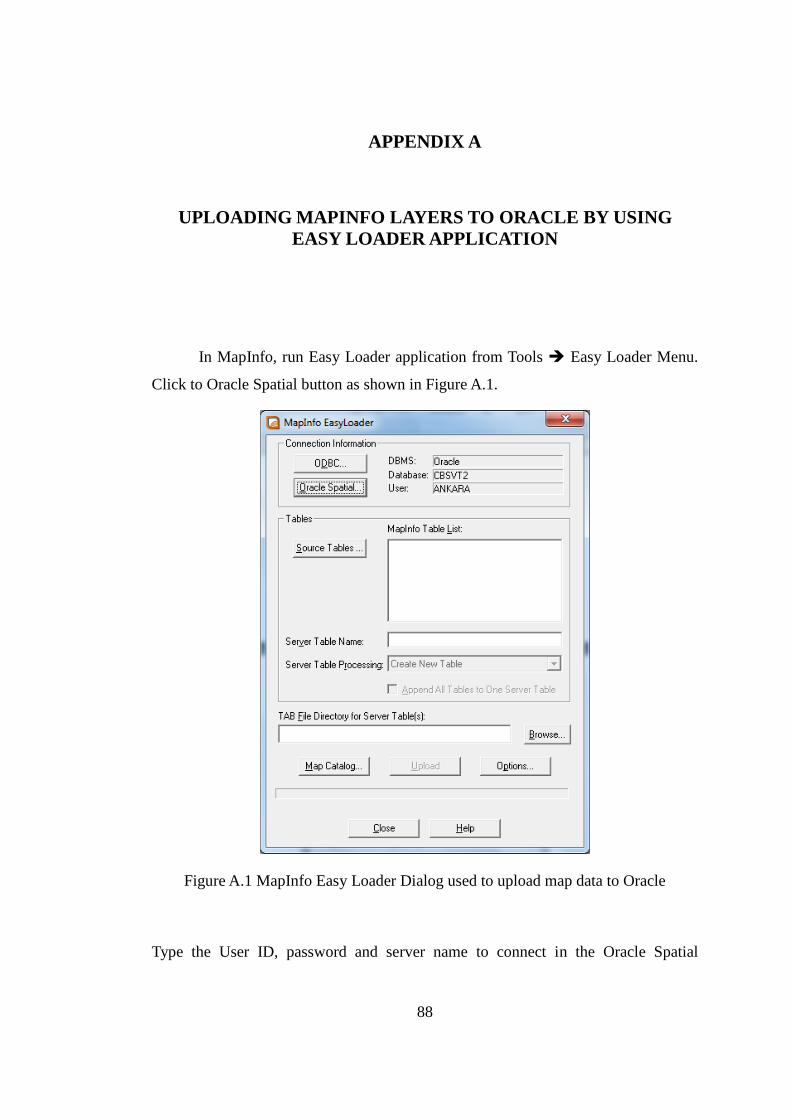
88
APPENDIX A
UPLOADING MAPINFO LAYERS TO ORACLE BY USING
EASY LOADER APPLICATION
In MapInfo, run Easy Loader application from Tools Easy Loader Menu.
Click to Oracle Spatial button as shown in Figure A.1.
Figure A.1 MapInfo Easy Loader Dialog used to upload map data to Oracle
Type the User ID, password and server name to connect in the Oracle Spatial
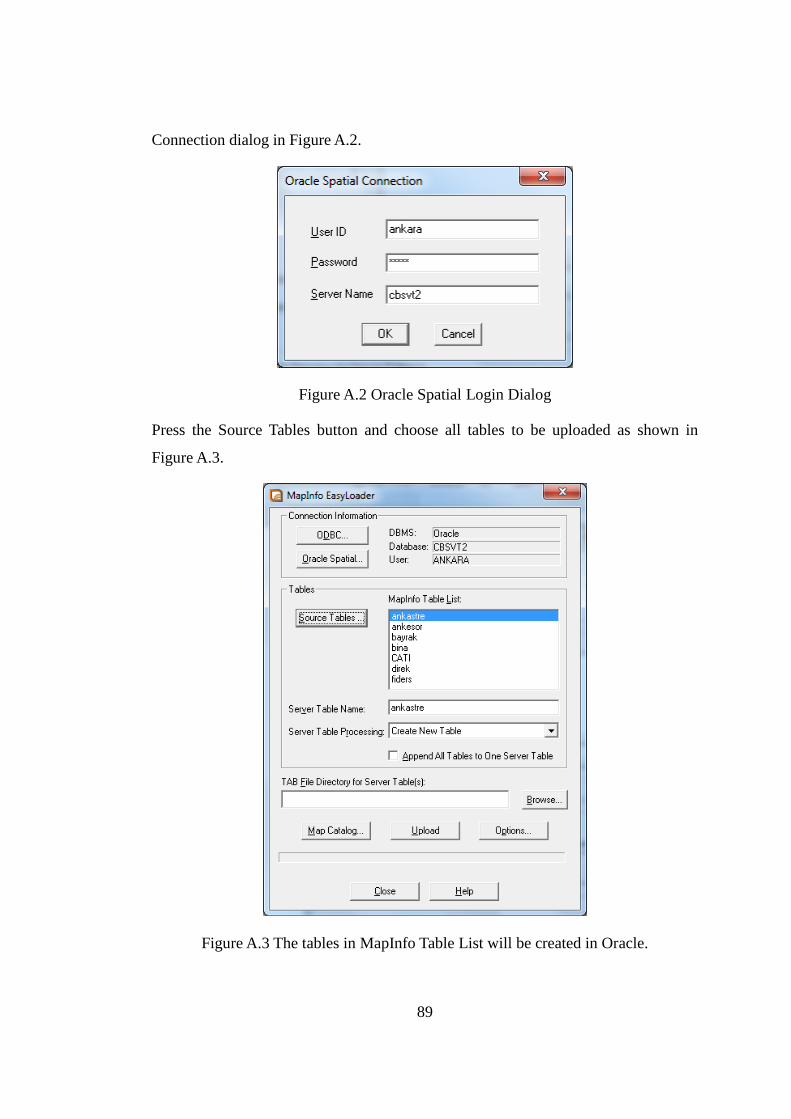
89
Connection dialog in Figure A.2.
Figure A.2 Oracle Spatial Login Dialog
Press the Source Tables button and choose all tables to be uploaded as shown in
Figure A.3.
Figure A.3 The tables in MapInfo Table List will be created in Oracle.
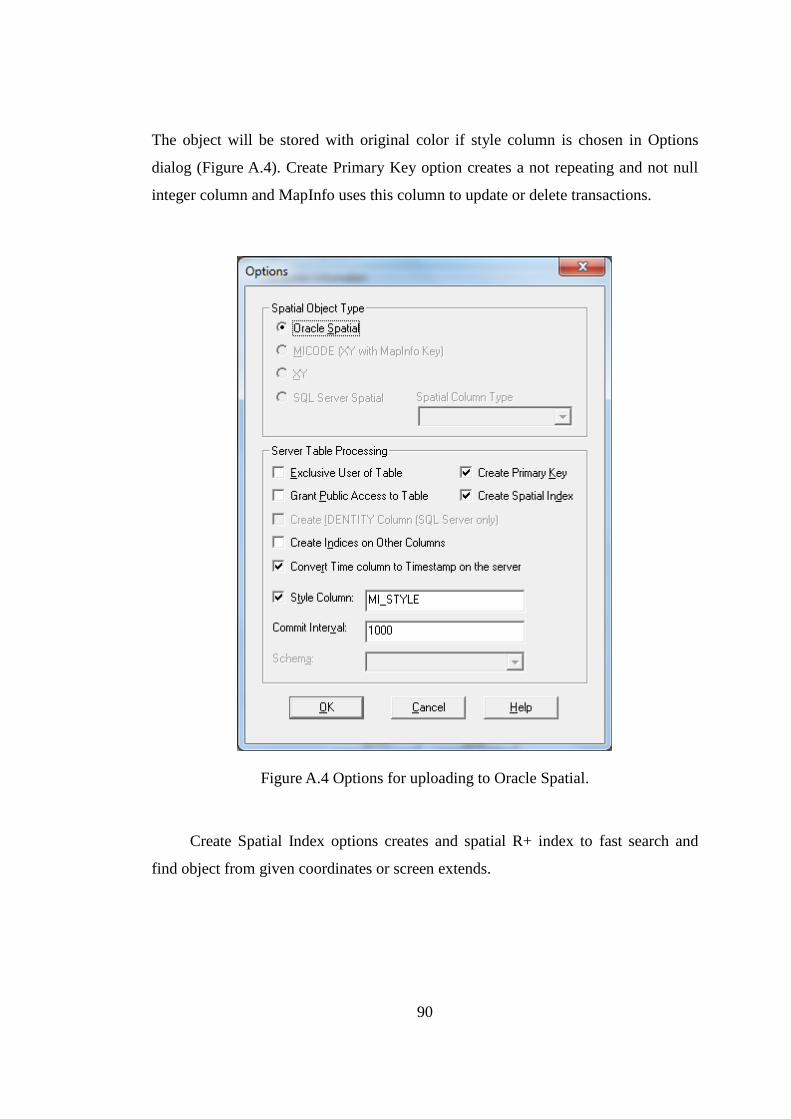
90
The object will be stored with original color if style column is chosen in Options
dialog (Figure A.4). Create Primary Key option creates a not repeating and not null
integer column and MapInfo uses this column to update or delete transactions.
Figure A.4 Options for uploading to Oracle Spatial.
Create Spatial Index options creates and spatial R+ index to fast search and
find object from given coordinates or screen extends.

91
APPENDIX B
CONTENT OF MAPINFO TAB FILE DOWNLOADED FROM
ORACLE
A sample MapInfo TAB file that contains Oracle Spatial metadata
information is given below.
!table
!version 550
!charset WindowsTurkish Charecter set of file defined here
Definition Table
Type LINKED Charset "WindowsTurkish" This table is linked
Fields 21
RAK Float ;
PABUC Float ;
CEKMEHALKA Float ;
KAPAKTIPI Char (12) ;
KAPAKYERI Char (12) ;
BOGAZDERIN Char (12) ;
KUBBEYUK Char (12) ;
TIP Char (10) ;
OZELLIK Char (10) ;
SANTRAL Float ;

92
OPER Float ;
ACI Float ;
TARIH Date ;
NO Char (10) ;
GMID Float ;
SIL Decimal (18, 0) ;
ID Decimal (12, 0) ;
IYIL Decimal (13, 0) ;
IEDEN Char (15) ;
IEPROJE Char (15) ;
MI_PRINX Decimal (12, 0) ;
begin_metadata Metadata section
"\DATALINK" = "" The Oracle connection information is given here
"\DATALINK\ConnectionString" = "SRVR=CBSSERVER;UID=ANKARA1"
"\DATALINK\ToolKit" = "ORAINET"
"\DATALINK\Autokey" = "OFF"
"\DATALINK\Query" =
"select RAK, PABUC, CEKMEHALKA, KAPAKTIPI, KAPAKYERI, BOGAZDERIN,
KUBBEYUK, TIP, OZELLIK, SANTRAL, OPER, ACI, TARIH, NO, GMID, SIL, ID, IYIL,
IEDEN, IEPROJE, MI_PRINX, OBJ from ANKARA2.menhol where (santral='31206009') "
"\OracleWorkspace" = ""
"\OracleWorkspace\Versioned" = "OFF"
"\OracleWorkspace\Name" = ""
"\OracleWorkspace\ParentName" = ""
end_metadata
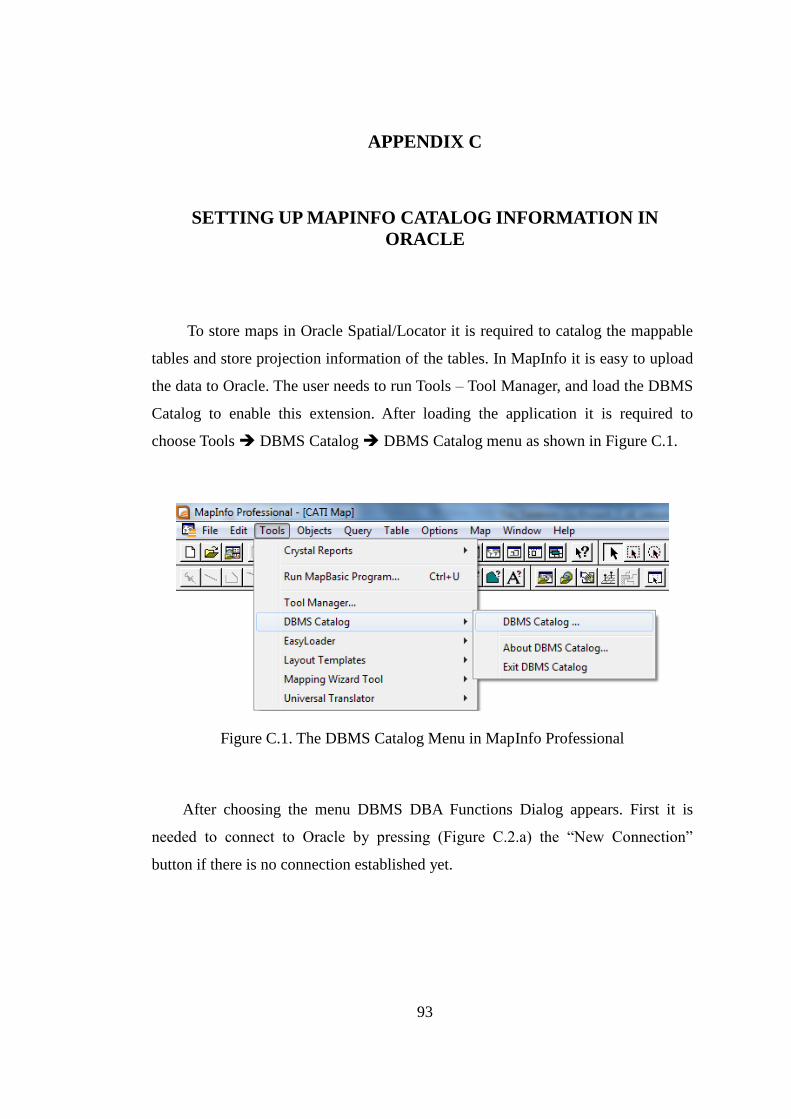
93
APPENDIX C
SETTING UP MAPINFO CATALOG INFORMATION IN
ORACLE
To store maps in Oracle Spatial/Locator it is required to catalog the mappable
tables and store projection information of the tables. In MapInfo it is easy to upload
the data to Oracle. The user needs to run Tools – Tool Manager, and load the DBMS
Catalog to enable this extension. After loading the application it is required to
choose Tools DBMS Catalog DBMS Catalog menu as shown in Figure C.1.
Figure C.1. The DBMS Catalog Menu in MapInfo Professional
After choosing the menu DBMS DBA Functions Dialog appears. First it is
needed to connect to Oracle by pressing (Figure C.2.a) the “New Connection”
button if there is no connection established yet.
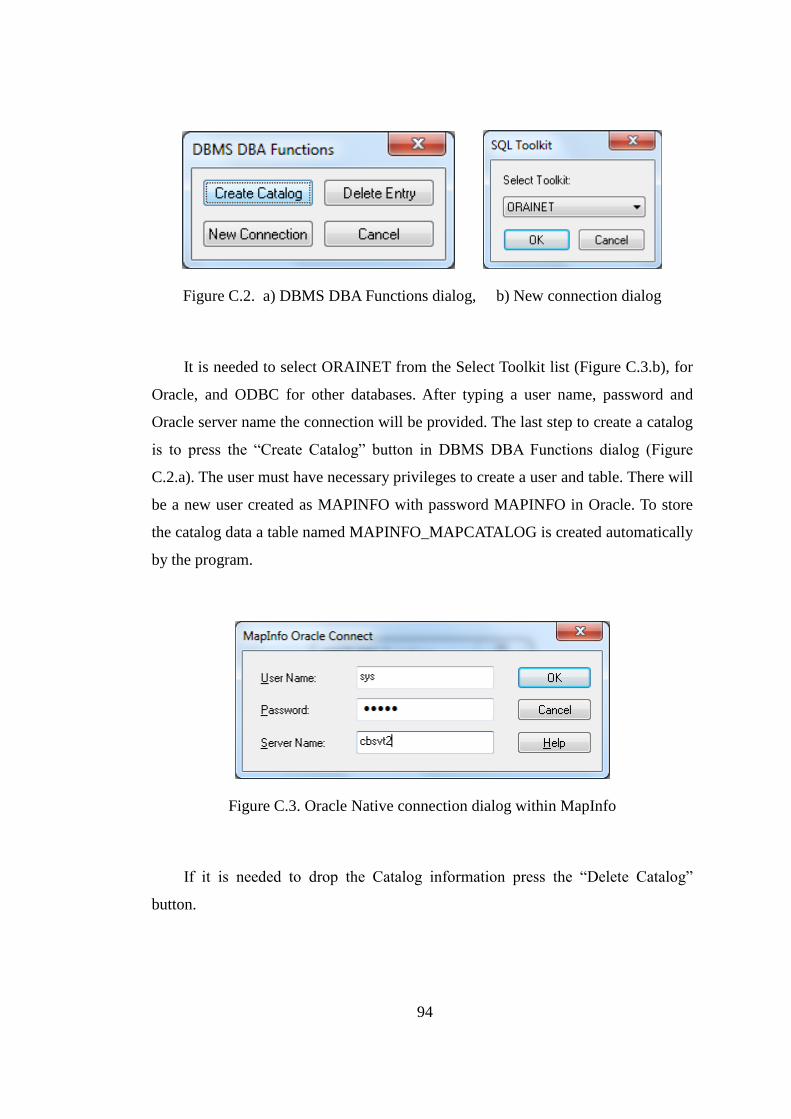
94
Figure C.2. a) DBMS DBA Functions dialog, b) New connection dialog
It is needed to select ORAINET from the Select Toolkit list (Figure C.3.b), for
Oracle, and ODBC for other databases. After typing a user name, password and
Oracle server name the connection will be provided. The last step to create a catalog
is to press the “Create Catalog” button in DBMS DBA Functions dialog (Figure
C.2.a). The user must have necessary privileges to create a user and table. There will
be a new user created as MAPINFO with password MAPINFO in Oracle. To store
the catalog data a table named MAPINFO_MAPCATALOG is created automatically
by the program.
Figure C.3. Oracle Native connection dialog within MapInfo
If it is needed to drop the Catalog information press the “Delete Catalog”
button.
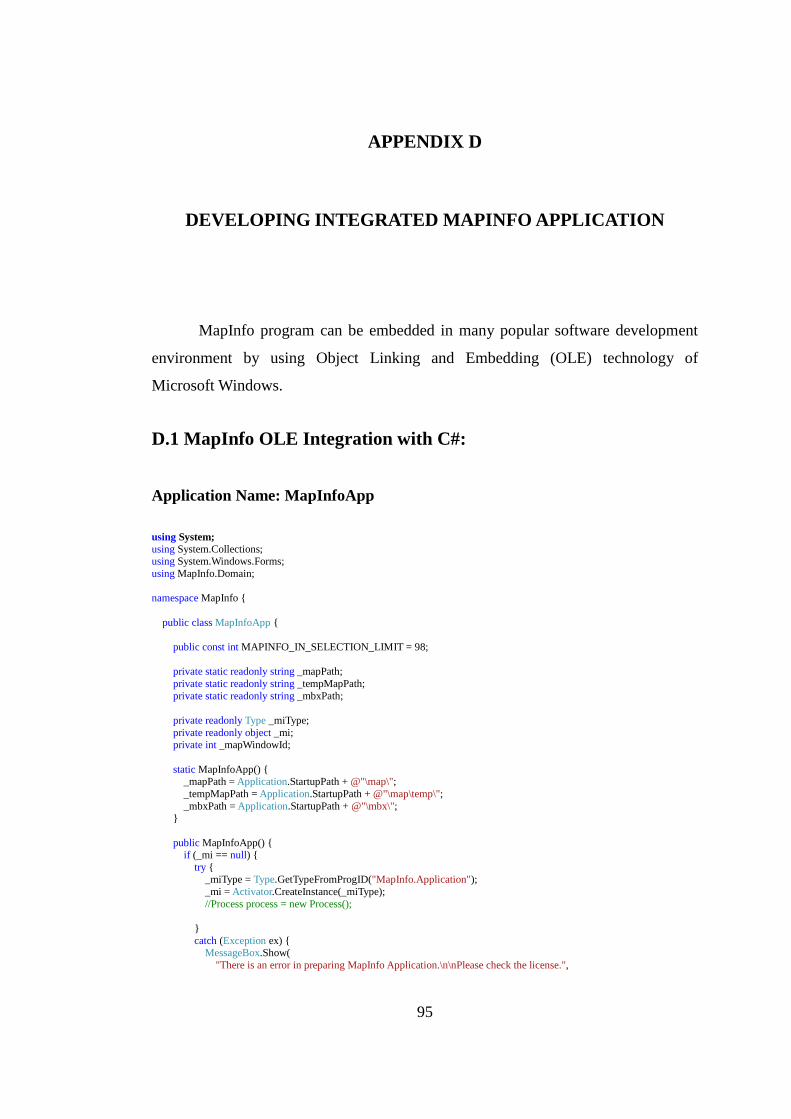
95
APPENDIX D
DEVELOPING INTEGRATED MAPINFO APPLICATION
MapInfo program can be embedded in many popular software development
environment by using Object Linking and Embedding (OLE) technology of
Microsoft Windows.
D.1 MapInfo OLE Integration with C#:
Application Name: MapInfoApp
using System;
using System.Collections; using System.Windows.Forms;
using MapInfo.Domain;
namespace MapInfo {
public class MapInfoApp {
public const int MAPINFO_IN_SELECTION_LIMIT = 98;
private static readonly string _mapPath;
private static readonly string _tempMapPath;
private static readonly string _mbxPath;
private readonly Type _miType;
private readonly object _mi; private int _mapWindowId;
static MapInfoApp() { _mapPath = Application.StartupPath + @"\map\";
_tempMapPath = Application.StartupPath + @"\map\temp\";
_mbxPath = Application.StartupPath + @"\mbx\"; }
public MapInfoApp() { if (_mi == null) {
try { _miType = Type.GetTypeFromProgID("MapInfo.Application");
_mi = Activator.CreateInstance(_miType);
//Process process = new Process();
}
catch (Exception ex) { MessageBox.Show(
"There is an error in preparing MapInfo Application.\n\nPlease check the license.",
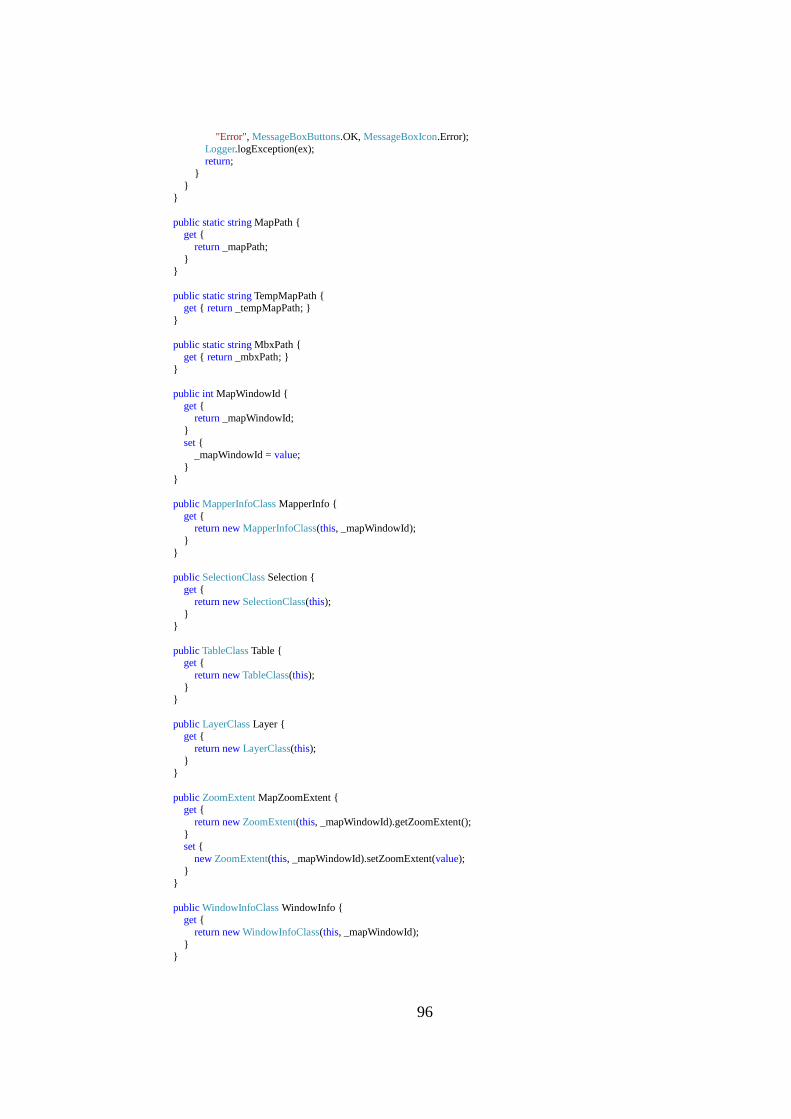
96
"Error", MessageBoxButtons.OK, MessageBoxIcon.Error);
Logger.logException(ex); return;
}
} }
public static string MapPath { get {
return _mapPath;
} }
public static string TempMapPath { get { return _tempMapPath; }
}
public static string MbxPath {
get { return _mbxPath; }
}
public int MapWindowId {
get { return _mapWindowId;
}
set { _mapWindowId = value;
}
}
public MapperInfoClass MapperInfo {
get { return new MapperInfoClass(this, _mapWindowId);
}
}
public SelectionClass Selection {
get { return new SelectionClass(this);
} }
public TableClass Table { get {
return new TableClass(this);
} }
public LayerClass Layer { get {
return new LayerClass(this);
} }
public ZoomExtent MapZoomExtent { get {
return new ZoomExtent(this, _mapWindowId).getZoomExtent();
} set {
new ZoomExtent(this, _mapWindowId).setZoomExtent(value);
} }
public WindowInfoClass WindowInfo { get {
return new WindowInfoClass(this, _mapWindowId);
} }
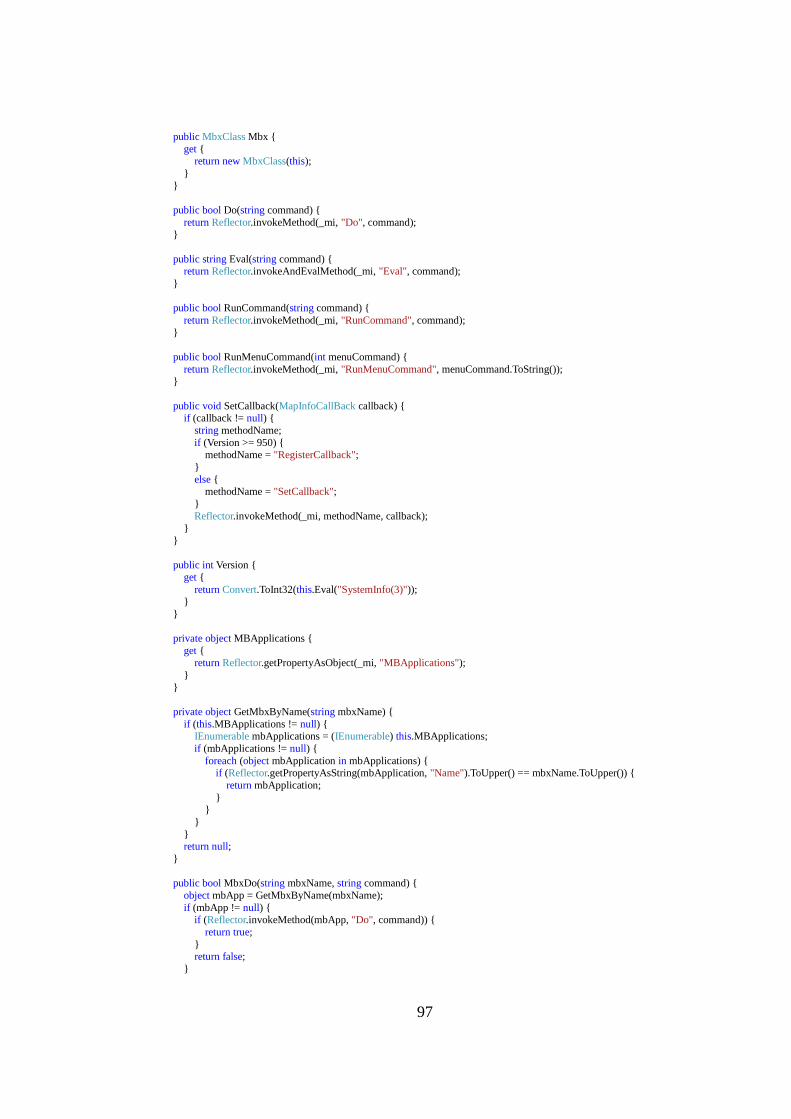
97
public MbxClass Mbx {
get { return new MbxClass(this);
}
}
public bool Do(string command) {
return Reflector.invokeMethod(_mi, "Do", command); }
public string Eval(string command) { return Reflector.invokeAndEvalMethod(_mi, "Eval", command);
}
public bool RunCommand(string command) {
return Reflector.invokeMethod(_mi, "RunCommand", command);
}
public bool RunMenuCommand(int menuCommand) {
return Reflector.invokeMethod(_mi, "RunMenuCommand", menuCommand.ToString()); }
public void SetCallback(MapInfoCallBack callback) { if (callback != null) {
string methodName;
if (Version >= 950) { methodName = "RegisterCallback";
}
else { methodName = "SetCallback";
}
Reflector.invokeMethod(_mi, methodName, callback); }
}
public int Version {
get {
return Convert.ToInt32(this.Eval("SystemInfo(3)")); }
}
private object MBApplications {
get { return Reflector.getPropertyAsObject(_mi, "MBApplications");
}
}
private object GetMbxByName(string mbxName) {
if (this.MBApplications != null) { IEnumerable mbApplications = (IEnumerable) this.MBApplications;
if (mbApplications != null) {
foreach (object mbApplication in mbApplications) { if (Reflector.getPropertyAsString(mbApplication, "Name").ToUpper() == mbxName.ToUpper()) {
return mbApplication;
} }
}
} return null;
}
public bool MbxDo(string mbxName, string command) {
object mbApp = GetMbxByName(mbxName);
if (mbApp != null) { if (Reflector.invokeMethod(mbApp, "Do", command)) {
return true;
} return false;
}
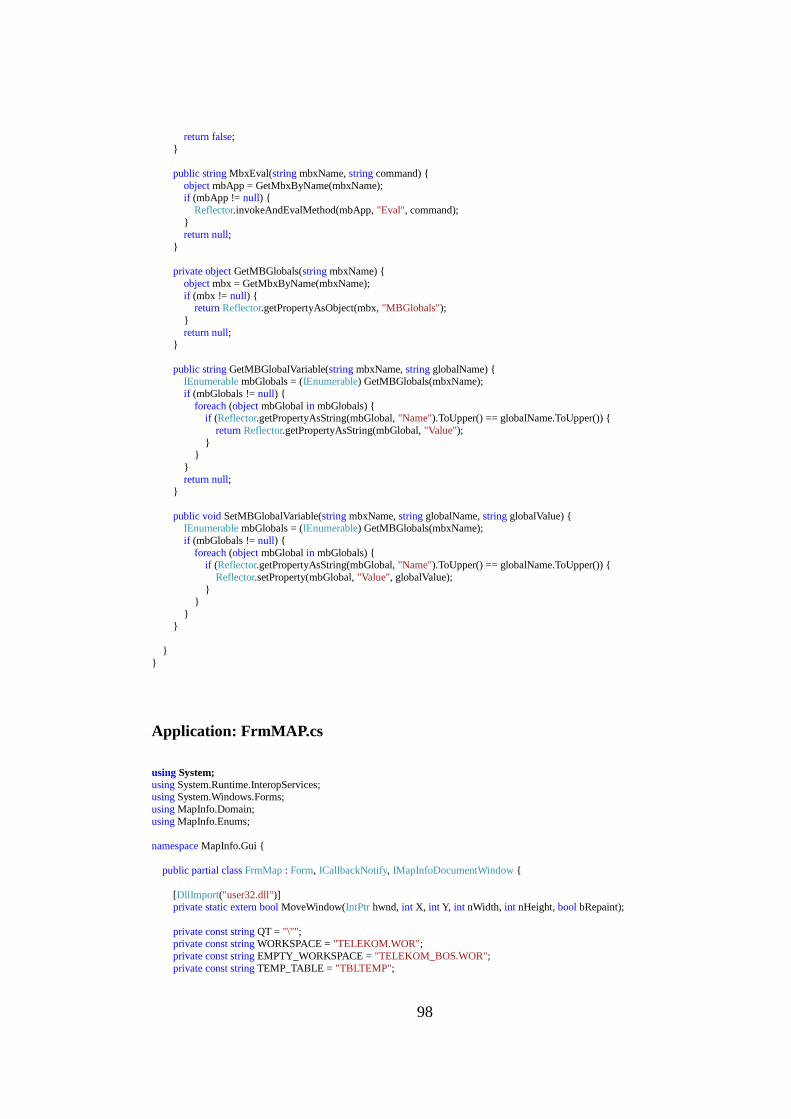
98
return false;
}
public string MbxEval(string mbxName, string command) {
object mbApp = GetMbxByName(mbxName); if (mbApp != null) {
Reflector.invokeAndEvalMethod(mbApp, "Eval", command);
} return null;
}
private object GetMBGlobals(string mbxName) {
object mbx = GetMbxByName(mbxName);
if (mbx != null) { return Reflector.getPropertyAsObject(mbx, "MBGlobals");
}
return null; }
public string GetMBGlobalVariable(string mbxName, string globalName) { IEnumerable mbGlobals = (IEnumerable) GetMBGlobals(mbxName);
if (mbGlobals != null) {
foreach (object mbGlobal in mbGlobals) { if (Reflector.getPropertyAsString(mbGlobal, "Name").ToUpper() == globalName.ToUpper()) {
return Reflector.getPropertyAsString(mbGlobal, "Value");
} }
}
return null; }
public void SetMBGlobalVariable(string mbxName, string globalName, string globalValue) { IEnumerable mbGlobals = (IEnumerable) GetMBGlobals(mbxName);
if (mbGlobals != null) {
foreach (object mbGlobal in mbGlobals) { if (Reflector.getPropertyAsString(mbGlobal, "Name").ToUpper() == globalName.ToUpper()) {
Reflector.setProperty(mbGlobal, "Value", globalValue);
} }
} }
} }
Application: FrmMAP.cs
using System;
using System.Runtime.InteropServices; using System.Windows.Forms;
using MapInfo.Domain;
using MapInfo.Enums;
namespace MapInfo.Gui {
public partial class FrmMap : Form, ICallbackNotify, IMapInfoDocumentWindow {
[DllImport("user32.dll")] private static extern bool MoveWindow(IntPtr hwnd, int X, int Y, int nWidth, int nHeight, bool bRepaint);
private const string QT = "\""; private const string WORKSPACE = "TELEKOM.WOR";
private const string EMPTY_WORKSPACE = "TELEKOM_BOS.WOR";
private const string TEMP_TABLE = "TBLTEMP";
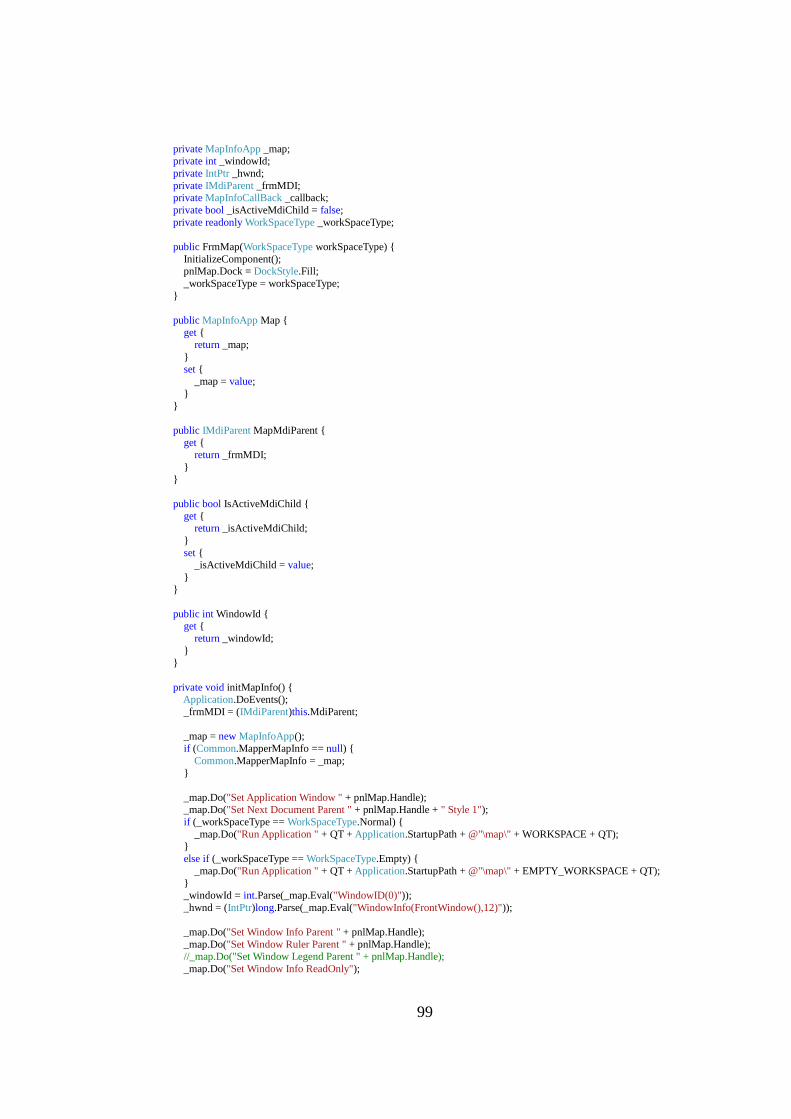
99
private MapInfoApp _map; private int _windowId;
private IntPtr _hwnd;
private IMdiParent _frmMDI; private MapInfoCallBack _callback;
private bool _isActiveMdiChild = false;
private readonly WorkSpaceType _workSpaceType;
public FrmMap(WorkSpaceType workSpaceType) {
InitializeComponent(); pnlMap.Dock = DockStyle.Fill;
_workSpaceType = workSpaceType;
}
public MapInfoApp Map {
get { return _map;
}
set { _map = value;
}
}
public IMdiParent MapMdiParent {
get { return _frmMDI;
}
}
public bool IsActiveMdiChild {
get { return _isActiveMdiChild;
}
set { _isActiveMdiChild = value;
}
}
public int WindowId { get {
return _windowId;
} }
private void initMapInfo() { Application.DoEvents();
_frmMDI = (IMdiParent)this.MdiParent;
_map = new MapInfoApp();
if (Common.MapperMapInfo == null) {
Common.MapperMapInfo = _map; }
_map.Do("Set Application Window " + pnlMap.Handle); _map.Do("Set Next Document Parent " + pnlMap.Handle + " Style 1");
if (_workSpaceType == WorkSpaceType.Normal) {
_map.Do("Run Application " + QT + Application.StartupPath + @"\map\" + WORKSPACE + QT); }
else if (_workSpaceType == WorkSpaceType.Empty) {
_map.Do("Run Application " + QT + Application.StartupPath + @"\map\" + EMPTY_WORKSPACE + QT); }
_windowId = int.Parse(_map.Eval("WindowID(0)"));
_hwnd = (IntPtr)long.Parse(_map.Eval("WindowInfo(FrontWindow(),12)"));
_map.Do("Set Window Info Parent " + pnlMap.Handle);
_map.Do("Set Window Ruler Parent " + pnlMap.Handle); //_map.Do("Set Window Legend Parent " + pnlMap.Handle);
_map.Do("Set Window Info ReadOnly");

100
_map.Do("Set Coordsys Window FrontWindow()");
_map.Do("Set Map Coordsys Window FrontWindow()"); //TODO:
_map.Do("Set Map Distance Units " + QT + DistanceUnit.METER + QT);
_map.Do("Set Map Area Units " + QT + AreaUnit.SQUARE_METER + QT); _map.Do("Set Map Display Position");
_map.Do("Set Format Date " + QT + "US" + QT);
_map.Do("Set ProgressBars Off");
_map.MapWindowId = _windowId;
_map.RunMenuCommand(ToolManager.ActiveMapTool); _callback = new MapInfoCallBack(this);
_map.SetCallback(_callback);
}
public void Form_Load(object sender, EventArgs e) {
initMapInfo(); }
public void Form_Activated(object sender, EventArgs e) { _isActiveMdiChild = true;
WindowManager.ActiveChildForm = this;
_frmMDI.setStatusPanelsForMap(); _frmMDI.resetStatusBar();
//TODO: Tamamla
//_frmMDI.setMapRelatedButtons(true); }
public void Form_Deactivate(object sender, EventArgs e) { _isActiveMdiChild = false;
//_frmMDI.setMapRelatedButtons(false);
//_frmMDI.setGraphRelatedButtons(false); _frmMDI.resetStatusBar();
}
private void FrmMap_FormClosing(object sender, FormClosingEventArgs e) {
_map.Table.pack(TEMP_TABLE);
}
public void Form_Resize(object sender, EventArgs e) { MoveWindow(_hwnd, 0, 0, pnlMap.Width, pnlMap.Height, false);
}
public void Form_FormClosed(object sender, FormClosedEventArgs e) {
_map.SetCallback(null);
_callback = null; // TODO:
_map = null;
GC.Collect(); GC.WaitForPendingFinalizers();
}
public void OnStatusBarTextChanged(string text) {
if (_isActiveMdiChild) {
int indexOfEditingLayer = text.IndexOf("Editing:"); if (indexOfEditingLayer != -1) {
string s = text.Replace("\t", " ");
int indexOfSelectingLayer = s.IndexOf("Selecting:"); string coords = s.Substring(0, indexOfEditingLayer - 1);
coords = coords.Replace(",", ".");
coords = coords.Replace("m.", "m,"); string editingLayer = s.Substring(indexOfEditingLayer, indexOfSelectingLayer - indexOfEditingLayer - 1);
editingLayer = editingLayer.Replace("Editing", "Düzenlenen");
editingLayer = editingLayer.Replace("None", "Yok"); editingLayer = editingLayer.Replace("No", "Yok");
string selectingLayer = s.Substring(indexOfSelectingLayer, s.Length - indexOfSelectingLayer - 1);
selectingLayer = selectingLayer.Replace("Selecting", "Seçilen"); selectingLayer = selectingLayer.Replace("None", "Yok");
selectingLayer = selectingLayer.Replace("No", "Yok");
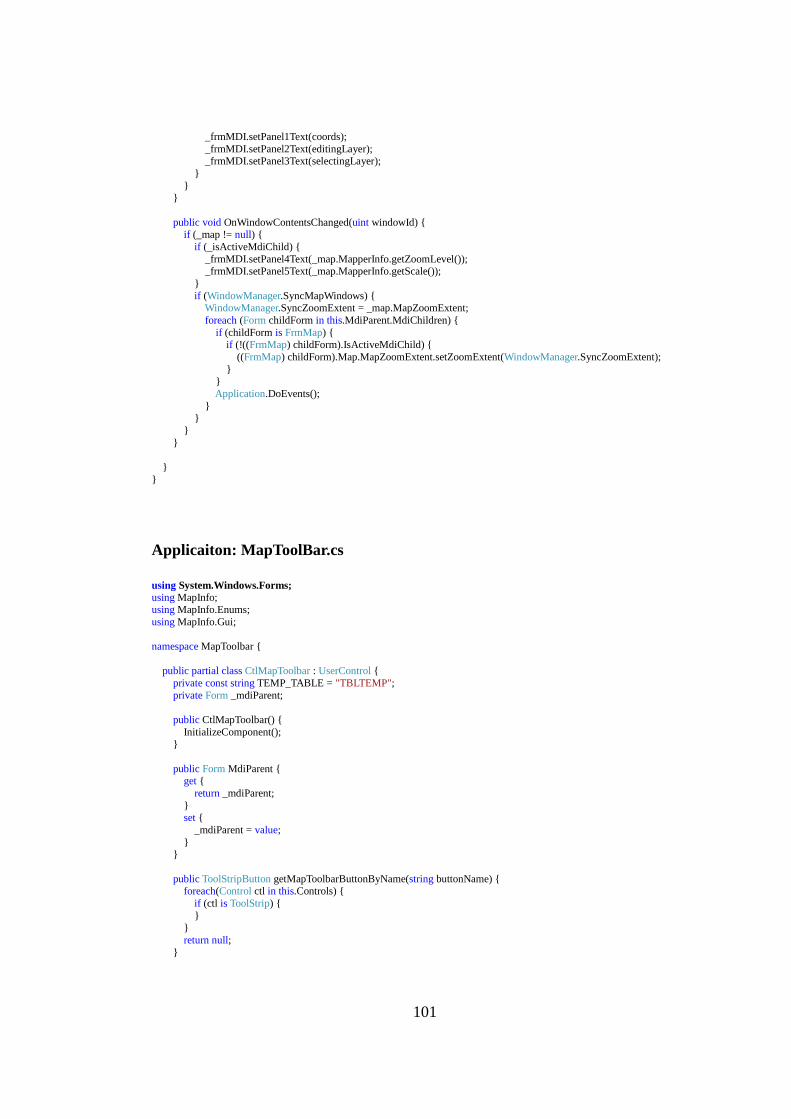
101
_frmMDI.setPanel1Text(coords);
_frmMDI.setPanel2Text(editingLayer); _frmMDI.setPanel3Text(selectingLayer);
}
} }
public void OnWindowContentsChanged(uint windowId) { if (_map != null) {
if (_isActiveMdiChild) {
_frmMDI.setPanel4Text(_map.MapperInfo.getZoomLevel()); _frmMDI.setPanel5Text(_map.MapperInfo.getScale());
}
if (WindowManager.SyncMapWindows) { WindowManager.SyncZoomExtent = _map.MapZoomExtent;
foreach (Form childForm in this.MdiParent.MdiChildren) {
if (childForm is FrmMap) { if (!((FrmMap) childForm).IsActiveMdiChild) {
((FrmMap) childForm).Map.MapZoomExtent.setZoomExtent(WindowManager.SyncZoomExtent);
} }
Application.DoEvents();
} }
}
}
}
}
Applicaiton: MapToolBar.cs
using System.Windows.Forms;
using MapInfo; using MapInfo.Enums;
using MapInfo.Gui;
namespace MapToolbar {
public partial class CtlMapToolbar : UserControl {
private const string TEMP_TABLE = "TBLTEMP";
private Form _mdiParent;
public CtlMapToolbar() {
InitializeComponent(); }
public Form MdiParent { get {
return _mdiParent;
} set {
_mdiParent = value;
} }
public ToolStripButton getMapToolbarButtonByName(string buttonName) { foreach(Control ctl in this.Controls) {
if (ctl is ToolStrip) {
} }
return null;
}
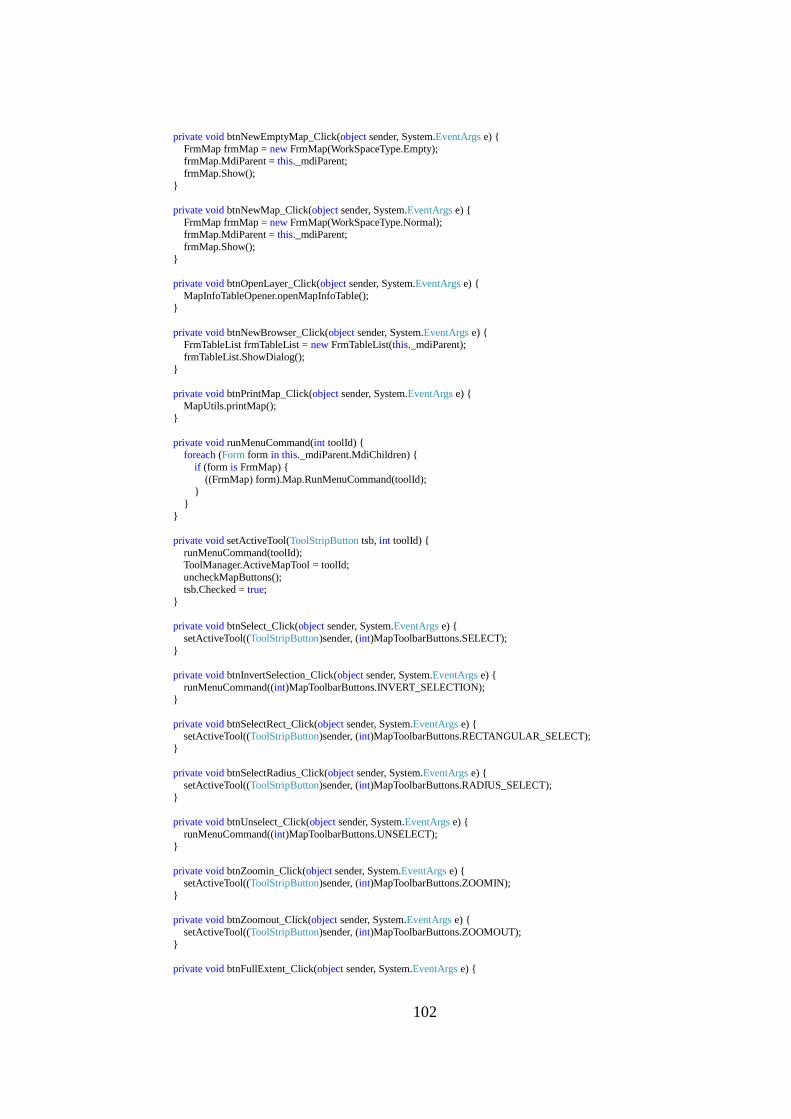
102
private void btnNewEmptyMap_Click(object sender, System.EventArgs e) {
FrmMap frmMap = new FrmMap(WorkSpaceType.Empty); frmMap.MdiParent = this._mdiParent;
frmMap.Show();
}
private void btnNewMap_Click(object sender, System.EventArgs e) {
FrmMap frmMap = new FrmMap(WorkSpaceType.Normal); frmMap.MdiParent = this._mdiParent;
frmMap.Show();
}
private void btnOpenLayer_Click(object sender, System.EventArgs e) {
MapInfoTableOpener.openMapInfoTable(); }
private void btnNewBrowser_Click(object sender, System.EventArgs e) { FrmTableList frmTableList = new FrmTableList(this._mdiParent);
frmTableList.ShowDialog();
}
private void btnPrintMap_Click(object sender, System.EventArgs e) {
MapUtils.printMap(); }
private void runMenuCommand(int toolId) { foreach (Form form in this._mdiParent.MdiChildren) {
if (form is FrmMap) {
((FrmMap) form).Map.RunMenuCommand(toolId); }
}
}
private void setActiveTool(ToolStripButton tsb, int toolId) {
runMenuCommand(toolId); ToolManager.ActiveMapTool = toolId;
uncheckMapButtons();
tsb.Checked = true; }
private void btnSelect_Click(object sender, System.EventArgs e) {
setActiveTool((ToolStripButton)sender, (int)MapToolbarButtons.SELECT);
}
private void btnInvertSelection_Click(object sender, System.EventArgs e) {
runMenuCommand((int)MapToolbarButtons.INVERT_SELECTION); }
private void btnSelectRect_Click(object sender, System.EventArgs e) { setActiveTool((ToolStripButton)sender, (int)MapToolbarButtons.RECTANGULAR_SELECT);
}
private void btnSelectRadius_Click(object sender, System.EventArgs e) {
setActiveTool((ToolStripButton)sender, (int)MapToolbarButtons.RADIUS_SELECT);
}
private void btnUnselect_Click(object sender, System.EventArgs e) {
runMenuCommand((int)MapToolbarButtons.UNSELECT); }
private void btnZoomin_Click(object sender, System.EventArgs e) { setActiveTool((ToolStripButton)sender, (int)MapToolbarButtons.ZOOMIN);
}
private void btnZoomout_Click(object sender, System.EventArgs e) {
setActiveTool((ToolStripButton)sender, (int)MapToolbarButtons.ZOOMOUT);
}
private void btnFullExtent_Click(object sender, System.EventArgs e) {
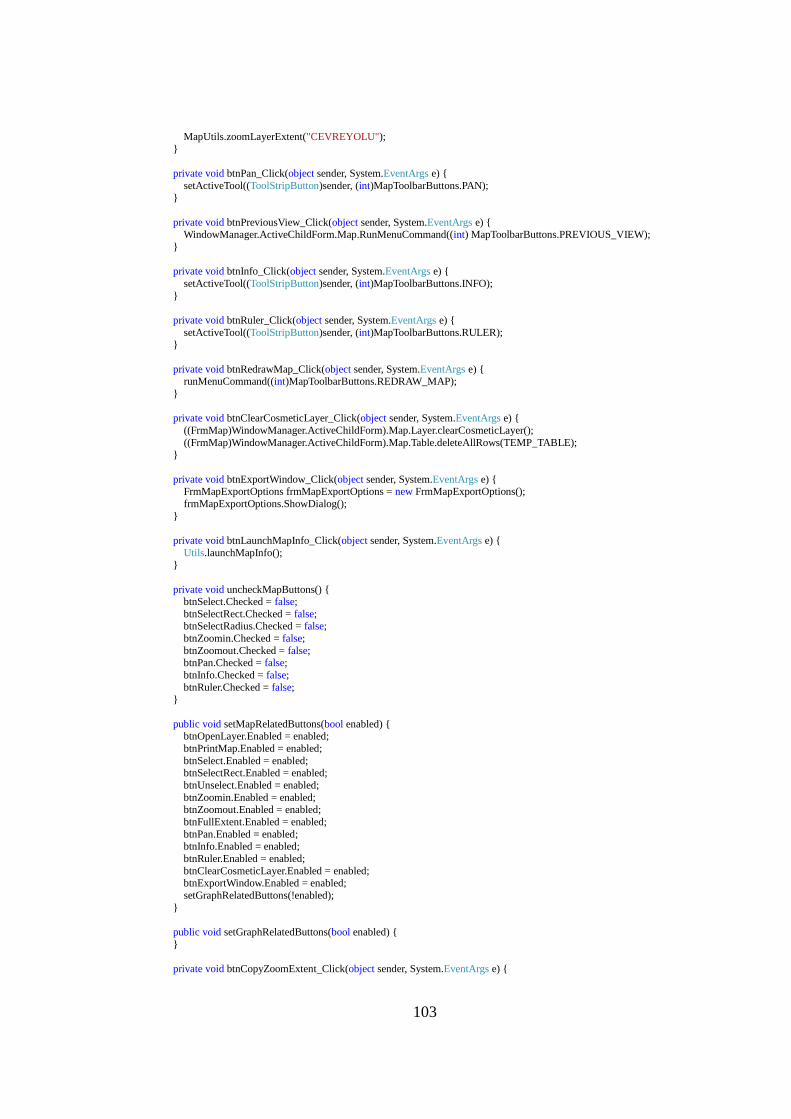
103
MapUtils.zoomLayerExtent("CEVREYOLU");
}
private void btnPan_Click(object sender, System.EventArgs e) {
setActiveTool((ToolStripButton)sender, (int)MapToolbarButtons.PAN); }
private void btnPreviousView_Click(object sender, System.EventArgs e) { WindowManager.ActiveChildForm.Map.RunMenuCommand((int) MapToolbarButtons.PREVIOUS_VIEW);
}
private void btnInfo_Click(object sender, System.EventArgs e) {
setActiveTool((ToolStripButton)sender, (int)MapToolbarButtons.INFO);
}
private void btnRuler_Click(object sender, System.EventArgs e) {
setActiveTool((ToolStripButton)sender, (int)MapToolbarButtons.RULER); }
private void btnRedrawMap_Click(object sender, System.EventArgs e) { runMenuCommand((int)MapToolbarButtons.REDRAW_MAP);
}
private void btnClearCosmeticLayer_Click(object sender, System.EventArgs e) {
((FrmMap)WindowManager.ActiveChildForm).Map.Layer.clearCosmeticLayer();
((FrmMap)WindowManager.ActiveChildForm).Map.Table.deleteAllRows(TEMP_TABLE); }
private void btnExportWindow_Click(object sender, System.EventArgs e) { FrmMapExportOptions frmMapExportOptions = new FrmMapExportOptions();
frmMapExportOptions.ShowDialog();
}
private void btnLaunchMapInfo_Click(object sender, System.EventArgs e) {
Utils.launchMapInfo(); }
private void uncheckMapButtons() { btnSelect.Checked = false;
btnSelectRect.Checked = false; btnSelectRadius.Checked = false;
btnZoomin.Checked = false;
btnZoomout.Checked = false; btnPan.Checked = false;
btnInfo.Checked = false;
btnRuler.Checked = false; }
public void setMapRelatedButtons(bool enabled) { btnOpenLayer.Enabled = enabled;
btnPrintMap.Enabled = enabled;
btnSelect.Enabled = enabled; btnSelectRect.Enabled = enabled;
btnUnselect.Enabled = enabled;
btnZoomin.Enabled = enabled; btnZoomout.Enabled = enabled;
btnFullExtent.Enabled = enabled;
btnPan.Enabled = enabled; btnInfo.Enabled = enabled;
btnRuler.Enabled = enabled;
btnClearCosmeticLayer.Enabled = enabled; btnExportWindow.Enabled = enabled;
setGraphRelatedButtons(!enabled);
}
public void setGraphRelatedButtons(bool enabled) {
}
private void btnCopyZoomExtent_Click(object sender, System.EventArgs e) {
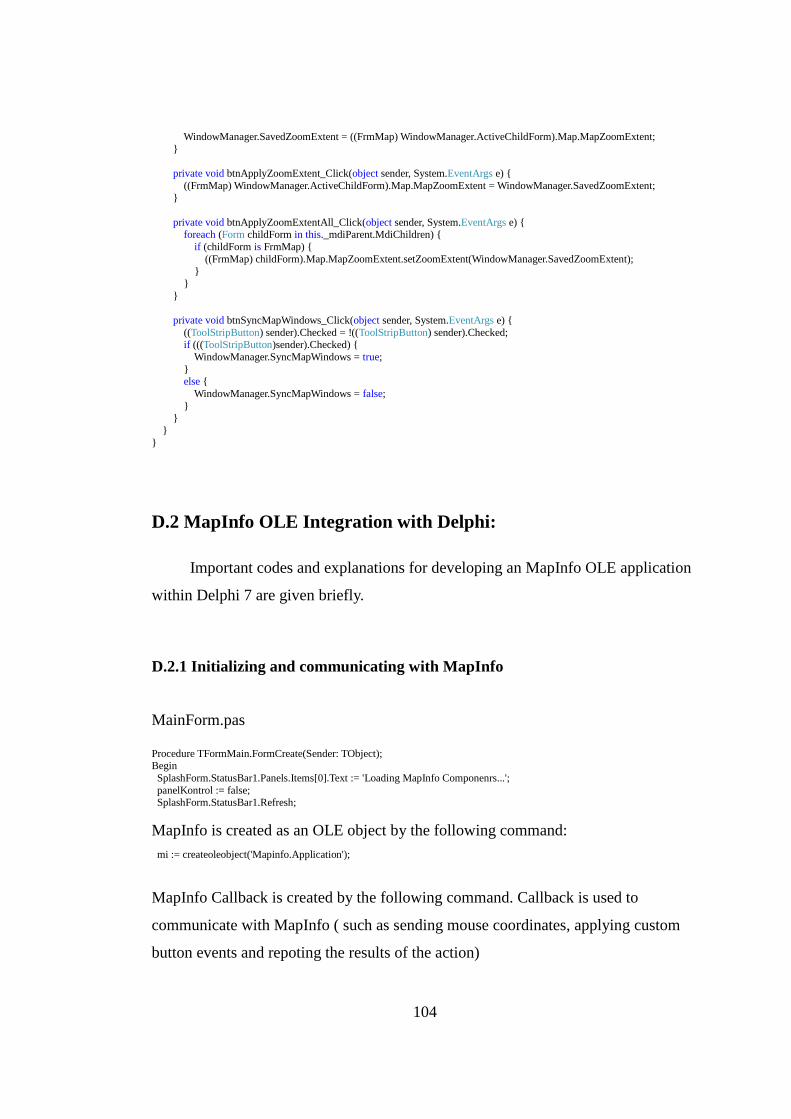
104
WindowManager.SavedZoomExtent = ((FrmMap) WindowManager.ActiveChildForm).Map.MapZoomExtent;
}
private void btnApplyZoomExtent_Click(object sender, System.EventArgs e) {
((FrmMap) WindowManager.ActiveChildForm).Map.MapZoomExtent = WindowManager.SavedZoomExtent; }
private void btnApplyZoomExtentAll_Click(object sender, System.EventArgs e) { foreach (Form childForm in this._mdiParent.MdiChildren) {
if (childForm is FrmMap) {
((FrmMap) childForm).Map.MapZoomExtent.setZoomExtent(WindowManager.SavedZoomExtent); }
}
}
private void btnSyncMapWindows_Click(object sender, System.EventArgs e) {
((ToolStripButton) sender).Checked = !((ToolStripButton) sender).Checked; if (((ToolStripButton)sender).Checked) {
WindowManager.SyncMapWindows = true;
} else {
WindowManager.SyncMapWindows = false;
} }
}
}
D.2 MapInfo OLE Integration with Delphi:
Important codes and explanations for developing an MapInfo OLE application
within Delphi 7 are given briefly.
D.2.1 Initializing and communicating with MapInfo
MainForm.pas
Procedure TFormMain.FormCreate(Sender: TObject); Begin
SplashForm.StatusBar1.Panels.Items[0].Text := 'Loading MapInfo Componenrs...';
panelKontrol := false; SplashForm.StatusBar1.Refresh;
MapInfo is created as an OLE object by the following command:
mi := createoleobject('Mapinfo.Application');
MapInfo Callback is created by the following command. Callback is used to
communicate with MapInfo ( such as sending mouse coordinates, applying custom
button events and repoting the results of the action)
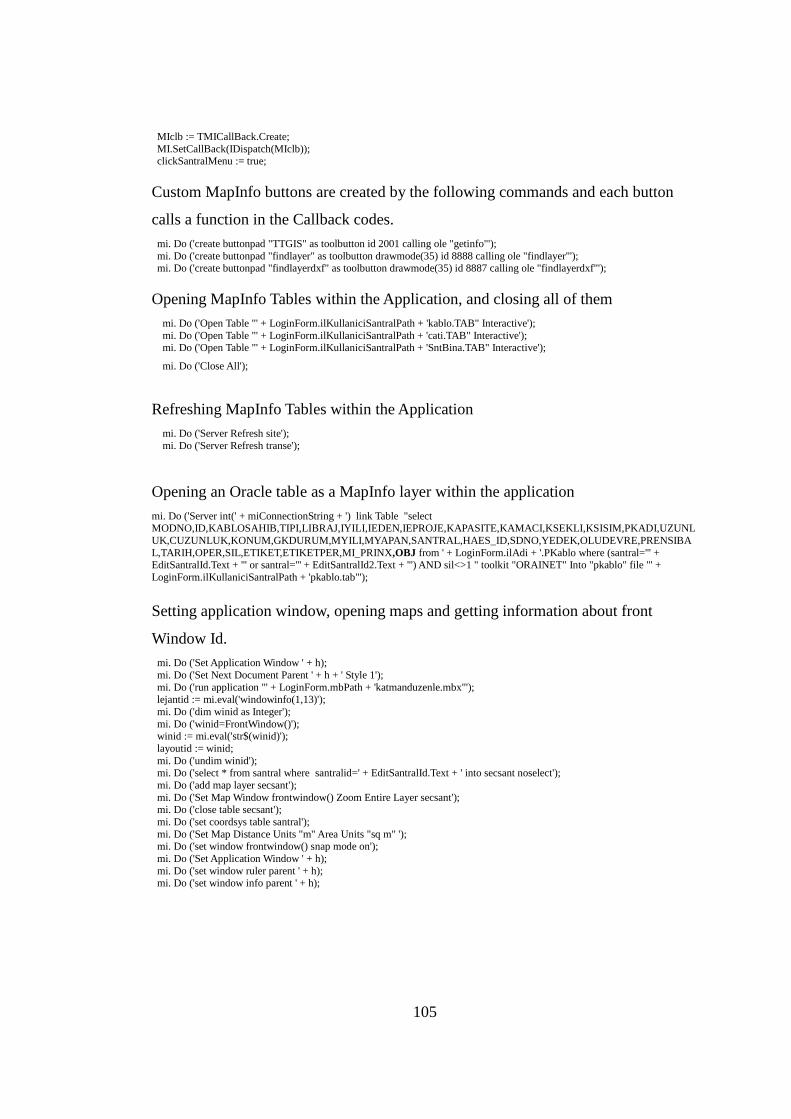
105
MIclb := TMICallBack.Create;
MI.SetCallBack(IDispatch(MIclb)); clickSantralMenu := true;
Custom MapInfo buttons are created by the following commands and each button
calls a function in the Callback codes.
mi. Do ('create buttonpad "TTGIS" as toolbutton id 2001 calling ole "getinfo"');
mi. Do ('create buttonpad "findlayer" as toolbutton drawmode(35) id 8888 calling ole "findlayer"'); mi. Do ('create buttonpad "findlayerdxf" as toolbutton drawmode(35) id 8887 calling ole "findlayerdxf"');
Opening MapInfo Tables within the Application, and closing all of them
mi. Do ('Open Table "' + LoginForm.ilKullaniciSantralPath + 'kablo.TAB" Interactive');
mi. Do ('Open Table "' + LoginForm.ilKullaniciSantralPath + 'cati.TAB" Interactive'); mi. Do ('Open Table "' + LoginForm.ilKullaniciSantralPath + 'SntBina.TAB" Interactive');
mi. Do ('Close All');
Refreshing MapInfo Tables within the Application
mi. Do ('Server Refresh site');
mi. Do ('Server Refresh transe');
Opening an Oracle table as a MapInfo layer within the application
mi. Do ('Server int(' + miConnectionString + ') link Table "select MODNO,ID,KABLOSAHIB,TIPI,LIBRAJ,IYILI,IEDEN,IEPROJE,KAPASITE,KAMACI,KSEKLI,KSISIM,PKADI,UZUNL
UK,CUZUNLUK,KONUM,GKDURUM,MYILI,MYAPAN,SANTRAL,HAES_ID,SDNO,YEDEK,OLUDEVRE,PRENSIBA
L,TARIH,OPER,SIL,ETIKET,ETIKETPER,MI_PRINX,OBJ from ' + LoginForm.ilAdi + '.PKablo where (santral=''' + EditSantralId.Text + ''' or santral=''' + EditSantralId2.Text + ''') AND sil<>1 " toolkit "ORAINET" Into "pkablo" file "' +
LoginForm.ilKullaniciSantralPath + 'pkablo.tab"');
Setting application window, opening maps and getting information about front
Window Id.
mi. Do ('Set Application Window ' + h);
mi. Do ('Set Next Document Parent ' + h + ' Style 1');
mi. Do ('run application "' + LoginForm.mbPath + 'katmanduzenle.mbx"'); lejantid := mi.eval('windowinfo(1,13)');
mi. Do ('dim winid as Integer');
mi. Do ('winid=FrontWindow()'); winid := mi.eval('str$(winid)');
layoutid := winid;
mi. Do ('undim winid'); mi. Do ('select * from santral where santralid=' + EditSantralId.Text + ' into secsant noselect');
mi. Do ('add map layer secsant');
mi. Do ('Set Map Window frontwindow() Zoom Entire Layer secsant'); mi. Do ('close table secsant');
mi. Do ('set coordsys table santral');
mi. Do ('Set Map Distance Units "m" Area Units "sq m" '); mi. Do ('set window frontwindow() snap mode on');
mi. Do ('Set Application Window ' + h);
mi. Do ('set window ruler parent ' + h); mi. Do ('set window info parent ' + h);
106
Setting layers to not to be editable by the users
mi. Do ('Set Table mahalle UserEdit Off');
mi. Do ('Set Table santral UserEdit Off');
Running a MapInfo button or menu within the application by “Run menu command”
Procedure TFormMain.dxBarButton6Click(Sender: TObject);
Begin
mi. Do ('run menu command 1705');
End;
Running a Custom Button or menu within the application by “Run menu command
id” method.
Procedure TFormMain.BlgeSeDiskeKaydet1Click(Sender: TObject); Begin
mi. Do ('run menu command id 8888');
End;
Getting information from MapInfo by “.eval” method
If mi.eval('numtables()') <> '0' Then
Begin layerCount := strtoint(mi.eval('MapperInfo(' + winid + ',9)'));
If mi.eval('SelectionInfo(1)') <> '' Then
mi. Do ('Set Table ' + tableName + ' Undo Off');
Selecting all object that intersect to a specific object
mi. Do ('select * from transe_route where obj intersects routeob into selkont');
End;
If mi.eval('tableinfo(selkont,8)') > 0 Then Begin
startnode := mi.eval('selkont.fnode');
Selecting objects and adding them into the layer control as a new layer and
differentiating the style to highlight.
mi. Do ('select * from transe_route where lineselected=1 into selroute');
If mi.eval('tableinfo(selroute,8)') > 0 Then
Begin mi. Do ('Add Map Layer selroute');
mi. Do ('set Map Window ' + lejantid + ' Zoom Entire Layer selroute');
mi. Do ('Set Map Layer selroute Display Global Global Line (2,64,16711680)'); End;
107
D.2.2 Login Form and Logging of User Events
Unit Login;
Procedure TLoginForm.DatabaseLoginUser(sicil: String; kullaniciAdi: String);
Var maxCount: String;
Begin
DatabaseConnection; With DataModule3.ADOQueryUserOnUse Do Begin
Connection := DataModule3.ADOConnection1;
SQL.Text := 'UPDATE KULLANICI SET KULLANILIYOR = 1 WHERE SICIL = ' + '''' + sicil + '''' + ' AND KULLANICI_ADI = ' + '''' + kullaniciAdi + '''';
ExecSQL;
SQL.Text := 'SELECT MAX(SESID) FROM LOGIN'; Active := True;
If RecordCount > 0 Then
Begin maxCount := Fields[0].AsString;
If maxCount = '' Then
Begin maxCount := '1';
End
Else Begin
maxCount := IntToStr(StrToInt(maxCount) + 1);
End End
Else
Begin
maxCount := '1';
End;
SQL.Text := 'INSERT INTO LOGIN (SICIL,GIRISTARIH,GIRISSAAT,SESID) VALUES'; SQL.Add(' (' + QuotedStr(sicil) + ',' + QuotedStr(FormatDateTime('dd.mm.yyyy', Now)) + ',' +
QuotedStr(FormatDateTime('hh:nn:ss', Now)) + ',' + QuotedStr(maxCount) + ')');
ExecSQL; EditSesId.Text := maxCount;
End; End;
Procedure TLoginForm.DatabaseLogoutUser(sicil: String; kullaniciAdi: String); Begin
DatabaseConnection;
With DataModule3.ADOQueryUserOnUse Do Begin Connection := DataModule3.ADOConnection1;
SQL.Text := 'UPDATE KULLANICI SET KULLANILIYOR = 0 WHERE SICIL = ' + '''' + sicil + '''' + ' AND
KULLANICI_ADI = ' + '''' + kullaniciAdi + ''''; ExecSQL;
SQL.Text := 'UPDATE LOGIN SET CIKISSAAT = ' + QuotedStr(FormatDateTime('hh:nn:ss', Now)) + ' , CIKISTARIH = ' +
QuotedStr(FormatDateTime('dd.mm.yyyy', Now)) + ' where SESID = ' + EditSesId.Text + ''; ExecSQL;
End;
End;
miConnectionString := mi.eval('Server_Connect ("ORAINET","SRVR=' + ilVt + ';UID=' + ilAdi + ';PWD=' + ilSifre + '")');
SplashForm.StatusBar1.Panels[0].Text := 'Mapinfo-Oracle connection is OK...';
If Not DirectoryExists(ilDataPath) Then
Begin Application.MessageBox('There is no folder for this user, Please apply to Admin ', 'CBS TELEKOM', MB_OK +
MB_ICONWARNING);
End
Recommended