Best in class ‘Value Analysis’in Logistics
Howard James-ScottFCILT
Gati Limited – Supply Chain Solutions
Value Chain Optimisation Core functions that provide the essential warehouse, logistical,
3PL Servicesand channel
(c15 Services) management services.
V C IValue Roadmap
Value added services that build on the
CSIessential 3PL Services
SCO Servicesto deliver extended performance across
(c37 Services)
clients Value Chain.
Deliverables Qualitative Value Generation
Tailored service Optional solutions that complements the ad Services hoc needs of client
(c7 Services)
The Value Creation Initiatives (VCI); core components of S C value propositions.
The Cost Saving Initiatives (CSI); variety of initiatives that aim to optimise a 3PL offers.
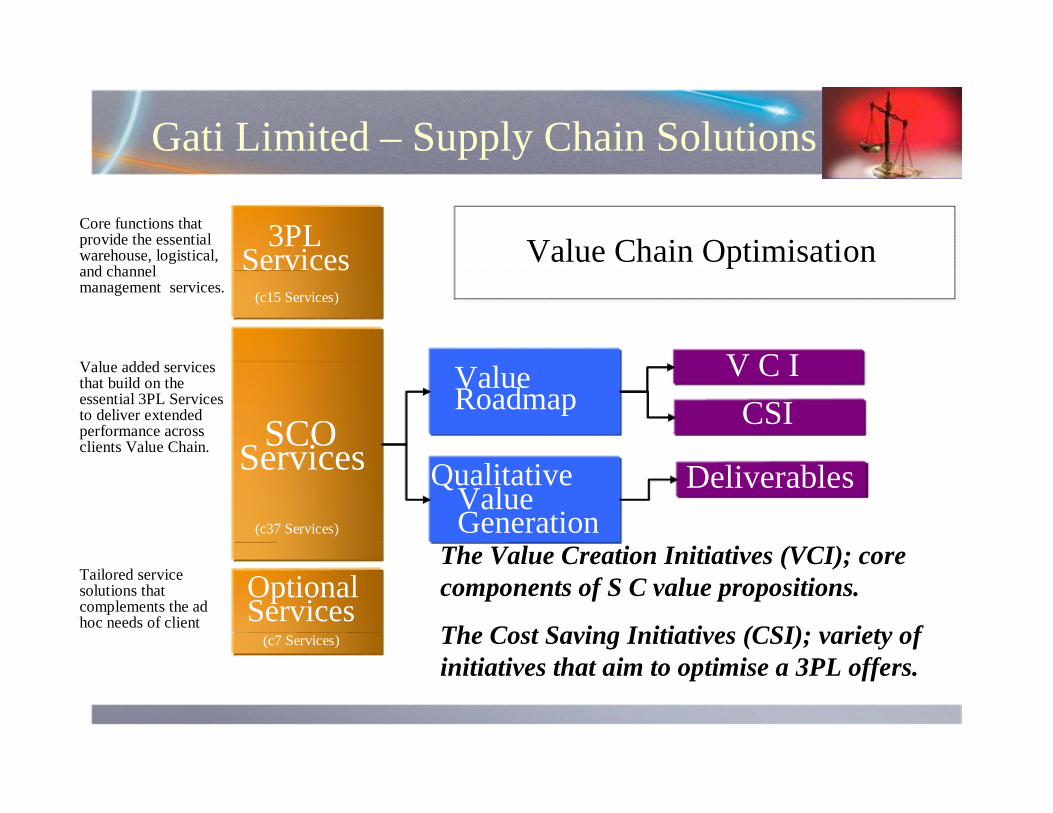
Gati Limited – Supply Chain Solutions
Customer Service
Marketing & Sales
OutboundLogistics
Logistics Services/Warehousing
Purchasing & Collection
Demand &F/C plans
Reverse Logistics
Data Exchange (EDI) AIDC (Bar Code, RFID,…) Integrated web based solutions (S-a-a-S)
Best PracticesS C Strategy Business Process Reengineering
Supplier RelationshipManagement
Warehouse Management System
TransportManagement System
Customer RelationshipManagement
Returns & Warranty Management
Activity BasedCosting & Billing
Workforce Management System
Suppliers Plant CFA Distributors Retail Outlet
Mother Warehouse
Up stream Down stream
C 10 % C 15 % C 15 % C 5 %C 20 % of
the Forward logistics
C 10 %C 20 %With VAS
C 25 %
Demand Planning & Management
Sourcing & Supplier Management
Materials Management
Warehousing & Value Added Services Customer
Support
Returns Management
Transportation Management
VMIOrder Management
Inventory Management
Value Chain Optimisation

Supply Chain Diagnostic Scope Objective: To conduct a supply chain diagnostic in Benefit to the Customer: order to identify an approach to get to
ÉTo develop a partnering approach best-in-class processes for a 3PL+ or with SCM organisation outsourcing the SCO model and value added services supply chain, sourcing and complementing that model (e.g. strategic distribution sourcing).
ÉTo increase overall operational effectiveness
Work summary: ÉTo get a cost savings and value-add analysis for services beyond a 3PL A joint team will conduct a supply chain model diagnostic to identify opportunities for
cost savings, increased operational effectiveness, and the feasibility of various implementation approaches for the correct model.
Full Supply Chain 3PL+ model Services Model
Traditional 3PL model
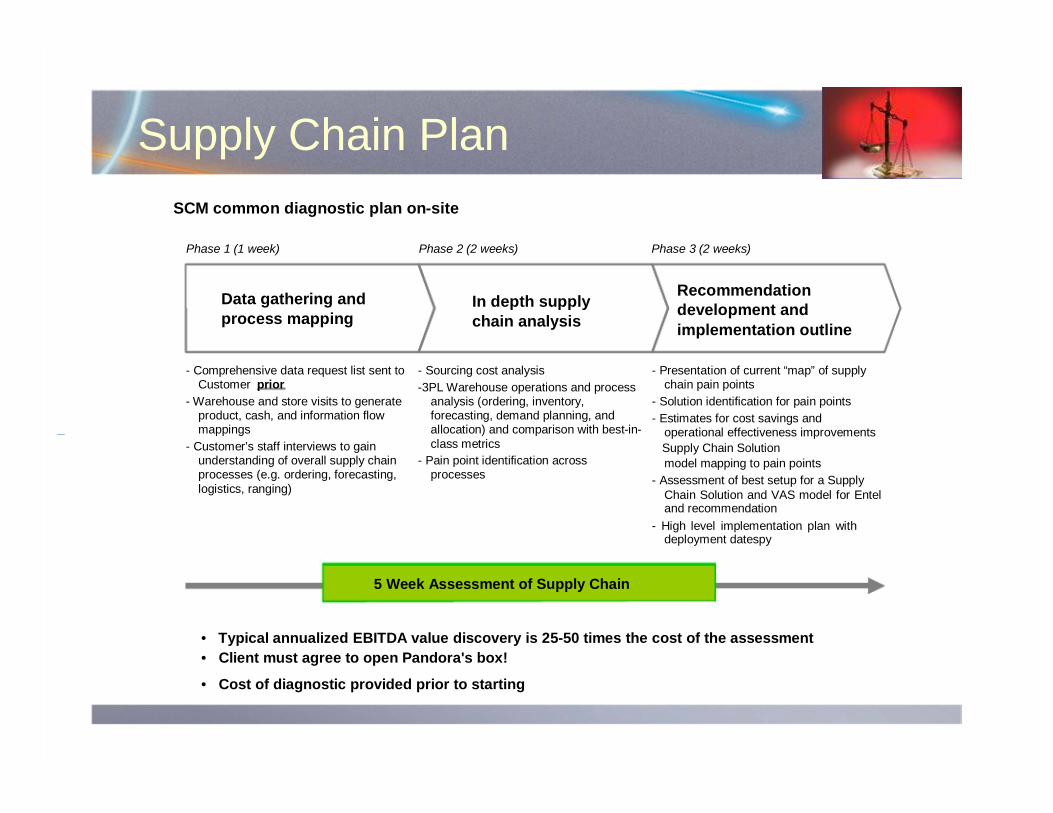
Supply Chain Plan âSCM common diagnostic plan on-site
Phase 1 (1 week) Phase 2 (2 weeks) Phase 3 (2 weeks)
Recommendation Data gathering and In depth supply development and process mapping chain analysis implementation outline
- Comprehensive data request list sent to - Sourcing cost analysis - Presentation of current “map” of supply Customer prior -3PL Warehouse operations and process chain pain points
- Warehouse and store visits to generate analysis (ordering, inventory, - Solution identification for pain points product, cash, and information flow forecasting, demand planning, and - Estimates for cost savings and mappings allocation) and comparison with best-in- operational effectiveness improvements
- Customer’s staff interviews to gain class metrics Supply Chain Solution understanding of overall supply chain - Pain point identification across model mapping to pain points processes (e.g. ordering, forecasting, processes - Assessment of best setup for a Supply logistics, ranging) Chain Solution and VAS model for Entel
and recommendation - High level implementation plan with
deployment datespy
5 Week Assessment of Supply Chain
• Typical annualized EBITDA value discovery is 25-50 times the cost of the assessment • Client must agree to open Pandora's box!
• Cost of diagnostic provided prior to starting

Areas of Supply Chain Diagnostic
Assessment of current supply chain structure
Assessment of Mapping of sourcing cost product flows
and from OEM to effectiveness store
Proposal for implementation of overall supply chain
outsourcingMapping of Assessment of model
information and forecasting and cash flows from demand OEM to store planning and back to the effectiveness Assessment of Carrier
warehouse operations and
logistics management

POTENTIAL COST REDUCTION THROUGH EFFECTIVE LOGISTICS
INTEGRATING WITH SUPPLIERS / CUSTOMERS

Supply Chain Solution
¤ Economies of scale¤ Learning¤ Capacity utilization¤ Linkages among activities¤ Inter - relationships among business units¤ Degree of vertical integration¤ Timing of market entry¤ Firm's policy of cost or differentiation¤ Geographic location¤ Institutional factors (regulation, union activity, taxes, etc.)
Supply Chain Solution
¤ NEW CARRIERS
¤ FREIGHT COSTS
¤ IMPROVE SHIPPING
¤ TECHNOLOGY
¤ MANAGING RETURNS
¤ PROCESS & COST AUDIT

Supply Chain Solution
¤ BUYER – SUPPLIER INVENTORY SYNCHRONIZATION
¤ REDUCED INVENTORY CARRYING COST
¤ REDUCED RISK OF WORKING CAPITAL EVAPORATION
¤ IMPROVED TURNOVER & LOAD FACTOR
¤ REDUCTION OF OBSOLESCENCE LOSSES
¤ REALIZATION OF COST – PROFIT LEVERAGE
¤ ELIMINATION OF LOW FREQUENCY HIGH SEVERITY LOSS

Supply Chain Solution
Operator Case Study
• Supply Chain Map • Savings & Testimony

Clients End-to-End Supply Chain Diagnostic Supplier Performance Weak Stock levels too high Too many slow movers
Unhappy channels DC cost structure too high Too many stock outs (price, credit, OM, CC)
DC Distributor % Subsidised Stock Balancing % Slow Vendors Distributors Channels Consumer DTC % Cost ($/unit) DTC % Phones (H/M/L) Moving Phones
OFLT Channel Weeks % of Shadow (weeks) Cover FCA % Units Sold Demand %
75 81 NA 25 1.5MSC Stock Value No1 $4.55 call center $50M 32 N/A 60 and online 5 7
Turns 11/year 80 70 H 25 3
Head Count Owned Stores No2 $4.55 11 FTEs (122) 35 6 50 27 7
OPEX 65 70 L 15 3.5 $22M Franchise No3 $4.55
Volume (149) 45 2-4 70 17 6 2.2M
6 1,000 orders/day, Dealer Dealer $4.55 No4 ow 500 B2C DC Telco (842) 55 80 30 L M 15 Gen (2984) 2,800 lines/day 2-4 85 51 6 6 3 PL fee Indy Routes No5 $4.55 $5.36/unit* (11,544) 85 Discos
$4.55 100%=15,574 2.2M Order Fill Rate 67% ~5% returns Line Fill Rate 83% $70/unit DIFOT in stock 99.8% Reverse Logistics % orders in stock ~90%
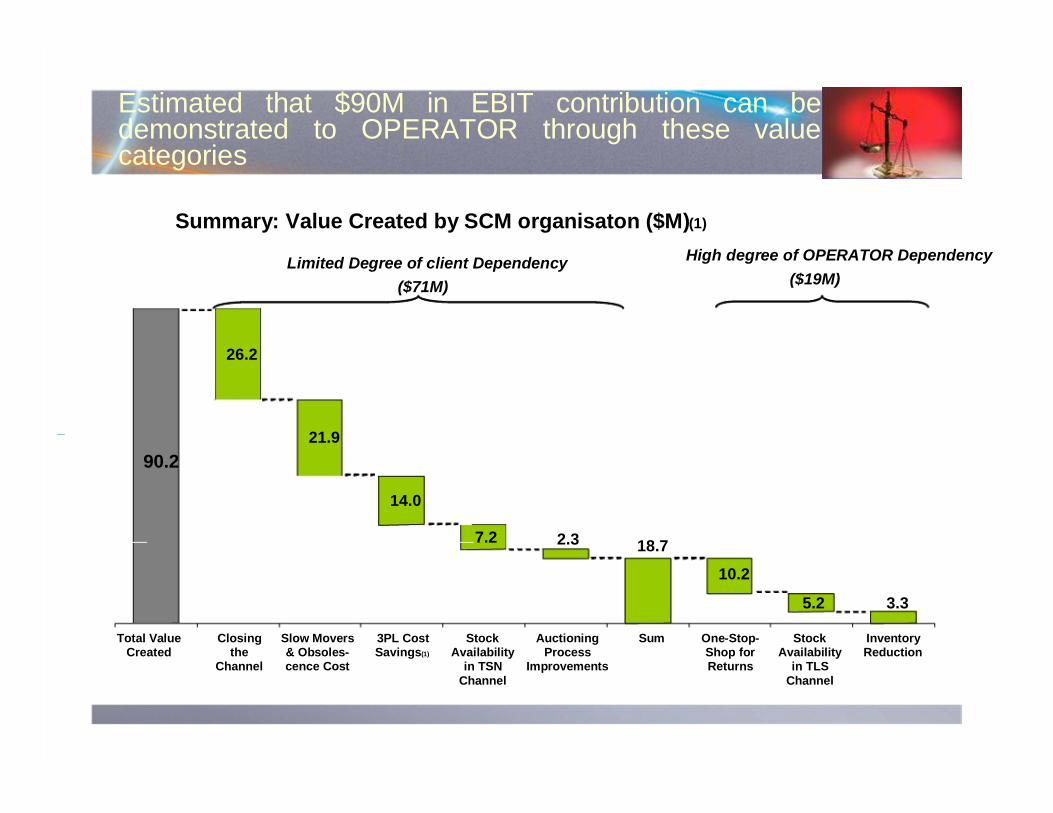
Estimated that $90M in EBIT contribution can be demonstrated to OPERATOR through these value categories
Summary: Value Created by SCM organisaton ($M)(1)
Limited Degree of client Dependency High degree of OPERATOR Dependency
($71M) ($19M)
26.2
21.9 90.2
14.0
7.2 2.3 18.7
10.2
5.2 3.3
Total Value Closing Slow Movers 3PL Cost Stock Auctioning Sum One-Stop- Stock Inventory Created the & Obsoles- Savings(1) Availability Process Shop for Availability Reduction
Channel cence Cost in TSN Improvements Returns in TLS Channel Channel

Value Creation Initiatives mapped to the OPERATOR Budget
OPERATOR BUDGETS
Dist Ctr Service Subsidy Revenue Marketing Inventory Write off Revenue OpsBudget Budget Budget Holding Budget Budget Budget SERVICE MODULES & VALUE
CATEGORIES Channel Optimisation -Reduction of Fraud Closing the channel Vendor Product Allocation Dist Center Stock Reduction Owned Stores Stock Reduction Owned Stores Stock Availability Indirect Channel Stock Availability Off-shoring process improvements-write down reduction PLM-Reduction in Slow Movers losses & Obsolescence PLM-Subscriber Acquisition Costs Reductions-SARC PLM-ARPU increase PLM-Market Share Increase & Customer Retention Imp. PLM connection increase
Service Savings - Project Phoenix
TOTAL ESTIMATED VALUE ACROSS CLIENTS BUDGETS 51M 22M 13M 2M 4M 2M 7M

SCM Value Capture for Returns Assessment Returns Assessment will deliver a positive Net Operating position for client of $1.249m. Additionally it will deliver estimated value creation of $10.85m SCO Services
Value Creation - $12.5m SCO Value Creation 9Reduced stock write down - $10.3m* 3PL+ svc Incremental svc Optional svc 9Eliminate ATB $550k
9Client charge OEM $18 fee for assessment -Revenue of $1.65m SCO Value-based fee (uncharged credit) Other Benefits: 9Better Channel & OEM reporting & visibility 3PL Svc
Order Capture Warehousing/CLOC Inventory Mgt Pick, Pack, Ship Cost Savings: Call Centre FOH enquiries Returns Processing Integrated IT 9FY08 - Reduction in 4.2 staff (+$239k)
9Reduction in Freight OEMs (+$269k) Cost plus 10% fee (for term of contract) 9Summary Cost Saving (+$508k) 950% gain share to SCM org (-$254k) New Costs: Implementation Costs 9New Costs for Assessments (-$655k)
Project Mgt Change Mgt Quality Assurance New resources
Systems changes Analysis Commercials New equipment IT & Implementation costs:
Implementation fee (One-off) 9 Implementation Costs of $245k
SCO Diagnostic Review Data Gathering Process Mapping Solution Definition Benefits/value 9 Returns Diagnostic - Cost $175k
Uncharged Credit - Third Party Consultants
*Based on 91,872 assessments, Rejection rate of 39% and loss of $360 per handset -80% claimed
Many thanks,
Best in class ‘Value Analysis’in Logistics
Howard James-Scott0091 9666692918
Gati Limited – Supply Chain Solutions
Recommended