Developing Logistics Strategy using
Optimization with Uncertain Data: The Marine Corps Assault Amphibious
Vehicle Return to Condition Code Alpha
(RCCA)
Authors: Dr. Edward DeVilliers, DeVilliers Technology Solutions LLC
Mr. Douglas Smith, Naval Surface Warfare Center,
Dahlgren
NDIA 19th Annual Systems Engineering Conference
27 October 2016
Purpose
Review the methodology and results from
applying Multi-Criteria Decision Making
(MCDM) and Optimization to the Marine
Corps logistics strategy for the Assault
Amphibious Vehicle (AAV) called RCCA –
Return to Condition Code Alpha.
Outline
Background of AAV and RCCA
Initial RCCA Activities
Multi-Criteria Decision Making
Approach for RCCA – Physical Programming
Process
Metrics
LPP Calculation Examples
Results
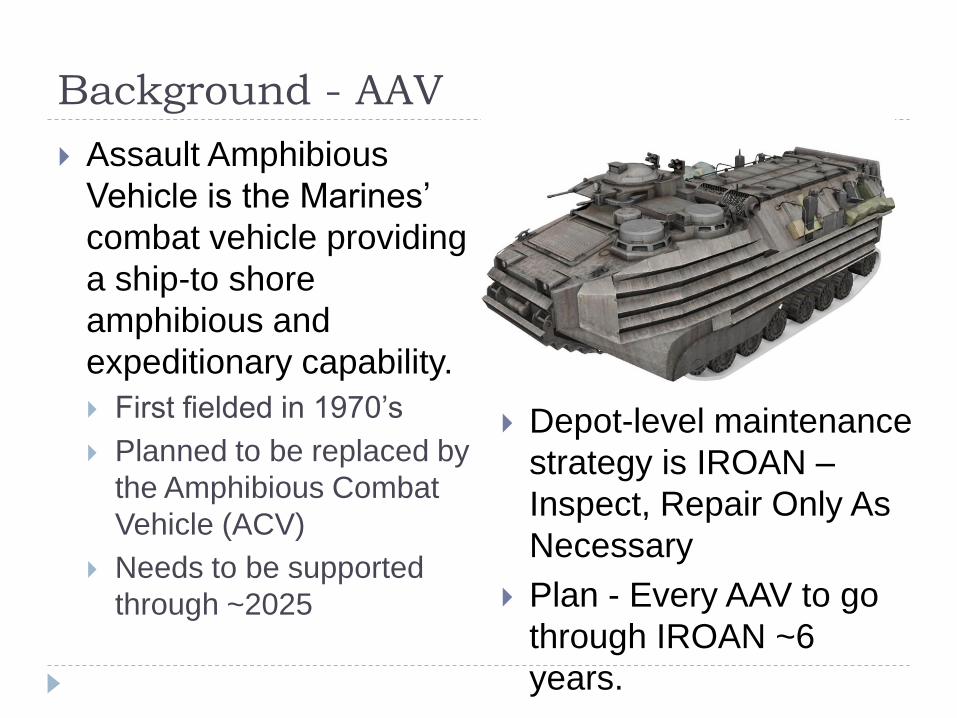
Background - AAV
Assault Amphibious
Vehicle is the Marines’
combat vehicle providing
a ship-to shore
amphibious and
expeditionary capability.
First fielded in 1970’s
Planned to be replaced by
the Amphibious Combat
Vehicle (ACV)
Needs to be supported
through ~2025
Depot-level maintenance
strategy is IROAN –
Inspect, Repair Only As
Necessary
Plan - Every AAV to go
through IROAN ~6
years.
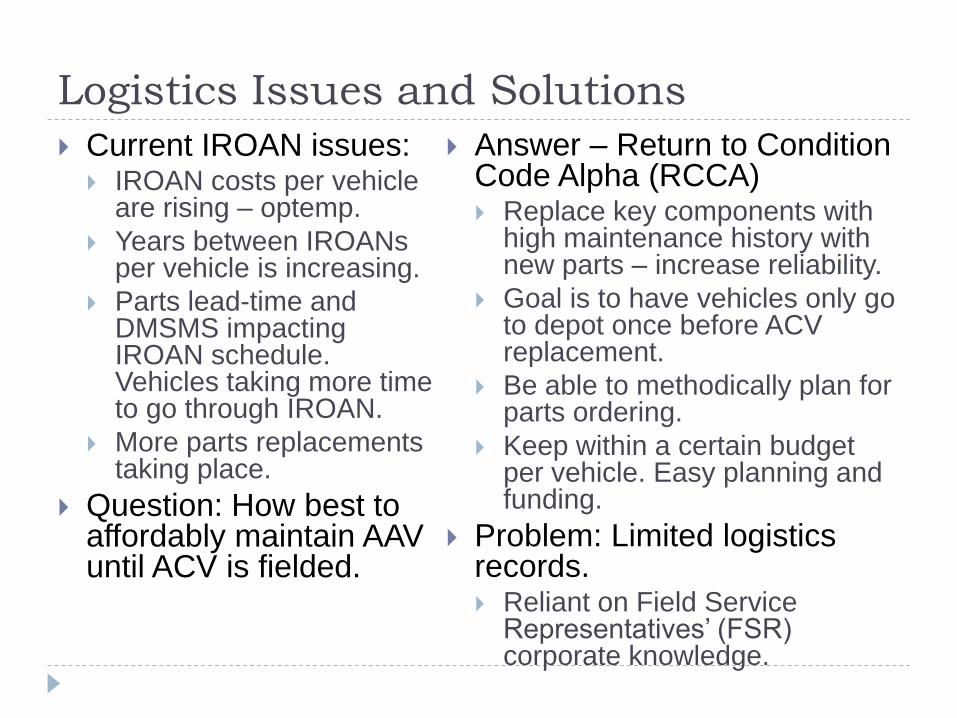
Logistics Issues and Solutions
Current IROAN issues: IROAN costs per vehicle
are rising – optemp.
Years between IROANs per vehicle is increasing.
Parts lead-time and DMSMS impacting IROAN schedule. Vehicles taking more time to go through IROAN.
More parts replacements taking place.
Question: How best to affordably maintain AAV until ACV is fielded.
Answer – Return to Condition Code Alpha (RCCA) Replace key components with
high maintenance history with new parts – increase reliability.
Goal is to have vehicles only go to depot once before ACV replacement.
Be able to methodically plan for parts ordering.
Keep within a certain budget per vehicle. Easy planning and funding.
Problem: Limited logistics records. Reliant on Field Service
Representatives’ (FSR) corporate knowledge.
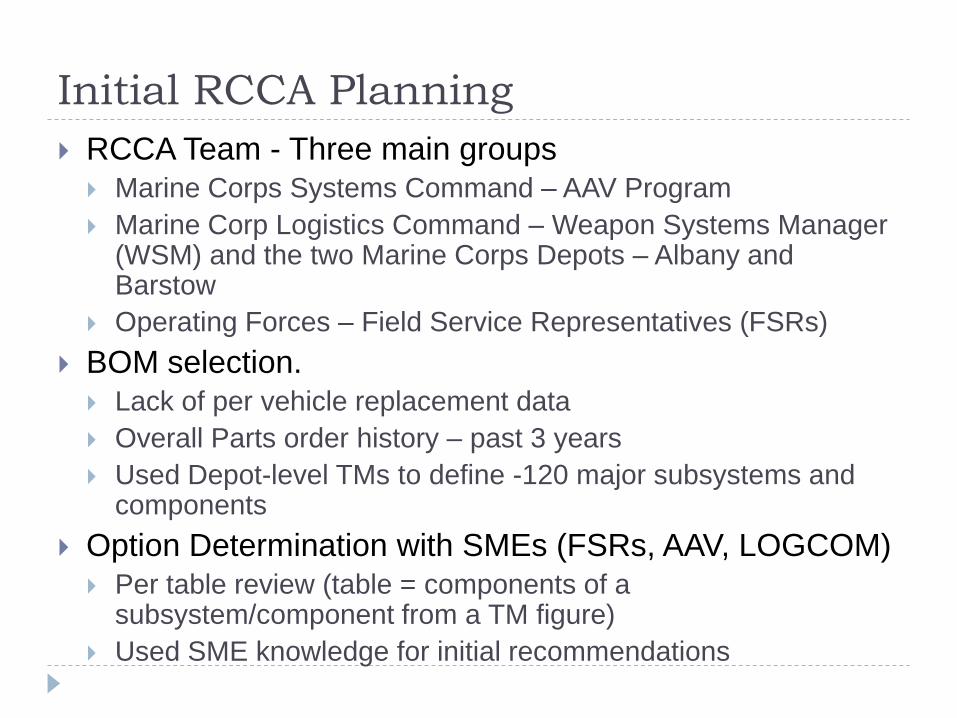
Initial RCCA Planning
RCCA Team - Three main groups
Marine Corps Systems Command – AAV Program
Marine Corp Logistics Command – Weapon Systems Manager (WSM) and the two Marine Corps Depots – Albany and Barstow
Operating Forces – Field Service Representatives (FSRs)
BOM selection.
Lack of per vehicle replacement data
Overall Parts order history – past 3 years
Used Depot-level TMs to define -120 major subsystems and components
Option Determination with SMEs (FSRs, AAV, LOGCOM)
Per table review (table = components of a subsystem/component from a TM figure)
Used SME knowledge for initial recommendations
Issues with Initial RCCA Determination
Cost - May need to scale back the list of components
to be replaced, due to cost.
Need to decide on other options (e.g. remanufacture,
repair, inspection) for some components, and
prioritize the options selected for decision makers.
Issue – How do we assess objectively on what
options to modify what RCCA does, as currently
defined, within an uncertain data environment?
Answer – Multi-criteria Decision Making (MCDM)
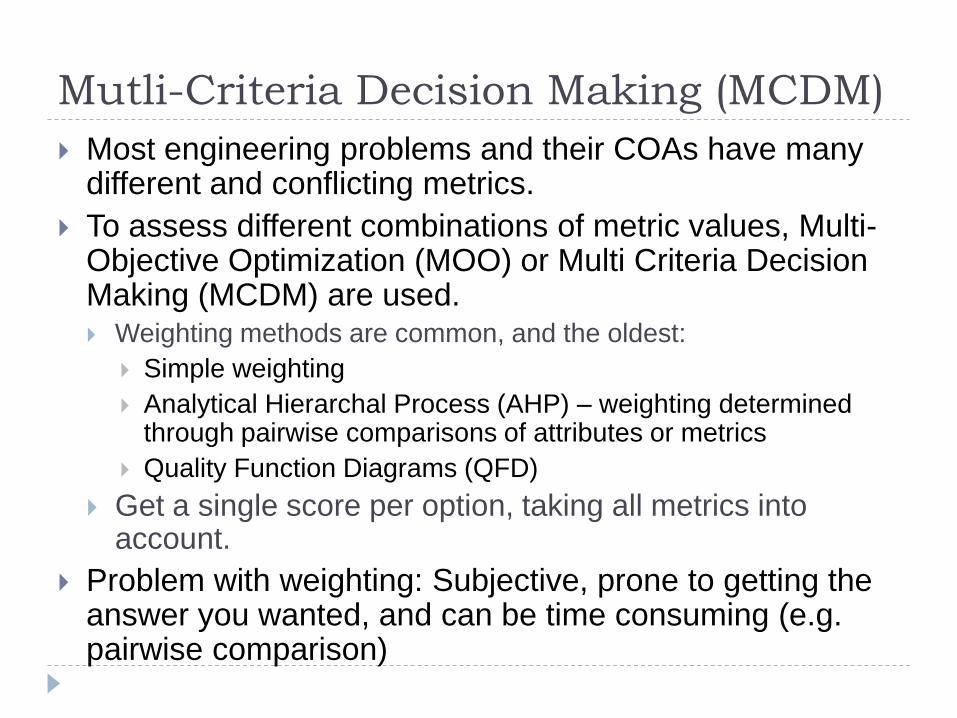
Mutli-Criteria Decision Making (MCDM)
Most engineering problems and their COAs have many different and conflicting metrics.
To assess different combinations of metric values, Multi-Objective Optimization (MOO) or Multi Criteria Decision Making (MCDM) are used. Weighting methods are common, and the oldest:
Simple weighting
Analytical Hierarchal Process (AHP) – weighting determined through pairwise comparisons of attributes or metrics
Quality Function Diagrams (QFD)
Get a single score per option, taking all metrics into account.
Problem with weighting: Subjective, prone to getting the answer you wanted, and can be time consuming (e.g. pairwise comparison)
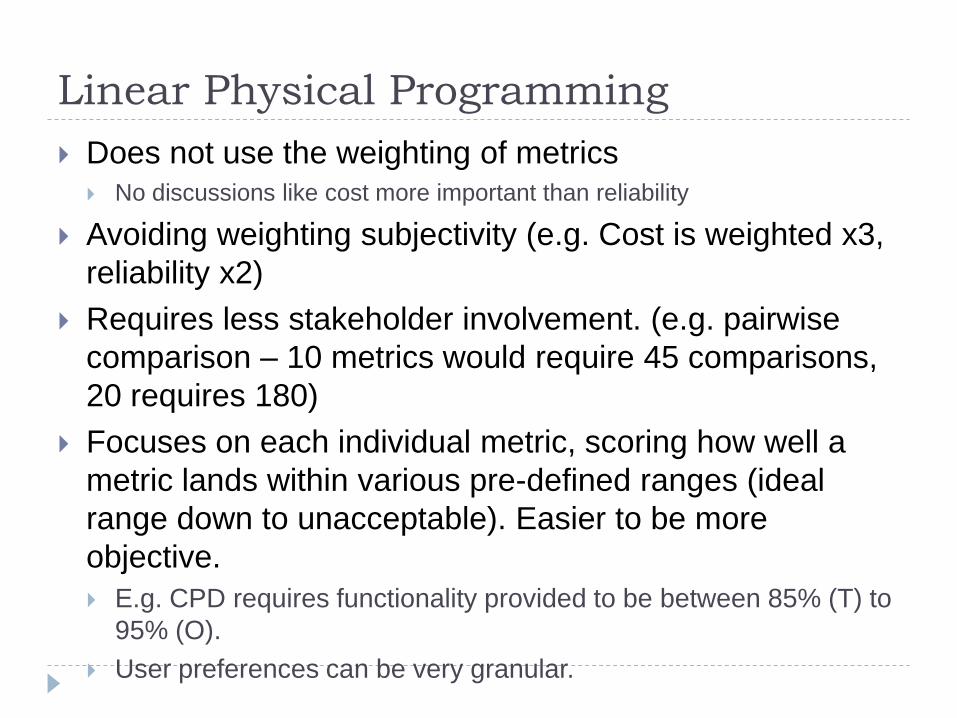
Linear Physical Programming
Does not use the weighting of metrics No discussions like cost more important than reliability
Avoiding weighting subjectivity (e.g. Cost is weighted x3,
reliability x2)
Requires less stakeholder involvement. (e.g. pairwise
comparison – 10 metrics would require 45 comparisons,
20 requires 180)
Focuses on each individual metric, scoring how well a
metric lands within various pre-defined ranges (ideal
range down to unacceptable). Easier to be more
objective.
E.g. CPD requires functionality provided to be between 85% (T) to
95% (O).
User preferences can be very granular.
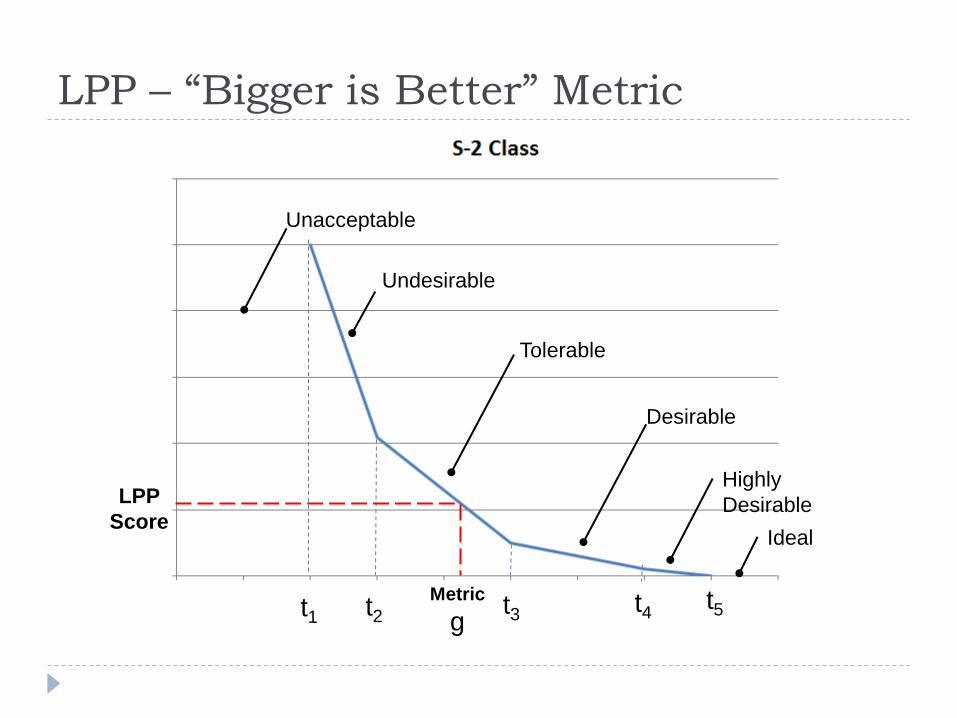
LPP – “Bigger is Better” Metric
t1 t2 t3
t4 t5
Metric
g
LPP
Score
Unacceptable
Undesirable
Desirable
Highly
Desirable
Ideal
Tolerable
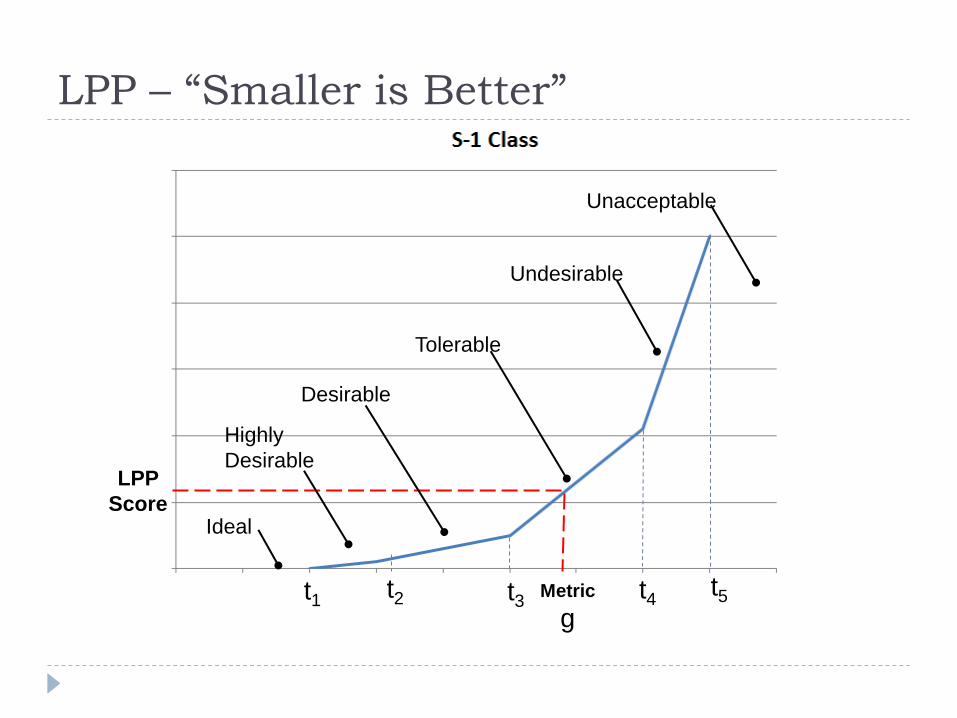
LPP – “Smaller is Better”
t1 t2 t3
t4 t5 Metric
g
LPP
Score
Unacceptable
Undesirable
Desirable
Highly
Desirable
Ideal
Tolerable
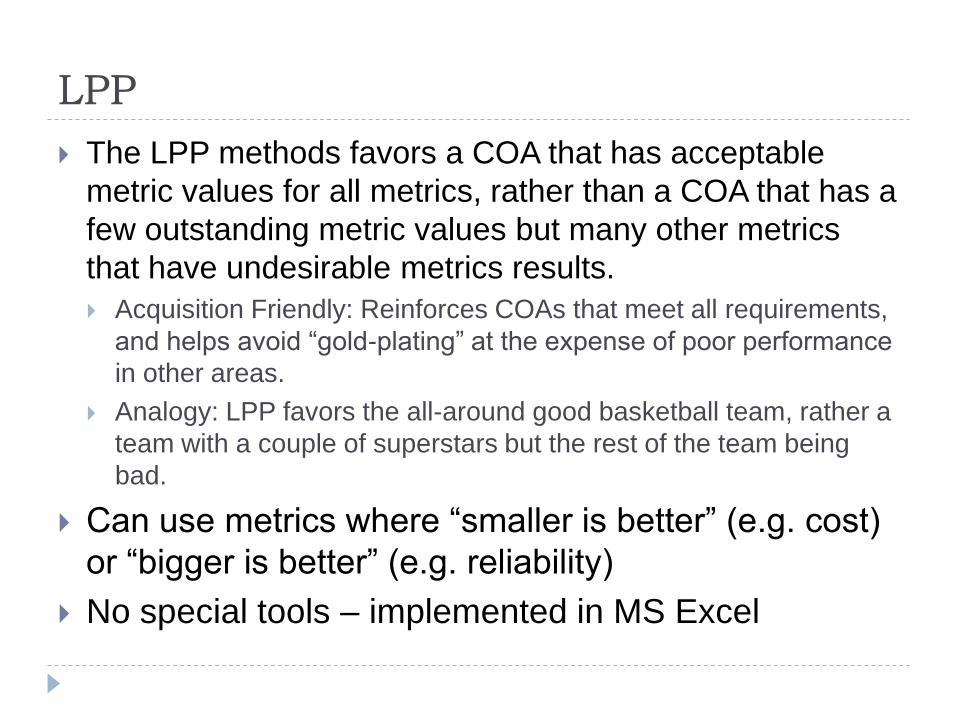
LPP
The LPP methods favors a COA that has acceptable
metric values for all metrics, rather than a COA that has a
few outstanding metric values but many other metrics
that have undesirable metrics results.
Acquisition Friendly: Reinforces COAs that meet all requirements,
and helps avoid “gold-plating” at the expense of poor performance
in other areas.
Analogy: LPP favors the all-around good basketball team, rather a
team with a couple of superstars but the rest of the team being
bad.
Can use metrics where “smaller is better” (e.g. cost)
or “bigger is better” (e.g. reliability)
No special tools – implemented in MS Excel
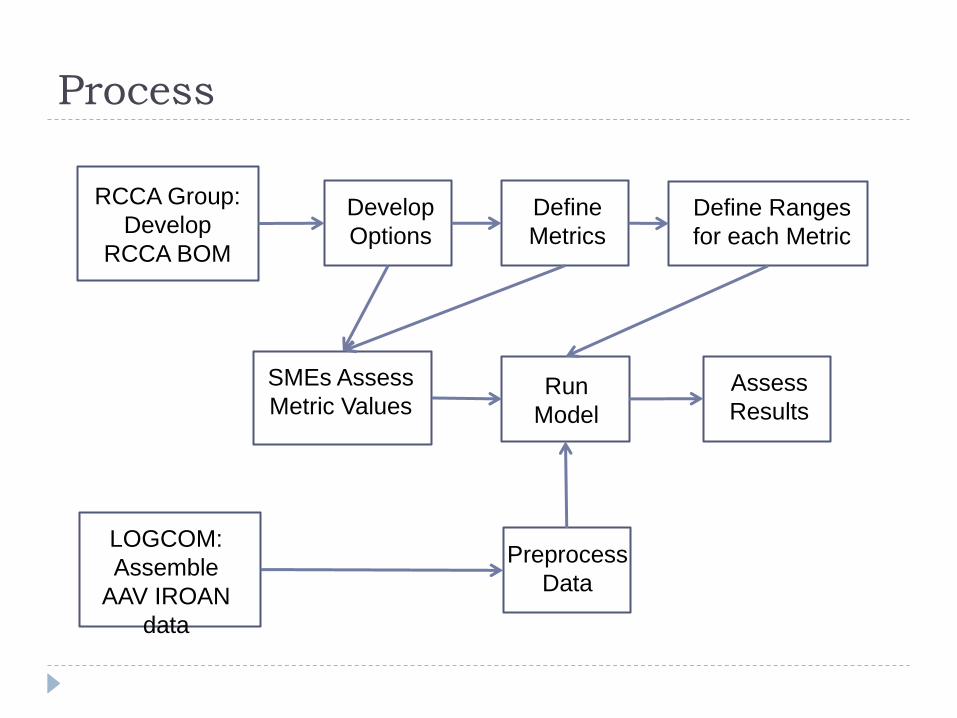
Process
SMEs Assess
Metric Values
Develop
Options
Define
Metrics
Assess
Results Run
Model
Define Ranges
for each Metric
RCCA Group:
Develop
RCCA BOM
LOGCOM:
Assemble
AAV IROAN
data
Preprocess
Data
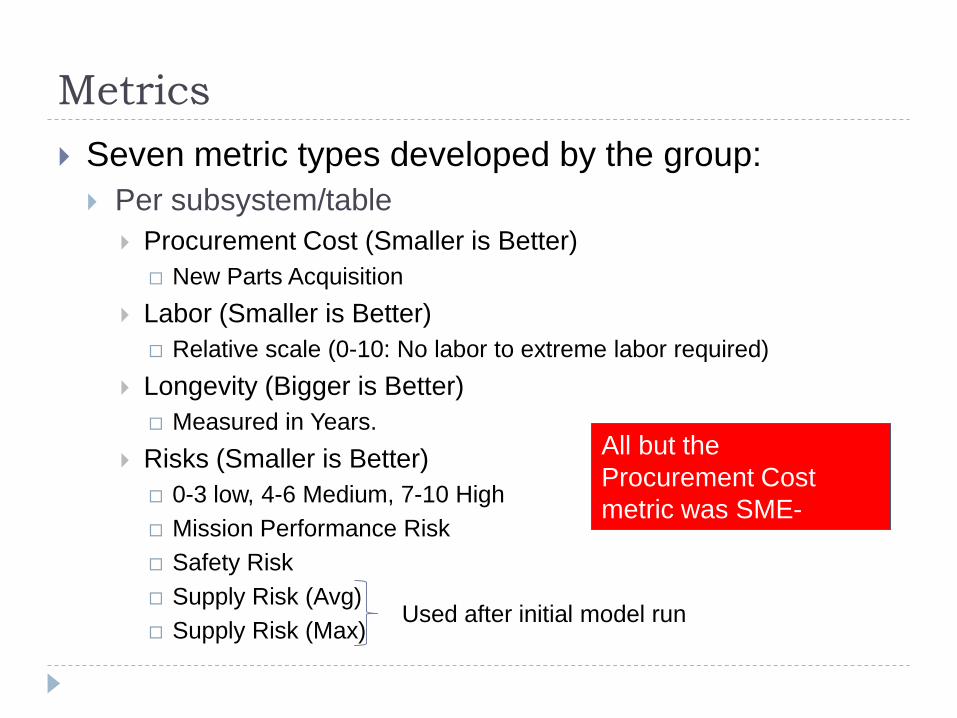
Metrics
Seven metric types developed by the group:
Per subsystem/table
Procurement Cost (Smaller is Better)
New Parts Acquisition
Labor (Smaller is Better)
Relative scale (0-10: No labor to extreme labor required)
Longevity (Bigger is Better)
Measured in Years.
Risks (Smaller is Better)
0-3 low, 4-6 Medium, 7-10 High
Mission Performance Risk
Safety Risk
Supply Risk (Avg)
Supply Risk (Max)
Used after initial model run
All but the
Procurement Cost
metric was SME-
derived.
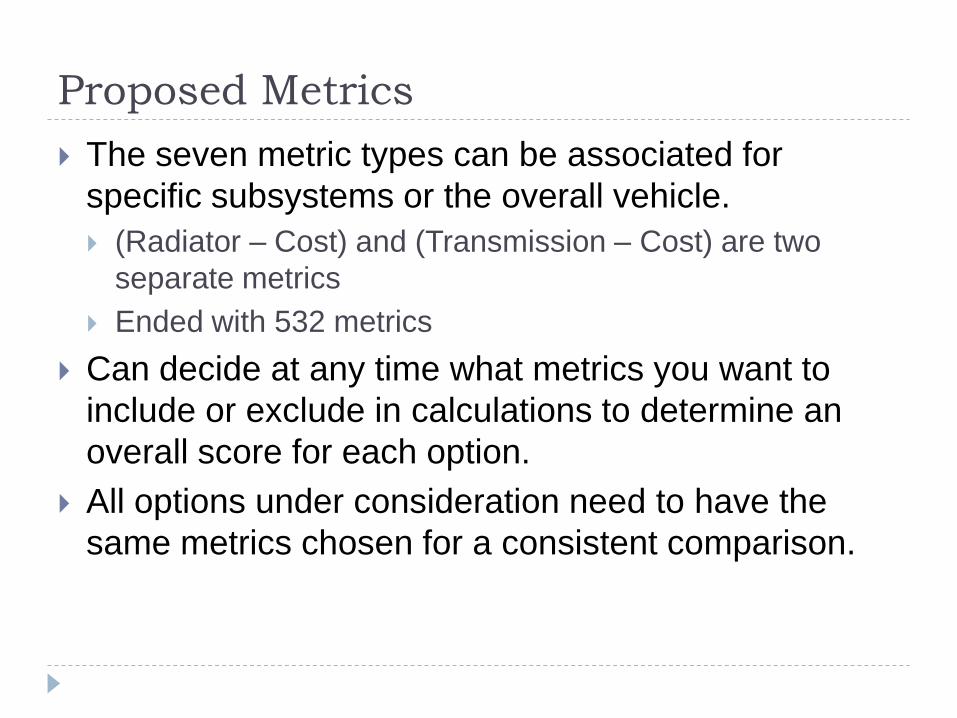
Proposed Metrics
The seven metric types can be associated for
specific subsystems or the overall vehicle.
(Radiator – Cost) and (Transmission – Cost) are two
separate metrics
Ended with 532 metrics
Can decide at any time what metrics you want to
include or exclude in calculations to determine an
overall score for each option.
All options under consideration need to have the
same metrics chosen for a consistent comparison.
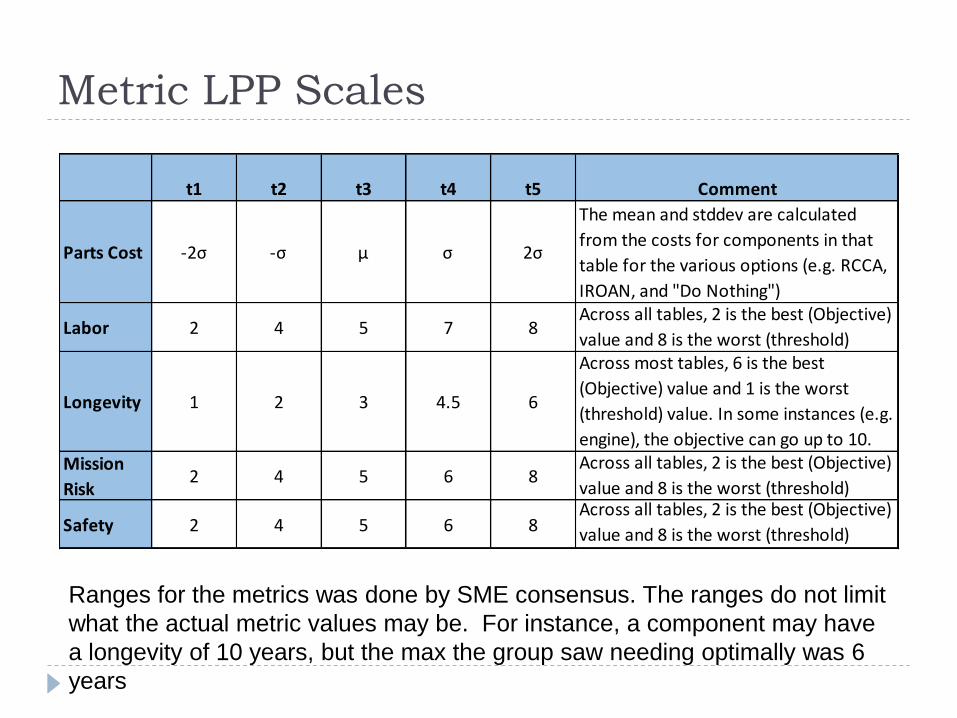
Metric LPP Scales
t1 t2 t3 t4 t5 Comment
Parts Cost -2σ -σ µ σ 2σ
The mean and stddev are calculated
from the costs for components in that
table for the various options (e.g. RCCA,
IROAN, and "Do Nothing")
Labor 2 4 5 7 8Across all tables, 2 is the best (Objective)
value and 8 is the worst (threshold)
Longevity 1 2 3 4.5 6
Across most tables, 6 is the best
(Objective) value and 1 is the worst
(threshold) value. In some instances (e.g.
engine), the objective can go up to 10.
Mission
Risk2 4 5 6 8
Across all tables, 2 is the best (Objective)
value and 8 is the worst (threshold)
Safety 2 4 5 6 8Across all tables, 2 is the best (Objective)
value and 8 is the worst (threshold)
Ranges for the metrics was done by SME consensus. The ranges do not limit
what the actual metric values may be. For instance, a component may have
a longevity of 10 years, but the max the group saw needing optimally was 6
years
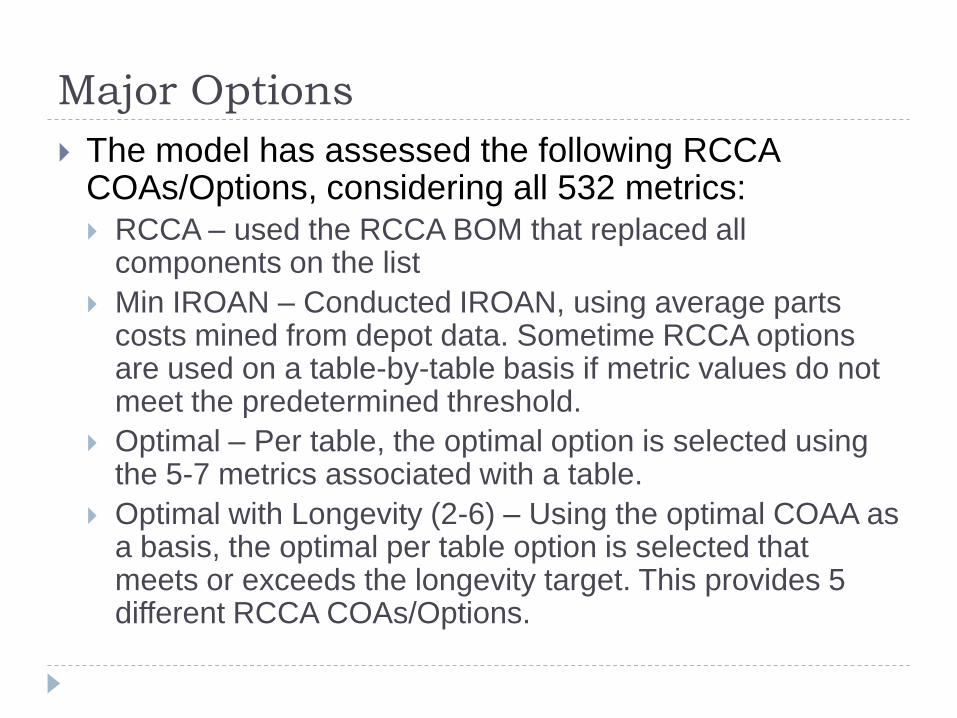
Major Options
The model has assessed the following RCCA COAs/Options, considering all 532 metrics: RCCA – used the RCCA BOM that replaced all
components on the list
Min IROAN – Conducted IROAN, using average parts costs mined from depot data. Sometime RCCA options are used on a table-by-table basis if metric values do not meet the predetermined threshold.
Optimal – Per table, the optimal option is selected using the 5-7 metrics associated with a table.
Optimal with Longevity (2-6) – Using the optimal COAA as a basis, the optimal per table option is selected that meets or exceeds the longevity target. This provides 5 different RCCA COAs/Options.
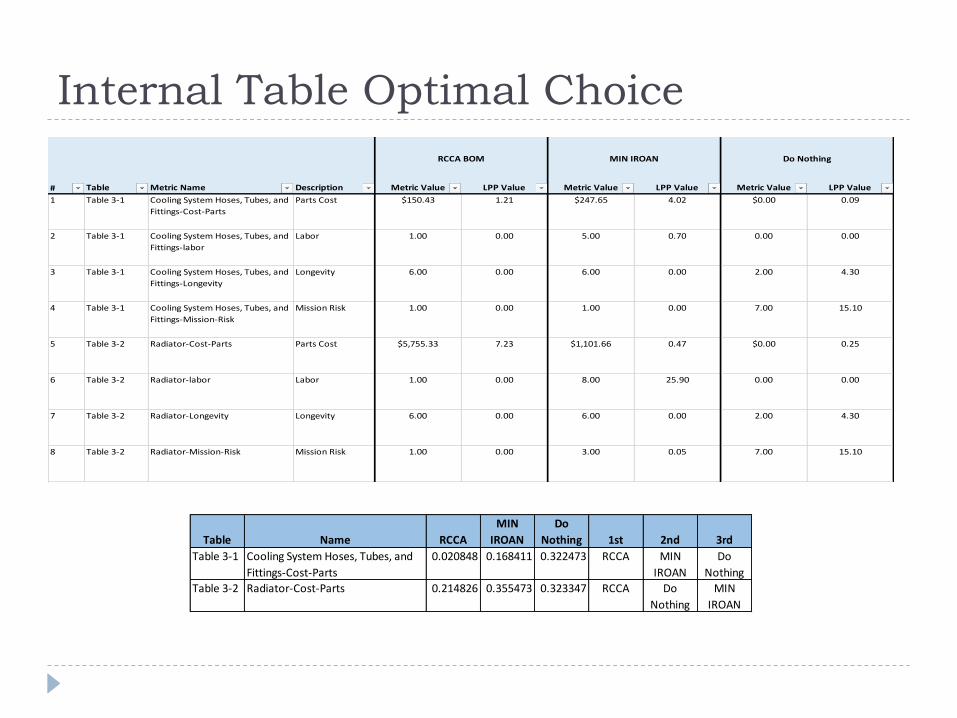
Internal Table Optimal Choice
# Table Metric Name Description Metric Value LPP Value Metric Value LPP Value Metric Value LPP Value
1 Table 3-1 Cooling System Hoses, Tubes, and
Fittings-Cost-Parts
Parts Cost $150.43 1.21 $247.65 4.02 $0.00 0.09
2 Table 3-1 Cooling System Hoses, Tubes, and
Fittings-labor
Labor 1.00 0.00 5.00 0.70 0.00 0.00
3 Table 3-1 Cooling System Hoses, Tubes, and
Fittings-Longevity
Longevity 6.00 0.00 6.00 0.00 2.00 4.30
4 Table 3-1 Cooling System Hoses, Tubes, and
Fittings-Mission-Risk
Mission Risk 1.00 0.00 1.00 0.00 7.00 15.10
5 Table 3-2 Radiator-Cost-Parts Parts Cost $5,755.33 7.23 $1,101.66 0.47 $0.00 0.25
6 Table 3-2 Radiator-labor Labor 1.00 0.00 8.00 25.90 0.00 0.00
7 Table 3-2 Radiator-Longevity Longevity 6.00 0.00 6.00 0.00 2.00 4.30
8 Table 3-2 Radiator-Mission-Risk Mission Risk 1.00 0.00 3.00 0.05 7.00 15.10
RCCA BOM MIN IROAN Do Nothing
Table Name RCCA
MIN
IROAN
Do
Nothing 1st 2nd 3rd
Table 3-1 Cooling System Hoses, Tubes, and
Fittings-Cost-Parts
0.020848 0.168411 0.322473 RCCA MIN
IROAN
Do
Nothing
Table 3-2 Radiator-Cost-Parts 0.214826 0.355473 0.323347 RCCA Do
Nothing
MIN
IROAN
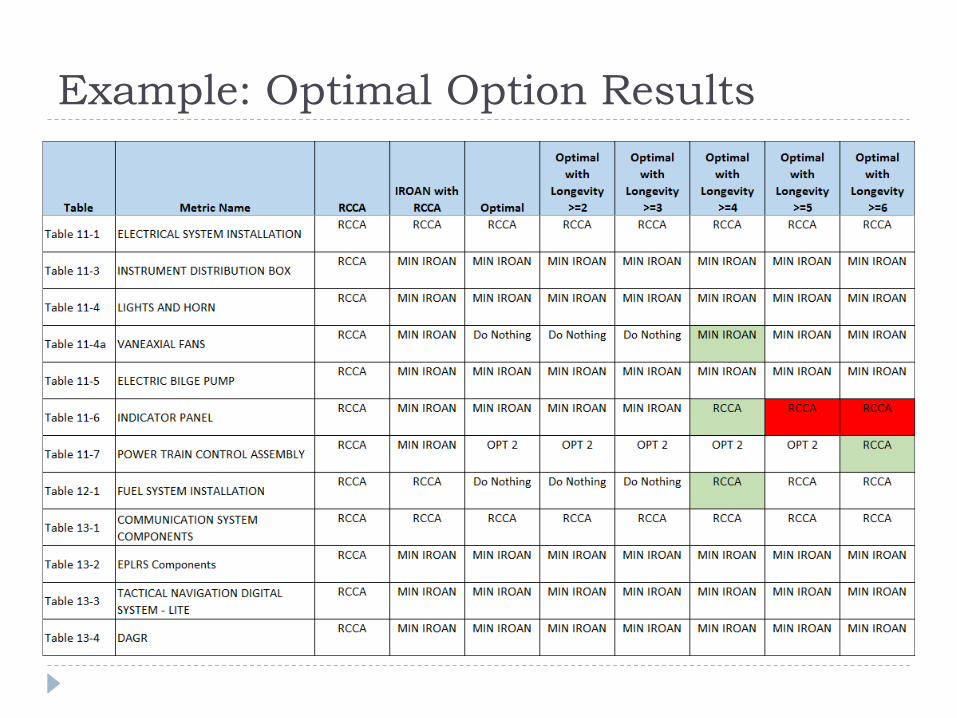
Example: Optimal Option Results
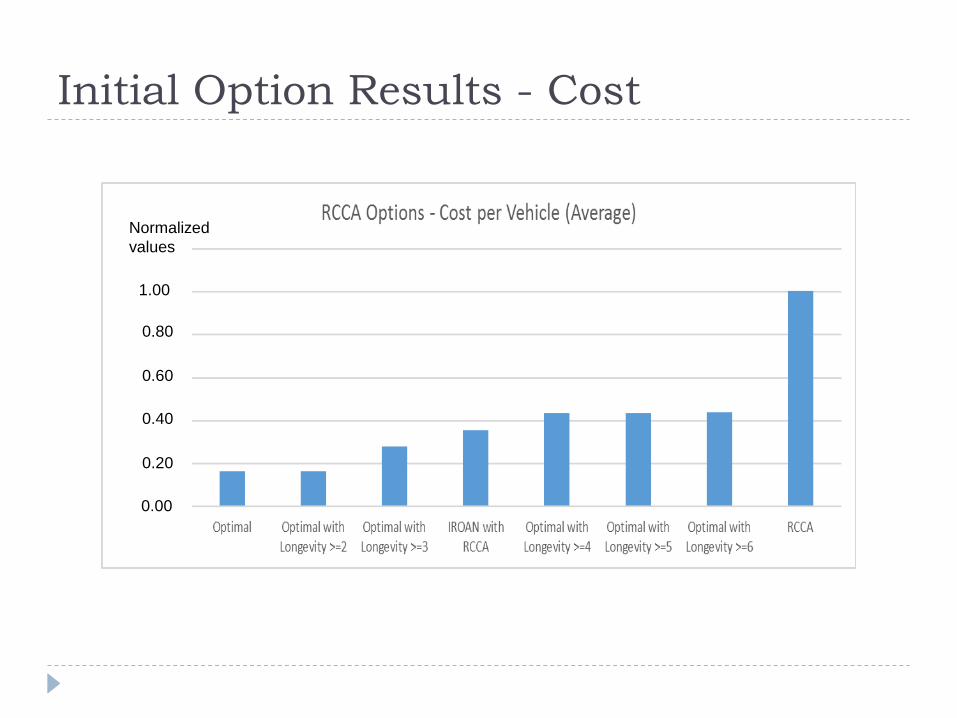
Initial Option Results - Cost
Normalized
values
1.00
0.80
0.60
0.40
0.20
0.00
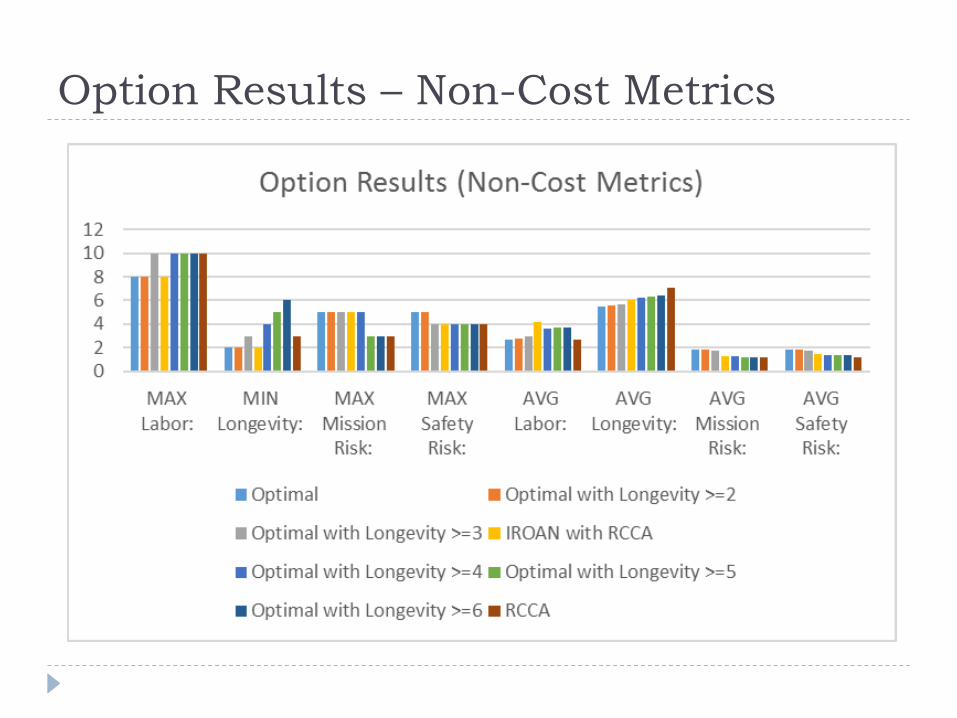
Option Results – Non-Cost Metrics
Observations
The key metric types that show the most variation in
the results are cost and minimum longevity.
Average IROAN costs, per NSN, are usually much
lower than RCCA replacement costs.
The group was able to provide metric values for items,
like labor, for which current hard data has not been
processed to use in a model that uses individual
NSNs.
There is a large mix of replacement, IROAN, and “Do
nothing” selections when assessing actions at the
table level.
There is not much cost difference between COAs with
a minimum longevity from 4-6 years.
Recommended