DEVELOPMENT AND EVALUATION OF FUNCTIONAL DRUG
DELIVERY SYSTEM FOR THE TREATMENT OF ALZHEIMER
DISEASE
A Synopsis submitted to Gujarat Technological University
for the Award of
Doctor of Philosophy
in
PHARMACY
by
RANA HARDIKKUMAR BHUPENDRAKUMAR
[139997390008]
Supervisor
Dr. Mukesh Gohel
GUJARAT TECHNOLOGICAL UNIVERSITY AHMEDABAD
[March - 2019]

CERTIFICATE
I certify that the work incorporated in the synopsis “Development and Evaluation of
Functional Drug Delivery System for the Treatment of Alzheimer Disease” submitted by
Shri Rana Hardikkumar Bhupendrakumar was carried out by the candidate under my
supervision/guidance. To the best of my knowledge: (i) the candidate has not submitted the same
research work to any other institution for any degree/diploma, Associateship, Fellowship or other
similar titles (ii) the synopsis submitted is a record of original research work done by the
Research Scholar during the period of study under my supervision, and (iii) the synopsis
represents independent research work on the part of the Research Scholar.
Signature of Co-Supervisor: ………………………………………………Date: 05/03/2019
Name of Co-Supervisor: Dr. Tejal R. Gandhi
Place: Anand
Signature of Supervisor: ………………………………………………Date: 05/03/2019
Name of Supervisor: Dr. Mukesh C. Gohel
Place: Anand
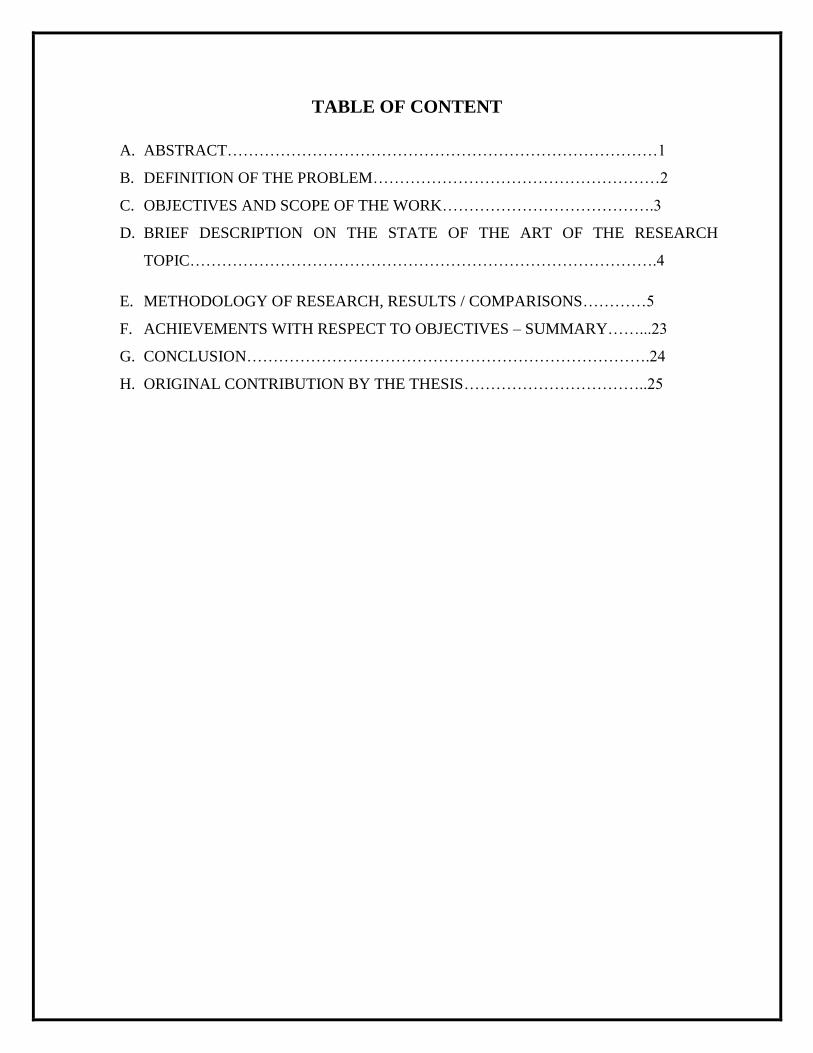
TABLE OF CONTENT
A. ABSTRACT………………………………………………………………………1
B. DEFINITION OF THE PROBLEM………………………………………………2
C. OBJECTIVES AND SCOPE OF THE WORK………………………………….3
D. BRIEF DESCRIPTION ON THE STATE OF THE ART OF THE RESEARCH
TOPIC…………………………………………………………………………….4
E. METHODOLOGY OF RESEARCH, RESULTS / COMPARISONS…………5
F. ACHIEVEMENTS WITH RESPECT TO OBJECTIVES – SUMMARY……...23
G. CONCLUSION………………………………………………………………….24
H. ORIGINAL CONTRIBUTION BY THE THESIS……………………………..25

Synopsis
Rana Hardikkumar B. 139997390008 1
DEVELOPMENT AND EVALUATION OF FUNCTIONAL DRUG DELIVERY SYSTEM
FOR THE TREATMENT OF ALZHEIMER DISEASE
A. ABSTRACT:
Objective: The present research was undertaken for the development of galantamine HBr
modified release pellets and to scrutinize the critical factors that can affect the quality and
performance of the pellets prepared by the modified extrusion-pelletization technique.
Materials and Methods: Modified release pellets of galantamine HBr (GH) were prepared using
Compritol 888 ATO (COM) and ethyl cellulose (EC) as release retardants. Avicel pH 101 was
selected as an extruder aid. Before converting the wet extrudates in pellets, pregelatinized starch
was sprinkled on the wet strands to improve the physical properties of the pellets and yield.
Subsequently, spheronization and drying was done. Compatibility study was conducted between
the drug and the excipients. Qualitative risk analysis was performed to identify the prospectively
significant factors using failure mode effect analysis (FMEA). Central composite design (CCD)
was adopted to locate the composition of formulation. The amounts of COM and EC were
selected as independent variables. Cumulative % drug release at 2, 6, and 10 h were selected as
dependent variables. The pellets were evaluated for size, shape, flow, % yield, % friability, drug
content, in vitro drug release and drug release kinetic. The Influence of hydroalcoholic media on
the drug dissolution was assessed employing the optimized formulation.
Results and Discussion: FMEA revealed that the amount of COM and EC were the most critical
formulation parameters. The results of FTIR and DSC revealed compatibility between the drug
and the excipients. The spherical pellets exhibited good flow. The drug dissolution study of the
batches, prepared according to the CCD, revealed modified drug release up to 12 h. Multiple
regression analysis and analysis of variance were performed to identify statistically significant
factors. Contour plots demonstrate the impact of the amount of Compritol and EC. Design Expert
software was used to identify the optimized formulation. The dissolution data of the optimized
batch were converted in predicted in-vivo profile, which showed modified release up to 12 h.
Conclusion: The amount of Compritol and EC were found to be statistically significant for the
development of modified release pellets of galantamine HBr. Innovative finding of the present
research is to explore the potential use of pregelatinized starch as a dry binder in the post

Synopsis
Rana Hardikkumar B. 139997390008 2
extrusion step. Pellets with good quality and increased yield were obtained. Other dry binders
such as PVP K 30 and L – HPC are also expected to work.
KEYWORDS: Galantamine HBr, Compritol, ethyl cellulose, pregelatinized starch, modified
extrusion spheronization method
Graphical summary of the research work:
B. DEFINITION OF THE PROBLEM
Pelletization is an agglomeration process that converts fine powders of bulk drug and the
excipients into small, free-flowing, spherical units, referred to as pellets (1). Various methods
can be utilized to prepare pellets (2). Among the various methods, extrusion–spheronization is
the most commonly and effectively used method (3). Extrusion-spheronization has been highly
explored but not much commercialized owing to processing difficulties and low yield (4). The
major concern with pellet is its uniform size, shape, low friability and % yield. Due to these
problems, an alternate or modified pelletization method is required.
Alzheimer‟s disease (AD) is a common form of neurodegenerative disease and the sixth leading
cause of death in the elderly(5). Alzheimer‟s disease is the main cause of dementia and one of
the great health-care challenges of the 21st century.(6, 7) Globally, India houses the second most

Synopsis
Rana Hardikkumar B. 139997390008 3
number of individuals suffering from dementia with an estimated 4.1 million people suffering
from it as per the „Dementia India‟ report published by the Alzheimer‟s and Related Disorders
Society of India. This is expected to double by 2035.(8)
Acetylcholinesterase inhibitors, Gingko biloba, methylphenidate and a variety of non-
pharmacological interventions were found to be successful in reducing apathy in patients with
AD. Currently, galantamine hydrobromide is the latest one recommended and approved by FDA
to improve the cognitive functions, and subsequently to treat the Alzheimer‟s patients(9). So,
modified release pharmaceutical formulations of galantamine are urgently needed to improve its
efficacy. (10, 11)
FDA issued an alert on “risks of ethanol induced dose dumping from oral sustained/controlled
release dosage forms”. The vulnerability of controlled release formulations, when co-ingested
with alcohol, represents a current major concern of regulatory agencies (12–14). Burst drug
release may be due to the sensitivity of some excipients with alcohol (15). As per the report of
World Health Organization (WHO), more than 3 million people died due to the harmful effect of
alcohol (16).
C. OBJECTIVES AND SCOPE OF THE WORK
The primary objective of the present work was to formulate the good quality of pellets with
better morphology and high yield employing the modified processing step.
The secondary objective was to modulate the drug release incorporating hydrophobic release
retardants such as Compritol 888 ATO and EC.
Identification of critical parameters from the risk analysis approach. Failure mode effect
analysis (FMEA) was used for the identification of significant parameters which will affect
the final quality of pellets.
To evolve mathematical model to establish the correlation of the independent variables with
dependent variables.
To find out the optimum conditions of critical variables for the formulation of good quality
pellets.
Development and characterization of functional drug delivery system of Antialzheimer Drug
considering the concepts DoE and QbD.

Synopsis
Rana Hardikkumar B. 139997390008 4
Development of modified extrusion spheronization method for the formulation of modified
release pellets to improve the flow, yield and other physical parameters as well as to control
the drug release up to 12h.
The size of the pellets should be close to the 1 mm. The % friability should be less than 1%.
The critical quality attribute was drug release at different time interval which should be
compared with drug release profile of the marketed formulation.
Exploration the novel step i.e. use of pregelatinized starch as a binder cum lubricant
extragranulary after the extrusion step, to improvise physical properties of pellets as well as
modulate the drug release.
Prediction of in vivo plasma concentration-time profile using in vitro drug release data by
employing back calculation of Wagner – Nelson approach.
Another objective of the present work was to formulate robust formulation in presence of
alcohol which should be safe and devoid of any side effects or toxic effects.
Assessment of stability of the optimized galantamine HBr modified release pellets by
accelerated stability study at 40 ± 2 ˚C and 75 ± 5% RH for a period of 6 months in a
stability chamber.
Development of non-infringing formulation or process for the formulation of pellets.
D. BRIEF DESCRIPTION ON THE STATE OF THE ART OF THE RESEARCH TOPIC
The focus of the present research was to explore the concept of QbD for the development of
galantamine HBr modified release pellets by modified extrusion pelletization method.
Compatibility study was conducted between the drug and the excipients using FTIR and DSC,
which confirmed that there is no interaction between drug and the excipients. Critical evaluation
parameter was the rate and extent of drug dissolution in distilled water. Risk analysis was
performed by FMEA to identify the prospectively significant variables which will affect the drug
release and quality of pellets. Amount of Compritol and EC were found to be most critical
variables from FMEA. The CCD was used to identify the optimum batch that should have the
desired drug release using Design Expert software. The amount of Compritol and EC were
scrutinized as independent variables, varied at three different levels to formulate thirteen batches
while cumulative % drug release at 2 h, 6 h and 10 h were chosen as responses. Multiple linear
regression analysis (MLRA) and analysis of variance (ANOVA) were performed to identify

Synopsis
Rana Hardikkumar B. 139997390008 5
statistically significant factors. Contour plots demonstrate the impact of concentration of
Compritol and ethyl cellulose. The spherical pellets exhibited good flow with high yield due to
the incorporation of innovative step i.e. by formulating two additional batches (adding PGS in
the initial powder mix and omitting the innovative step). The drug dissolution data of the
optimized batch were converted in predicted in-vivo profile using back calculation method of
Wagner – Nelson. The predicted in vivo profile showed modified release up to twelve hours.
The pellets of optimized batch were found to be resistant enough against alcohol up to 40 %v/v
alcohol in water.
Compritol and EC were able to retard the drug release up to 12 h in distilled water. The
innovative finding of this study is the use of dry binder (pregelatinized starch) to improve
characteristics of pellets. Other dry binders are expected to show similar effect. Demonstration of
the modified processing technique for the formulation of pellets can be useful at industry.
E. METHODOLOGY OF RESEARCH, RESULTS / COMPARISONS
Compatibility study was conducted between the drug and excipients using differential scanning
calorimetry (DSC) and Fourier transform infra-red (FTIR) spectroscopy(17). The thermogram of
the DSC study and FTIR spectra are shown in figures 1 and 2 respectively. The figures indicate
compatibility between drug and the utilized excipients.
Figure 1: Overlay DSC spectra of pure drug, polymer and mixture

Synopsis
Rana Hardikkumar B. 139997390008 6
Figure 2: Overlay FTIR Spectra of drug, polymers and mixture of drug and polymers
METHOD – 1 FOR THE PREPARATION OF PELLETS
The drug and the excipients except pregelatinized starch were blended. A mixture of isopropyl
alcohol and dichloromethane containing Compritol and EC was used to prepare wet mass for
extrusion step. The mass was transferred to the sieve No. 16, and then passed through the sieve
by applying a little force. Pregelatinized starch was sprinkled on the wet extrudates to improve
the physical properties of the pellets and to increase the yield of the pellets. The extrudates were
then transferred to a mixer to reduce the length of cylindrical extrudes at low shear for 3 min.
Extrudates were then transferred to pan coater containing baffles for spheronization.
Spheronization was carried out at 30 rpm for 15 minutes at room temperatures. The wet pellets
were dried in a hot air oven at 40°C for 1 hour. Finally, the pellets were passed through a 16–20
mesh and then stored in sealed glass jars.
Figure 3: Modified extrusion pelletization technique using Method 1

Synopsis
Rana Hardikkumar B. 139997390008 7
Optimization using QbD approach
Quality by Design (QbD) approach was used to optimize the galantamine HBr modified release
pellets. QbD approach integrates the following sequential steps (Figure 4) to obtain the
optimized formulation with desired quality target product profile(18).
Figure 4: Different steps of Quality by Design approach
Failure mode effect analysis (FMEA)
Risk analysis was performed by FMEA to identify the prospectively significant variables which
will affect the drug release and quality of pellets. A fishbone diagram as shown in figure 5 was
constructed in accordance with ICH Q8 R2 guideline, to identify an initial list of potential high
risk factors that might influence the quality of the GH loaded pellets. Six main causes (material,
man, measurement, environment, machine and process factors) were identified. All the factors
except material and process had non-significant effect as all research work done under standard
conditions which were fixed by preliminary trials. Risk Priority Number (RPN) was calculated
based on occurrence, severity and detectability as shown in equation 1. The factors which has
high impact on in vivo performance, given high RPN score (>60) compared to others(19).
……………………..Equation 1
Where, O is the probability of occurrence
S, the severity, which is a measure of how severe of an effect a given failure mode would cause;
D is the detectability or the ease that a failure mode can be detected, FMEA summary is shown
in Table 1. The amount of Compritol and EC were identified as potentially important
formulation factors(20).
Central Composite Design (CCD)
Define QTPP Identify CQAs
Identify CMA and CPPs using
Ishikawa Diagram and
Risk Assessment
Formulation of Pellet using
DOE technique
Optimized Formulati
on

Synopsis
Rana Hardikkumar B. 139997390008 8
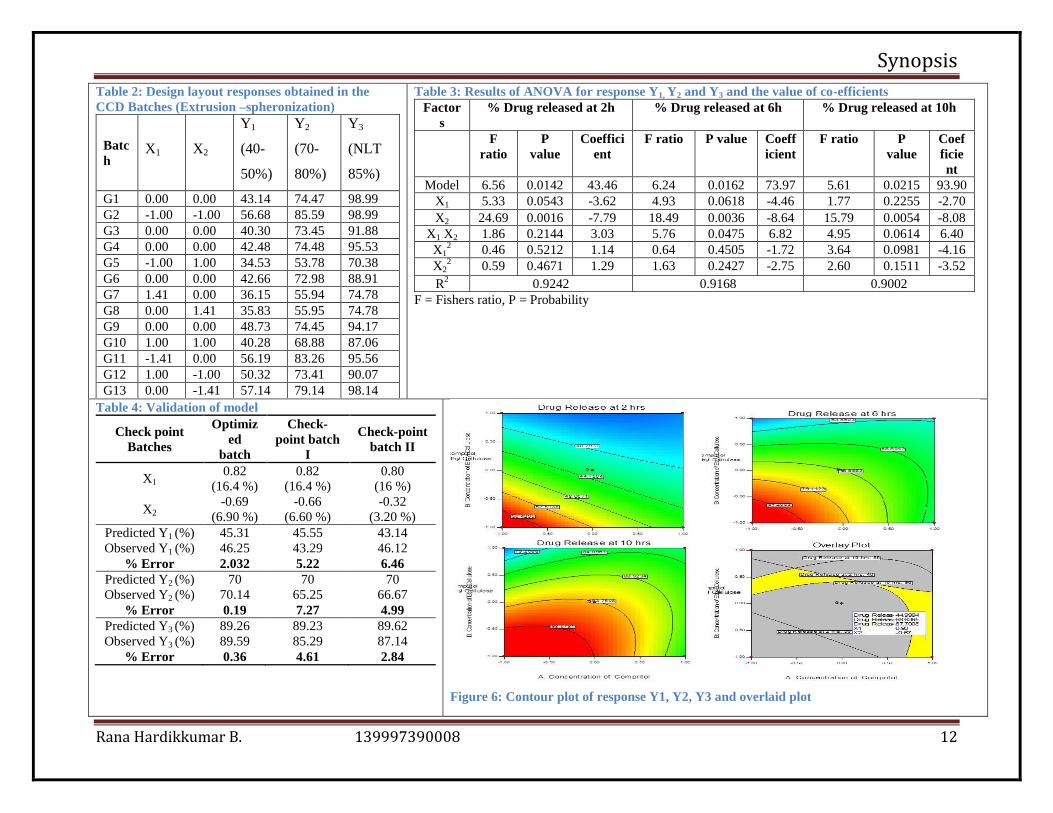
CCD was used to identify the optimum batch that should have desirable drug release(21). The
amount of Compritol and EC were scrutinized as independent variables, varied at three different
levels to formulate thirteen batches while cumulative % drug release at 2, 6 and 10 h were
chosen as responses. The experiment runs with independent variables and the observed responses
are shown in Table 2. Suitable polynomial equation involving the individual main effects and
interaction terms were selected based on the estimation of several statistical parameters, such as
the multiple correlation coefficients (R2), adjusted R
2 and the predicted residual sum of squares
(PRESS). The terms that showed less significant (p>0.05) were omitted.
Response Y1 - drug released at second hour
Multiple regression analysis (MLR) and analysis of variance (ANOVA) were carried out
employing the Design Expert software to establish relationship between the two independent
variables (X1 and X2) and the three dependent variables (Y1, Y2 and Y3) in the CCD. The results
of MLR (the value of correlation coefficient and the values of coefficients) and ANOVA
(Fisher‟s ratio and P values) are summarized in Table 3 for the three responses.
High value of correlation coefficient (0.9242) indicates a good fit between the independent
variables and Y1. The model is significant with a P value of 0.0142. This result clearly
demonstrates that at least any one of the selected independent variables has statistically
significant influence on the Y1. As the interaction term and the polynomial terms are not
statistically significant in nature (P > 0.05) for Y1, conclusions can be drawn from the numerical
values of the coefficients of the main effects. The most significant retardation effect on Y1 was
shown by the amount of EC (P = 0.0016). This is obvious since EC is practically insoluble in
aqueous medium and therefore the drug is released by erosion mechanism. Significant change in
Y1 can be obtained by making slight change in the amount of EC. The amount of Compritol can
also be considered significant at P < 0.1. The reason for this occurrence is the hydrophobic
nature of Compritol. The contour plot for Y1 is shown in Figure 6 to facilitate understanding by
the reader. The contour lines are linear in nature in the contour plot since only the main terms
(X1 and X2) were found significant for % CDR at 2h. The equation in terms of coded factors is:
Y1=+43.46-3.62*X1-7.79* X2+3.03* X1 X2+1.14* X12+1.29*X2
2…………………Equation 2

Synopsis
Rana Hardikkumar B. 139997390008 9
Table 1: Summary of FMEA
Failure mode Impact of change Occur
rence
Route of failure Seve
rity
Control Measure Dete
ction
RP
N
Ra
nk
Mat
erial
Conc. of Ethyl
Cellulose
Dissolution, Friability 5 Different Concentration, Material
Variation
5 Dissolution,
Friability tester
5 125 1
Avicel PH 101 Sphericity of Pellet 4 Material Variation 1 Optical Microscope,
Sieve analysis
3 12 8
Conc. of Compritol
800 ATO
Dissolution, Friability 5 Different Concentration, Material
Variation
5 Dissolution,
Friability tester
5 125 1
Conc. of
Pregelatinized starch
Particle size 3 Different Concentration, Material
Variation
4 Size determination 3 36 4
Envi
ron
men
t
Humidity Pellet quality 1 Change in atmospheric condition 1 Hygrometer 1 1 11
Pressure No effect 1 Change in atmospheric condition 1 Manometer 1 1 11
Temperature Pellet quality 1 Change in atmospheric condition 1 Thermometer 1 1 11
Man Analyst Product Quality Testing 1 Manual error 1 Audit, SOP 1 1 11
Stockist Product Quality 1 Manual error 1 Audit, SOP 1 1 11
Retailer Product Quality 1 Manual error 1 Audit, SOP 1 1 11
QC Person Product Quality Testing 1 Manual error 1 Audit, SOP 1 1 11
Formulator Product Quality 1 Manual error 1 Audit, SOP 1 1 11
Mea
sure
men
t
Particle size and size
distribution
Pellet quality 3 Machine Failure, Poor Development 3 Optical Microscope,
Sieve analysis
1 9 9
In vitro drug release Dissolution 4 Machine Failure, Poor Development 5 Dissolution tester 5 100 2
Alcohol induced dose
dumping
Dissolution 4 Machine Failure, Poor Development 3 Dissolution tester 3 36 4
IVIVC Poor Prediction 4 Machine Failure, Poor Development 3 Dissolution 3 36 4
Drug release kinetics Variable drug release 4 Machine Failure, Poor Development 3 Dissolution 3 36 4
Micromeritic
Property
Poor Pellet quality 3 Machine Failure, Poor Development 1 Carr's Index, Angle
of Repose
3 9 9
Physicochemical
Parameter
Friability, Weight
variation
3 Machine Failure, Poor Development 1 Roche friabilitor,
Weight balance
4 12 8
Mac
hine
Dissolution apparatus Dissolution, IVIVC 4 Operator's error, Equipment failure 3 Validation 1 12 8
UV
Spectrophotometer
Drug Estimation 3 Operator's error, Equipment failure 3 Validation 1 9 9
Pan Coater Sphericity of Pellet 3 Operator's error, Equipment failure 1 Validation 1 3 10
Dryer Physical Property 3 Operator's error, Equipment failure 1 Validation 1 3 10
Mixer Content uniformity 3 Operator's error, Equipment failure 1 Validation 1 3 10
Cutter Particle size 3 Operator's error, Equipment failure 1 Validation 1 3 10
Proc Sieve Number Particle size 3 Operator's error, Equipment failure 1 Validation 1 3 10

Synopsis
Rana Hardikkumar B. 139997390008 10
ess Speed of Pan coater Sphericity of Pellet 4 Machine Failure, Poor Development,
Operator's error
4 Automation of
machine
3 48 3
Drying Method Non-uniform drying 3 Machine Failure, Poor Development,
Operator's error
3 Automation of
machine
1 9 9
Mixing method Non-uniform mixing 3 Machine Failure, Poor Development,
Operator's error
3 Automation of
machine
1 9 9
Mixing Time and
speed
Non-uniform mixing 3 Machine Failure, Poor Development,
Operator's error
3 Automation of
machine
3 27 6
Drying Temp. and
Time
Non-uniform drying 3 Machine Failure, Poor Development,
Operator's error
3 Automation of
machine
3 27 6
Speed of cutter or
mixer
Non-uniform particle
size
4 Machine Failure, Poor Development,
Operator's error
3 Automation of
machine
2 24 7
Load in coater and
mixer
Sphericity of Pellet 4 Machine Failure, Poor Development,
Operator's error
4 Automation of
machine
2 32 5
Spheronization time
in coater
Sphericity of Pellet 4 Machine Failure, Poor Development,
Operator's error
4 Automation of
machine
2 32 5
Figure 5: Ishikawa diagram for pellet formulation using method 1

Synopsis
Rana Hardikkumar B. 139997390008 11
Response Y2 - drug released at sixth hour
High value of correlation coefficient (0.9168) indicates a good fit between the independent
variables and Y2. The model is significant with a P value of 0.0162. This result clearly
demonstrates that at least any one of the selected independent variables has statistically
significant influence on the Y2. The interaction term is statistically significant in nature (P <
0.05) for Y2. Therefore, the conclusions should not be drawn from the numerical values of the
coefficients of the main effects and from the contour plot as shown in Figure 6.
Y2 =+73.97-4.46* X1-8.64* X2+6.82* X1 X2-1.72* X12-2.75* X2
2 ………………..Equation 3
Response Y3 - drug released at tenth hour
High value of correlation coefficient (0.9002) indicates a good fit between the independent
variables and Y3. The model is significant with a P value of 0.0215. This result clearly
demonstrates that at least any one of the selected independent variables has statistically
significant influence on Y3. Amount of EC (X2) has prominent effect on Y3. The factor X1 is
statistically insignificant. The two way interaction is significant as p < 0.1.
Y3 = +93.90-2.70* X1-8.08* X2+6.40* X1 X2-4.16* X12-3.52* X2
2 ………………Equation 4
In order to get idea about the acceptable region within the contour plot, overlaid plot was drawn
in Design Expert. The design space is shown in Figure 6. The formulator is free to choose any
point within the design space. It is worthwhile to note that FDA requires that the design space be
clearly defined in ANDA. Optimization was achieved by computing overall desirability. The
software suggested that when the concentration of Compritol and ethyl cellulose were 0.82 and -
0.69 (see the square within the overlaid plot), was seen highest desirability.
To check the reliability of the evolved mathematical models, responses were checked through
additional random check point batches covering the entire range of experimental domain. By the
use of grid search analysis, two batches were selected and responses were predicted by the
mathematical model(22). Percentage prediction error is helpful in establishing the validity of the
three 3generated equations and to describe the domain of applicability of response surface
methodology (RSM). The prediction error was found to vary from 0.19 to 7.27. The low
magnitudes of error as well as the significant values of R2 prove high predictive ability of RSM.
Synopsis
Rana Hardikkumar B. 139997390008 12
Table 2: Design layout responses obtained in the
CCD Batches (Extrusion –spheronization)
Batc
h X1 X2
Y1
(40-
50%)
Y2
(70-
80%)
Y3
(NLT
85%)
G1 0.00 0.00 43.14 74.47 98.99
G2 -1.00 -1.00 56.68 85.59 98.99
G3 0.00 0.00 40.30 73.45 91.88
G4 0.00 0.00 42.48 74.48 95.53
G5 -1.00 1.00 34.53 53.78 70.38
G6 0.00 0.00 42.66 72.98 88.91
G7 1.41 0.00 36.15 55.94 74.78
G8 0.00 1.41 35.83 55.95 74.78
G9 0.00 0.00 48.73 74.45 94.17
G10 1.00 1.00 40.28 68.88 87.06
G11 -1.41 0.00 56.19 83.26 95.56
G12 1.00 -1.00 50.32 73.41 90.07
G13 0.00 -1.41 57.14 79.14 98.14
Table 3: Results of ANOVA for response Y1, Y2 and Y3 and the value of co-efficients
Factor
s
% Drug released at 2h % Drug released at 6h % Drug released at 10h
F
ratio
P
value
Coeffici
ent
F ratio P value Coeff
icient
F ratio P
value
Coef
ficie
nt
Model 6.56 0.0142 43.46 6.24 0.0162 73.97 5.61 0.0215 93.90
X1 5.33 0.0543 -3.62 4.93 0.0618 -4.46 1.77 0.2255 -2.70
X2 24.69 0.0016 -7.79 18.49 0.0036 -8.64 15.79 0.0054 -8.08
X1 X2 1.86 0.2144 3.03 5.76 0.0475 6.82 4.95 0.0614 6.40
X12 0.46 0.5212 1.14 0.64 0.4505 -1.72 3.64 0.0981 -4.16
X22 0.59 0.4671 1.29 1.63 0.2427 -2.75 2.60 0.1511 -3.52
R2 0.9242 0.9168 0.9002
F = Fishers ratio, P = Probability
Table 4: Validation of model
Check point
Batches
Optimiz
ed
batch
Check-
point batch
I
Check-point
batch II
X1 0.82
(16.4 %)
0.82
(16.4 %)
0.80
(16 %)
X2 -0.69
(6.90 %)
-0.66
(6.60 %)
-0.32
(3.20 %)
Predicted Y1 (%) 45.31 45.55 43.14
Observed Y1 (%) 46.25 43.29 46.12
% Error 2.032 5.22 6.46
Predicted Y2 (%) 70 70 70
Observed Y2 (%) 70.14 65.25 66.67
% Error 0.19 7.27 4.99
Predicted Y3 (%) 89.26 89.23 89.62
Observed Y3 (%) 89.59 85.29 87.14
% Error 0.36 4.61 2.84
Figure 6: Contour plot of response Y1, Y2, Y3 and overlaid plot

Synopsis
Rana Hardikkumar B. 139997390008 13
Characterization of pellets
The pellets were evaluated for size(23), shape(24), flow(23), % yield, % friability(25), drug
content(26), in vitro drug release(26, 27) and kinetics of drug release(28).
The sphericity of pellets was determined by calculating aspect ratio. The aspect ratio of all the
batches were found <1.2 except batch G2, G11 and G13. The results are in Table 5. The batches
having dumbbell or oval shape were having aspect ratio greater than 1.2 due to lower amount of
Compritol and / or EC. The yield of all the batches was found in the range of 85 to 97 %. From
SEM image as shown in Figure 7, the pellets of the optimized batch were found to be spherical
and the surfaces of the pellets were found to be smooth. High yield, desired size and smooth
surface were obtained due to the effect of PGS.
The Carr‟s index and Hausners‟ ratio of different batches of pellets were found to be in the range
of 6.26 to 7.14 and 1.06 to 1.07 respectively which indicates excellent flow property and
compressibility. Angle of repose of pellets was found to be in the range of 15 to 25º which also
indicates good flow property. The micromeritic properties of pellet are depicted in Table 5.
Friability of all thirteen batches as well as that of the optimized batch was found to be less than 1
% i.e. 0.05- 0.49%. The drug content study of batch G1 to G13 batches and optimum ranged in
between 96 -101 %w/w. The results are shown in Table 5.
The in vitro drug release kinetic data suggest that the drug was released by diffusion mechanism.
The marketed product and the optimum formulation showed a superior fit with Higuchi model.
The f2 value of optimized batch was found to be 85.76 indicating that their release profiles were
quite similar to that of the reference.
In vivo plasma concentration – time profile as shown in Figure 8 was predicted from the in-vitro
drug release profile using back calculation of Wagner – Nelson method on Excel platform. The
PK parameters Cmax, Tmax and AUC, predicted from convolution method are 44.15 ng/ml, 2 h
and 277 ng/ml.h, which are quite similar to reported values. Results of percentage prediction
error was found in the range of 1.31 to 5.26, indicates similarity in PK parameters.
Accelerated stability study was performed at 45 ˚C and 75 % RH for 6 months. The formulation
was found to be stable as far as physical characteristics and performance.

Synopsis
Rana Hardikkumar B. 139997390008 14
Table 5: Characterization of pellets of galantamine HBr
Batch Aspect Ratio Shape Pellet Size Carr's Index Hausners’ Ratio Angle of repose % Drug Content % Friability
G 1 1.022±0.20 Spherical 1.03±0.02 6.82±0.20 1.073±0.02 19.33±0.94 98.46±0.82 0.49±0.13
G 2 1.316±0.25 Spherical+
Oval
1.13±0.01 7.14±0.20 1.075±0.002 17.00±0.47 96.92±0.62 0.41±0.20
G 3 1.011±0.40 Spherical 0.99±0.01 6.38±0.19 1.068±0.002 18.07±0.66 96.05±0.93 0.22±0.11
G 4 0.989±0.10 Spherical 1.03±0.01 6.82±0.22 1.073±0.002 18.66±0.47 101.53±0.62 0.23±0.11
G 5 1.100±0.12 Spherical 1.04±0.05 6.40±0.22 1.073±0.002 18.86±0.83 99.12±0.53 0.09±0.07
G 6 1.011±0.20 Spherical 1.05±0.004 6.82±0.36 1.068±0.004 17.00±0.27 100.65±0.62 0.26±0.11
G 7 0.889±0.24 Spherical 0.88±0.004 6.52±0.19 1.069±0.002 18.33±0.47 101.09±0.62 0.41±0.21
G 8 0.908±0.36 Spherical 0.88±0.04 6.82±0.22 1.073±0.002 17.66±.47 101.75±0.62 0.23±0.07
G 9 1.021±0.30 Spherical 1.07±0.09 6.84±.42 1.073±.004 19.33±0.94 100.21±0.31 0.19±0.09
G 10 1.021±0.40 Spherical 0.90±0.02 6.84±0.42 1.073±0.004 17.33±0.94 100.21±0.82 0.11±0.04
G 11 1.340±0.46 Spherical+
Oval
1.17±0.009 6.52±0.19 1.069±0.002 19.00±0.81 98.68±0.93 0.33±0.02
G 12 0.909±0.35 Spherical 1.04±0.11 6.29±0.52 1.067±0.005 15.66±0.47 99.12±0.82 0.24±0.05
G 13 1.245±0.20 Spherical+
Oval
1.20±0.09 6.26±0.32 1.066±0.003 19.60±0.43 101.09±0.82 0.05±0.01
Opt. Batch 1.010±0.50 Spherical 1.01±0.03 5.77±0.15 1.061±0.001 18.33±0.47 99.12±0.31 0.05±0.01
Note: Flow can be calculated as per the USP general chapter on powder flow
Figure 7: SEM image of pellets
Figure 8: Predicted in vivo plasma concentration
time profile from in vitro drug release data
Figure 9: Comparison of in vitro release study
in stability study
0
20
40
60
80
100
0 5 10
% C
DR
Time
0 month
3 months
6 months

Synopsis
Rana Hardikkumar B. 139997390008 15
Figure 10: (a) Dissolution profile in two-tier test (first hr. in hydro alcoholic media and then in water) (b)
Influence of hydroalcoholic media on drug release (12 hr in alcoholic media)
Vulnerability of alcohol on % drug release of optimized batch was assessed. Dissolution profiles
of optimum formulations in the presence of alcohol up to 40% are shown in Figures 10. For
optimized formulation, even extreme exposure to the hydroalcoholic media for up to 12 h did not
result in a failure of the matrices. The differences observed in drug release profiles in different
media may be due to changes in drug solubility in the respective media.
METHOD 2 OF PELLET FORMULATION (EXTRUSION- SPHERONIZATION)
The drug and the excipients except pregelatinized starch were blended. Compritol and EC were
dissolved in a blend of isopropyl alcohol and dichloromethane (1:1). The solution was added to
the above powder blend to get wet coherent mass. The mass was extruded through a mono-screw
extruder with a die plate of 1 mm diameter at a constant screw speed of 30 rpm. The extrudates
were sprinkled with PGS to strengthen them and also to get maximum yield of pellets of required
size. Then extrudates were spheronized using a spheronizer. Spheronization was carried out at
1500 rpm for 10 minutes at room temperatures. A radial plate spheronizer with a plate diameter
of 45.0 cm was used. The wet pellets were dried in a hot air oven at 40°C for 1 hour. Finally, the
pellets were passed through a 16–22 mesh and then stored in sealed glass bottles.

Synopsis
Rana Hardikkumar B. 139997390008 16
Figure 11: Modified extrusion spheronization method using extruder spheronizer
Risk assessment
The FMEA was used to perform the qualitative risk assessment, which could identify the critical
quality attributes (CQAs) that have the greatest chance of causing product failure, i.e., not
meeting the QTPP. RPN was calculated as discussed earlier. The amount of Compritol and the
EC were identified as the significant parameters affecting the quality of sustained release pellets
as these parameters got highest RPN score.
Central composite design (CCD)
CCD was employed for the optimization of responses. Thirteen batches were prepared. The 22
factorial points, four star points and five replicates at the centre point. Polynomial equation was
constructed using Design Expert software. Response surface plot and contour plots were drawn.
The experiment runs with independent variables (X1 and X2) and the observed responses (Y1, Y2
and Y3) are shown in Table 7. The actual values of X1 were 10 % (-1), 15 % (0) and 20% (+1).
The actual values of X1 were 10% (-1), 15% (0) and 20% (+1). The desirable value of Y1, Y2 and
Y3 is 40-50 %, 70-80 % and NLT 85 % respectively. The results of MLR (the value of
correlation coefficient and the values of coefficients) and ANOVA (Fisher‟s ratio and P values)
are summarized in Table 8 for the three responses.
Response Y1 - drug released at the second hour
Large model R2 value (0.9333) and high F value (19.57) with very low p value (0. 0006) for Y1
indicates that the model is significant for this response. Here, both the main effect i.e. X2 (P =
0.0006) and X1 (P=0.0001) had significant effect on Y1 as P value is less than 0.005. The
Powder blend + solution of
Compritol and EC
Extrusion for formation of extrudates
Sprinkling of PGS
Conversion into small extrudes
Spheronization
Increases yield of required
size,
Improvement in physical
properties of pellets,
Better control on drug release
and therefore better BA
Benefits
New
inventing
Step

Synopsis
Rana Hardikkumar B. 139997390008 17
interaction terms had non-significant effect on Y1 as P> 0.005. From the polynomial equation, it
is also seen that the factor X1 and X2 exhibit negative effect on Y1. The relationship between the
dependent and independent variables was also elucidated by constructing response surface plots
as shown in Figure 13. The contour lines are non-linear in nature in the contour plot since only
the main terms (X1 and X2) and interaction effects were found significant for Y1. The equation in
terms of un-coded factors is:
Y1=+44.75 - 7.55X1 - 6.00X2 - 3.23 X1 X2 + 0.30 X12
+ 1.07 X22…………………Equation 5
Response Y2 - drug released at sixth hour
Large model R2 values (0.9706) and high F value (46.29) with very low p value (0. 0001) for the
drug release at 6 h indicated that the model was predictive and significant for this response. The
main effect and interaction terms both have significant effect on response Y2 as p value is <0.05.
Therefore, conclusions can‟t be drawn from the numerical values of the coefficients of the main
effects and interaction effect. In such instances, it is common to draw the conclusions from the
contour plot rather the values of coefficients. Figure 13 shows the contour plot for Y2. The
contour lines are non-linear in nature. The equation in terms of un-coded factors is:
Y2 =+74.59 - 6.72 X1 - 6.54 X2 - 3.22 X1 X2 - 2.96 X12
- 2.35 X22......................... Equation 6
Response Y3 - drug released at tenth hour
The main effects and the two-way interaction term, both have significant effect on response Y3
as p value is <0.05. Figure 13 shows the contour plot for Y3. The contour lines are non-linear in
nature. Factor X2 was the most significant factor (F=71.75, p=0.0001) affecting Y3 negatively;
increase in the concentration of polymer reduced the drug release at 10 h. Also X1 has the
negative effect on Y3 (F=41.35, p=0.0004). From the equation it is also observed that interaction
terms have also the negative effect on Y3. The lack of fit was found non-significant, which is
desired. The reason cited above for release retardation is also applicable at this sampling time.
The equation in terms of un-coded factors is:
Y3 = +93.90 - 2.70 X1 - 8.08 X2 + 6.40 X1 X2 - 4.16 X12
- 3.52 X22……….. Equation 7

Synopsis
Rana Hardikkumar B. 139997390008 18
Table 6: Design layout responses obtained in the CCD
Batches (Extrusion –spheronization)
Batch X1 X2 Y1 (%) Y2
(%)
Y3
(%)
G 1 -1.00 -1.00 56.57 78.36 94.2
G2 1.00 -1.00 50.98 73.52 90.41
G 3 -1.00 1.00 51.37 73.07 86.18
G 4 1.00 1.00 32.85 55.34 70.23
G 5 -1.41 0.00 56.37 78.88 93.53
G 6 1.41 0.00 30.7 56.85 74.38
G 7 0.00 -1.41 53.8 79.31 97.5
G 8 0.00 1.41 36.34 58.89 73.83
G 9 0.00 0.00 45.26 73.54 91.16
G 10 0.00 0.00 43.12 73.91 91.53
G 11 0.00 0.00 45.05 74.55 86.08
G 12 0.00 0.00 47.18 76.91 94.35
G 13 0.00 0.00 43.14 74.02 90.24
Table 7: Results of ANOVA for response Y1, Y2 and Y3 and the value of co-efficients
F = Fishers ratio, P = Probability
Factor
s Y1 Y2 Y3
F
value
P
value
Coeffi
cient F value P value
Coeff
icient
F
value P value
Co
efficient
Model 19.57 0.0006 44.75 46.29 < 0.0001 74.59 26.78 0.0002 90.67
X1 56.21 0.0001 -7.55 100.23 < 0.0001 -6.72 41.35 0.0004 -5.85
X2 35.51 0.0006 -6.00 95.15 < 0.0001 -6.54 71.75 < 0.0001 -7.71
X1 X2 5.15 0.0575 -3.23 11.54 0.0115 -3.22 5.58 0.0502 -3.04
X12 0.078 0.7875 0.30 16.97 0.0045 -2.96 11.07 0.0126 -3.25
X22 0.98 0.3549 1.07 10.63 0.0139 -2.35 6.01 0.0440 -2.39
Lack
of Fit 5.25 0.0715 3.29 0.1403 0.40 0.7640
R2 0.9333 0.9706 0.9503
Table 8: Validation of model
Check
point
Batches
Optimized
batch
Check-point
batch I
Check-
point
batch II
X1 0.84(16.8%) 0.59(11.8 %) 0.55(11%)
X2 -0.70 (7 %) -0.17(1.7%) -0.60 (6 %)
Y1 (%) 44.99 44.99 44.99
(%) 42.27 43.29 46.12
% Error 6.43 3.92 2.45
Y2 (%) 68.63 68.27 68.98
Y2 (%) 75.08 65.25 66.67
% Error 8.59 4.62 3.46
Y3 (%) 87.7 86.94 88.4
Y3 (%) 92.26 85.29 87.14
% Error 4.94 1.93 1.44
Figure 12: Contour plot of response Y1, Y2, Y3 and overlaid plot

Synopsis
Rana Hardikkumar B. 139997390008 19
Design space and validation of response surface methodology
Design space is identified using overlaid plot which gives acceptable region for each responses.
Overlaid plot was drawn in Design Expert software which is shown in Figure 13. The
highlighted region shown in overlaid plot is optimized region. The software suggested that when
the concentration of Compritol (X1) and ethyl cellulose (X2) was 0.84 and -0.70 (see the square
within the overlaid plot), the three requirements, outlined in Table 9 are satisfied. The actual
value of the above X1 and X2 are 16.8% and 7 %.
The validation of model was performed by grid search analysis method as discussed earlier and
percentage prediction error are shown in Table 9. The low magnitudes of error as well as the
significant values of R2 in the present study prove high predictive ability of RSM.
Characterization of pellets
The pellets were characterized by different evaluation parameters like shape, size, yield, flow,
drug content and friability. The results are shown in Table 5.
The aspect ratio values of all the batches were found between 0.8 to 1.2 except batches G4, G6
and G8. The values of aspect ratio of G4, G6 and G8 were found to be > 1.2 due to higher
concentration of Compritol 888 ATO and ethyl cellulose. The aspect ratio of optimized batch
was found to be 0.99. The Pellet size of optimized batch was found to be 0.98±0.14 mm. Yield
was calculated only from the pellet size in the range of 0.85 to 1.2 mm.
Yield of all the batches were found very high, in the range of 95 to 98 %, mainly due to the
effect of pregelatinized starch which is sprinkled after the processing stage of extrusion.
Data of r2 indicate that Higuchi models suitably described the release of Galantamine from the
pellets. None of the formulation exhibited first order kinetics. The values of n were in the range
of 0.5 to 0.6088 (i.e., between 0.50 – 0.89) exhibits non-fickian (anomalous) transport in which
the drug was delivered by combined effect of diffusion and polymer relaxation. The f2 value of
optimized batch was found to be 77.03 which indicate the similarity between the optimized batch
and marketed formulation.

Synopsis
Rana Hardikkumar B. 139997390008 20
Table 9: Characterization of pellets
Batch Aspect
Ratio Shape
Pellet
Size
(mm)
% Yield
(%)
Carr's
Index (%)
Hausner's
Ratio
Angle of
repose (˚)
Drug Content
(%)
Friability
(%)
G 1 0.90±0.12 Spherical 1.20±0.22 98.00±0.40 6.38±0.19 1.06±0.002 18.33±0.47 98.68±1.41 0.79±0.04
G 2 0.91±0.10 Spherical 1.04±0.12 96.67±1.24 6.98±0.22 1.07±0.002 17.33±0.48 98.03±2.14 0.41±0.06
G 3 1.10±0.2 Spherical 1.07±0.12 98.50±1.08 6.82±0.22 1.073±0.002 17.00±0.82 99.34±1.93 0.38±0.04
G 4 1.33±0.02 Spherical + Oval 0.89±0.01 97.17±1.64 6.98±0.22 1.07±0.003 17.84±0.85 99.34±1.61 0.01±0.01
G 5 1.00±0.25 Spherical 1.18±0.02 98.67±0.84 6.68±0.36 1.07±0.004 18.66±0.24 99.12±1.24 0.74±0.06
G 6 1.23±0.5 Spherical + Oval 0.90±0.01 96.33±1.24 6.00±0.17 1.06±0.001 18.84±0.23 101.97±1.61 0.06±0.04
G 7 1.01±0.24 Spherical 1.13±0.05 96.67±0.47 6.38±0.19 1.06±0.002 19.17±0.24 101.75±2.17 0.68±0.05
G 8 1.21±0.30 Spherical + Oval 0.88±0.02 97.00±0.81 6.52±0.19 1.06±0.002 18.66±0.48 98.25±2.75 0.13±0.14
G 9 0.91±0.24 Spherical 0.96±0.04 97.00±1.47 6.520.19 1.06±0.002 19.90±0.54 100.88±2.03 0.23±0.07
G 10 0.97±0.30 Spherical 1.06±0.10 97.67±1.24 6.840.42 1.07±0.004 19.34±0.47 101.32±2.46 0.19±0.08
G 11 1.13±0.90 Spherical 0.96±0.02 97.33±1.64 6.520.19 1.06±0.002 19.00±0.82 100.88±2.64 0.23±0.09
G 12 1.10±0.78 Spherical 0.98±0.03 95.83±1.17 6.12±0.17 1.06±0.001 16.67±0.47 98.90±2.64 0.12±0.04
G 13 1.00±0.98 Spherical 1.03±0.05 97.00±1.47 6.26±0.32 1.06±0.003 19.50±1.08 99.78±2.48 0.13±0.05
Opt. Batch 0.99±0.35 Spherical 0.98±0.14 98.24±1.20 7.07±1.24 1.08±0.014 18.66±0.94 98.69±0.31 0.2±0.07
Figure 13: SEM image of optimized batch
pellets using method - 2
Figure 14: (a) Predicted in vivo plasma concentration time profile from in vitro drug release (b) Comparison of in vitro
release study in stability study
Synopsis
Rana Hardikkumar B. 139997390008 21
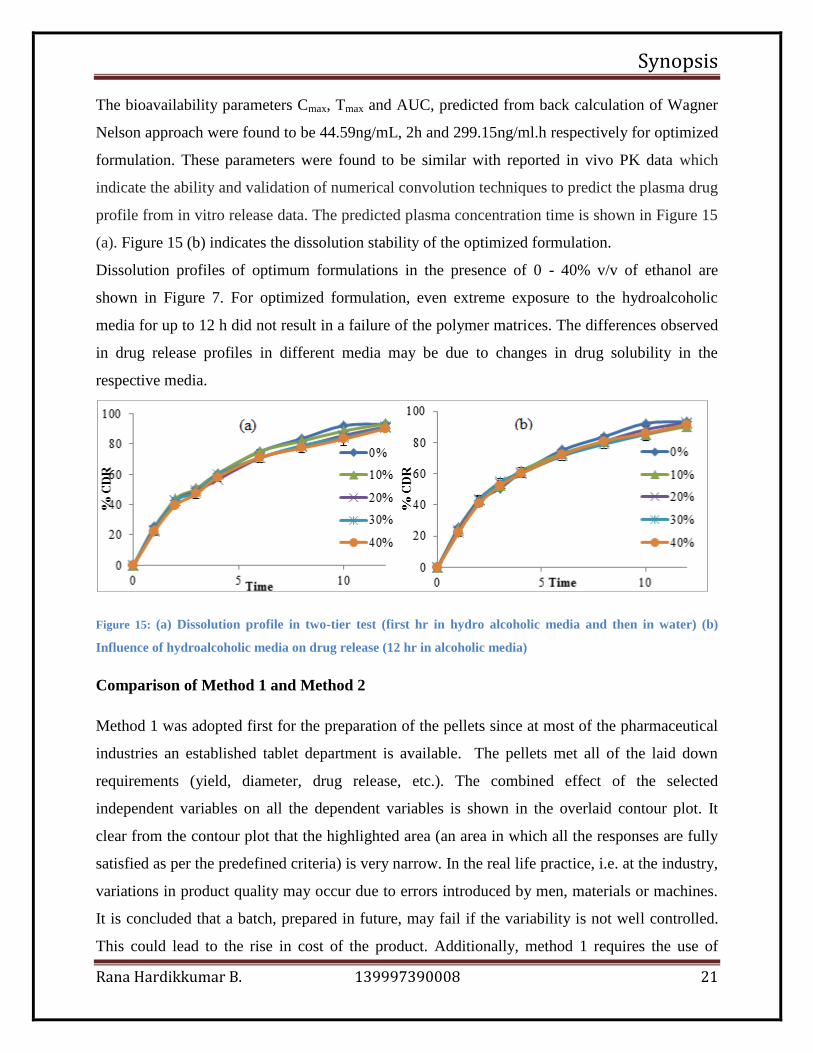
The bioavailability parameters Cmax, Tmax and AUC, predicted from back calculation of Wagner
Nelson approach were found to be 44.59ng/mL, 2h and 299.15ng/ml.h respectively for optimized
formulation. These parameters were found to be similar with reported in vivo PK data which
indicate the ability and validation of numerical convolution techniques to predict the plasma drug
profile from in vitro release data. The predicted plasma concentration time is shown in Figure 15
(a). Figure 15 (b) indicates the dissolution stability of the optimized formulation.
Dissolution profiles of optimum formulations in the presence of 0 - 40% v/v of ethanol are
shown in Figure 7. For optimized formulation, even extreme exposure to the hydroalcoholic
media for up to 12 h did not result in a failure of the polymer matrices. The differences observed
in drug release profiles in different media may be due to changes in drug solubility in the
respective media.
Figure 15: (a) Dissolution profile in two-tier test (first hr in hydro alcoholic media and then in water) (b)
Influence of hydroalcoholic media on drug release (12 hr in alcoholic media)
Comparison of Method 1 and Method 2
Method 1 was adopted first for the preparation of the pellets since at most of the pharmaceutical
industries an established tablet department is available. The pellets met all of the laid down
requirements (yield, diameter, drug release, etc.). The combined effect of the selected
independent variables on all the dependent variables is shown in the overlaid contour plot. It
clear from the contour plot that the highlighted area (an area in which all the responses are fully
satisfied as per the predefined criteria) is very narrow. In the real life practice, i.e. at the industry,
variations in product quality may occur due to errors introduced by men, materials or machines.
It is concluded that a batch, prepared in future, may fail if the variability is not well controlled.
This could lead to the rise in cost of the product. Additionally, method 1 requires the use of

Synopsis
Rana Hardikkumar B. 139997390008 22
multistep process and hence validation requires very careful attention. The main advantage of
method 1 is the use of the existing machineries in a pharmaceutical company.
Method 2 was adopted next, where in the process of extrusion- spheronization was adopted. In
methods 2 also satisfactory pellets were obtained. The method 2 required less number of steps as
compared to the method 1 and hence validation is simpler as compared to the method 1. The
acceptable highlighted area is wider in the method 2. Therefore, we may conclude that method 2
is more robust in nature as compared to the method 1 to absorb the normal variations due to men,
materials or machines.
Finally, it is concluded that method 2 is marginally superior (larger design space as compared
that of method 1 and simplified validation) to method 1 and therefore, it was chosen for further
studies. PGS was omitted in one batch and in the other batch it was added before spheronization.
The results are discussed below.
VALIDATION OF INNOVATIVE STEP
The innovative finding of the present research was to sprinkle of pregelatinized starch after the
extrusion step. The step is validated by preparing additional two batches. The first batch was
prepared excluding pregelatinized starch in the processing of pellets and the second batch was
prepared by adding the same amount of PGS in the wet mass directly. Both the additional
batches were compared with the optimized batch which was prepared by sprinkling PGS
extragranulary after the extrusion step. All the batches were characterized by different evaluation
parameters. The results are shown in Table 11. The results clearly indicate that the excellent flow
property was achieved by the addition of PGS extragranularly and not with the other two
batches. Sprinkling of PGS, gives additional lubricant effect. It resulted in improved flow
property. The friability was drastically decreased in the batch containing PGS extragranularly i.e.
0.05±0.015. The uniform, spherical and desired size (1 mm) pellets having smooth surfaces were
obtained by the use of PGS extragranularly. While in other two batches, the pellet size was very
less i. e. <0.5 and shape of the pellets was dumbbell. The major change was observed with the %
yield of desired size (0.8 to 1.2 mm) pellets. It is 94.12±0.7 in the case of optimized batch with
extragranular PGS while in the case of other two batches, it is quite low i.e. less than 30%.

Synopsis
Rana Hardikkumar B. 139997390008 23
Table 10: Evaluation of method validation batches
Parameter Optimized batch
excluding PGS
Optimized batch adding
PGS intragranularly
Optimized batch sprinkling PGS
extragranularly
Angle of repose 30.40±0.03 29.05±0.02 18.33±0.47
Bulk density (g/ml) 1.36±0.04 1.28±0.039 1.15±0.30
Tapped density (g/ml) 1.74±0.09 1.64±0.016 1.22±0.03
Carr's Index 21.60±3.28 22.29±1.64 5.77±0.15
Hausners’ Ratio 1.278±0.053 1.287±0.02 1.061±0.001
% Friability 0.69±0.27 0.26±0.07 0.05±0.015
Average pellet size (mm) 0.49±0.02 0.48±0.016 1.006±0.03
Shape Dumbbell Dumbbell Spherical
% yield * 29.40±0.6 32.34±0.02 94.12±0.7
Drug Content (%) 97.807±0.72 96.71±0.93 99.12±0.31
Figure 18 (b) shows the results of in vitro drug release of thrice batch and compared with
marketed formulation. The formulated three batches were compared with the marketed
formulation using f2 value. The f2 value of all the batches was found to be 50.88 and 51.11 which
is more than 50 but very close to lower acceptance value. While in the case of third batch i.e.
sprinkling of PGS extragranularly, the f2 it was found to be 85.76 which is quite high and
acceptable. The results of the three batches suggest the use of PGS extragranularly which
improve the flow, control the size and other physical parameters as well as modulate the drug
release which is expected to show better therapeutic effect.
F. ACHIEVEMENTS WITH RESPECT TO OBJECTIVES - SUMMARY
The main objective of the present investigation was to find a solution to the commonly
encountered problem in pelletization i.e. low yield. The study was also carried out to develop
modified release pellets of galantamine HBr using the concepts of QbD. The study was carried
out to identify the CMAs and/or CPPs for pelletization of galantamine. Ishikawa (fish-bone)
diagram was constructed to establish the potential cause-effect relationship among the product
and process variables. FMEA approach was adopted to identify critical factors. The variables
that could affect in vivo performance were given high RPN score. The two high-risk factors
identified in a risk analysis study were the amount of Compritol and EC.
Synopsis
Rana Hardikkumar B. 139997390008 24
Central composite design was applied to optimize the pellet formulation considering the amount
of Compritol and EC as independent variables and % drug release at 2 h (Y1), % drug release at 6
h (Y2) and % drug release at 10 h (Y3) as the responses. The CCD can be used to define the
design space and predict the values for all the three responses with high degree of accuracy.
Numerical optimization, using desirability approach, was employed to locate optimal settings of
formulation variables to obtain the desired response using the Design Expert software. From the
results, it is evident that the two factors contribute in determining the % drug release from
multiparticulate dosage form.
A simple numerical back calculation of Wagner Nelson method was used to predict the plasma
drug concentration–time profiles from in vitro dissolution results of optimized formulations
which indicate that designed CR formulation can prolong the absorption of drug up to 12h.
The performance of the optimized batch, obtained from the central composite design was
compared with that of marketed formulation. Similarity factor - f2 value was found to be 85.06
and 77.03 for both the methods (i.e. method 1 and method 2) and which showed that both
formulations‟ drug profile were similar.
The optimized batch was also prepared excluding of PGS and also incorporating PGS into the
wet mass (pre-extrusion) and compared with the optimized batch prepared by sprinkling with
PGS. The results confirmed that the sprinkling of PGS after the extrusion step is beneficial for
the production of good quality pellets with desired physical properties and to control the drug
release.
A robust formulation was developed containing Compritol and EC which showed that the in
vitro drug release was not affected in the presence of alcohol. Slight change in drug release was
observed in the presence of the higher concentration of alcohol but it was due to the change of
solubility in different media and not due to the failure of matrices.
Optimized galantamine HBr batch was subjected for the stability studies at 40 ± 2 0C and 75 ±
5% RH for a period of 6 months in a stability chamber. The formulation was found to be stable
as far as physical characteristics and the dissolution of drug was concerned.
G. CONCLUSION
The current pharmaceutical quality system incorporates the concepts of pharmaceutical
development (ICH Q8), quality risk management (QRM, ICH Q9), and pharmaceutical quality

Synopsis
Rana Hardikkumar B. 139997390008 25
system (ICH Q10). Based on the prior knowledge and available literature, detailed failure mode
and effect analysis, a popular QRM technique, was carried out to identify potentially critical
factors for identifying design space. Modified pelletization method is able to produce the desired
characteristics pellet with better flow, uniform desired size and high yield with superior control
on drug release. Modified release pellets were prepared using Compritol and ethyl cellulose. The
amount of Compritol and ethyl cellulose had significant effect on pellet formulation. One of the
catchy finding of the present study was to use pregelatinized starch in the post extrusion step to
obtain superior product and high yield. The findings of the current study can be useful to draft
the control strategy for the life cycle management of the product. The process outlined in the
present study has been applied for obtaining a patent. The proof of patent is attached.
H. ORIGINAL CONTRIBUTION BY THE THESIS
The modified release pellets of galantaimine HBr were successfully formulated using Compritol
and EC integrating the concepts of QbD. For the successful development of modified release
pellets, in vitro drug release is critical which was selected as response in the CCD. FMEA
revealed that, amount of Compritol and EC had significant effect on in vitro drug release of
modified release pellets. The modified release pellets were prepared using modified extrusion
spheronization method. The innovative finding of the present research work is to use
pregelatinized starch in the post extrusion step. The addition of this step resulted in the required
size of pellets with better yield and low friability. Additionally, more control on drug release was
observed with the use of pregelatinized starch. A robust formulation was developed containing
Compritol and ethyl cellulose which showed that the in vitro drug release was not affected in the
presence of alcohol. Stability study suggests that the formulation was found to be stable as far as
physical characteristics and the dissolution of drug was concerned.

Synopsis
Rana Hardikkumar B. 139997390008
REFERENCES
1. Muley S, Nandgude T, Poddar S (2016) "Extrusion – spheronization a promising
pelletization technique : In-depth review." Asian J Pharm Sci, 11,6684–699.
2. Lavanya K (2011) "Pelletization Technology: A quick review." Int J Pharm Sci Res,
2,61337–1355.
3. Wang J, Kan S, Chen T, Liu J (2014) "Application of quality by design (QbD) to
formulation and processing of naproxen pellets by extrusion – spheronization." Pharm
Dev Technol, 20,2246–56.
4. Shah N, Mehta T, Gohel M (2016) "Formulation and Optimization of Multiparticulate
Drug Delivery System Approach for High Drug Loading." AAPS PharmSciTech, Mcc.
doi:10.1208/s12249-016-0689-6.
5. Khanahmadi M, Farhud DD, Malmir M (2015) "Genetic of Alzheimer’s disease: A
narrative review article." Iran J Public Health, 44,7892–901.
6. Scheltens P, et al. (2016) Alzheimer’s disease. The Lancet (Elsevier Ltd), pp 1–13.
7. Alzheimer’s Association (2017) "2017 Alzheimer’s disease facts and figures."
Alzheimer’s Dement,1–50.
8. Poulomi Banarjee (2016) "India has second most number of individuals suffering from
dementia." Hindustan Times,. Available at: http://www.hindustantimes.com/india/india-s-
cities-are-faced-with-a-severe-waste-management-crisis/story-
vk1Qs9PJT8l1bPLCJKsOTP.html.
9. Theleritis C, Siarkos K, Katirtzoglou E, Politis A (2017) "Pharmacological and
Nonpharmacological Treatment for Apathy in Alzheimer Disease : A Systematic Review
Across Modalities." J Geriatr Psychiatry, 30,126–49.
10. Kuna Y, Kumari N (2013) "Chronic effects of anti-Alzheimer ’ s drug , Galantamine
hydrobromide on cholinergic system of mice brain." J Pharm Res, 6,7714–719.
11. Yang S (2017) "Preparation and evaluation of novel galantamine hydrobromide sustained-

Synopsis
Rana Hardikkumar B. 139997390008
release capsule." Bangladesh J Pharmacol, 11,20161–10.
12. Lazzari A, Kleinebudde P, Knop K (2018) "Xanthan gum as a rate-controlling polymer for
the development of alcohol resistant matrix tablets and mini-tablets." Int J Pharm,
536,1440–449.
13. Robert J., Meyer M., Hussain A (2005) FDA ’ s ACPS Meeting , Awareness Topic :
Mitigating the Risks of Ethanol Induced Dose Dumping from Oral Sustained / Controlled
Release Dosage Forms Ph . D . Office of New Drugs and Office of P.
14. USFDA FDA’s alert for healthcare professionals. Hydromorphone hydrochloride
extended-release capsules (marketed as PalladoneTM
), Alcohol- PalladoneTM
interaction.
Available at:
http://www.fda.gov/Drugs/DrugSafety/PostmarketDrugSafetyInformationforPatientsandPr
oviders/ucm129288.htm.
15. Nep EI, et al. (2018) "Hydro-alcoholic media effects on theophylline release from
sesamum polysaccharide gum matrices." Drug Dev Ind Pharm, 44,2251–260.
16. World Health Organization (2018) "Global status report on alcohol and health 2018." 1–
450.
17. Yan H, Zhang S, He J, Liu J (2016) "Application of ethyl cellulose, microcrystalline
cellulose and octadecanol for wax based floating solid dispersion pellets." Carbohydr
Polym, 148,143–52.
18. FDA (2011) "Quality by Design for ANDAs : An Example for Modified Release Dosage
Forms." 1–161.
19. Stamatis DH (2003) Failure Mode And Effect Analysis FMEA from Theory to Execution
(Milwaukee: ASQ Quality Press). 2nd Ed.
20. Fahmy R, et al. (2012) "Quality by Design I : Application of Failure Mode Effect Analysis
( FMEA ) and Plackett – Burman Design of Experiments in the Identification of “ Main
Factors ” in the Formulation and Process Design Space for Roller-Compacted
Ciprofloxacin Hydrochloride I." AAPS PharmSciTech, 13,41243–1254.

Synopsis
Rana Hardikkumar B. 139997390008
21. Bose A, Wong TW, Singh N (2013) "Formulation development and optimization of
sustained release matrix tablet of Itopride HCl by response surface methodology and its
evaluation of release kinetics." Saudi Pharm J, 21,2201–213.
22. Singh G, Pai RS, Devi VK (2012) "Optimization of Pellets Containing Solid Dispersion
Prepared by Extrusion / Spheronization Using Central Composite Design and Desirability
Function." J Young Pharm, 4,3146–156.
23. Gangurde AB, et al. (2015) "Modified extrusion-spheronization as a technique of
microencapsulation for stabilization of choline bitartrate using hydrogenated soya bean
oil." Int J Pharm Investig, 5,4275–283.
24. Akhgari A, Abbaspour MR, Pirmoradi S (2011) "Preparation and evaluation of pellets
using acacia and tragacanth by extrusion-spheronization." DARU J Pharm Sci, 19,6417–
23.
25. Amin P, Deshmukh K (2013) "Meltlets ® of soy isoflavones: Process optimization and the
effect of extrusion spheronization process parameters on antioxidant activity." Indian J
Pharm Sci, 75,4450.
26. USP Revision Bulletin (2008) "Galantamine Hydrobromide." 1–2.
27. USP Revision Bulletin (2016) "Galantamine Extended-Release Capsules, USP Revision
Bulletin Official." 1–5.
28. Zhang Y, et al. (2010) "DDSolver: An Add-In Program for Modeling and Comparison of
Drug Dissolution Profiles." AAPS J, 12,3263–271.

LIS
T O
F A
LL
PU
BL
ICA
TIO
NS
AR
ISIN
G F
RO
M T
HE
TH
ES
IS
Sr.
No.
Tit
le o
f P
ap
er
Na
me
of
Jou
rnal
Mon
th a
nd
yea
r of
pu
bli
cati
on
Volu
me
-
Issu
e
ISS
N
Nu
mb
er
UG
C
Ap
pro
val
(Yes
/ N
o)
Sco
pu
s
Ind
exed
(Yes
/
No)
Pu
bli
cati
on
statu
s
1.
D
evel
opm
ent
of
Sust
ained
Rel
ease
Pel
lets
of
Gal
anta
min
e H
Br
by
Ex
trusi
on
Spher
oniz
atio
n
Tec
hniq
ue
Inco
rpora
ting R
isk
bas
ed Q
bD
Appro
ach
Res
earc
h J
ourn
al
of
Phar
mac
y a
nd
Tec
hnolo
gy
Novem
ber
2018
11(1
1)
0974-
3618
(Pri
nt)
,
0974-
360X
(Onli
ne)
Yes
Y
es
Publi
shed
2.
V
uln
erab
ilit
yo
f
Hyd
ro-A
lcoholi
c
Med
ia o
n I
n V
itro
Dru
g R
elea
se f
rom
Gal
anta
min
eHB
r
Pel
lets
Com
pri
sing
of
Com
pri
tol8
88
AT
O a
nd E
thoce
l
Res
earc
h J
ourn
al
of
Phar
mac
y a
nd
Tec
hnolo
gy
Feb
ruar
y
2019
12 (
2)
0974-
3618
(Pri
nt)
,
0974-
360X
(Onli
ne)
Yes
Y
es
Acc
epte
d
3.
D
emonst
rati
on o
f
Advan
ced D
ata
Min
ing T
echniq
ue
for
the
Dev
elopm
ent
of
Gal
anta
min
e
Hyd
robro
mid
e
Pel
lets
em
plo
yin
g
Modif
ied E
xtr
usi
on
-
Pel
leti
zati
on
Tec
hniq
ue
Asi
an J
ourn
al o
f
Phar
mac
euti
cs
--
--
1998-
409X
(E
)
0973-
8398 (
P)
Yes
Y
es
Under
Rev
iew
Recommended