Development of cryogenic LNG reference liquids
Dr Paul HollandEffecTech Group
Introduction
• Importance of LNG composition measurements
• Issues when measuring cryogenic LNG
• Cryostat design
• Cryostat operation
• Results
• Overcoming the cryostat / GC / vaporiser paradox
• Conclusions
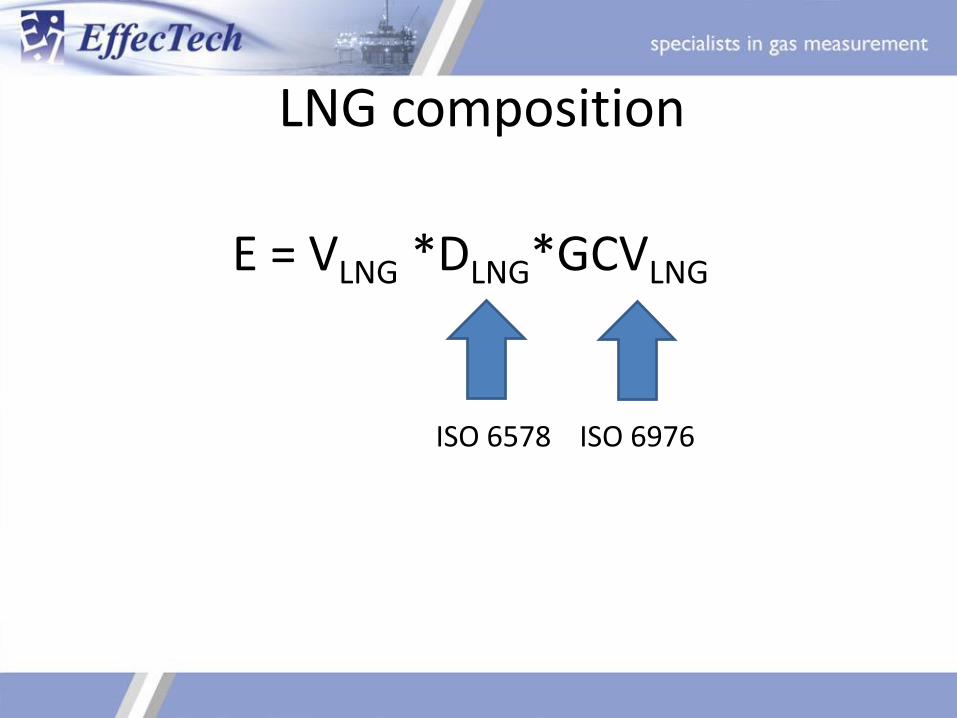
LNG composition
E = VLNG *DLNG*GCVLNG
LNG composition
E = VLNG *DLNG*GCVLNG
ISO 6578
LNG composition
E = VLNG *DLNG*GCVLNG
ISO 6578 ISO 6976
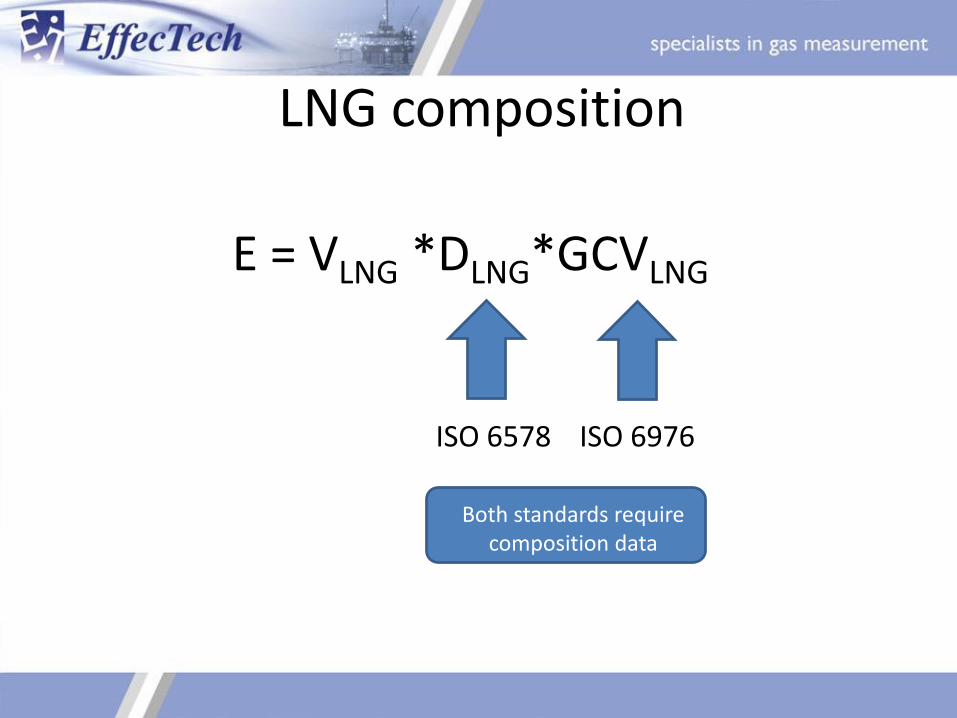
LNG composition
E = VLNG *DLNG*GCVLNG
ISO 6578 ISO 6976
Both standards require composition data
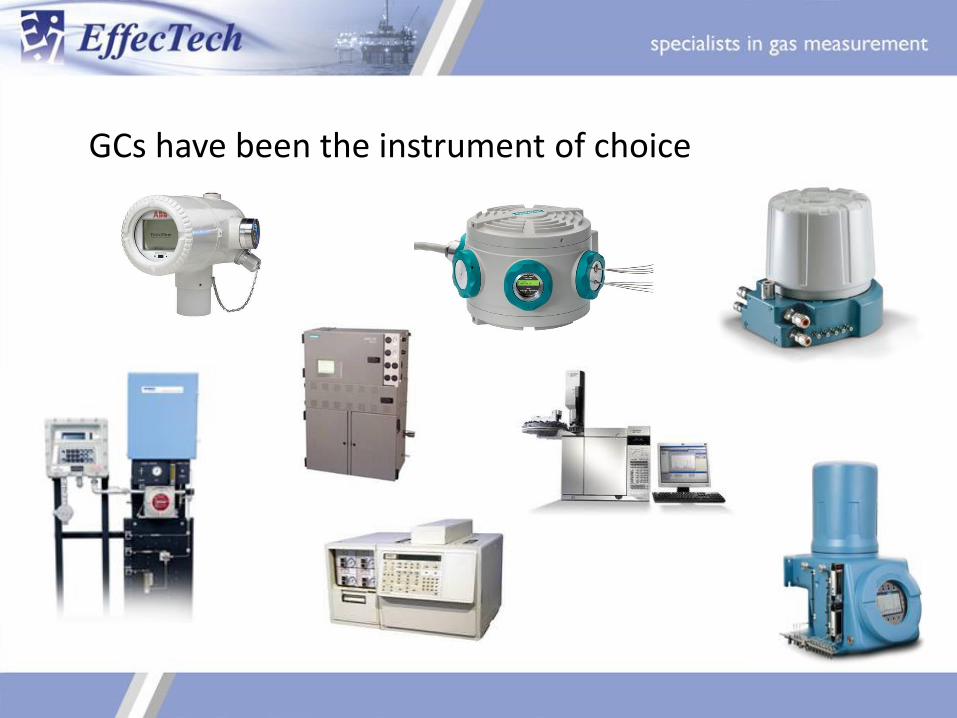
GCs have been the instrument of choice
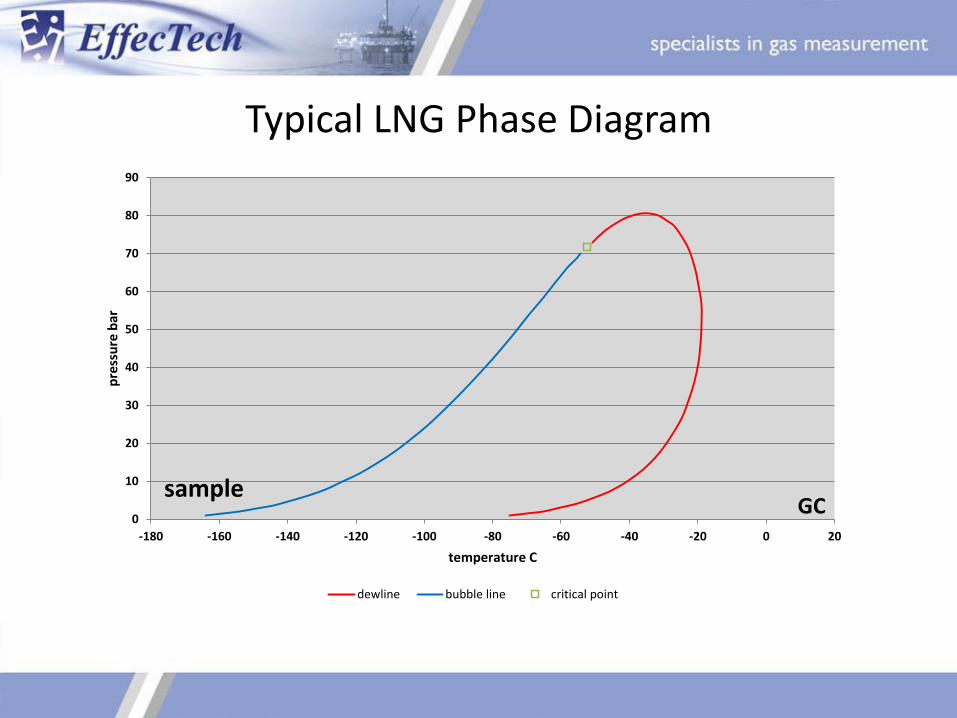
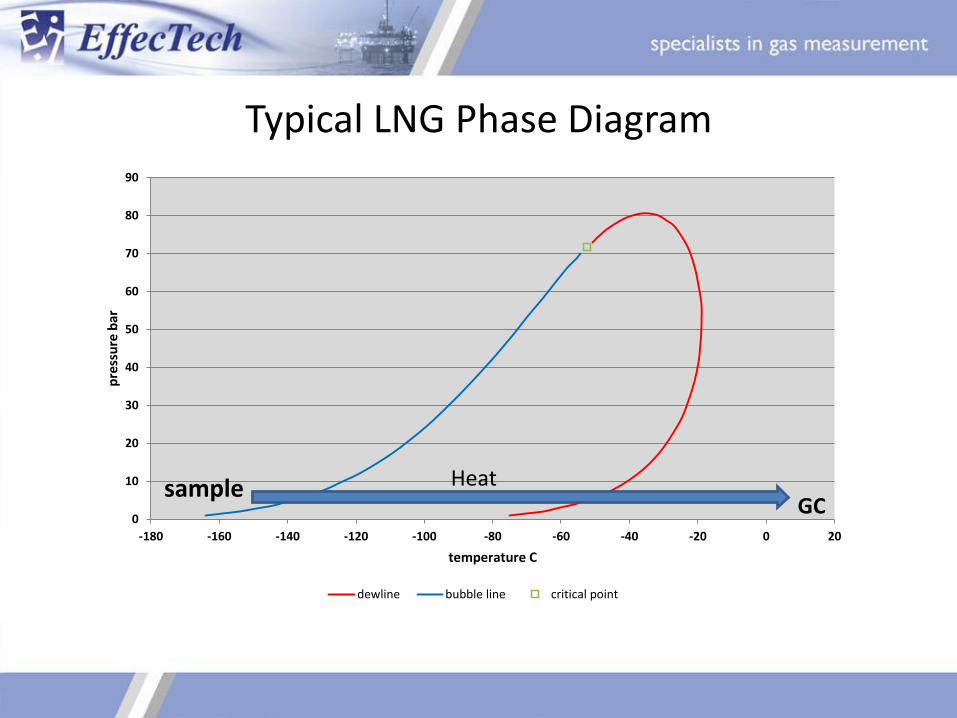
Typical LNG Phase Diagram
0
10
20
30
40
50
60
70
80
90
-180 -160 -140 -120 -100 -80 -60 -40 -20 0 20
pre
ssu
re b
ar
temperature C
dewline bubble line critical point
sampleGC
Typical LNG Phase Diagram
0
10
20
30
40
50
60
70
80
90
-180 -160 -140 -120 -100 -80 -60 -40 -20 0 20
pre
ssu
re b
ar
temperature C
dewline bubble line critical point
sampleGC
Heat
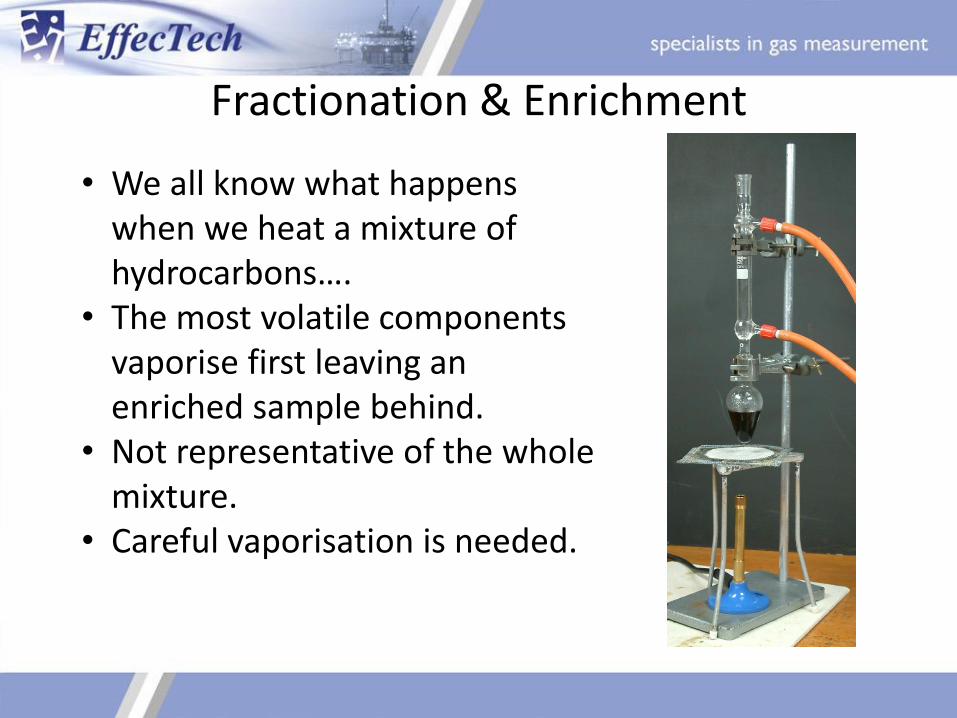
Fractionation & Enrichment
• We all know what happens when we heat a mixture of hydrocarbons….
• The most volatile components vaporise first leaving an enriched sample behind.
• Not representative of the whole mixture.
• Careful vaporisation is needed.
Vaporiser standards
• ISO 8943 describes procedures for both continuous and discontinuous sampling of LNG by vaporising it to make it amenable to GC analysis
• LNG vaporisers are required to achieve a phase transition (liquid to gas) without fractionation of components causing changes in composition
• EN 12838 describes a procedure for suitability testing of LNG sampling systems. It uses a means of supercritical gasification of the LNG to provide a reference sample for comparison
Direct measurement
• Raman spectroscopy is capable of measuring LNG composition directly, using a probe immersed in the liquid
• All analytical methods for natural gas / LNG need to be calibrated or validated. GC methods use certified gas mixtures of appropriate composition in cylinders. This is not practicable for LNGs
• The purpose of this work is to demonstrate that traceable LNG-type mixtures can be prepared and used to validate direct measurement methods
LNG reference liquid production - concept
• Condensation of a highly accurate gas mixture– Primary Reference Gas Mixture (PRGM)
• Liquid nitrogen cooled cryostat– Capable of maintaining steady T & P over defined
range of T & P
– Means of sampling and vaporising the LNG to verify the liquid composition
• Analytical system with necessary precision
• Vacuum system with capability ~ 10-8mbar
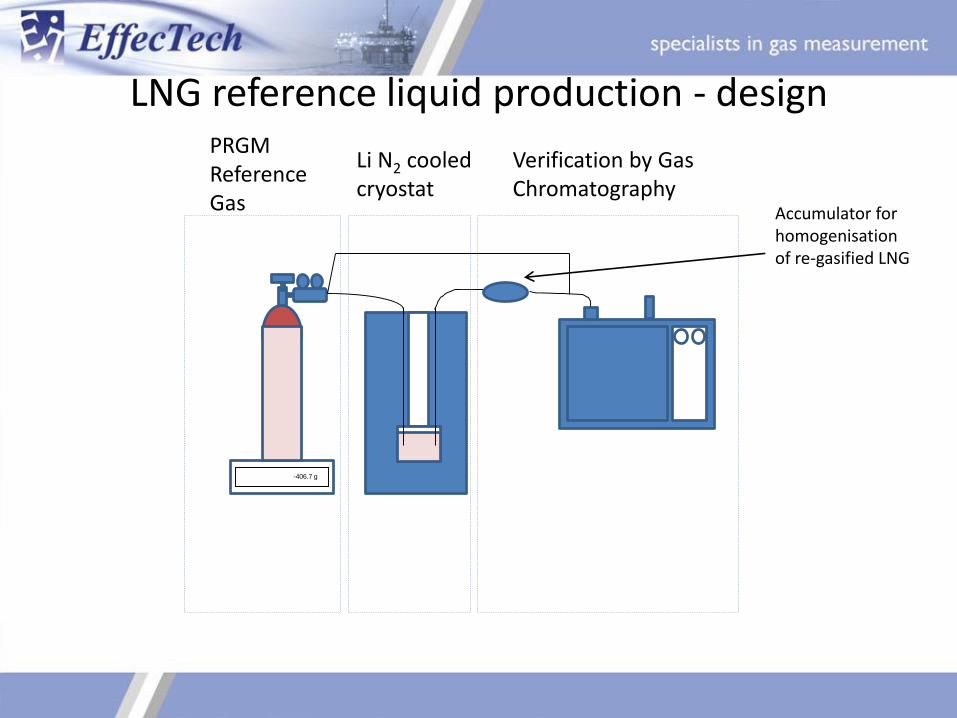
LNG reference liquid production - design
-406.7 g
PRGM ReferenceGas
Li N2 cooled cryostat
Verification by Gas Chromatography
Accumulator for homogenisation of re-gasified LNG
Process
• Place reference gas on balance & connect.
• Evacuate whole system up to cylinder valve.
• Cool cryostat to desired temperature.
• Introduce reference gas at fixed pressure (1 bar).
• Monitor loss of mass from cylinder.
• Once desired mass condensed, homogenise liquid.
• Calibrate chromatograph using same reference gas.
• Sample LNG via vaporiser & accumulator.
• Measure vaporised LNG with chromatograph.
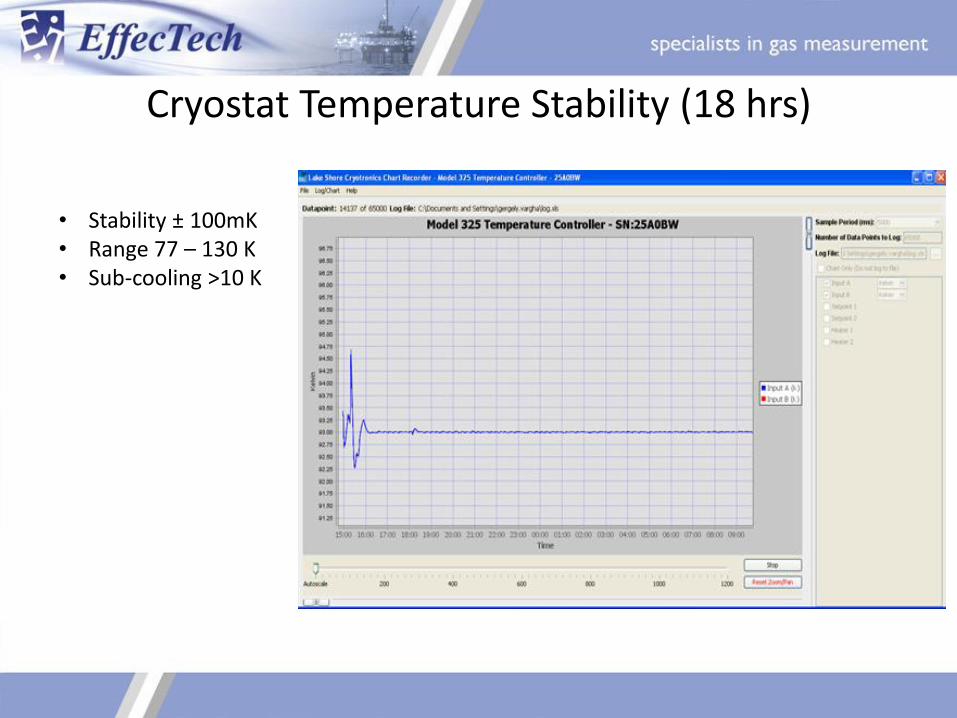
Cryostat Temperature Stability (18 hrs)
• Stability ± 100mK• Range 77 – 130 K• Sub-cooling >10 K
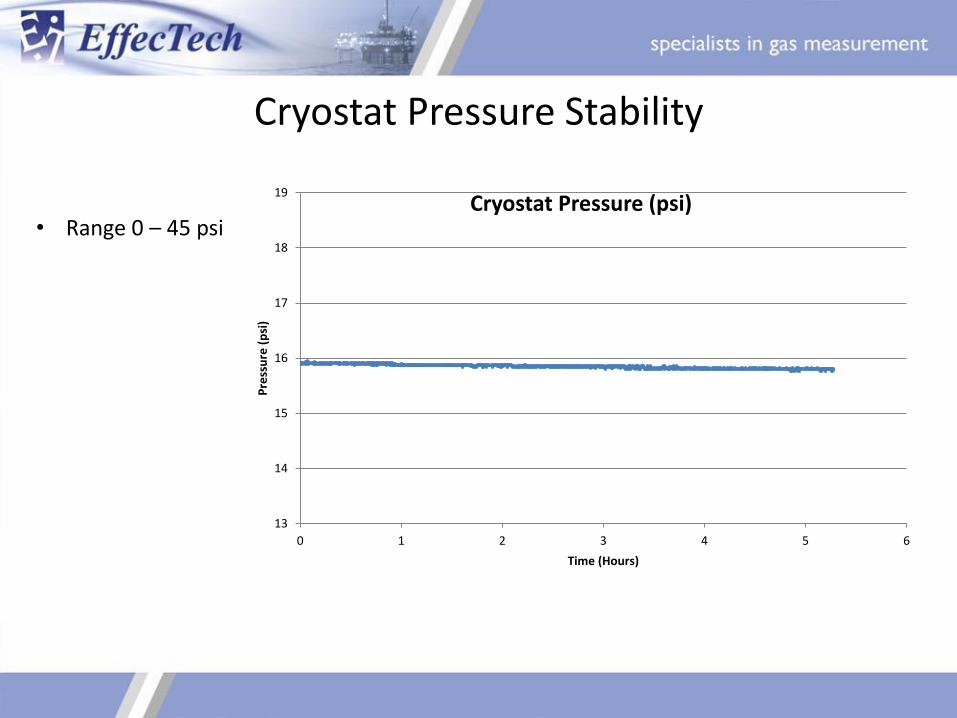
Cryostat Pressure Stability
13
14
15
16
17
18
19
0 1 2 3 4 5 6
Pre
ssu
re (
psi
)
Time (Hours)
Cryostat Pressure (psi)• Range 0 – 45 psi
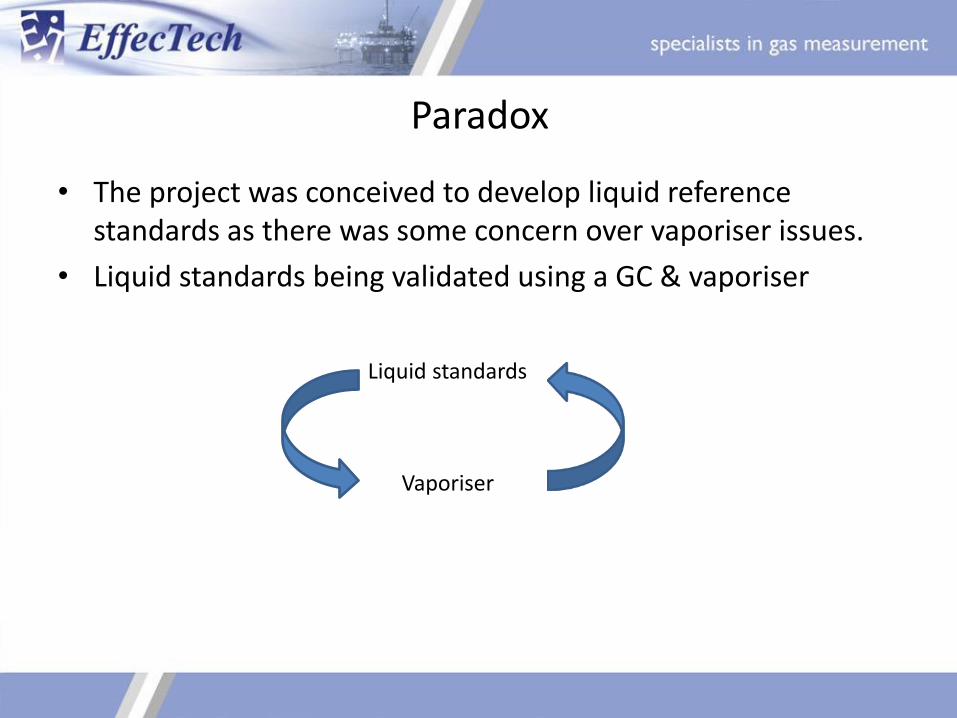
Paradox
• The project was conceived to develop liquid reference standards as there was some concern over vaporiser issues.
• Liquid standards being validated using a GC & vaporiser
Liquid standards
Vaporiser
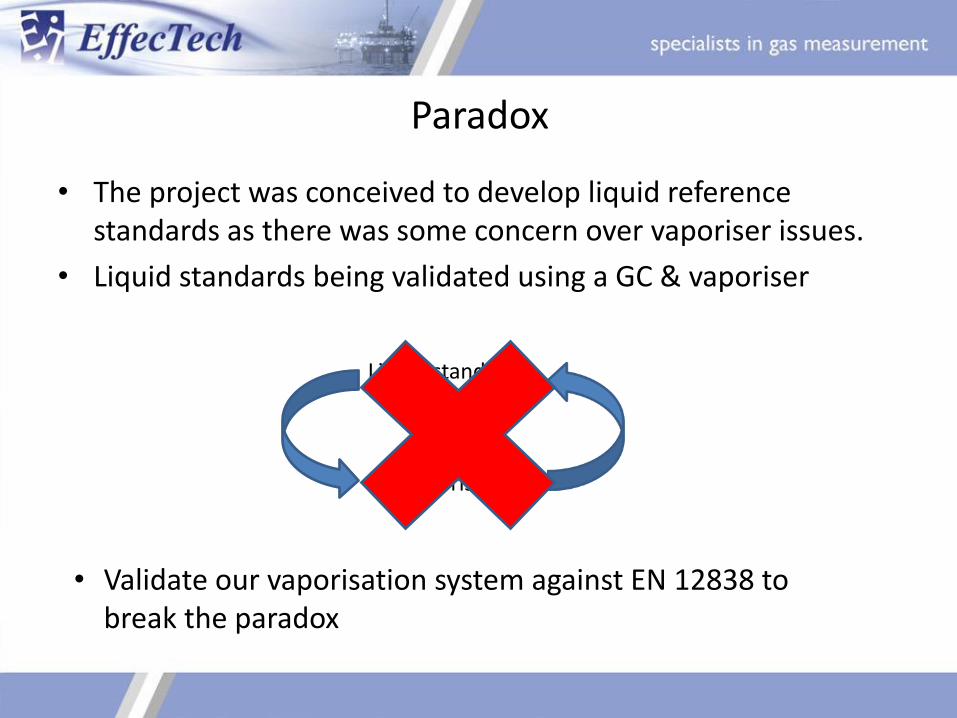
Paradox
• The project was conceived to develop liquid reference standards as there was some concern over vaporiser issues.
• Liquid standards being validated using a GC & vaporiser
Liquid standards
Vaporiser
• Validate our vaporisation system against EN 12838 to break the paradox
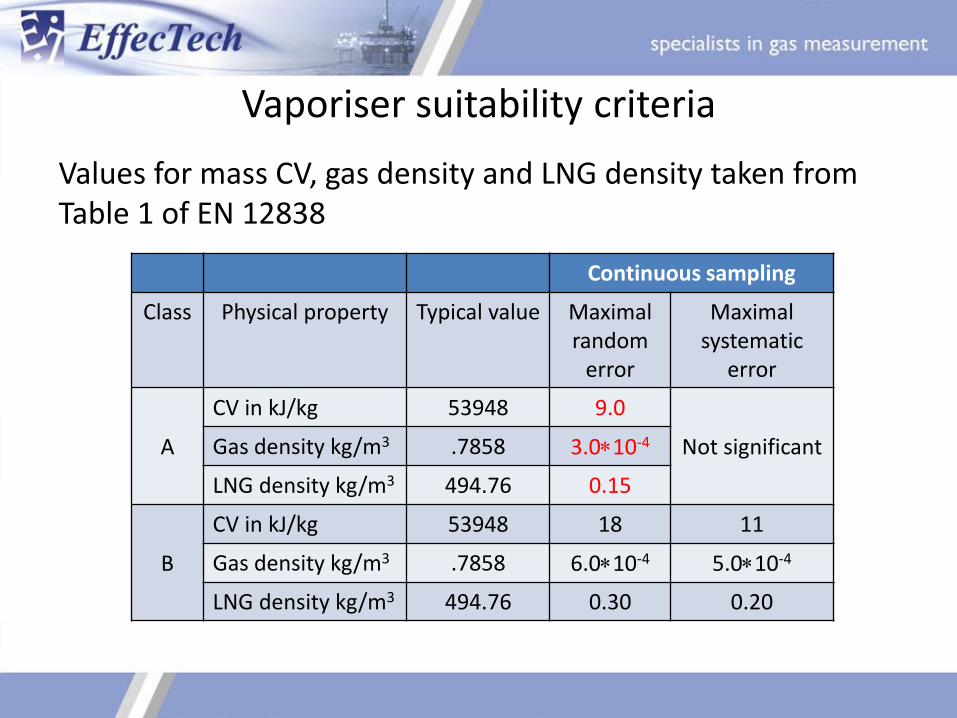
Vaporiser suitability criteria
Continuous sampling
Class Physical property Typical value Maximal random
error
Maximal systematic
error
A
CV in kJ/kg 53948 9.0
Not significantGas density kg/m3 .7858 3.0*10-4
LNG density kg/m3 494.76 0.15
B
CV in kJ/kg 53948 18 11
Gas density kg/m3 .7858 6.0*10-4 5.0*10-4
LNG density kg/m3 494.76 0.30 0.20
Values for mass CV, gas density and LNG density taken from Table 1 of EN 12838
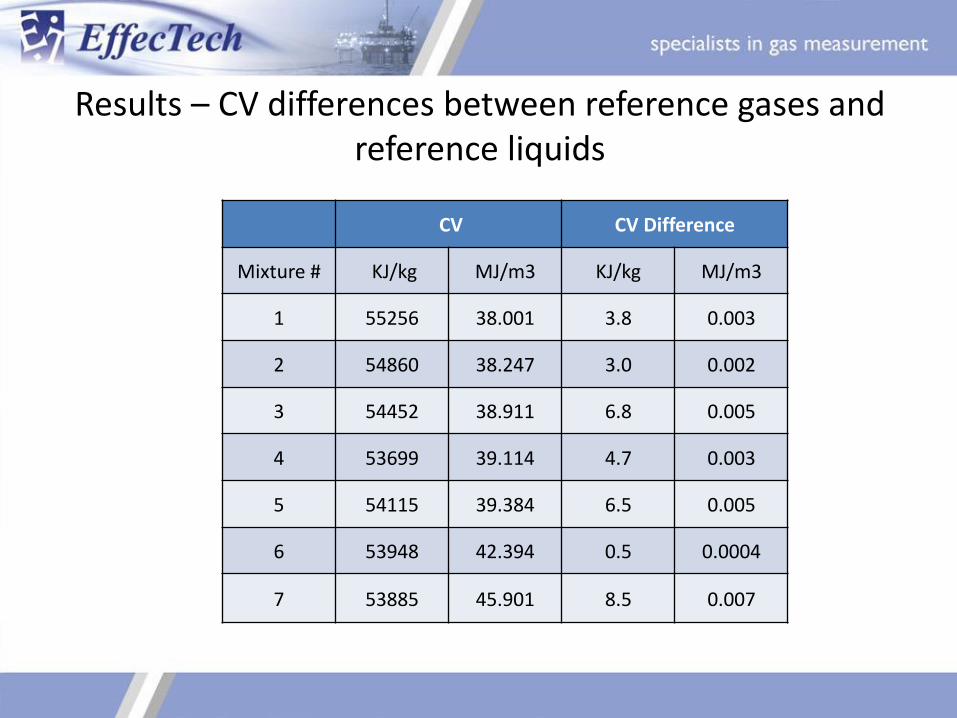
Results – CV differences between reference gases and reference liquids
CV CV Difference
Mixture # KJ/kg MJ/m3 KJ/kg MJ/m3
1 55256 38.001 3.8 0.003
2 54860 38.247 3.0 0.002
3 54452 38.911 6.8 0.005
4 53699 39.114 4.7 0.003
5 54115 39.384 6.5 0.005
6 53948 42.394 0.5 0.0004
7 53885 45.901 8.5 0.007
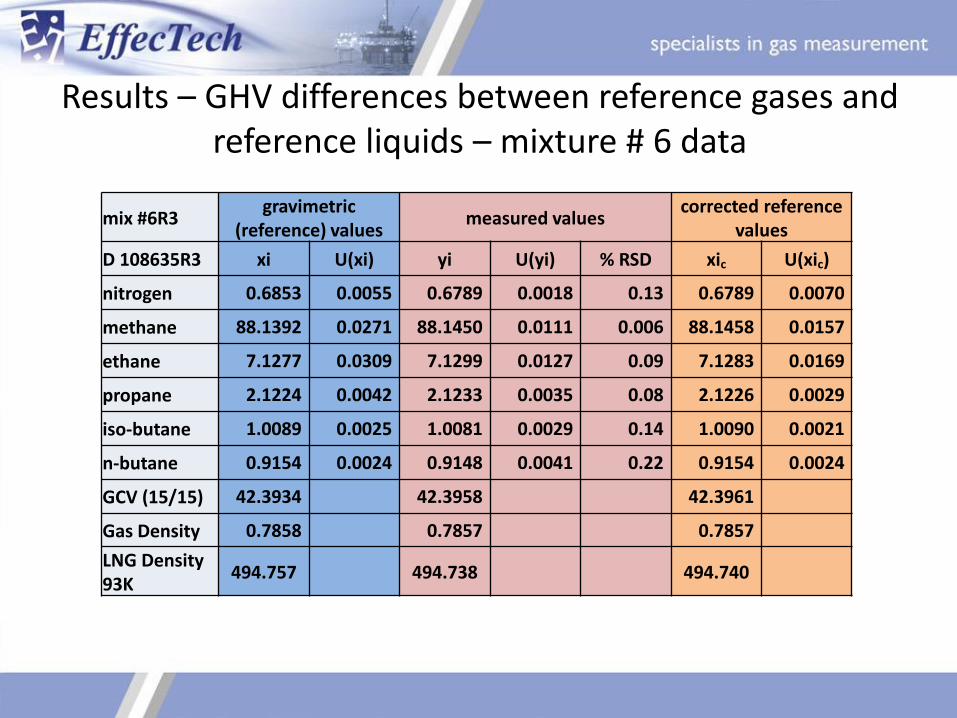
Results – GHV differences between reference gases and reference liquids – mixture # 6 data
mix #6R3gravimetric
(reference) valuesmeasured values
corrected reference values
D 108635R3 xi U(xi) yi U(yi) % RSD xic U(xic)
nitrogen 0.6853 0.0055 0.6789 0.0018 0.13 0.6789 0.0070
methane 88.1392 0.0271 88.1450 0.0111 0.006 88.1458 0.0157
ethane 7.1277 0.0309 7.1299 0.0127 0.09 7.1283 0.0169
propane 2.1224 0.0042 2.1233 0.0035 0.08 2.1226 0.0029
iso-butane 1.0089 0.0025 1.0081 0.0029 0.14 1.0090 0.0021
n-butane 0.9154 0.0024 0.9148 0.0041 0.22 0.9154 0.0024
GCV (15/15) 42.3934 42.3958 42.3961
Gas Density 0.7858 0.7857 0.7857
LNG Density 93K
494.757 494.738 494.740
Nitrogen
• The cryostat temperature of 93K is above the boiling point of nitrogen (77K). It would therefore be expected that nitrogen will favour the gas phase.
• Cryostat was designed to minimise nitrogen loss to headspace.
• The corrected reference values use the measured nitrogen value (as long as En ratio consistent with PRGM value) and the gravimetric hydrocarbon data normalised to 100%
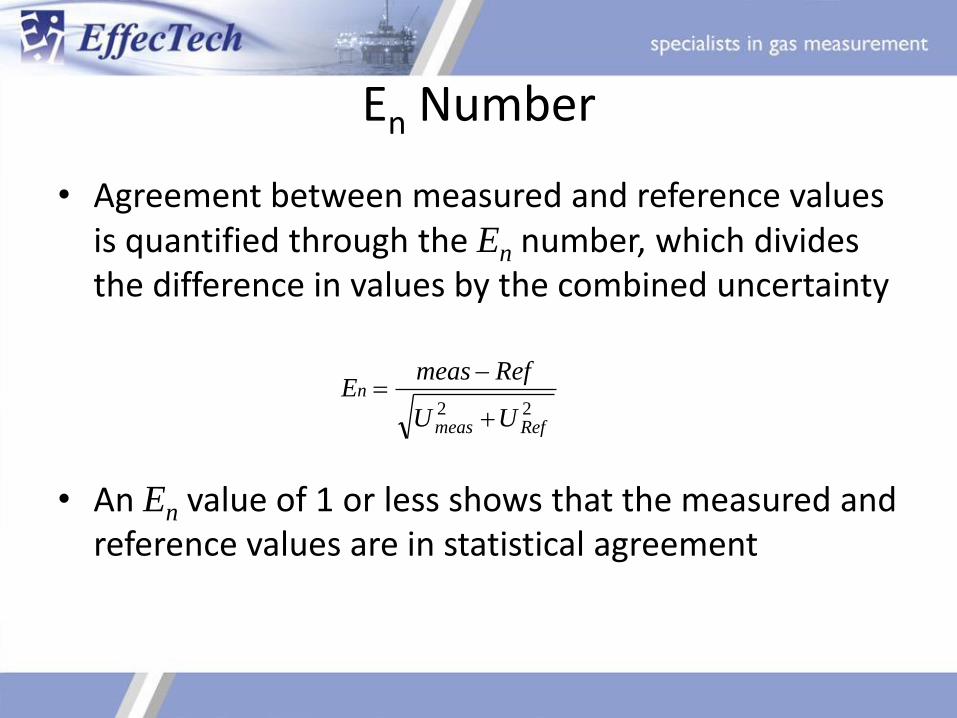
En Number
• Agreement between measured and reference values is quantified through the En number, which divides the difference in values by the combined uncertainty
• An En value of 1 or less shows that the measured and reference values are in statistical agreement
22Refmeas
n
UU
RefmeasE
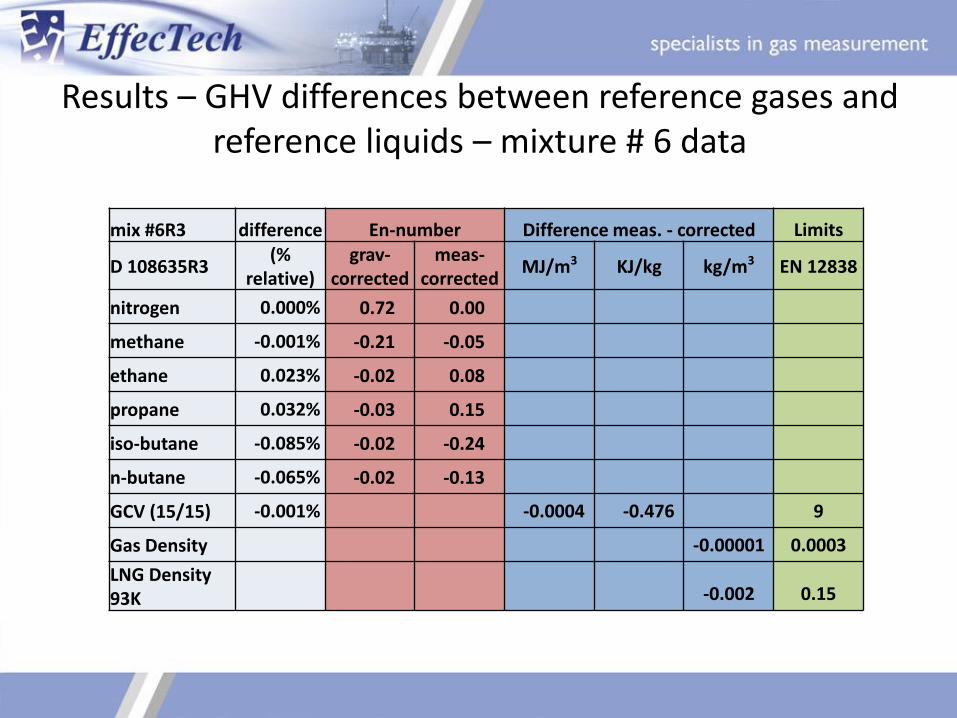
Results – GHV differences between reference gases and reference liquids – mixture # 6 data
mix #6R3 difference En-number Difference meas. - corrected Limits
D 108635R3(%
relative)grav-
correctedmeas-
correctedMJ/m3 KJ/kg kg/m3 EN 12838
nitrogen 0.000% 0.72 0.00
methane -0.001% -0.21 -0.05
ethane 0.023% -0.02 0.08
propane 0.032% -0.03 0.15
iso-butane -0.085% -0.02 -0.24
n-butane -0.065% -0.02 -0.13
GCV (15/15) -0.001% -0.0004 -0.476 9
Gas Density -0.00001 0.0003
LNG Density 93K -0.002 0.15
Conclusions
• Comparing the gravimetric with the corrected composition data gives En numbers throughout of less than 1
• Comparing measured and corrected composition data gives satisfactorily low En values for all components
• Comparison of the calculated properties shows differences which are well within the limit values required by EN 12838
Future Work with Cryostat
– Further validation of Raman spectroscopy
– Studies on the physical properties of LNG
– Transportable cryostat for on-site validation / calibration
– Other research where empirical data is not available
Recommended


![Dnevni avaz [broj 6976 djelimičan, 9.1.2015]](https://img.pdfslide.net/doc/110x75/577cc0c91a28aba711911dce/dnevni-avaz-broj-6976-djelimican-912015.jpg)