Focus on TomorrowReseaRch funded by WoRksafebc
Development of Descent Guidelines for Log-hauling Vehicles (Highway Legal Configurations) January 2010
Principal Investigator/Applicant Séamus Parker
RS2007-IG02

All rights reserved. The Workers’ Compensation Board of B.C. encourages the copying, reproduction, and distribution of this document to promote
health and safety in the workplace, provided that the Workers’ Compensation Board of B.C. is acknowledged. However, no part of this publication may be copied, reproduced, or distributed for profit or other
commercial enterprise or may be incorporated into any other publication without written permission of the Workers’ Compensation Board of B.C.
Additional copies of this publication may be obtained by contacting:
Research Secretariat 6951 Westminster Highway Richmond, B.C. V7C 1C6
Phone (604) 244-6300 / Fax (604) 244-6299 Email: [email protected]
2601 East Mall Vancouver, BC V6T 1Z4
www.feric.ca
Development of descent guidelines for log-hauling vehicles (highway legal configurations)
Final Report WorkSafeBC INNOVATION AT WORK grant RS2007-IG02
Séamus P.S. Parker, P.Eng., R.P.F.
January 13, 2010
© Copyright 2010, FPInnovations, Feric Division
Overview Field testing showed that trailer brakes exhibited the maximum brake temperatures for both the 6-
axle and 7-axle tests of 400 °C and 480 °C respectively. Higher brake temperatures occurred during the 7-axle tests due to the greater payloads carried by the 7-axles (off-highway haul) compared to the 6-axle study.
Field testing showed that gear selection, braking technique, and speed variations throughout the descent can result in large differences in service brake temperatures. On long descents where excessive service brake use can lead to ‘brake fade’, drivers will tend to use their service brakes sparingly and primarily utilize their engine retarder to control descent speed.
A computer model was developed and showed relatively good correlation with the test data. The model predicted similar temperature profiles to those measured during testing with peak average temperatures within 15 °C of the test results. These deviations are relatively low suggesting that the model can be expected to yield fairly accurate results in terms of predicting peak temperature levels.
A sensitivity analysis demonstrated that stopping performance on steep grades is degraded at increased brake temperatures, increased descent speeds, and decreased traction. Stopping performance is further exacerbated when brakes are out of adjustment particularly at high temperatures and descent speeds.
For each traction level a critical grade exists beyond which stopping distances increase exponentially to the point that the configuration will be unable to stop. There is little improvement in stopping distance at moderate or better traction levels (coefficient of friction/traction above 0.45) as the configuration’s braking capacity is fully utilized once this traction level is reached. As the traction surface declines below a coefficient of friction level of 0.30 (low) the maximum grades on which the configuration can safely stop declines rapidly.
The influence of load on configuration stopping performance is traction dependent. On moderate or better surfaces an increase in load will reduce stopping performance, while on poor (low) traction surfaces an increase in load will reduce the tendency of wheel lockup thereby improving stopping performance.
The 6-axle tractor jeep/pole trailer showed superior steep grade stopping performance relative to other configurations under all traction conditions at both legal and off-highway loads. Stopping performance is generally degraded for off-highway loads and consequently the maximum grade that can be safely descended is reduced at increased loads.
Appropriate gear selection combined with engine brake use maximizes the driveline retardation available and reduces service brake demand. As a general rule the optimum gear selection is the lowest gear and the highest engine brake setting combination without inducing wheel lockup.
The following parameters all need to be considered when evaluating the risk of hauling on steep grades: traction level, engine brake capacity, service brake condition and adjustment, service brake temperature, horizontal and vertical road alignment, configuration type, load and distribution, length of haul, grade and descent speed.
Guidelines have been developed to assist road planners in assessing haul risk (report Appendices and/or spreadsheet tool available from FPInnovations Feric division).
1 RS2007-IG02
Executive Summary The descent of steep forest roads has been a long standing safety issue in the mountainous terrain of
British Columbia. Road grades often exceed 20% and in some cases 25%, levels that can seriously
impact hauling safety. Since 2003, FPInnovations Feric division has investigated this issue with the
cooperation of WorkSafeBC, and the forest industry. Initial research focused on the operation of
purpose built off-highway log truck configurations in coastal British Columbia, and guidelines were
developed specifically for these configurations in 2006. These guidelines are not directly applicable to
highway size logging trucks due to differences in load sizes, truck configurations, and retardation
capacity. So in 2007, Feric initiated a study to address the specific descent requirements for highway
truck applications.
Field testing of two instrumented truck configurations operating on steep grades demonstrated that high
service brake temperatures of up to 480 °C could be achieved, which can seriously degrade stopping
performance. This emphasizes the importance of controlling service brake temperatures so that
adequate stopping performance is maintained in the event of an emergency. Comparison of similar
descents showed that gear selection, braking technique, and speed variations throughout the descent
can result in large differences in service brake temperatures throughout the descent. On long descents,
drivers will tend to use their service brakes sparingly and primarily utilize their engine retarder to
control descent speed through appropriate gear selection.
A computer model was developed and showed relatively good correlation with the test data. The
computer model was run at the test parameters for a number of the study descents. The model predicted
similar temperature profiles to those measured during testing, predicting peak average temperatures
within 15 °C of the test results. These deviations are relatively low suggesting that the model can be
expected to yield fairly accurate results in terms of predicting maximum temperature levels. However,
2 RS2007-IG02
at highway speeds, the model was less capable of predicting brake temperature fluctuations possibly a
result of increased heat transfer complexity under these conditions and additional variable factors not
accounted for in the model.
A sensitivity analysis was conducted using the computer model which demonstrated that stopping
performance on steep grades is severely degraded at high service brake temperatures, high descent
speeds, and at reduced traction levels. Stopping performance is further exacerbated when brakes are out
of adjustment particularly at high temperatures and descent speeds. For each traction level a critical
grade exists beyond which stopping distances increase exponentially to the point that the configuration
will runaway and be unable to stop. For a 6-axle tractor/jeep/pole trailer at a descent speed of 20 km/h
and initial brake temperature of 250 °C, this maximum grade is approximately 26% for moderate
traction (coefficient of friction/traction 0.45) or better surfaces. At a lower descent speed of 10 km/h,
the critical grade level may be extended to 27% and 28% for moderate and high (coefficient of
friction/traction 0.60) traction surfaces respectively. As the traction surface declines below a level of
0.30 (low) the maximum grades on which the configuration can safely stop declines rapidly.
Gear selection is also a very important parameter influencing the safe descent on steep grades.
Appropriate gear selection combined with engine brake use maximizes the driveline retardation
available and reduces service brake demand. Gear selection is also influenced by traction level, as the
tendency for wheel lockup increases at reduced traction levels at low gears. As a general rule the
optimum gear selection is the lowest gear and the highest engine brake setting combination without
inducing wheel lockup. At the reduced levels of engine retardation that are often necessary at reduced
traction levels, service brakes must be used to a greater extent to control descent speed potentially
overheating the brakes and consequently further degrading stopping performance.
3 RS2007-IG02

The safe descent of steep grades with a loaded logging truck is a challenging task, requiring
considerable driver expertise and knowledge. The risk associated with descending steep grades may be
alleviated through diligent road design, haul planning and the development of safe operating
procedures (SOPs). The following parameters all need to be considered when evaluating the risk of
hauling on steep grades: traction level, engine brake capacity, service brake condition and adjustment,
service brake temperature, horizontal and vertical road alignment, configuration type, load and
distribution, length of haul, critical grade and descent speed. Guidelines have been developed to assist
road planners in assessing haul risk (report Appendices and/or spreadsheet tool available from
FPInnovations Feric division).
4 RS2007-IG02
Project Report
Project problem and context The descent of steep forest roads has been a long standing safety issue in the mountainous terrain of
British Columbia. Previous research on steep grade descents has been limited to highway applications
where the maximum grades are limited to 12%, and the design and location of runaway lanes (Yee,
1996). Forest road grades often exceed 20% and in some cases 25%, levels which are significantly
steeper than highway grades which can seriously impact hauling safety. In 2003, FPInnovations Feric1
division initiated research to investigate this issue with the cooperation of WorkSafeBC, and the forest
industry. This initial research focused on the operation of log truck configurations specifically designed
for off-highway hauling with gross combination weights of up to 160 tonnes (Parker, 2007). Safe
descent of steep forest roads depends on the careful management of many factors, including braking
capacity, brake adjustment, brake thermal characteristics, road surface traction, descent speed, hauling
configuration, payload, grade, grade length, and horizontal road alignment. As a result of the study,
guidelines were developed which specify maximum load, speed and traction level required for the safe
descent of steep grades.
In September 2005, WorkSafeBC issued an official guideline (G 26.2-2) (WorkSafeBC 2005). This
guideline separated the hauling requirements into two categories: grades less than 18%, and grades
greater than 18%. This separation was based on the assumption that reasonably maintained equipment
is designed for grades up to 18%, which is the maximum allowable grade specified in the Ministry of
Forests Engineering Guidebook (BC Ministry of Forests 2002). On grades above 18%, a risk
1 FPInnovations was formed in 2008, an amalgamation of three forest industry research institutes: Paprican, Forintek and FERIC (Forest Engineering Institute of Canada). The Feric division was formerly FERIC.
5 RS2007-IG02
assessment must be conducted prior to hauling on these grades and a safe descent procedure with
specific conditions for haul suspension must be developed. The guidelines developed in the Feric off-
highway study may be used where warranted (i.e. coastal off-highway trucks) in the risk assessment.
In 2006, the BC Forest Safety Council in cooperation with industry stakeholders developed a specific
safe operating procedure (SOP) for descending steep forest roads for the coastal off-highway
application based on the Feric off-highway study. These guidelines are not directly applicable to
highway size logging trucks due to differences in load sizes, truck configurations, and retardation
capacity. So in 2007, Feric initiated a study to address the specific descent requirements for highway
“legal” truck applications. While these trucks are designed to meet the dimensional and loading
constraints of the public road infrastructure, they are commonly utilized in off-highway applications
where the axle loads are often increased above the legal allowances. Highway “legal” truck payload
capacity is considerably less than the coastal off-highway truck applications previously evaluated, even
when hauling off-highway loads. In addition braking capacity of the service brakes and engine
retarders also differ between these truck types, making specific descent guidelines for highway “legal”
configurations necessary. The proposed guidelines will establish the criteria required to safely descend
these steep roads (e.g. maximum speed, maximum load, minimum traction level), thereby improving
the safety for drivers of these vehicles. The project was divided into the following four phases:
1. Measurement of typical retardation requirements and operating conditions
2. Computer model development and validation
3. Identification of critical operating parameters
4. Descent guideline development
6 RS2007-IG02
Methodology
1. Measurement of typical retardation requirements and operating conditions Feric installed instrumentation to measure retardation levels for two highway “legal” truck
configurations. The first trial was conducted in the summer of 2007 at Western Forest Products Woss
operations (south of Port McNeill, BC on Vancouver Island) on a 7-axle tridem tractor/ tridem pole
trailer (Figure 1). This haul was an exclusively off-highway operation with a GCW of approximately
63 tonnes (8 tonnes above legal loads). The second trial was conducted the following summer (2008) at
Island Timberlands Northwest Bay operations (Parksville, BC) on a 6-axle tractor/ jeep/ pole trailer
(Figure 2). A large proportion of this haul was conducted on the highway and was limited to legal loads
of approximately 48 tonnes GCW. The installed instrumentation measured the following parameters:
Vehicle speed
Distance travelled
Engine RPM
Service brake air application pressure
Engine brake use
Road grade
Vehicle accelerations (lateral, vertical, and longitudinal)
Individual brake drum temperatures
7 RS2007-IG02
8 RS2007-IG02
Figure 1. 7-axle test truck – Woss
Figure 2. 6-axle test truck – Northwest Bay Data were for a total of 46 descents (25 descents for 7-axle, 21 descents for 6-axle). A Feric researcher
was present to observe descent conditions, and periodically measure brake adjustment and calibrate the
instrumentation. Gross loads were measured using electronic scales prior to unloading.
9 RS2007-IG02
The following information was summarized for each descent:
Number of brake applications
Average and maximum brake application pressure (psi)
Average and maximum brake engine speed (RPM)
Average and maximum speed (km/h)
Maximum brake temperatures by axle group (°C)
Length of descent (km)
Maximum and average road grade (%)
Stopping distance tests were also conducted with the engine brake disengaged for the loaded 7-axle
configuration to evaluate the service brake stopping capacity. These tests were conducted on level
grade from a speed of 50 km/h. The severity of the brake application (pressure variation during
application) was left to the driver’s discretion so that the truck could come to a controlled stop.
2. Computer model development and validation The computer model developed for the previous off-highway study (Parker, 2007) was modified for
highway truck configurations. This model incorporates the main variables influencing retardation on
steep grades including configuration dynamics, individual brake mechanical and heat transfer
properties (including fade due to drum expansion), drive train and tire properties, traction conditions
and road horizontal and vertical alignment. Separate models were developed for the following three
log-hauling configurations:
Tandem tractor/tandem pole trailer (5-axle)
Tandem tractor/jeep/ tandem pole trailer (6-axle)
Tridem tractor/ tridem pole trailer (7-axle)
Model validation was accomplished by running the model for selected steep grade descents and
comparing the resulting service brake temperatures between the field-test data and model predictions.
The model runs of each descent were conducted using the same gear selections, and speed as measured
10 RS2007-IG02
during the tests. Road traction levels and rolling resistance were estimated and assumed constant over
selected road segments. The model speed controller achieved the target speed levels (as measured in
tests) by applying the service brakes, engine brake and throttle accordingly.
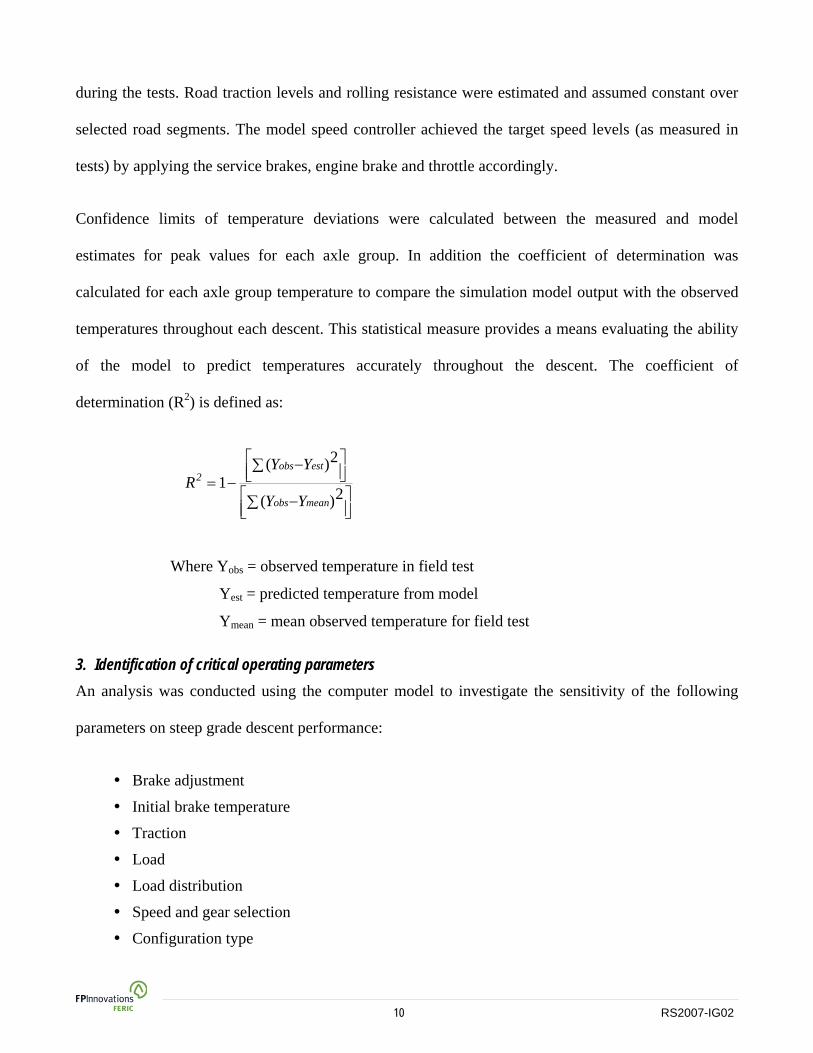
Confidence limits of temperature deviations were calculated between the measured and model
estimates for peak values for each axle group. In addition the coefficient of determination was
calculated for each axle group temperature to compare the simulation model output with the observed
temperatures throughout each descent. This statistical measure provides a means evaluating the ability
of the model to predict temperatures accurately throughout the descent. The coefficient of
determination (RP
2P) is defined as:
⎥⎦⎤
⎢⎣⎡∑ −
⎥⎦⎤
⎢⎣⎡∑ −
−=2)(
2)(1
meanobs
estobs2
YY
YYR
Where YBobs B = observed temperature in field test
YBest B = predicted temperature from model
YBmean B = mean observed temperature for field test
3. Identification of critical operating parameters An analysis was conducted using the computer model to investigate the sensitivity of the following
parameters on steep grade descent performance:
Brake adjustment
Initial brake temperature
Traction
Load
Load distribution
Speed and gear selection
Configuration type
11 RS2007-IG02
Curve radius
The performance measure primarily used in this analysis was stopping capability (stopping distance)
using only the service brakes. The sensitivity of each parameter was evaluated by maintaining all
parameters at the same level and varying the parameter of interest. For example to determine the
sensitivity of load, all parameters (e.g. initial brake temperature, speed, brake adjustment level,
traction) were kept the same while varying the load and computing the stopping distances.
Gear selection influences retardation levels and service brake demand which in turn affects brake
temperature and consequently the stopping capability of these configurations. Therefore it would be
useful to better understand the impact of gear selection on potential brake performance when
descending steep grades. The sensitivity of gear selection was accomplished by determining average
brake temperatures following a 3 km descent on grades ranging between 10 and 28% for a combination
of different gear selections, speeds and traction conditions.
4. Descent guideline development Descent guidelines were developed through the application of the computer model for 5, 6, and 7-axle
configurations under the following traction conditions:
Very low (ice/snow coefficient of traction = 0.20)
Low (or poor) (loose gravel/wet hardpan coefficient of traction = 0.30)
Moderate (compact gravel coefficient of traction = 0.45)
High (smooth dry compact gravel coefficient of traction = 0.60)
For each of these operating conditions, the maximum payload and descent speed were determined for a
range of descent scenarios under which the specific configuration can be safely operated. In this
analysis for safe operation, the configuration was required to stop within 50 m following a driveline
12 RS2007-IG02
failure (i.e. service brakes only)TP
F
2FPT. These descent scenarios are characterized by the following
parameters which are included in the tables:
Grade (%) of pitch where driveline failure occurs
Length (m) of pitch
Distance (km) prior to pitch
Average grade (%) of descent prior to pitch
The following assumptions were made in the development of these guidelines:
On the steer axle 15” x 4” drum brakes, 5 ½” slack adjusters, and typeTPF
3FPT 20 air chamber are
used. All other axles utilize 16 ½” x 7” drum brakes, 5 ½” slack adjusters, and type 30 air
chambers.
All brakes adjustment levels are at the adjustment limit (i.e. 1 ¾” and 2” for types 20 and 30
chambers respectively). Brake lining friction coefficient varies between 0.30 and 0.40.
The driveline retarder is engaged to maximize engine retardation at an engine speed of
between 1400 and 1800 RPM during the descent. The retarder and transmission are
disengaged during the emergency stop.
There is a rolling resistance of 1.5%. This means that for each 100 kN vertical load, there is a
horizontal resisting force of 1.5 kN acting at the tire toad interface.
Loads are placed on the log bunks to achieve target legal axle loads on level ground and are
maintained at the same load distribution at higher and lower payloads. The load length and
width are 15 m and 2.4 m respectively. The block load densityTPF
4FPT is 450 kg/mP
3P.
TP
2PT 50 m maximum stopping distance based on maximum speed of 30 km/h, 1.5 second reaction time and a minimum
deceleration of 0.1 g. This low deceleration is to allow for the increased acceleration that needs to be overcome on steep grades.
TP
3PT The type number of an air chamber identifies the piston cross-sectional area in square inches. A Type 20 air chamber with
a 20 psi application provides 400 lbs force to the slack adjuster.
TP
4PT Block load density is the load mass (kg) divided by the block volume of the load including air voids (mP
3P). Air voids
typically make up 40% of this volume. Therefore block load density is not equivalent to log density.
13 RS2007-IG02
The initial brake temperature at the start of the descent is 40 °C for the drive and steer axles,
and 20 °C for the trailerTPF
5FPT axles. The ambient temperature is also 20 °C.
There is a delay time of 1.5 seconds for the service brakes to be engaged during an emergency
stop. This delay includes the reaction time of the driver (1 sec) and the actuation time
(pressure buildup) of the braking system (0.5 sec). During this time the grade will cause the
truck/trailer to accelerate to a higher speed before the brakes are applied.
Project Findings
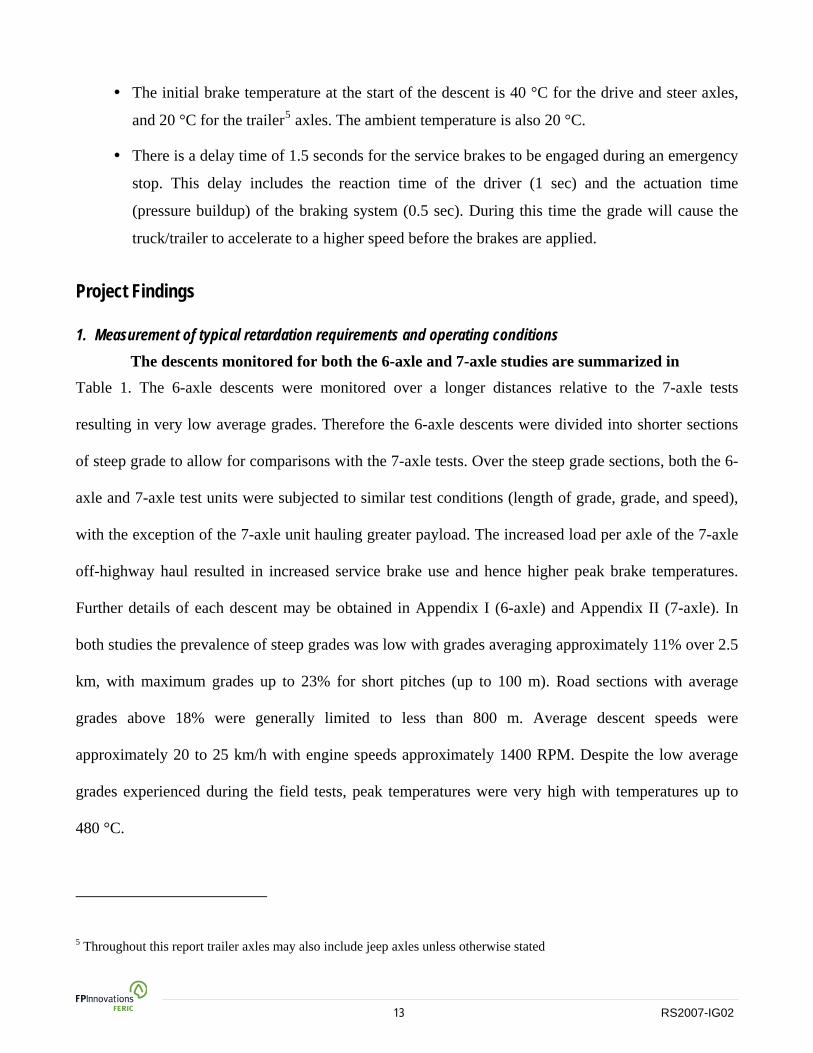
1. Measurement of typical retardation requirements and operating conditions The descents monitored for both the 6-axle and 7-axle studies are summarized in X
XTable 1X. The 6-axle descents were monitored over a longer distances relative to the 7-axle tests
resulting in very low average grades. Therefore the 6-axle descents were divided into shorter sections
of steep grade to allow for comparisons with the 7-axle tests. Over the steep grade sections, both the 6-
axle and 7-axle test units were subjected to similar test conditions (length of grade, grade, and speed),
with the exception of the 7-axle unit hauling greater payload. The increased load per axle of the 7-axle
off-highway haul resulted in increased service brake use and hence higher peak brake temperatures.
Further details of each descent may be obtained in Appendix I (6-axle) and Appendix II (7-axle). In
both studies the prevalence of steep grades was low with grades averaging approximately 11% over 2.5
km, with maximum grades up to 23% for short pitches (up to 100 m). Road sections with average
grades above 18% were generally limited to less than 800 m. Average descent speeds were
approximately 20 to 25 km/h with engine speeds approximately 1400 RPM. Despite the low average
grades experienced during the field tests, peak temperatures were very high with temperatures up to
480 °C.
TP
5PT Throughout this report trailer axles may also include jeep axles unless otherwise stated
14 RS2007-IG02
Table 1. Descent summary
Parameter 6-axle
all
6-axle
Steep sections
7-axle
Number of Descents GCW (tonnes) Distance (km) Average grade (%) Maximum grade (%) Average Engine RPM Maximum Engine RPM Average Speed (km/h) Maximum Speed (km/h) Average number of brake applications Average application pressure (psi) Peak brake temperature (°C)
21 43.7 20.0 2.3 23
1427 2017 43.3
110.7
31 14 400
15 42.8 2.3
10.5 23
1425 1906 24.4 46.1
26 15 400
25 63.2 2.5
11.4 23
1358 2077 19.3 49
52 15 480
It would have been desirable to have tested these truck configurations under longer and steeper road
grades. However, forest road grades are generally limited to less than 18% where possible and
extended distances (greater than 1 km) on steep grades are rare. It would be useful to further validate
this work in the future by locating steeper roads and conducting further tests.
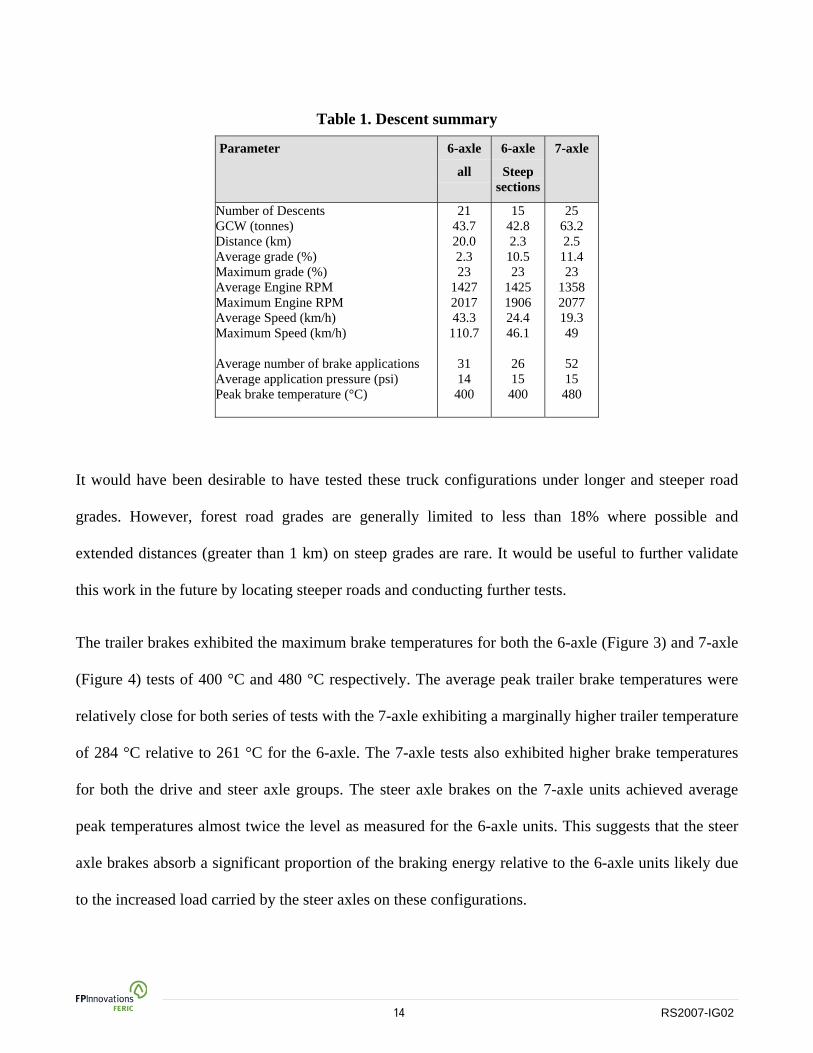
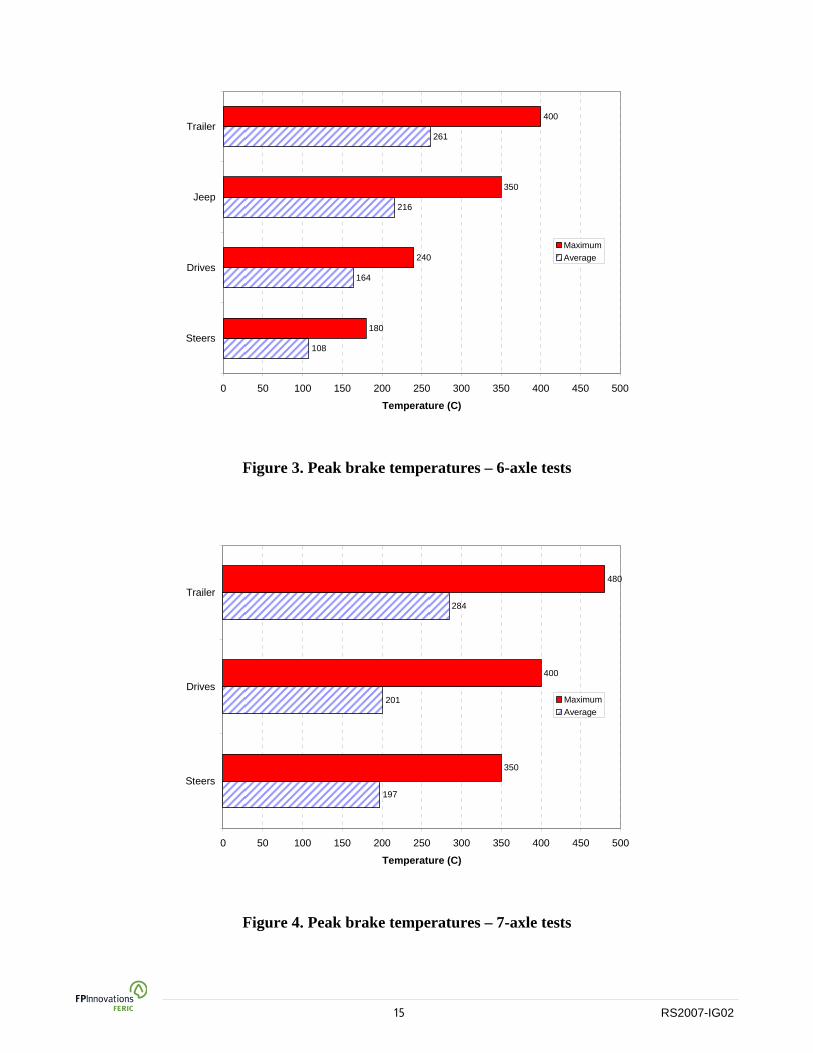
The trailer brakes exhibited the maximum brake temperatures for both the 6-axle ( XFigure 3X) and 7-axle
( XFigure 4X) tests of 400 °C and 480 °C respectively. The average peak trailer brake temperatures were
relatively close for both series of tests with the 7-axle exhibiting a marginally higher trailer temperature
of 284 °C relative to 261 °C for the 6-axle. The 7-axle tests also exhibited higher brake temperatures
for both the drive and steer axle groups. The steer axle brakes on the 7-axle units achieved average
peak temperatures almost twice the level as measured for the 6-axle units. This suggests that the steer
axle brakes absorb a significant proportion of the braking energy relative to the 6-axle units likely due
to the increased load carried by the steer axles on these configurations.
15 RS2007-IG02
108
164
216
261
180
240
350
400
0 50 100 150 200 250 300 350 400 450 500
Steers
Drives
Jeep
Trailer
Temperature (C)
MaximumAverage
Figure 3. Peak brake temperatures – 6-axle tests
197
201
284
350
400
480
0 50 100 150 200 250 300 350 400 450 500
Steers
Drives
Trailer
Temperature (C)
MaximumAverage
Figure 4. Peak brake temperatures – 7-axle tests
16 RS2007-IG02
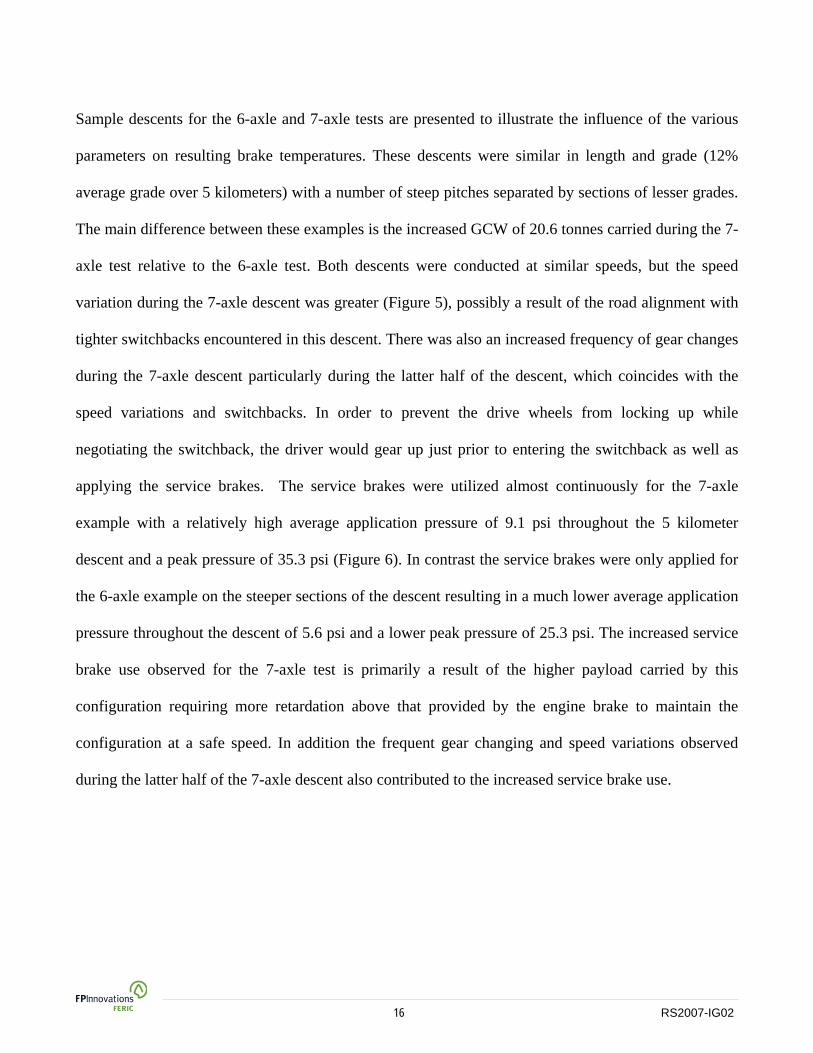
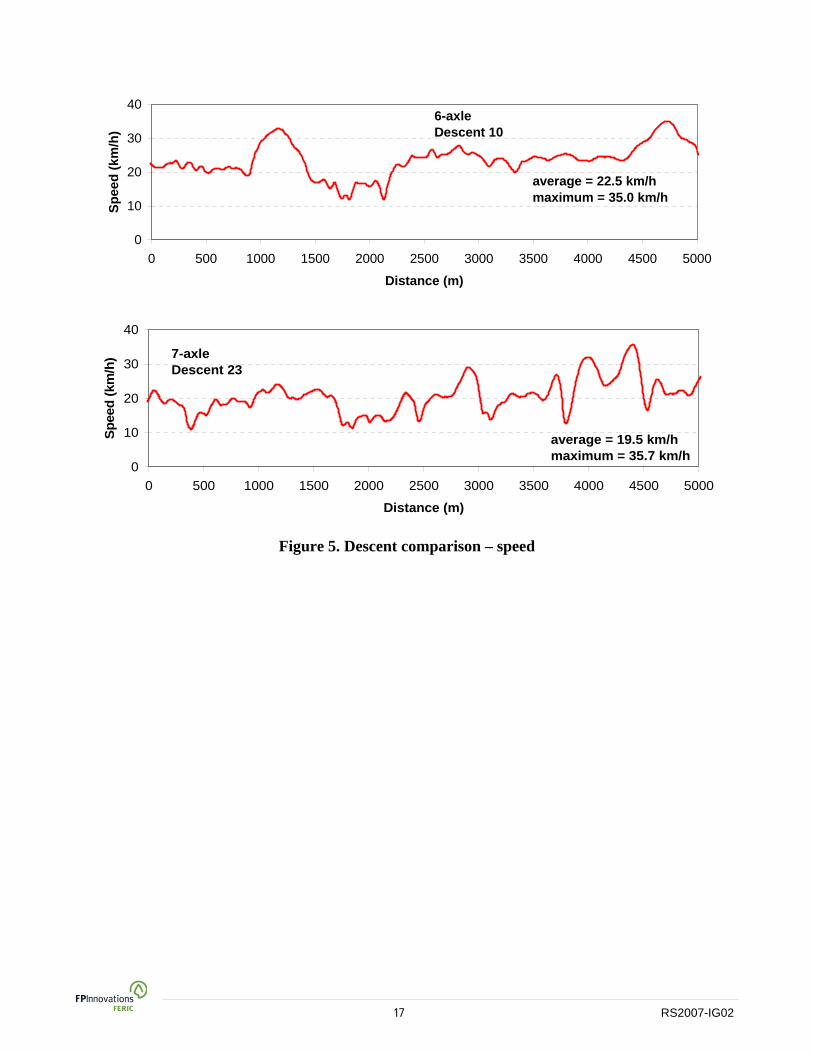
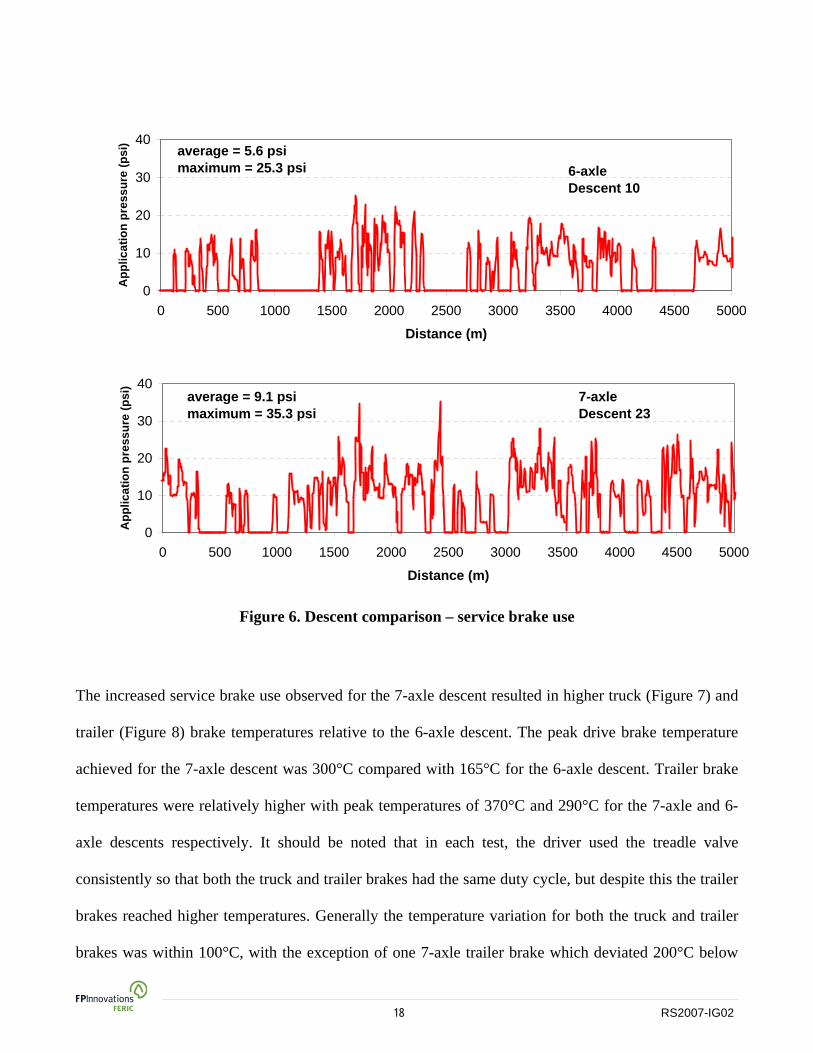
Sample descents for the 6-axle and 7-axle tests are presented to illustrate the influence of the various
parameters on resulting brake temperatures. These descents were similar in length and grade (12%
average grade over 5 kilometers) with a number of steep pitches separated by sections of lesser grades.
The main difference between these examples is the increased GCW of 20.6 tonnes carried during the 7-
axle test relative to the 6-axle test. Both descents were conducted at similar speeds, but the speed
variation during the 7-axle descent was greater (XTFigure 5TX), possibly a result of the road alignment with
tighter switchbacks encountered in this descent. There was also an increased frequency of gear changes
during the 7-axle descent particularly during the latter half of the descent, which coincides with the
speed variations and switchbacks. In order to prevent the drive wheels from locking up while
negotiating the switchback, the driver would gear up just prior to entering the switchback as well as
applying the service brakes. The service brakes were utilized almost continuously for the 7-axle
example with a relatively high average application pressure of 9.1 psi throughout the 5 kilometer
descent and a peak pressure of 35.3 psi (XFigure 6X). In contrast the service brakes were only applied for
the 6-axle example on the steeper sections of the descent resulting in a much lower average application
pressure throughout the descent of 5.6 psi and a lower peak pressure of 25.3 psi. The increased service
brake use observed for the 7-axle test is primarily a result of the higher payload carried by this
configuration requiring more retardation above that provided by the engine brake to maintain the
configuration at a safe speed. In addition the frequent gear changing and speed variations observed
during the latter half of the 7-axle descent also contributed to the increased service brake use.
17 RS2007-IG02
T
0
10
20
30
40
0 500 1000 1500 2000 2500 3000 3500 4000 4500 5000
Distance (m)
Spee
d (k
m/h
)6-axleDescent 10
average = 22.5 km/hmaximum = 35.0 km/h
0
10
20
30
40
0 500 1000 1500 2000 2500 3000 3500 4000 4500 5000
Distance (m)
Spee
d (k
m/h
) 7-axleDescent 23
average = 19.5 km/hmaximum = 35.7 km/h
Figure 5. Descent comparison – speed
18 RS2007-IG02
0
10
20
30
40
0 500 1000 1500 2000 2500 3000 3500 4000 4500 5000
Distance (m)
App
licat
ion
pres
sure
(psi
)
6-axleDescent 10
average = 5.6 psimaximum = 25.3 psi
0
10
20
30
40
0 500 1000 1500 2000 2500 3000 3500 4000 4500 5000
Distance (m)
App
licat
ion
pres
sure
(psi
)
7-axleDescent 23
average = 9.1 psimaximum = 35.3 psi
Figure 6. Descent comparison – service brake use
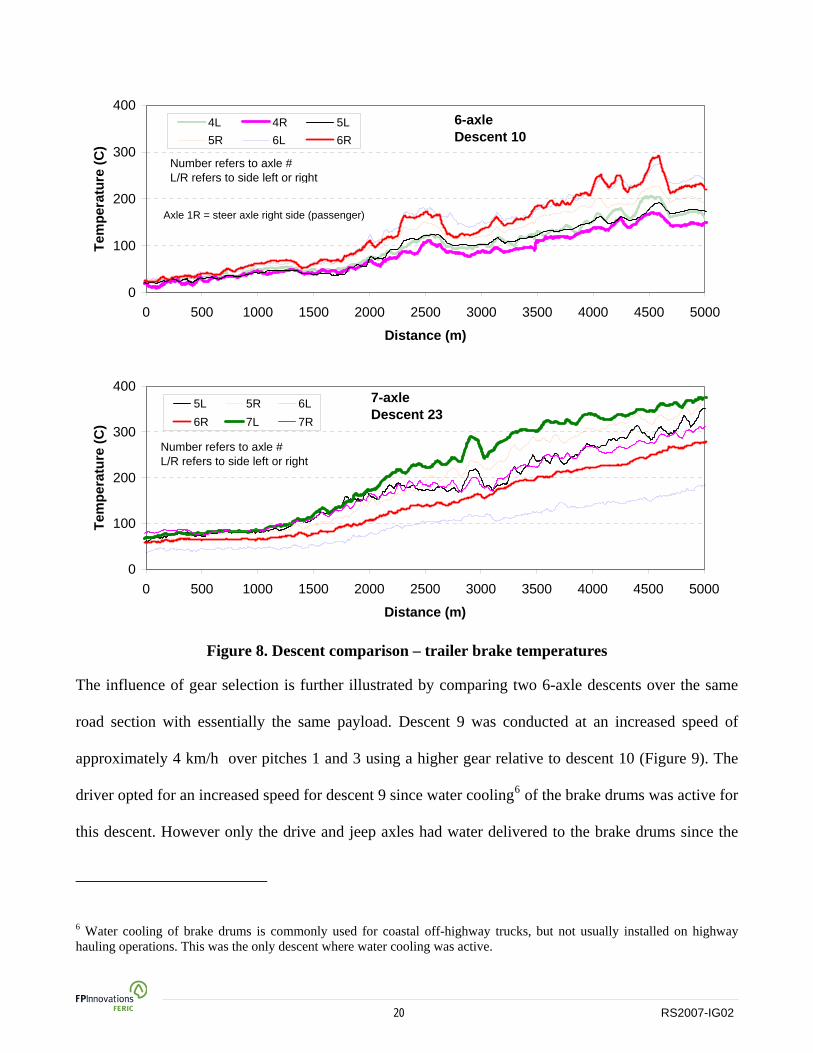
The increased service brake use observed for the 7-axle descent resulted in higher truck (XFigure 7X) and
trailer (XFigure 8X) brake temperatures relative to the 6-axle descent. The peak drive brake temperature
achieved for the 7-axle descent was 300°C compared with 165°C for the 6-axle descent. Trailer brake
temperatures were relatively higher with peak temperatures of 370°C and 290°C for the 7-axle and 6-
axle descents respectively. It should be noted that in each test, the driver used the treadle valve
consistently so that both the truck and trailer brakes had the same duty cycle, but despite this the trailer
brakes reached higher temperatures. Generally the temperature variation for both the truck and trailer
brakes was within 100°C, with the exception of one 7-axle trailer brake which deviated 200°C below
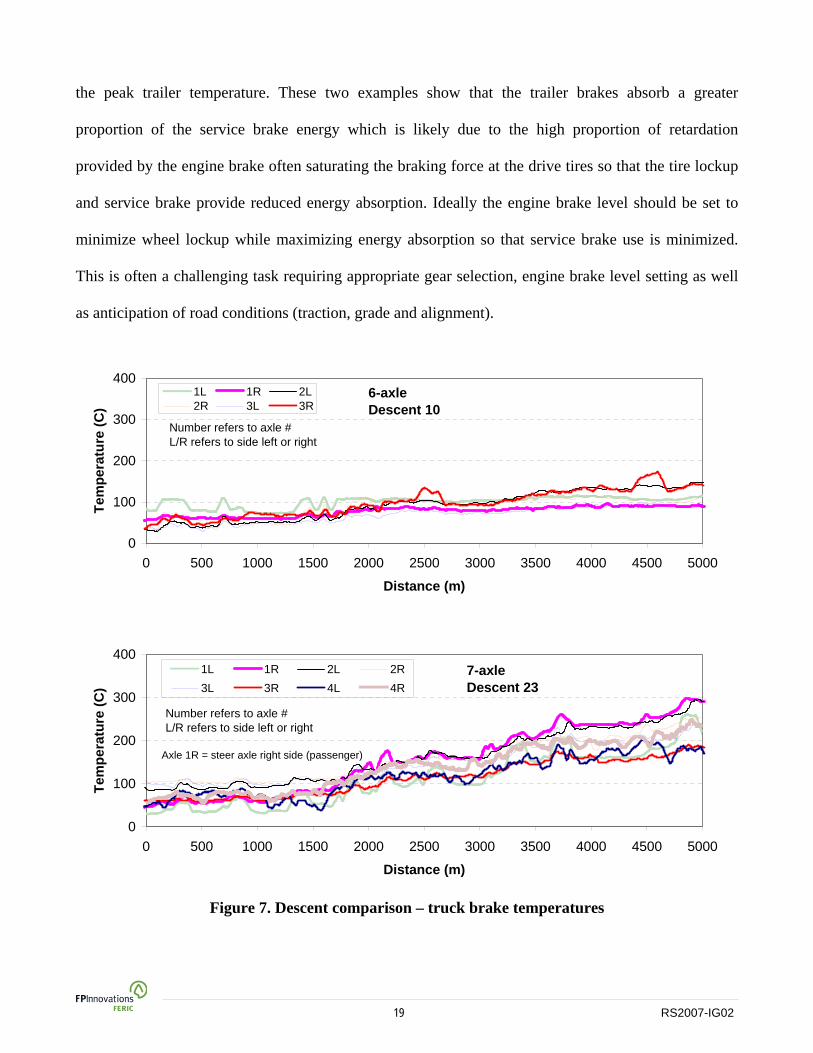
19 RS2007-IG02
the peak trailer temperature. These two examples show that the trailer brakes absorb a greater
proportion of the service brake energy which is likely due to the high proportion of retardation
provided by the engine brake often saturating the braking force at the drive tires so that the tire lockup
and service brake provide reduced energy absorption. Ideally the engine brake level should be set to
minimize wheel lockup while maximizing energy absorption so that service brake use is minimized.
This is often a challenging task requiring appropriate gear selection, engine brake level setting as well
as anticipation of road conditions (traction, grade and alignment).
0
100
200
300
400
0 500 1000 1500 2000 2500 3000 3500 4000 4500 5000
Distance (m)
Tem
pera
ture
(C)
1L 1R 2L2R 3L 3R
Number refers to axle # L/R refers to side left or right
6-axleDescent 10
0
100
200
300
400
0 500 1000 1500 2000 2500 3000 3500 4000 4500 5000
Distance (m)
Tem
pera
ture
(C)
1L 1R 2L 2R3L 3R 4L 4R
Number refers to axle # L/R refers to side left or right
7-axleDescent 23
Figure 7. Descent comparison – truck brake temperatures
Axle 1R = steer axle right side (passenger)
20 RS2007-IG02
0
100
200
300
400
0 500 1000 1500 2000 2500 3000 3500 4000 4500 5000
Distance (m)
Tem
pera
ture
(C)
4L 4R 5L5R 6L 6R
Number refers to axle # L/R refers to side left or right
6-axleDescent 10
0
100
200
300
400
0 500 1000 1500 2000 2500 3000 3500 4000 4500 5000
Distance (m)
Tem
pera
ture
(C)
5L 5R 6L6R 7L 7R
Number refers to axle # L/R refers to side left or right
7-axleDescent 23
Figure 8. Descent comparison – trailer brake temperatures
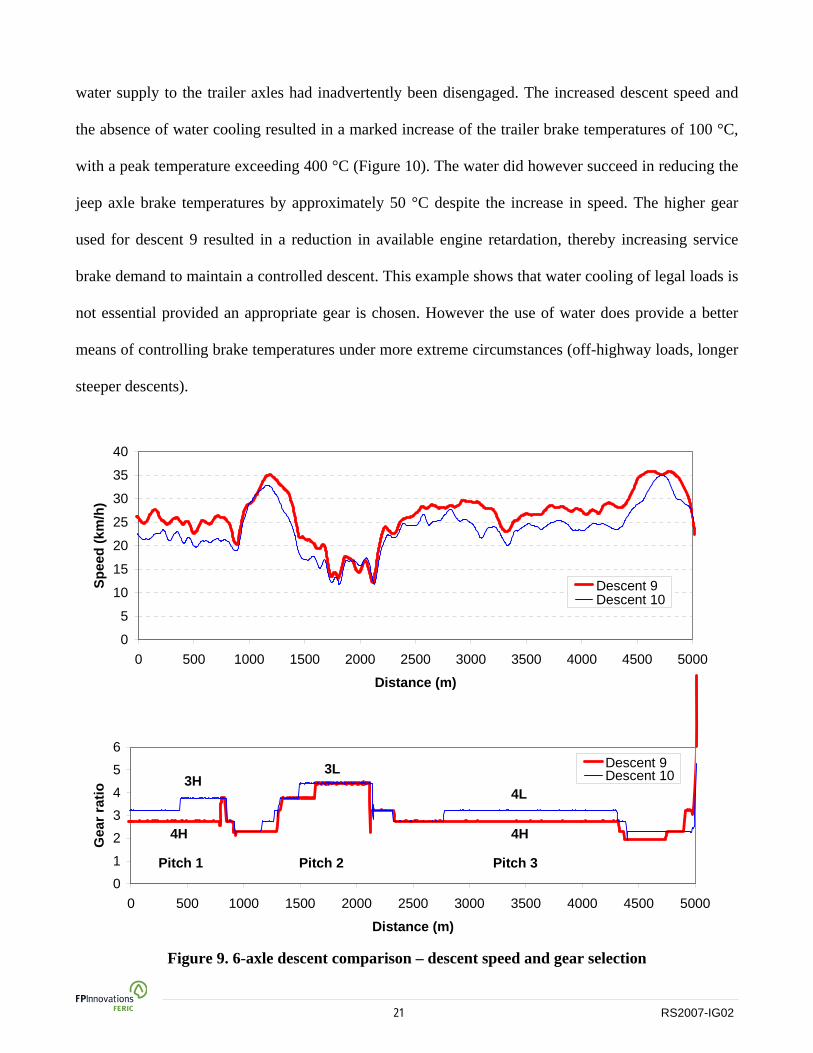
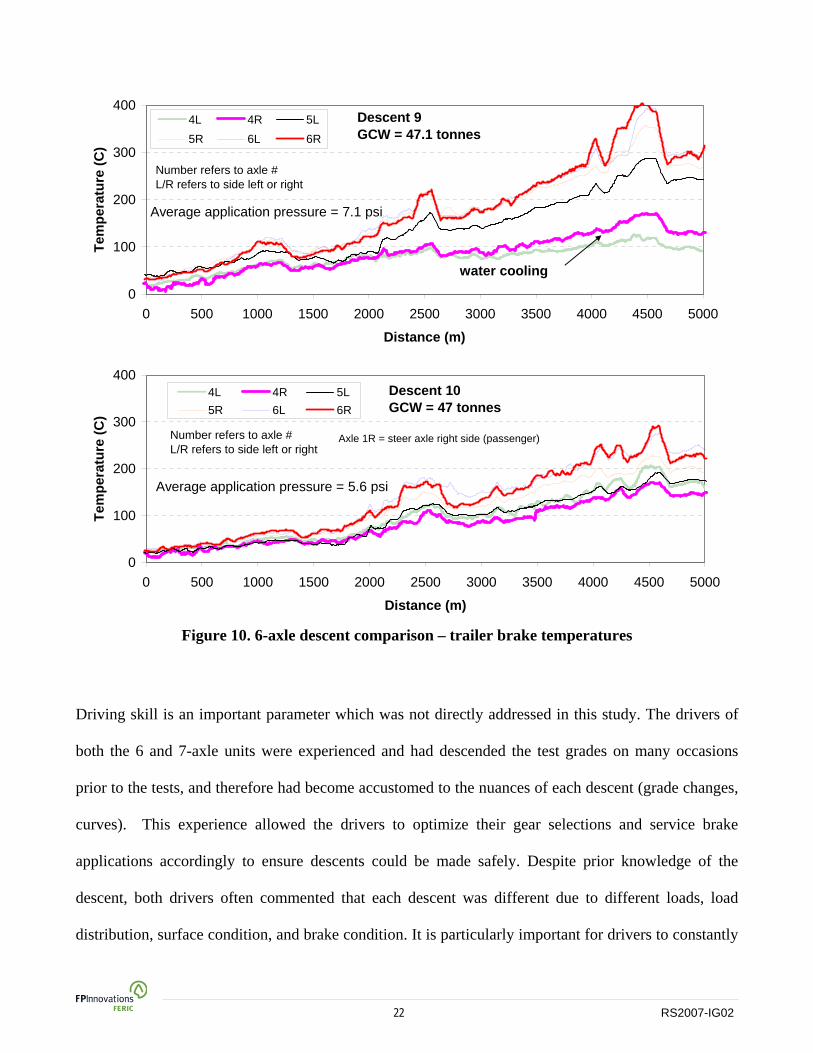
The influence of gear selection is further illustrated by comparing two 6-axle descents over the same
road section with essentially the same payload. Descent 9 was conducted at an increased speed of
approximately 4 km/h over pitches 1 and 3 using a higher gear relative to descent 10 (XFigure 9X). The
driver opted for an increased speed for descent 9 since water coolingTPF
6FPT of the brake drums was active for
this descent. However only the drive and jeep axles had water delivered to the brake drums since the
TP
6PT Water cooling of brake drums is commonly used for coastal off-highway trucks, but not usually installed on highway
hauling operations. This was the only descent where water cooling was active.
Axle 1R = steer axle right side (passenger)
21 RS2007-IG02
water supply to the trailer axles had inadvertently been disengaged. The increased descent speed and
the absence of water cooling resulted in a marked increase of the trailer brake temperatures of 100 °C,
with a peak temperature exceeding 400 °C (XFigure 10X). The water did however succeed in reducing the
jeep axle brake temperatures by approximately 50 °C despite the increase in speed. The higher gear
used for descent 9 resulted in a reduction in available engine retardation, thereby increasing service
brake demand to maintain a controlled descent. This example shows that water cooling of legal loads is
not essential provided an appropriate gear is chosen. However the use of water does provide a better
means of controlling brake temperatures under more extreme circumstances (off-highway loads, longer
steeper descents).
0
5
10
15
20
25
30
35
40
0 500 1000 1500 2000 2500 3000 3500 4000 4500 5000
Distance (m)
Spee
d (k
m/h
)
Descent 9Descent 10
0
1
2
3
4
5
6
0 500 1000 1500 2000 2500 3000 3500 4000 4500 5000
Distance (m)
Gea
r rat
io
Descent 9Descent 103H
Pitch 1 Pitch 2 Pitch 3
4H
3L
4H
4L
Figure 9. 6-axle descent comparison – descent speed and gear selection
22 RS2007-IG02
0
100
200
300
400
0 500 1000 1500 2000 2500 3000 3500 4000 4500 5000
Distance (m)
Tem
pera
ture
(C)
4L 4R 5L5R 6L 6R
Descent 9GCW = 47.1 tonnes
water cooling
Number refers to axle # L/R refers to side left or right
Average application pressure = 7.1 psi
0
100
200
300
400
0 500 1000 1500 2000 2500 3000 3500 4000 4500 5000
Distance (m)
Tem
pera
ture
(C)
4L 4R 5L5R 6L 6R
Descent 10GCW = 47 tonnes
Number refers to axle # L/R refers to side left or right
Average application pressure = 5.6 psi
Figure 10. 6-axle descent comparison – trailer brake temperatures
Driving skill is an important parameter which was not directly addressed in this study. The drivers of
both the 6 and 7-axle units were experienced and had descended the test grades on many occasions
prior to the tests, and therefore had become accustomed to the nuances of each descent (grade changes,
curves). This experience allowed the drivers to optimize their gear selections and service brake
applications accordingly to ensure descents could be made safely. Despite prior knowledge of the
descent, both drivers often commented that each descent was different due to different loads, load
distribution, surface condition, and brake condition. It is particularly important for drivers to constantly
Axle 1R = steer axle right side (passenger)
23 RS2007-IG02
monitor the condition of the brakes and ensure that the service brakes are adjusted correctly. It is
equally important to select the right gear for the descent conditions, so that the service brakes are not
overused and a relatively steady speed is maintained. Experienced drivers have the necessary skills to
meet the challenges of descending steep grades, but need to remain vigilant to changing conditions.
Less experienced drivers should be mentored by the experienced drivers prior to operating on grades in
excess of 18%.
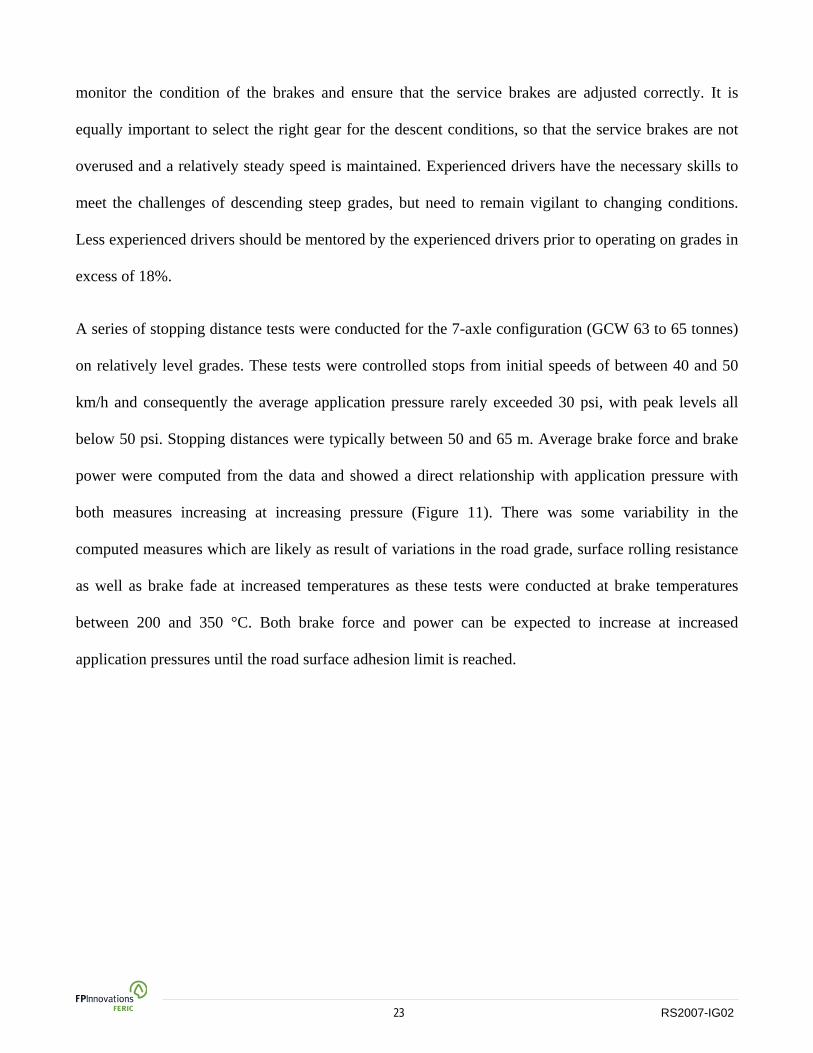
A series of stopping distance tests were conducted for the 7-axle configuration (GCW 63 to 65 tonnes)
on relatively level grades. These tests were controlled stops from initial speeds of between 40 and 50
km/h and consequently the average application pressure rarely exceeded 30 psi, with peak levels all
below 50 psi. Stopping distances were typically between 50 and 65 m. Average brake force and brake
power were computed from the data and showed a direct relationship with application pressure with
both measures increasing at increasing pressure (XFigure 11X). There was some variability in the
computed measures which are likely as result of variations in the road grade, surface rolling resistance
as well as brake fade at increased temperatures as these tests were conducted at brake temperatures
between 200 and 350 °C. Both brake force and power can be expected to increase at increased
application pressures until the road surface adhesion limit is reached.
24 RS2007-IG02
y = 3.901x - 0.4626R2 = 0.8019
80
100
120
140
160
20 25 30 35 40
Application pressure (psi)
Ave
rage
bra
ke fo
rce
(kN
)
y = 32.76x - 202.46R2 = 0.7453
400
600
800
1000
1200
20 25 30 35 40
Application pressure (psi)
Ave
rage
bra
ke P
ower
(kW
)
Figure 11. Service brake stopping force and power – 7-axle
2. Computer model development and validation A total of 16 descents were compared using the 6 and 7-axle models and both models correlated very
closely with the field-test results (Parker 2010). On average, both the 6-axle and 7-axle models
estimated peak average temperatures within 15 °C of the test results (XFigure 12X). The highest variation
in peak temperatures occurred for the trailer group of the 6-axle with the temperature deviation (95%
confidence limits) ranging from -27 (model underestimate) to +28 °C (model overestimate). Generally
25 RS2007-IG02
there was a slight tendency for the 6-axle model to underestimate peak jeep temperatures, while the 7-
axle model tended to underestimate steer axle peak temperatures. Despite this, the temperature
deviations are relatively low and the model can be expected to yield accurate results in terms of peak
temperature levels.
28
0
22
9
12
-5
-15
-24
-27
-13
-50 -40 -30 -20 -10 0 10 20 30 40 50
Steers
Drives
Jeep
Trailer
Average
Axl
e gr
oup
Temperature Deviation (C)
Model OverestimateModel Underestimate
6-axle 95% confidence limits
-1
10
8
5
-23
-7
-20
-13
-50 -40 -30 -20 -10 0 10 20 30 40 50
Steers
Drives
Trailer
Average
Axl
e gr
oup
Temperature Deviation (C)
Model OverestimateModel Underestimate
7-axle 95% confidence limits
Figure 12. Model temperature deviations – peak temperatures
The comparison of the model predictions with the field-test data may be best illustrated by reviewing a
sample descent. The sample descent illustrated is for the off-highway portion of a 6-axle configuration
(descent 10). In this descent the simulation steer and drive axle brake temperatures followed the field-
test results reasonably closely but the jeep and trailer axle temperatures deviated to greater extent
( XFigure 13X). The simulation estimated higher jeep axle temperatures during the steep grade section
26 RS2007-IG02
(5000 to 10 000 m), while the trailer temperatures were estimated to be lower relative to the field-test
data by approximately 40 °C for most of the descent. This discrepancy may be due to differences in
lining friction or load distribution between these two axle groups. There was also less temperature
variation shown by the model for all axle groups likely due to the many variations in brake condition,
and road conditions (traction level and rolling resistance) that were not accounted for in the simulation.
The simulation followed the actual descent speeds relatively closely resulting in a similar service brake
duty cycle as observed during the test (XFigure 14X). However the simulation application brake pressures
tended to be slightly increased and of a longer duration indicating that either the service brake
performance or engine brake performance used in the model deviated below the actual performance.
Differences in application pressures between the model and test data result from the inability of the
model speed controller to exactly match each individual driver’s driving and braking strategy. However
overall the model and field-test data comparisons illustrate that the model predicts brake temperatures
and required service brake duty cycle on steep grades reasonably well.
27 RS2007-IG02
0
100
200
300
0 5000 10000 15000 20000 25000 30000
Distance (m)
Ave
rage
Tem
pera
ture
(Deg
C)
Simlulation
Test
Steer axle
0
100
200
300
0 5000 10000 15000 20000 25000 30000
Distance (m)
Ave
rage
Tem
pera
ture
(Deg
C)
Simlulation
Test
Drive axles
0
100
200
300
0 5000 10000 15000 20000 25000 30000
Distance (m)
Ave
rage
Tem
pera
ture
(Deg
C)
Simlulation
Test
Jeep axle
0
100
200
300
0 5000 10000 15000 20000 25000 30000
Distance (m)
Ave
rage
Tem
pera
ture
(Deg
C)
Simlulation
Test
Trailer axles
Figure 13. Simulation and test data temperature comparison – 6axle

28 RS2007-IG02
0
10
20
30
40
50
60
0 5000 10000 15000 20000 25000 30000
Distance (m)
Spee
d (k
m/h
)
SimulationTest
0
10
20
30
40
50
0 5000 10000 15000 20000 25000 30000
Distance (m)
App
licat
ion
Pres
sure
(psi
)
SimulationTest
Figure 14. Simulation and test data speed/pressure comparison – 6axle
The model predictions of brake temperature for each axle group were statistically correlated with the
field test data for 16 descents by calculating the coefficient of determination (XTable 2X). Generally the
model predicted jeep and trailer axle brake temperatures very close to the field test data as shown by
high RP
2P values. The predictions of steer axle and drive axle temperatures showed a weaker correlation
particularly for the 6-axle descents. The relatively poor correlation of the steer axle for some descents
is believed to be primarily a result of erratic temperature sensors at this location. In addition there may
be other factors that were not sufficiently accounted for in the model brakes such as variable air
pressure, dragging brakes, varying heat transfer properties particularly at the steer axle as well as
variations in rolling resistance and traction level. The correlation for descent #7 (6-axle) was relatively
29 RS2007-IG02
poor, where the majority of the haul was on-highway at speeds above 50 km/h. In this descent, the
model predicted brake temperatures were generally 20 °C higher than the observed temperatures and
the model did not predict the large variations observed during the test. This consistent temperature
offset resulted in poor correlation under these conditions possibly a result of more complicated heat
transfer at highway speeds, suggesting that further model refinement is required at highway speeds.
Table 2. Descent temperature correlation-coefficient of determination
Coefficient of determinationP
1P (RP
2P) Descent#
Steer axle Drive axles
Jeep axle Trailer axles
6-axle 1a 2 3 5c 7 8 9
10 7-axle
1 7 9
13 16 19 21 23
0.786 -0.632 0.731 -0.237
-11.039 -1.089 0.499 0.461
0.858 0.833 -0.925 -1.692 0.389 0.334 0.942 0.896
0.682 0.177 0.694 0.497 -0.380 0.085 0.563 0.745
0.794 0.872 0.181 0.793 0.964 0.415 0.944 0.974
0.917 0.907 0.774 0.917 -0.210 0.845 0.566 0.904
NA NA NA NA NA NA NA NA
0.945 0.716 0.519 0.659 0.418 0.850 0.903 0.890
0.769 0.939 0.675 0.778 0.949 0.742 0.970 0.958
3. Identification of critical operating parameters The safe descent of steep grades with a loaded logging truck is a challenging task, requiring
considerable driver expertise and knowledge. The risk associated with descending steep grades may be
alleviated through diligent road design, haul planning and the development of safe operating
procedures (SOPs). A sensitivity analysis was conducted of the many parameters using the computer
model and identified the following parameters which are critical for steep grade descents:
30 RS2007-IG02
Traction level Service brake condition and adjustment Service brake temperature Engine brake capacity Horizontal alignment (curves) Vertical alignment (road grade) Load and distribution Configuration type Speed
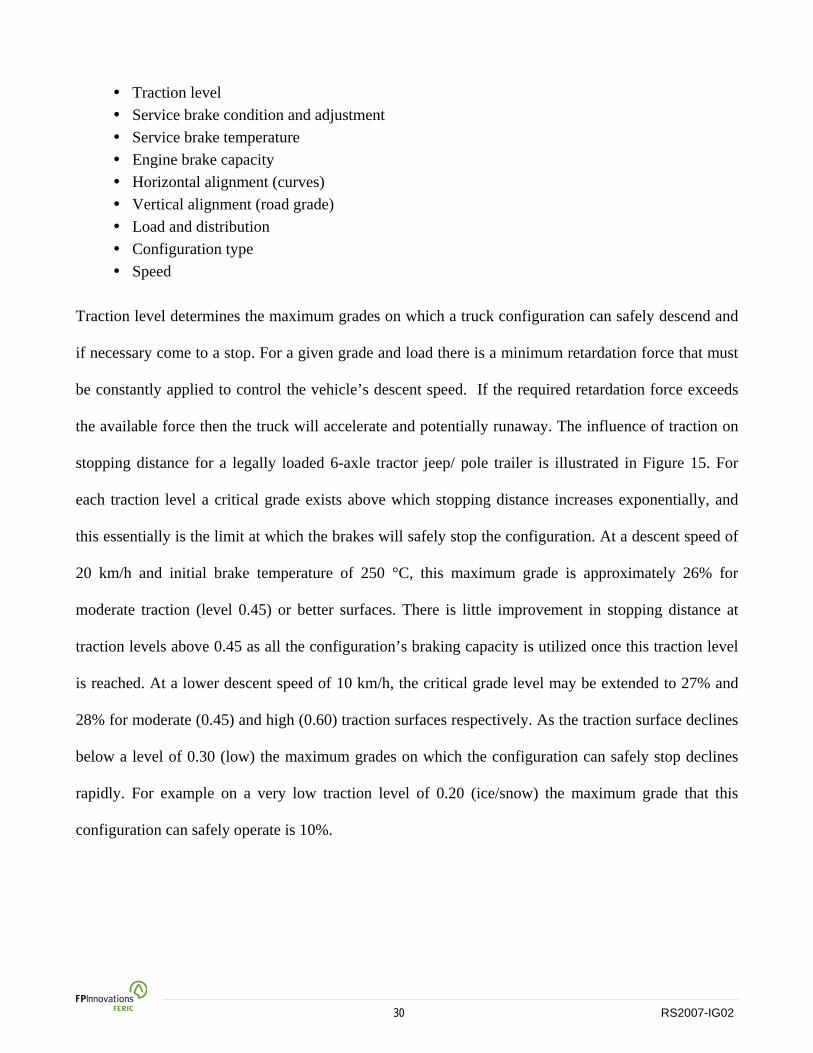
Traction level determines the maximum grades on which a truck configuration can safely descend and
if necessary come to a stop. For a given grade and load there is a minimum retardation force that must
be constantly applied to control the vehicle’s descent speed. If the required retardation force exceeds
the available force then the truck will accelerate and potentially runaway. The influence of traction on
stopping distance for a legally loaded 6-axle tractor jeep/ pole trailer is illustrated in XFigure 15X. For
each traction level a critical grade exists above which stopping distance increases exponentially, and
this essentially is the limit at which the brakes will safely stop the configuration. At a descent speed of
20 km/h and initial brake temperature of 250 °C, this maximum grade is approximately 26% for
moderate traction (level 0.45) or better surfaces. There is little improvement in stopping distance at
traction levels above 0.45 as all the configuration’s braking capacity is utilized once this traction level
is reached. At a lower descent speed of 10 km/h, the critical grade level may be extended to 27% and
28% for moderate (0.45) and high (0.60) traction surfaces respectively. As the traction surface declines
below a level of 0.30 (low) the maximum grades on which the configuration can safely stop declines
rapidly. For example on a very low traction level of 0.20 (ice/snow) the maximum grade that this
configuration can safely operate is 10%.
31 RS2007-IG02
0
10
20
30
40
50
0 5 10 15 20 25 30Road Grade (%)
Stop
ping
Dis
tanc
e (m
)
Traction 0.20 Traction 0.25 Traction 0.30 Traction 0.35 Traction 0.45 Traction 0.60
6 axle tractor/jeep/ pole trailer - legal weightsBrakes at adjustment limitInitial brake temperature = 250 deg C
Initial speed = 20 km/h
0
5
10
15
20
0 5 10 15 20 25 30Road Grade (%)
Stop
ping
Dis
tanc
e (m
)
Initial speed = 10 km/h
Figure 15. Influence of traction on stopping performance – 6-axle – initial speed variation
Service brakes have sufficient capacity to handle emergency stopping requirements at highway speeds
and grades. However air actuated drum brake performance can vary considerably due to component
condition, brake adjustment, and brake temperature. Brake system components need to be maintained
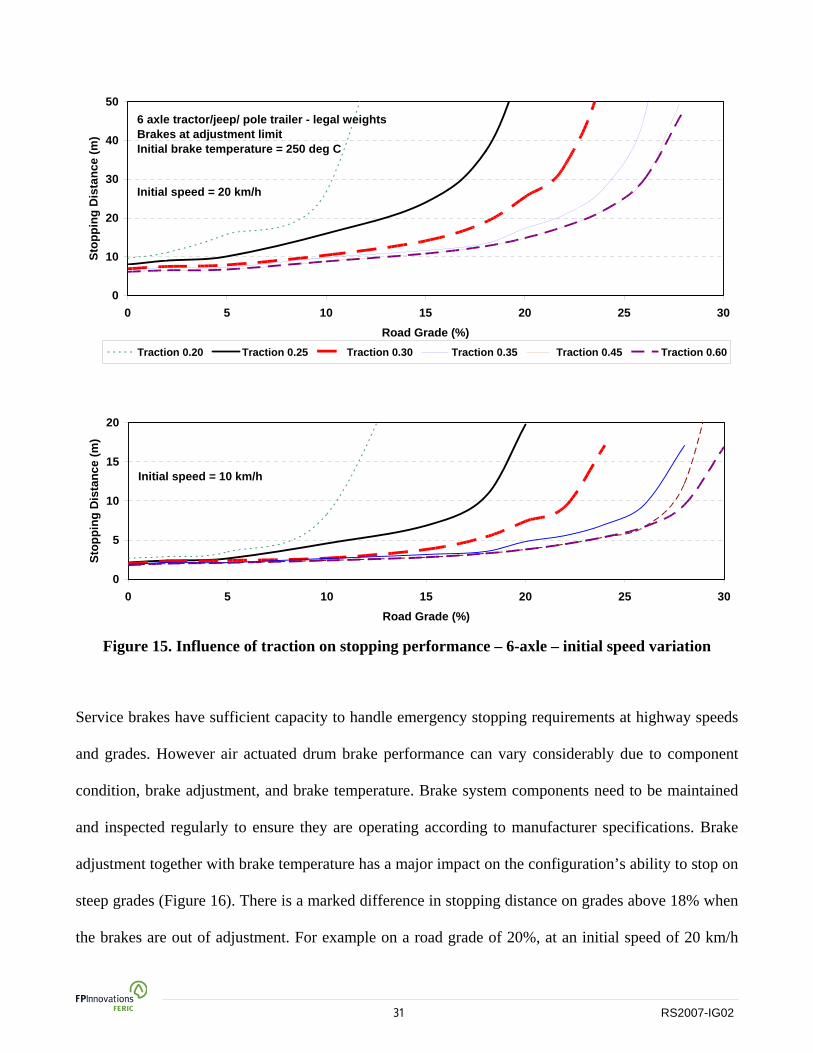
and inspected regularly to ensure they are operating according to manufacturer specifications. Brake
adjustment together with brake temperature has a major impact on the configuration’s ability to stop on
steep grades ( XFigure 16X). There is a marked difference in stopping distance on grades above 18% when
the brakes are out of adjustment. For example on a road grade of 20%, at an initial speed of 20 km/h
32 RS2007-IG02
and initial brake temperature of 250 °C, a 6-axle legally loaded tractor/jeep/pole trailer with brakes out
of adjustment (1/4” over adjustment limit) will take twice the distance (31.5 m) to stop compared to
when all the brakes are at the adjustment limit (14.8 m). Stopping performance is improved further
when the brakes adjustment is ¼” under the adjustment limit. Brake temperature has a major influence
on stopping performance particularly when the brake adjustment is at or beyond the adjustment limit.
At low brake temperatures (150 °C), even the configuration with all brakes out of adjustment may stop
at a road grade of 24%. However, as brake temperatures increase to 350 °C stopping performance is
degraded to the point that even when all the brakes are at the adjustment limit the configuration may
have difficulty stopping at grades above 20% at a descent speed of 20 km/h.
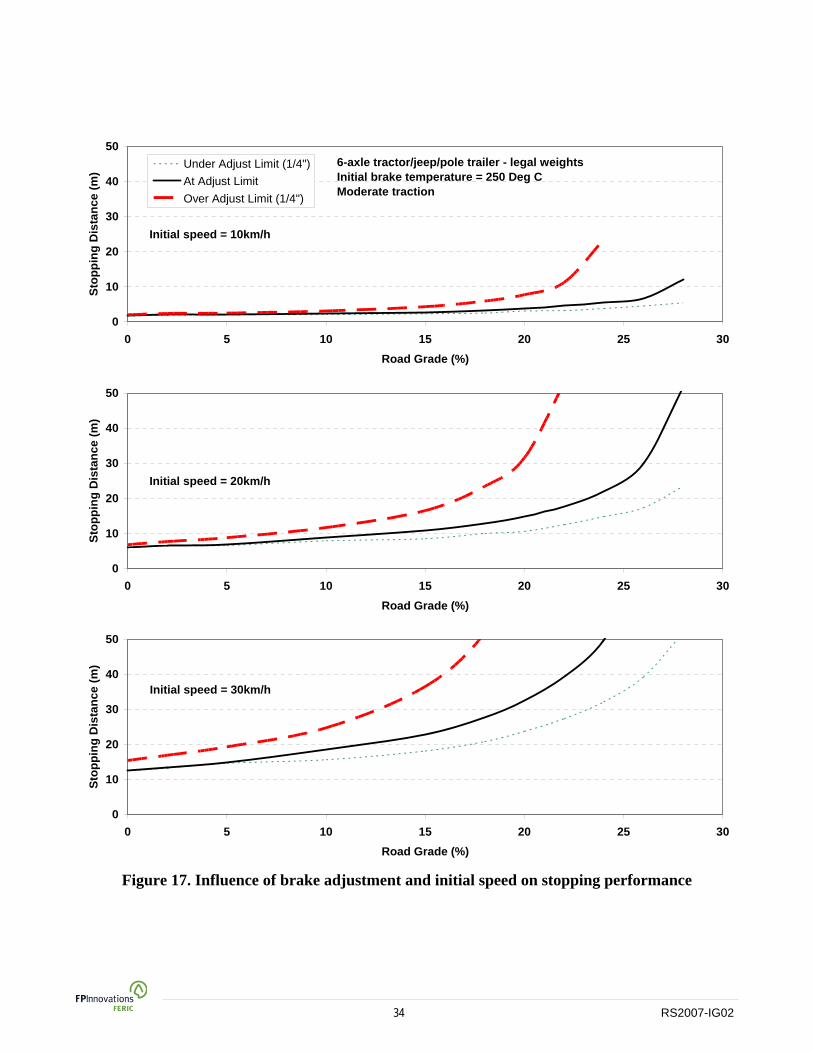
Initial speed also has a major influence on stopping distances as illustrated in XFigure 17X. At low descent
speeds of 10 km/h and moderate brake temperatures (250 °C), even brakes which are ¼” above the
adjustment limit may stop on grades up to 24%. However as the initial speed is increased to 30 km/h,
even well adjusted brakes will be challenged to stop on grades above 24%. The phenomenon illustrated
in this section is known as “brake fade” and shows the importance of managing brake temperature, and
speed through appropriate descent procedures as well as ensuring that the brakes are within prescribed
adjustment limits.
33 RS2007-IG02
0
10
20
30
40
50
0 5 10 15 20 25 30Road Grade (%)
Stop
ping
Dis
tanc
e (m
)
Under Adjust Limit (1/4")At Adjust LimitOver Adjust Limit (1/4")
Initial Brake Temperature = 150 Deg C
6-axle tractor/jeep/pole trailer - legal weightsInitial speed 20 km/hModerate traction
0
10
20
30
40
50
0 5 10 15 20 25 30Road Grade (%)
Stop
ping
Dis
tanc
e (m
)
Initial Brake Temperature = 250 Deg C
0
10
20
30
40
50
0 5 10 15 20 25 30Road Grade (%)
Stop
ping
Dis
tanc
e (m
)
Initial Brake Temperature = 350 Deg
Figure 16. Influence of brake adjustment and temperature on stopping performance
34 RS2007-IG02
0
10
20
30
40
50
0 5 10 15 20 25 30Road Grade (%)
Stop
ping
Dis
tanc
e (m
)
Under Adjust Limit (1/4")At Adjust LimitOver Adjust Limit (1/4")
Initial speed = 10km/h
6-axle tractor/jeep/pole trailer - legal weightsInitial brake temperature = 250 Deg CModerate traction
0
10
20
30
40
50
0 5 10 15 20 25 30Road Grade (%)
Stop
ping
Dis
tanc
e (m
)
Initial speed = 20km/h
0
10
20
30
40
50
0 5 10 15 20 25 30Road Grade (%)
Stop
ping
Dis
tanc
e (m
)
Initial speed = 30km/h
Figure 17. Influence of brake adjustment and initial speed on stopping performance
35 RS2007-IG02
Most highway trucks are equipped with automatic slack-adjusters, which usually consistently stay
within adjustment limits. However their adjustment should be checked at regular intervals to ensure
they are operating as intended. Many older trailers are still equipped with manual slack-adjusters which
require more frequent adjustment. Regardless of slack-adjuster type, all slack-adjusters should be
checked daily when hauling on steep grades. At high temperatures, the combined effect of drum
expansion and declining lining friction leads to reduced stopping capability, which can be further
exacerbated when brakes are out of adjustment. In order to haul on steep grades, a good brake
maintenance program, frequent inspection, and conservative brake use on long steep grades will ensure
that the service brakes will continue to perform as intended when needed in an emergency.
Sufficient engine brake capacity is essential for descending grades above 18%, particularly for
extended distances. The engine brake develops retardation only at the drive tires, which is often
sufficient to satisfy the retardation requirements on grades up to 13%. As grades increase beyond this
level service brake use becomes necessary to maintain control. There are typically three levels of
engine brake engagement, allowing for operation under varying traction conditions. If too high an
engine brake setting is applied the drive wheels will lockup and the retardation available will decline
potentially allowing the truck to accelerate and lose control. Therefore, under low traction conditions, a
low engine brake setting must be applied making it necessary for the service brakes to provide a greater
proportion of the retardation. As a general rule, engine brake retardation should be maximized as much
as possible by using the highest available engine brake setting in combination with the appropriate gear
to maintain an engine speed of between 1400 and 1800 RPM without causing wheel lockup. This
should prevent the service brakes from overheating so that they will perform as desired if needed in an
emergency such as a driveline failure.
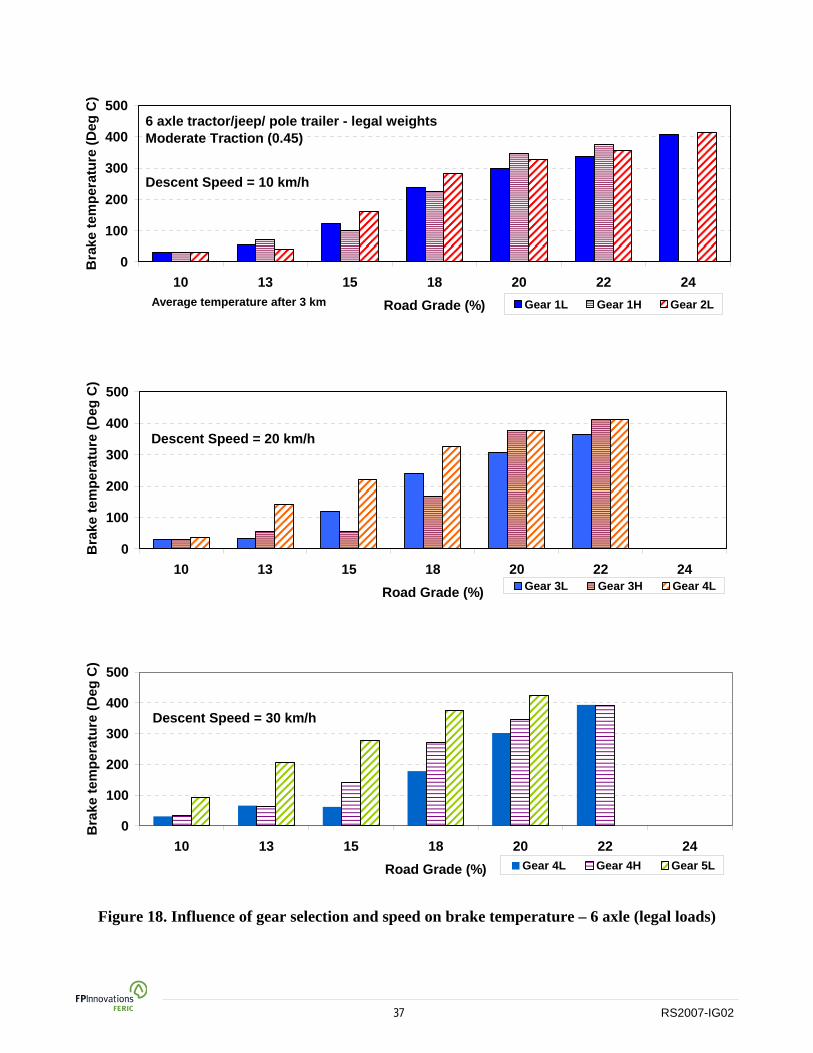
Appropriate gear selection and engine brake use influences service brake temperatures as illustrated in
XFigure 18X for a 6-axle tractor/jeep/pole trailer under moderate traction conditions. Up to grades of
36 RS2007-IG02
13%, the majority of the retardation may be accomplished by the driveline, provided that the traction at
the drive tires can support the retardation forces. However as grades exceed 15% additional retardation
is required at the non-drive tires from the service brakes to maintain the descent speed. As grades
increase above this level service brake temperatures increase due to increased service brake retardation
requirements. Therefore at grades above 15%, gear selection becomes more critical to maximize the
driveline retardation so that service brake use is minimized as much as possible. The optimum gear is
not necessarily the lowest as illustrated in the case of a 20 km/h descent on a 15% grade. In this
example, in gear 3L a lower engine brake setting must be used to prevent the drive wheels from locking
up thereby requiring more service brake use. The highest engine brake setting may be used without
wheel lockup when in gear 3H requiring less service brake use. In some cases reduced service brake
use may be achieved at higher descent speeds, but descent speeds above 20 km/h on grades above 18%
are not recommended due to the difficulty of stopping on steep grades with hot brakes at these speeds.
37 RS2007-IG02
0
100
200
300
400
500
10 13 15 18 20 22 24Road Grade (%)
Bra
ke te
mpe
ratu
re (D
eg C
)
Gear 1L Gear 1H Gear 2L
6 axle tractor/jeep/ pole trailer - legal weightsModerate Traction (0.45)
Descent Speed = 10 km/h
Average temperature after 3 km
0
100
200
300
400
500
10 13 15 18 20 22 24Road Grade (%)
Bra
ke te
mpe
ratu
re (D
eg C
)
Gear 3L Gear 3H Gear 4L
Descent Speed = 20 km/h
0
100
200
300
400
500
10 13 15 18 20 22 24Road Grade (%)
Bra
ke te
mpe
ratu
re (D
eg C
)
Gear 4L Gear 4H Gear 5L
Descent Speed = 30 km/h
Figure 18. Influence of gear selection and speed on brake temperature – 6 axle (legal loads)
38 RS2007-IG02
Road geometric specifications have a major influence on hauling safety and are often determined by
topography. The vertical alignment (grade) dictates the necessary retardation to maintain a controlled
descent speed for a particular truck load. Horizontal alignment also influences retardation requirements
as trucks must generally reduce speed when travelling in curves to maintain control. This reduction in
speed often involves gearing down and adjusting engine brake settings so that the drive tires will not
lose traction in the curve. The effect of horizontal alignment on brake performance only becomes an
issue on tight curves (radius of curvature less than 20 m) on grades above 20%, and therefore road
designers should endeavor to keep switchback grades below this level.
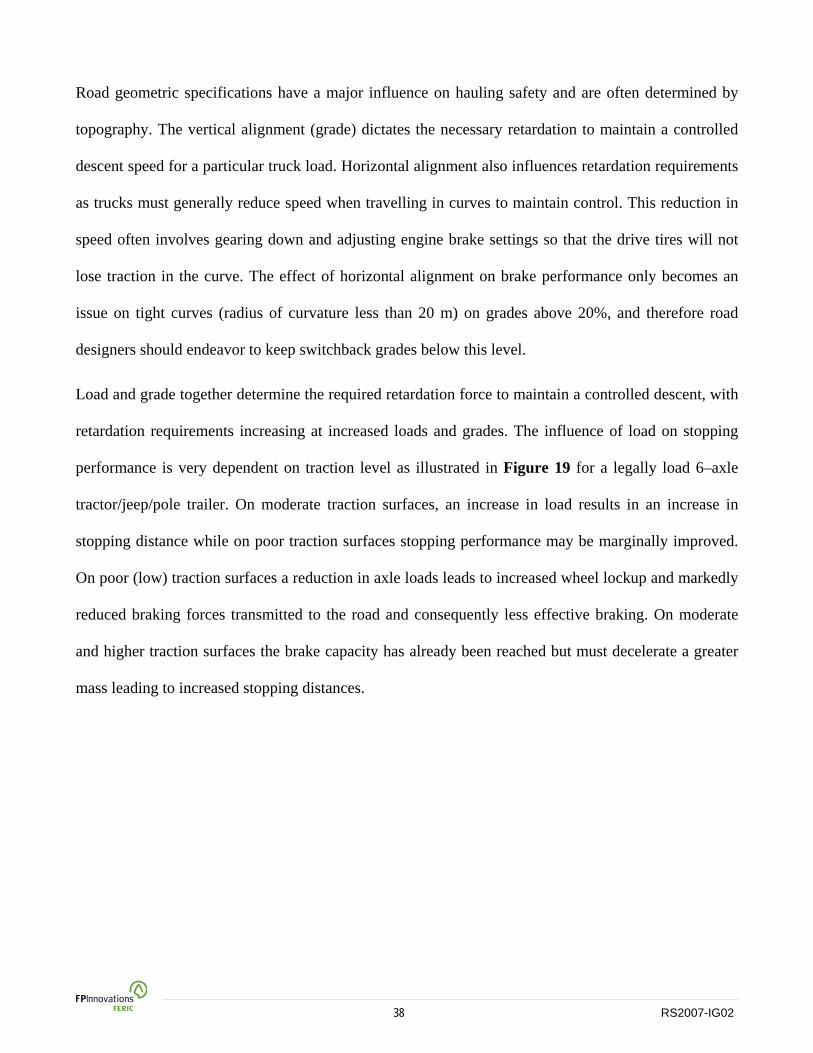
Load and grade together determine the required retardation force to maintain a controlled descent, with
retardation requirements increasing at increased loads and grades. The influence of load on stopping
performance is very dependent on traction level as illustrated in XFigure 19X for a legally load 6–axle
tractor/jeep/pole trailer. On moderate traction surfaces, an increase in load results in an increase in
stopping distance while on poor traction surfaces stopping performance may be marginally improved.
On poor (low) traction surfaces a reduction in axle loads leads to increased wheel lockup and markedly
reduced braking forces transmitted to the road and consequently less effective braking. On moderate
and higher traction surfaces the brake capacity has already been reached but must decelerate a greater
mass leading to increased stopping distances.
39 RS2007-IG02
0
10
20
30
40
50
0 5 10 15 20 25 30Road Grade (%)
Stop
ping
Dis
tanc
e (m
)
legal weights 4 tonnes underloaded 4 tonnes overloaded
6 axle tractor/jeep/ pole trailer - legal weightsBrakes at adjustment limitInitial speed = 20 km/hInitial brake temperature = 250 deg C
Moderate Traction (0.45)
0
10
20
30
40
50
0 5 10 15 20 25 30Road Grade (%)
Stop
ping
Dis
tanc
e (m
)
Poor Traction (0.30)
Figure 19. Influence of load on stopping performance – 6-axle – moderate and poor traction
Ideally the load should be distributed to provide a relatively balanced load to each axle, so that each
brake absorbs a similar energy level and the risk of wheel lockup is reduced, thereby optimizing the
configuration’s stopping capability. For increased loads (off-highway applications) and grades, the load
carried by the drive axles can be increased to allow the highest engine brake setting to be applied so
that driveline retardation is maximized.
The 6-axle tractor jeep/pole trailer showed superior steep grade stopping performance under all traction
conditions (XFigure 20X). Under legal loads, the 7-axle configuration has the lowest load per axle and
40 RS2007-IG02
therefore would be expected to have the best stopping performance under moderate traction conditions.
However on grades above 20%, the 6-axle configuration showed improved stopping performance
relative to the 7-axle. The relatively improved stopping performance of the 6-axle under these traction
conditions is likely a result of two factors: less load carried by the steering axle brakes (which have less
brake capacity) and a more efficient load transfer between axles. Under poor traction conditions, the
combined effect of the lower load per axle and increased relative load transfer for the 7-axle
configuration results in an increased tendency for wheel lockup and consequently less effective
braking.
0
10
20
30
40
50
0 5 10 15 20 25 30Road Grade (%)
Stop
ping
Dis
tanc
e (m
)
5-axle (40.0 tonnes) 6-axle (48.5 tonnes) 7-axle (55.3 tonnes)
Brakes at adjustment limitInitial speed = 20 km/hInitial brake temperature = 250 deg C
Moderate Traction (0.45)
0
10
20
30
40
50
0 5 10 15 20 25 30Road Grade (%)
Stop
ping
Dis
tanc
e (m
)
Poor Traction (0.30)
Figure 20. Influence of configuration on stopping performance – legal loads
41 RS2007-IG02
Speed is a very important factor due to the increased energyTPF
7FPT that must be absorbed should the truck
configuration need to be stopped from a high speed on a steep grade. A low descent speed reduces the
stopping distance and energy absorption requirements thereby reducing the risk of a runaway. However
on a lower traction surface a lower speed may increase the risk of drive wheel lockup due to the lower
gear used at low speeds which increases the drive wheel retardation forces. This is where the driver’s
skill and experience play the greatest role in their ability to adjust the descent speed through
appropriate gear selection, engine brake use, and service brake application to constantly changing road
conditions.
4. Descent guideline development Descent guidelines have been developed which take into account the critical parameters for three
configuration types. The parameters that can be most easily controlled for given road and traction
conditions are load, load distribution, and descent speed. The guidelines provide maximum speeds and
loads (Appendix III) for specified road conditions (traction, grade, distance) for three configurations (5-
axle, 6-axle, and 7-axle). These guidelines will also be available as a spreadsheet lookup tool (available
from FPInnovations – Feric website (HTUwww.feric.ca UTH) under the solutions tab) which expedites speed and
payload estimation.
Application of these guidelines may be best understood by reviewing a sample descent profile (XFigure
21 X) for a 7-axle off-highway application. The maximum speeds and loads are determined separately by
dividing the descent into different road sections based on grade and traction condition.
TP
7PT Energy = ½ mv P
2P + mgh (where m = mass, v=velocity, g= gravitational constant (9.81m/s2) , h = vertical distance) First
component (½ mv P
2P) is kinetic energy, second component (mgh)is potential energy. In addition to the increase in kinetic
energy, at higher speeds the increased stopping distance results in increased vertical distance and potential energy that must be absorbed.
42 RS2007-IG02
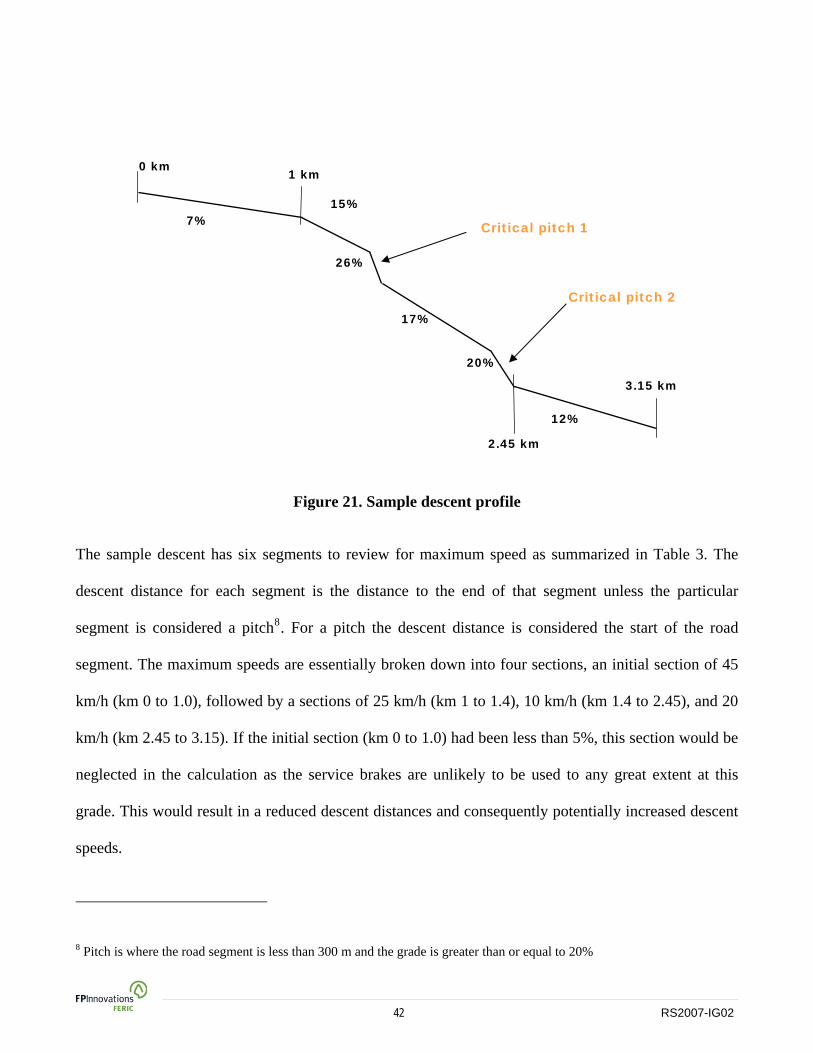
Figure 21. Sample descent profile
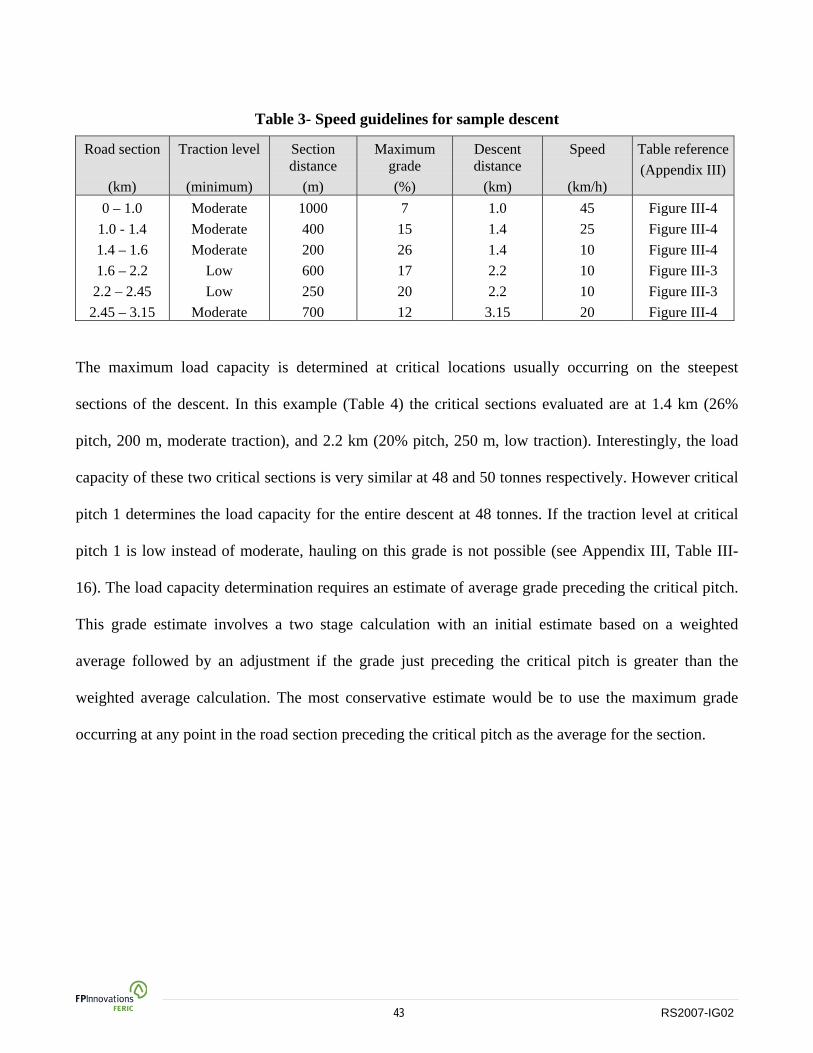
The sample descent has six segments to review for maximum speed as summarized in XTable 3X. The
descent distance for each segment is the distance to the end of that segment unless the particular
segment is considered a pitchTPF
8FPT. For a pitch the descent distance is considered the start of the road
segment. The maximum speeds are essentially broken down into four sections, an initial section of 45
km/h (km 0 to 1.0), followed by a sections of 25 km/h (km 1 to 1.4), 10 km/h (km 1.4 to 2.45), and 20
km/h (km 2.45 to 3.15). If the initial section (km 0 to 1.0) had been less than 5%, this section would be
neglected in the calculation as the service brakes are unlikely to be used to any great extent at this
grade. This would result in a reduced descent distances and consequently potentially increased descent
speeds.
TP
8PT Pitch is where the road segment is less than 300 m and the grade is greater than or equal to 20%
Critical pitch 1
Critical pitch 2
7% 15%
26%
17%
20%
12%
0 km 1 km
2.45 km
3.15 km
43 RS2007-IG02
Table 3- Speed guidelines for sample descent
Road section
(km)
Traction level
(minimum)
Section distance
(m)
Maximum grade (%)
Descent distance
(km)
Speed
(km/h)
Table reference(Appendix III)
0 – 1.0 1.0 - 1.4 1.4 – 1.6 1.6 – 2.2 2.2 – 2.45
2.45 – 3.15
Moderate Moderate Moderate
Low Low
Moderate
1000 400 200 600 250 700
7 15 26 17 20 12
1.0 1.4 1.4 2.2 2.2
3.15
45 25 10 10 10 20
Figure III-4 Figure III-4 Figure III-4 Figure III-3 Figure III-3 Figure III-4
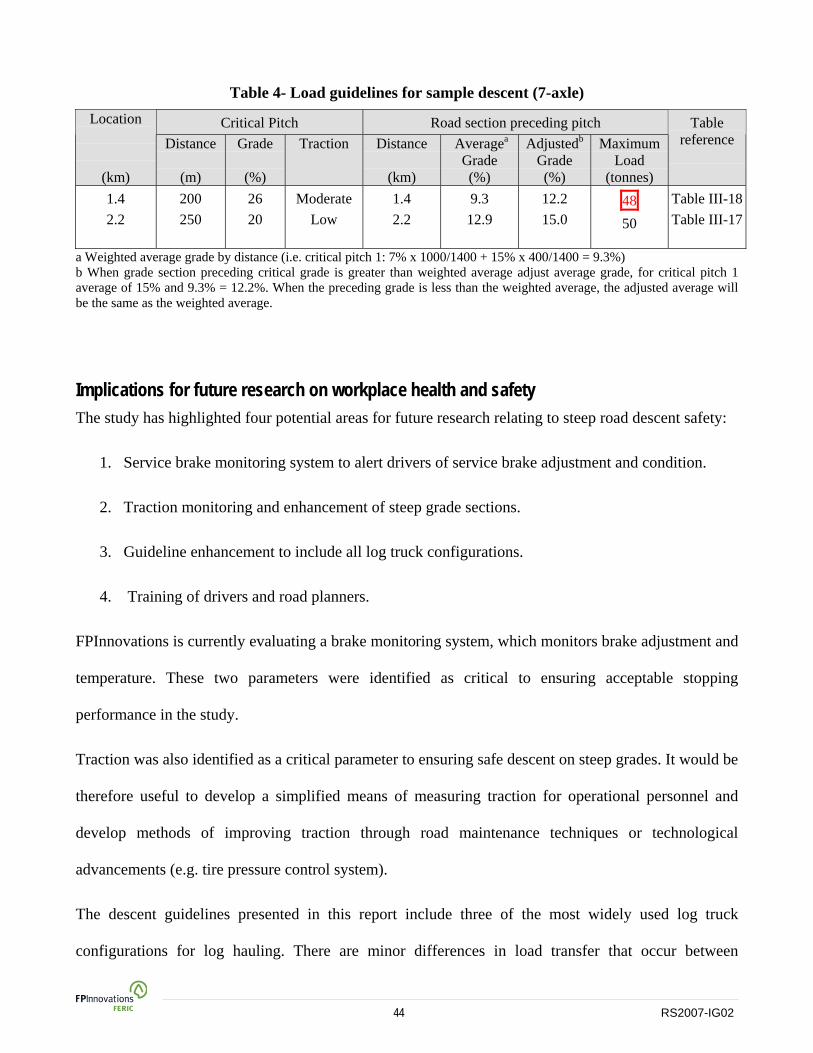
The maximum load capacity is determined at critical locations usually occurring on the steepest
sections of the descent. In this example (XTable 4X) the critical sections evaluated are at 1.4 km (26%
pitch, 200 m, moderate traction), and 2.2 km (20% pitch, 250 m, low traction). Interestingly, the load
capacity of these two critical sections is very similar at 48 and 50 tonnes respectively. However critical
pitch 1 determines the load capacity for the entire descent at 48 tonnes. If the traction level at critical
pitch 1 is low instead of moderate, hauling on this grade is not possible (see Appendix III, Table III-
16). The load capacity determination requires an estimate of average grade preceding the critical pitch.
This grade estimate involves a two stage calculation with an initial estimate based on a weighted
average followed by an adjustment if the grade just preceding the critical pitch is greater than the
weighted average calculation. The most conservative estimate would be to use the maximum grade
occurring at any point in the road section preceding the critical pitch as the average for the section.
44 RS2007-IG02
Table 4- Load guidelines for sample descent (7-axle)
Critical Pitch Road section preceding pitch Location
(km)
Distance
(m)
Grade
(%)
Traction Distance
(km)
AverageP
aP
Grade (%)
Adjusted P
bP
Grade (%)
Maximum Load
(tonnes)
Table reference
1.4 2.2
200 250
26 20
Moderate Low
1.4 2.2
9.3 12.9
12.2 15.0
48 50
Table III-18Table III-17
Ta Weighted average grade by distance (i.e. critical pitch 1: 7% x 1000/1400 + 15% x 400/1400 = 9.3%) Tb When grade section preceding critical grade is greater than weighted average adjust average grade, for critical pitch 1 average of 15% and 9.3% = 12.2%. When the preceding grade is less than the weighted average, the adjusted average will be the same as the weighted average.
Implications for future research on workplace health and safety The study has highlighted four potential areas for future research relating to steep road descent safety:
1. Service brake monitoring system to alert drivers of service brake adjustment and condition.
2. Traction monitoring and enhancement of steep grade sections.
3. Guideline enhancement to include all log truck configurations.
4. Training of drivers and road planners.
FPInnovations is currently evaluating a brake monitoring system, which monitors brake adjustment and
temperature. These two parameters were identified as critical to ensuring acceptable stopping
performance in the study.
Traction was also identified as a critical parameter to ensuring safe descent on steep grades. It would be
therefore useful to develop a simplified means of measuring traction for operational personnel and
develop methods of improving traction through road maintenance techniques or technological
advancements (e.g. tire pressure control system).
The descent guidelines presented in this report include three of the most widely used log truck
configurations for log hauling. There are minor differences in load transfer that occur between

45 RS2007-IG02
configurations that affect braking performance. The inclusion of other configurations in the guidelines
would further enhance this planning tool.
Driving technique (gear selection and speed control) was identified in the study for controlling service
brake temperatures and hence their stopping capability. Experienced drivers are well aware of these
driving techniques, but further training of less experienced drivers in these techniques should be
implemented. In addition forest road planners should be trained in the use of the guidelines as a
planning tool to ensure that the safest road systems are developed.
Identification of immediate and longterm benefits of project findings The main immediate benefit of this study is the production of guidelines that provide operational
planners with a means of assessing the relative safety of their haul routes. The guidelines will enable
planners to investigate a number of route options that provide the safest alternative and assist in the
development of safe operating procedures (SOPs). The study also identified the critical factors for
drivers and operational staff to review on an ongoing basis. Much of the material presented in this
report can be used to develop a training module for drivers hauling on steep grades.
Identification of relevant user groups for project results There are two broad user groups who will benefit from the study findings:
1. UForest road plannersU – this includes all operational staff involved in the design, construction and
maintenance of forest road networks.
2. UTruck drivers U– all drivers involved hauling logs on steep forest roads (grades greater than 18%)
Dissemination/knowledge transfer Dissemination of the study findings is anticipated to be conducted over two phases:
46 RS2007-IG02
In the first phase, FPInnovations will visit all the main stakeholders involved in steep road hauling to
review the study findings. Forest engineers, road construction and haul supervisory staff will be trained
in the application of the guidelines and the critical parameters influencing steep grade descents.
In the second phase, a workshop will be scheduled to review the study findings from a driver’s
perspective. The workshop will focus on driving technique and the importance of service brake
maintenance, gear selection and load size on steep grade braking performance. Additional workshops
will be scheduled depending on demand from stakeholders and availability of additional funding.
References British Columbia Ministry of Forests 2002. Forest Road Engineering Guidebook. Forest Practices Branch, BC Ministry of Forests, Victoria, BC. Forest Practices Code of British Columbia Guidebook. HTUhttp://www.for.gov.bc.ca/TASB/LEGSREGS/FPC/FPCGUIDE/Road/FRE.pdfUTH
WorkSafeBC 2005. OH&S Guideline 26.2-2:Planning Log hauling operations for varying road grades. WorkSafeBC (the Workers Compensation Board of British Columbia), Vancouver. HTUhttp://www2.worksafebc.com/Publications/OHSRegulation/GuidelinePart26.aspUTH
Parker S.P.S. 2007. Development of guidelines for descending steep grades: coastal British Columbia off-highway truck applications. Advantage Report Vol 8 No. 5, FERIC Vancouver.
Parker S.P.S. 2010. Development of guidelines for descending steep grades: highway legal log hauling configurations. FPInnovations Feric Internal Report
Yee H.W. 1996 A review to determine the need, location and design of runaway lanes in British Columbia. Masters Thesis Department of Civil Engineering University of British Columbia
Acknowledgements The author gratefully acknowledges Rick Bitten of Western Forest Products and Ben Lattanzi of Island
Timberlands for their support in facilitating the instrumentation and testing of the two log truck
configurations, Bob Sinclair of Western Forest Products and Mark Slocum of Island Timberlands for
their diligence, support and operational input during the testing phase, Olaf Knezevic of WorkSafeBC
and Eric Amlin of FPInnovations – Feric division for their patience and technical input throughout the
project. In addition, the author acknowledges the WorkSafeBC – Innovation at Work program for
funding, which made testing of the second instrumented truck configuration possible.
Appendix III – Descent Guidelines
Page III-1 RS2007-IG02
Traction Estimation The following methods1 provide simplified means of estimating traction and may be conducted with either an empty logging truck or pickup truck:
Stopping Distance Test Stopping distance tests should be conducted on a level grade on the road surface material of interest. Several tests should be conducted at several application pressures until wheel lockup occurs. The traction can be estimated from the following formula:
StcoefficienTraction v
*254_
2
= (III-1)
Where V = initial speed (km/h) S = stopping distance (m)
It will be important to measure the stopping distance from the point where the brakes are applied.
Gradeability Test The gradeability test is best accomplished with a rear-wheel drive pickup truck. The test needs to be conducted on the road surface material of interest on an uphill grade steep enough to challenge the truck’s gradeability. If the truck easily makes it up the test section, the load distribution may be adjusted by reducing weight on the rear (driven axle) or adding weight to the front axles (non-driven axle). The traction can then be estimated from the following formula:
RpMtcoefficienTraction
*100*_ = (III-2)
Where M = Total truck mass (kg) R = Rear axle load (kg) p = road grade (%)
Note that this method provides the minimum traction required to achieve the desired gradeability. In order to get the best estimate of traction, the conditions (axle weights or road grade) must be adjusted until the truck can just make it up the grade while maintaining a steady speed.
1 Only one of these tests need to be conducted to estimate the coefficient of friction/traction
Page III-3 RS2007-IG02
0
5
10
15
20
25
30
10 12 14 16 18 20 22 24 26 28 30Road Grade (%)
Max
imum
spe
ed (k
m/h
)
Descents < 1.5 km Descents 1.5 to 3.0 km Descents 3.0 to 5.0 km
Very Low Traction (0.20) - Prior to pitch
Do not haul at this traction level on switchbacks if grade exceeds 12%
0
5
10
15
20
25
30
10 12 14 16 18 20 22 24 26 28 30Road Grade (%)
Max
imum
spe
ed (k
m/h
)
Very Low Traction (0.20) - On pitch
Figure III- 1. Maximum speed – very low traction (traction coefficient 0.20)
Page III-4 RS2007-IG02
0
5
10
15
20
25
30
35
40
10 12 14 16 18 20 22 24 26 28 30Road Grade (%)
Max
imum
spe
ed (k
m/h
)
Descents < 0.5 km Descents 0.5 to 1.5 km
Low Traction (0.30) - Prior to pitch
Do not haul at this traction level on switchbacks if grade exceeds 20%
On switchback grades over 18% -limit speed to 10 km/h
0
5
10
15
20
25
30
35
40
10 12 14 16 18 20 22 24 26 28 30Road Grade (%)
Max
imum
spe
ed (k
m/h
)
Low Traction (0.30) - On pitch
Figure III- 2. Maximum speed – low traction (traction coefficient 0.30) – descent distances less
than 1.5 kilometres
Page III-5 RS2007-IG02
0
5
10
15
20
25
30
35
40
10 12 14 16 18 20 22 24 26 28 30Road Grade (%)
Max
imum
spe
ed (k
m/h
)
Descents 1.5 to 3.0 km (5 and 7-axle) Descents 1.5 to 3.0 km (6-axle) Descents 3.0 to 5.0 km
Low Traction (0.30) - Prior to pitch
Do not haul at this traction level on switchbacks if grade exceeds 20%
On switchback grades over 18% -limit speed to 10 km/h
0
5
10
15
20
25
30
35
40
10 12 14 16 18 20 22 24 26 28 30Road Grade (%)
Max
imum
spe
ed (k
m/h
)
Low Traction (0.30) - On pitch
Figure III- 3. Maximum speed – low traction (traction coefficient 0.30) – descent distances
greater than 1.5 kilometres
Page III-6 RS2007-IG02
05
101520253035404550
10 12 14 16 18 20 22 24 26 28 30Road Grade (%)
Max
imum
spe
ed (k
m/h
)
Descents < 0.5 km Descents 0.5 to 1.5 km Descents 1.5 to 3.0 km Descents 3.0 to 5.0 km
Moderate Traction (0.45) - Prior to pitch
Do not haul at this traction level on switchbacks if grade exceeds 24%
On switchback grades over 22% -limit speed to 10 km/h
05
101520253035404550
10 12 14 16 18 20 22 24 26 28 30Road Grade (%)
Max
imum
spe
ed (k
m/h
)
Moderate Traction (0.45) - On pitch
Figure III- 4. Maximum speed – moderate traction (traction coefficient 0.45)
Page III-7 RS2007-IG02
05
101520253035404550
10 12 14 16 18 20 22 24 26 28 30Road Grade (%)
Max
imum
spe
ed (k
m/h
)
Descents < 0.5 km Descents 0.5 to 1.5 km Descents 1.5 to 3.0 km Descents 3.0 to 5.0 km
High Traction (0.60) - Prior to pitch
Do not haul at this traction level on switchbacks if grade exceeds 26%
On switchback grades over 24% -limit speed to 10 km/h
05
101520253035404550
10 12 14 16 18 20 22 24 26 28 30Road Grade (%)
Max
imum
spe
ed (k
m/h
)
High Traction (0.60) - On pitch
Figure III- 5. Maximum speed – high traction (traction coefficient 0.60)
Page III-8 RS2007-IG02
Table III- 1. Maximum payload (tonnes) – 5-axle –very low traction (snow/ice :traction coefficient 0.20)
Cummulative distance prior
to pitch
Average grade
prior to pitch
Critical pitch grade
Critical pitch length (m) Cummulative distance prior
to pitch
Average grade
prior to pitch
Critical pitch grade
Critical pitch length (m)
(km) (%) (%) 50 100 200 300 (km) (%) (%) 50 100 200 300 0.5 10 10
12 14 16 18
46 46 46 46 -
46 46 46 46 -
46 46 46 44 -
46 46 46 44 -
1.5 10 10 12 14 16 18
46 46 46 46 -
46 46 46 46 -
46 46 46 44 -
46 46 46 44 -
0.5 13 14 16 18
46 46 -
46 46 -
46 44 -
46 44 -
1.5 13 14 16 18
46 46 -
46 46 -
46 44 -
46 44 -
0.5 15 16 18
46 -
46 -
44 -
44 -
1.5 15 16 18
42 -
42 -
42 -
40 -
3 10 10 12 14 16 18
46 46 46 46 -
46 46 46 46 -
46 46 46 44 -
46 46 46 44 -
5 10 10 12 14 16 18
46 46 46 46 -
46 46 46 46 -
46 46 46 44 -
46 46 46 44 -
3 13 14 16 18
36 36 -
36 36 -
36 36 -
36 36 -
5 13 14 16 18
28 28 -
28 28 -
28 28 -
28 28 -
3 15 16 18
- -
- -
- -
- -
5 15 16 18
- -
- -
- -
- -
Note : ‘-‘ indicates no safe payload for this application Legal payload : 26 tonnes
Page III-9 RS2007-IG02
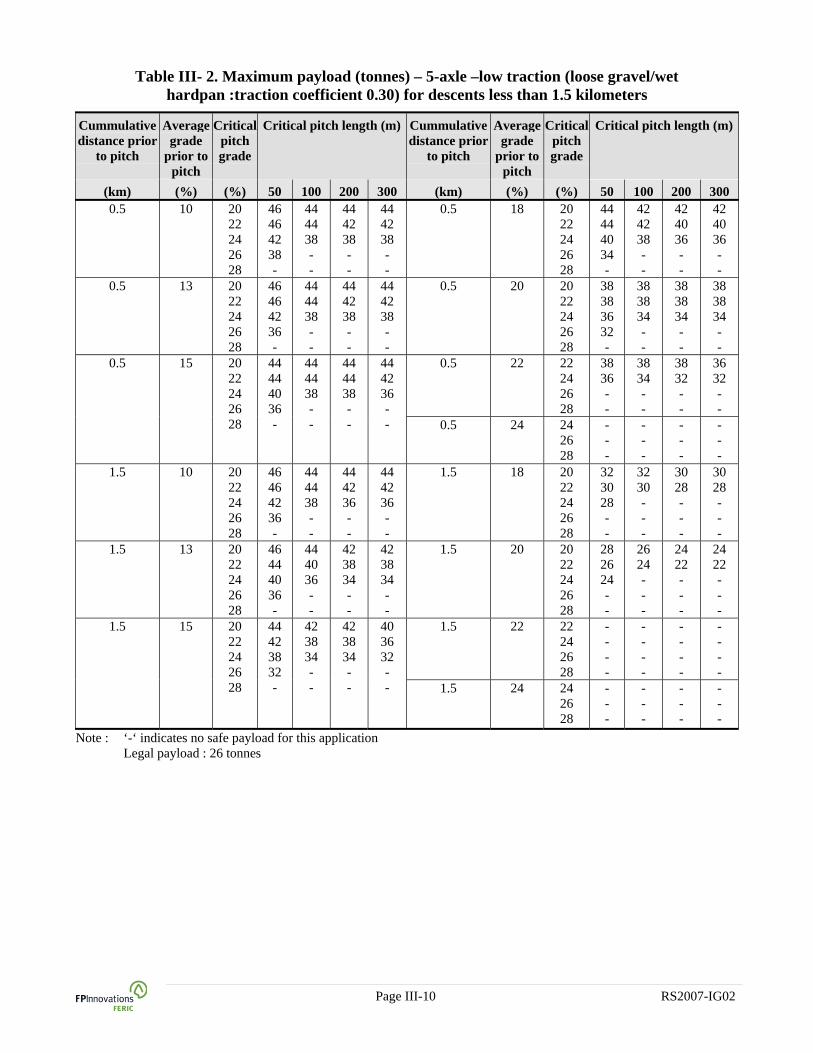
Table III- 2. Maximum payload (tonnes) – 5-axle –low traction (loose gravel/wet hardpan :traction coefficient 0.30) for descents less than 1.5 kilometers
Cummulative distance prior
to pitch
Average grade
prior to pitch
Critical pitch grade
Critical pitch length (m) Cummulative distance prior
to pitch
Average grade
prior to pitch
Critical pitch grade
Critical pitch length (m)
(km) (%) (%) 50 100 200 300 (km) (%) (%) 50 100 200 300 0.5 10 20
22 24 26 28
46 46 42 38 -
44 44 38 - -
44 42 38 - -
44 42 38 - -
0.5 18 20 22 24 26 28
44 44 40 34 -
42 42 38 - -
42 40 36 - -
42 40 36 - -
0.5 13 20 22 24 26 28
46 46 42 36 -
44 44 38 - -
44 42 38 - -
44 42 38 - -
0.5 20 20 22 24 26 28
38 38 36 32 -
38 38 34 - -
38 38 34 - -
38 38 34 - -
0.5 22 22 24 26 28
38 36 - -
38 34 - -
38 32 - -
36 32 - -
0.5 15 20 22 24 26 28
44 44 40 36 -
44 44 38 - -
44 44 38 - -
44 42 36 - - 0.5 24 24
26 28
- - -
- - -
- - -
- - -
1.5 10 20 22 24 26 28
46 46 42 36 -
44 44 38 - -
44 42 36 - -
44 42 36 - -
1.5 18 20 22 24 26 28
32 30 28 - -
32 30 - - -
30 28 - - -
30 28 - - -
1.5 13 20 22 24 26 28
46 44 40 36 -
44 40 36 - -
42 38 34 - -
42 38 34 - -
1.5 20 20 22 24 26 28
28 26 24 - -
26 24 - - -
24 22 - - -
24 22 - - -
1.5 22 22 24 26 28
- - - -
- - - -
- - - -
- - - -
1.5 15 20 22 24 26 28
44 42 38 32 -
42 38 34 - -
42 38 34 - -
40 36 32 - - 1.5 24 24
26 28
- - -
- - -
- - -
- - -
Note : ‘-‘ indicates no safe payload for this application Legal payload : 26 tonnes
Page III-10 RS2007-IG02
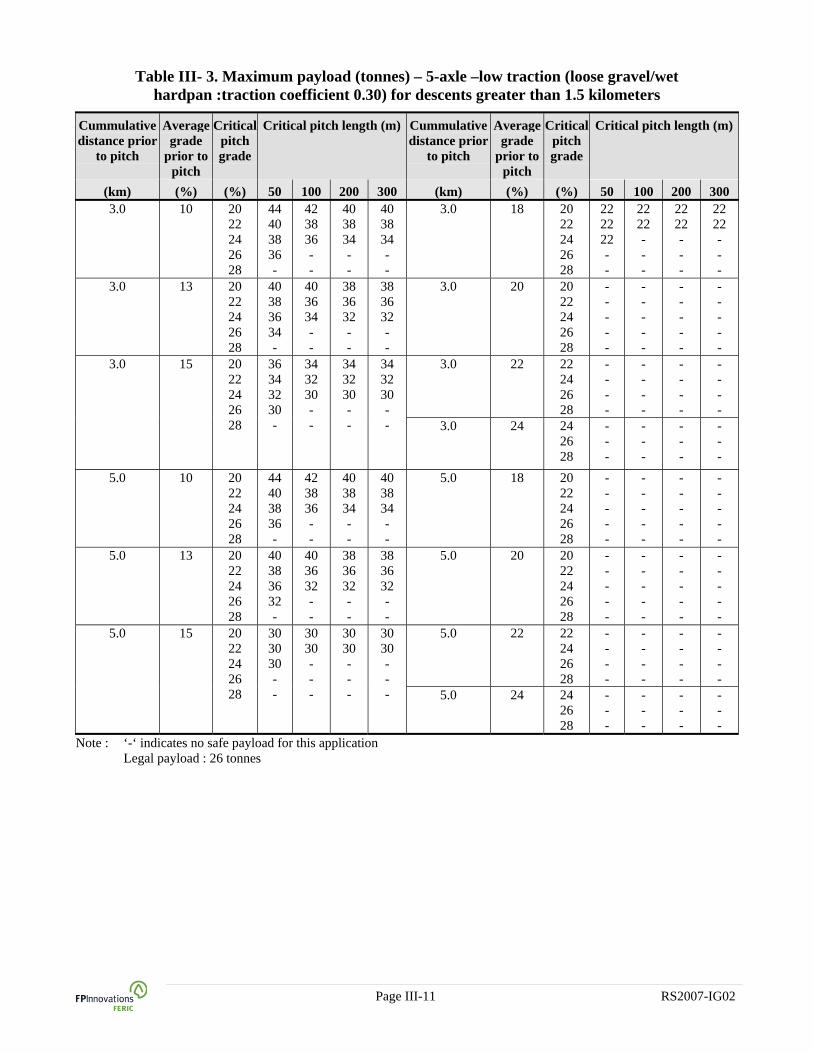
Table III- 3. Maximum payload (tonnes) – 5-axle –low traction (loose gravel/wet hardpan :traction coefficient 0.30) for descents greater than 1.5 kilometers
Cummulative distance prior
to pitch
Average grade
prior to pitch
Critical pitch grade
Critical pitch length (m) Cummulative distance prior
to pitch
Average grade
prior to pitch
Critical pitch grade
Critical pitch length (m)
(km) (%) (%) 50 100 200 300 (km) (%) (%) 50 100 200 300 3.0 10 20
22 24 26 28
44 40 38 36 -
42 38 36 - -
40 38 34 - -
40 38 34 - -
3.0 18 20 22 24 26 28
22 22 22 - -
22 22 - - -
22 22 - - -
22 22 - - -
3.0 13 20 22 24 26 28
40 38 36 34 -
40 36 34 - -
38 36 32 - -
38 36 32 - -
3.0 20 20 22 24 26 28
- - - - -
- - - - -
- - - - -
- - - - -
3.0 22 22 24 26 28
- - - -
- - - -
- - - -
- - - -
3.0 15 20 22 24 26 28
36 34 32 30 -
34 32 30 - -
34 32 30 - -
34 32 30 - - 3.0 24 24
26 28
- - -
- - -
- - -
- - -
5.0 10 20 22 24 26 28
44 40 38 36 -
42 38 36 - -
40 38 34 - -
40 38 34 - -
5.0 18 20 22 24 26 28
- - - - -
- - - - -
- - - - -
- - - - -
5.0 13 20 22 24 26 28
40 38 36 32 -
40 36 32 - -
38 36 32 - -
38 36 32 - -
5.0 20 20 22 24 26 28
- - - - -
- - - - -
- - - - -
- - - - -
5.0 22 22 24 26 28
- - - -
- - - -
- - - -
- - - -
5.0 15 20 22 24 26 28
30 30 30 - -
30 30 - - -
30 30 - - -
30 30 - - - 5.0 24 24
26 28
- - -
- - -
- - -
- - -
Note : ‘-‘ indicates no safe payload for this application Legal payload : 26 tonnes
Page III-11 RS2007-IG02

Table III- 4. Maximum payload (tonnes) – 5-axle –moderate traction (compact gravel :traction coefficient 0.45) for descents less than 1.5 kilometers
Cummulative distance prior
to pitch
Average grade
prior to pitch
Critical pitch grade
Critical pitch length (m) Cummulative distance prior
to pitch
Average grade
prior to pitch
Critical pitch grade
Critical pitch length (m)
(km) (%) (%) 50 100 200 300 (km) (%) (%) 50 100 200 300 0.5 10 20
22 24 26 28
46 46 44 40 36
44 44 42 38 34
44 42 40 36 34
44 42 40 36 34
0.5 18 20 22 24 26 28
42 42 40 38 36
42 42 40 36 34
40 40 38 36 32
40 40 38 36 32
0.5 13 20 22 24 26 28
44 44 42 40 36
42 42 40 38 34
42 42 40 36 34
42 42 40 36 34
0.5 20 20 22 24 26 28
42 42 40 38 36
42 42 40 36 34
40 40 38 36 32
40 40 38 36 32
0.5 22 22 24 26 28
40 40 38 34
40 40 36 34
38 38 36 32
38 38 34 32
0.5 15 20 22 24 26 28
42 42 42 40 36
42 42 40 36 34
42 40 40 36 34
40 40 40 36 32 0.5 24 24
26 28
38 36 34
38 34 32
36 34 30
36 34 30
1.5 10 20 22 24 26 28
46 46 42 38 34
44 42 38 36 32
44 42 38 36 32
44 42 38 34 32
1.5 18 20 22 24 26 28
42 40 38 36 34
42 38 36 34 32
40 38 36 34 30
40 38 36 32 30
1.5 13 20 22 24 26 28
42 40 38 36 34
42 38 36 34 32
42 38 36 34 30
42 38 36 32 30
1.5 20 20 22 24 26 28
42 40 38 36 34
42 38 36 34 28
40 38 36 26 26
40 38 36 26 26
1.5 22 22 24 26 28
40 38 36 28
38 36 28 26
38 36 26 24
38 36 26 24
1.5 15 20 22 24 26 28
42 40 38 36 34
42 38 36 34 32
42 38 36 34 30
40 38 36 32 30 1.5 24 24
26 28
28 26 26
28 26 24
26 26 22
26 26 22
Note : Legal payload : 26 tonnes
Page III-12 RS2007-IG02
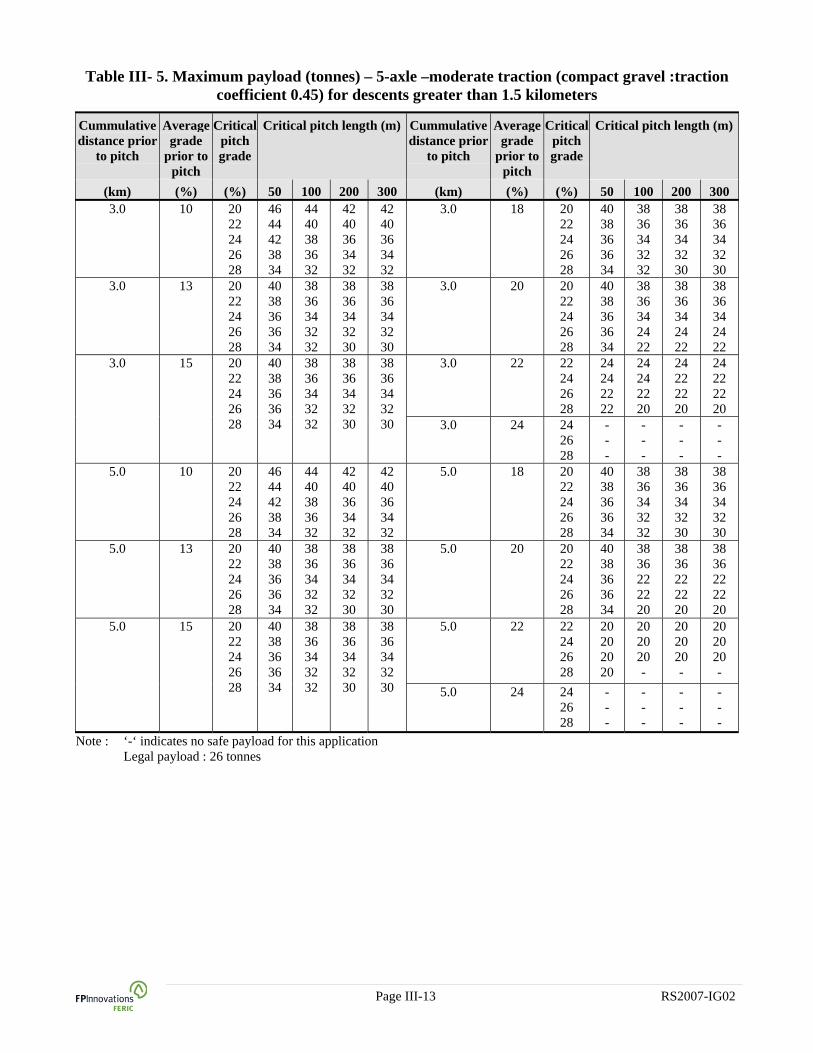
Table III- 5. Maximum payload (tonnes) – 5-axle –moderate traction (compact gravel :traction coefficient 0.45) for descents greater than 1.5 kilometers
Cummulative distance prior
to pitch
Average grade
prior to pitch
Critical pitch grade
Critical pitch length (m) Cummulative distance prior
to pitch
Average grade
prior to pitch
Critical pitch grade
Critical pitch length (m)
(km) (%) (%) 50 100 200 300 (km) (%) (%) 50 100 200 300 3.0 10 20
22 24 26 28
46 44 42 38 34
44 40 38 36 32
42 40 36 34 32
42 40 36 34 32
3.0 18 20 22 24 26 28
40 38 36 36 34
38 36 34 32 32
38 36 34 32 30
38 36 34 32 30
3.0 13 20 22 24 26 28
40 38 36 36 34
38 36 34 32 32
38 36 34 32 30
38 36 34 32 30
3.0 20 20 22 24 26 28
40 38 36 36 34
38 36 34 24 22
38 36 34 24 22
38 36 34 24 22
3.0 22 22 24 26 28
24 24 22 22
24 24 22 20
24 22 22 20
24 22 22 20
3.0 15 20 22 24 26 28
40 38 36 36 34
38 36 34 32 32
38 36 34 32 30
38 36 34 32 30 3.0 24 24
26 28
- - -
- - -
- - -
- - -
5.0 10 20 22 24 26 28
46 44 42 38 34
44 40 38 36 32
42 40 36 34 32
42 40 36 34 32
5.0 18 20 22 24 26 28
40 38 36 36 34
38 36 34 32 32
38 36 34 32 30
38 36 34 32 30
5.0 13 20 22 24 26 28
40 38 36 36 34
38 36 34 32 32
38 36 34 32 30
38 36 34 32 30
5.0 20 20 22 24 26 28
40 38 36 36 34
38 36 22 22 20
38 36 22 22 20
38 36 22 22 20
5.0 22 22 24 26 28
20 20 20 20
20 20 20 -
20 20 20 -
20 20 20 -
5.0 15 20 22 24 26 28
40 38 36 36 34
38 36 34 32 32
38 36 34 32 30
38 36 34 32 30 5.0 24 24
26 28
- - -
- - -
- - -
- - -
Note : ‘-‘ indicates no safe payload for this application Legal payload : 26 tonnes
Page III-13 RS2007-IG02
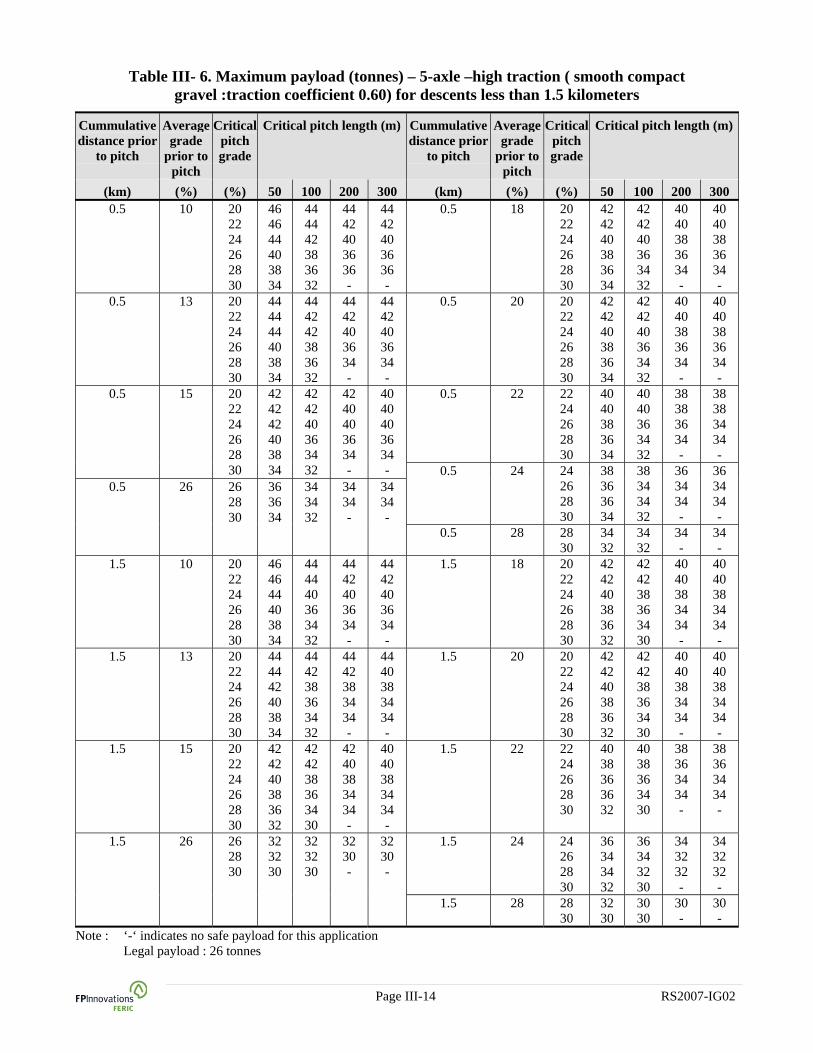
Table III- 6. Maximum payload (tonnes) – 5-axle –high traction ( smooth compact gravel :traction coefficient 0.60) for descents less than 1.5 kilometers
Cummulative distance prior
to pitch
Average grade
prior to pitch
Critical pitch grade
Critical pitch length (m) Cummulative distance prior
to pitch
Average grade
prior to pitch
Critical pitch grade
Critical pitch length (m)
(km) (%) (%) 50 100 200 300 (km) (%) (%) 50 100 200 300 0.5 10 20
22 24 26 28 30
46 46 44 40 38 34
44 44 42 38 36 32
44 42 40 36 36 -
44 42 40 36 36 -
0.5 18 20 22 24 26 28 30
42 42 40 38 36 34
42 42 40 36 34 32
40 40 38 36 34 -
40 40 38 36 34 -
0.5 13 20 22 24 26 28 30
44 44 44 40 38 34
44 42 42 38 36 32
44 42 40 36 34 -
44 42 40 36 34 -
0.5 20 20 22 24 26 28 30
42 42 40 38 36 34
42 42 40 36 34 32
40 40 38 36 34 -
40 40 38 36 34 -
0.5 22 22 24 26 28 30
40 40 38 36 34
40 40 36 34 32
38 38 36 34 -
38 38 34 34 -
0.5 15 20 22 24 26 28 30
42 42 42 40 38 34
42 42 40 36 34 32
42 40 40 36 34 -
40 40 40 36 34 - 0.5 24 24
26 28 30
38 36 36 34
38 34 34 32
36 34 34 -
36 34 34 -
0.5 26 26 28 30
36 36 34
34 34 32
34 34 -
34 34 -
0.5 28 28 30
34 32
34 32
34 -
34 -
1.5 10 20 22 24 26 28 30
46 46 44 40 38 34
44 44 40 36 34 32
44 42 40 36 34 -
44 42 40 36 34 -
1.5 18 20 22 24 26 28 30
42 42 40 38 36 32
42 42 38 36 34 30
40 40 38 34 34 -
40 40 38 34 34 -
1.5 13 20 22 24 26 28 30
44 44 42 40 38 34
44 42 38 36 34 32
44 42 38 34 34 -
44 40 38 34 34 -
1.5 20 20 22 24 26 28 30
42 42 40 38 36 32
42 42 38 36 34 30
40 40 38 34 34 -
40 40 38 34 34 -
1.5 15 20 22 24 26 28 30
42 42 40 38 36 32
42 42 38 36 34 30
42 40 38 34 34 -
40 40 38 34 34 -
1.5 22 22 24 26 28 30
40 38 36 36 32
40 38 36 34 30
38 36 34 34 -
38 36 34 34 -
1.5 24 24 26 28 30
36 34 34 32
36 34 32 30
34 32 32 -
34 32 32 -
1.5 26 26 28 30
32 32 30
32 32 30
32 30 -
32 30 -
1.5 28 28 30
32 30
30 30
30 -
30 -
Note : ‘-‘ indicates no safe payload for this application Legal payload : 26 tonnes
Page III-14 RS2007-IG02
Table III- 7. Maximum payload (tonnes) – 5-axle –high traction ( smooth compact gravel :traction coefficient 0.60) for descents greater than 1.5 kilometers
Cummulative distance prior
to pitch
Average grade
prior to pitch
Critical pitch grade
Critical pitch length (m) Cummulative distance prior
to pitch
Average grade
prior to pitch
Critical pitch grade
Critical pitch length (m)
(km) (%) (%) 50 100 200 300 (km) (%) (%) 50 100 200 300 3.0 10 20
22 24 26 28 30
46 46 44 40 38 34
44 44 40 36 34 32
44 42 40 36 34 -
44 42 40 36 34 -
3.0 18 20 22 24 26 28 30
42 42 40 38 36 32
42 42 38 36 34 30
40 40 38 34 34 -
40 40 38 34 34 -
3.0 13 20 22 24 26 28 30
44 44 42 40 38 34
44 42 38 36 34 30
44 42 38 34 34 -
44 40 38 34 34 -
3.0 20 20 22 24 26 28 30
42 42 40 38 36 32
42 42 38 36 34 30
40 40 38 34 34 -
40 40 38 34 34 -
3.0 22 22 24 26 28 30
36 36 34 34 32
36 34 34 32 30
36 34 32 32 -
36 34 32 32 -
3.0 15 20 22 24 26 28 30
42 42 40 38 36 32
42 42 38 36 34 30
42 40 38 34 34 -
40 40 38 34 34 -
3.0 26 26 28 30
28 28 28
28 28 26
28 28 -
28 28 -
3.0 24 24 26 28 30
34 32 32 30
32 30 30 28
32 30 30 -
32 30 30 -
5.0 10 20 22 24 26 28 30
46 46 44 40 38 34
44 44 40 36 34 30
44 42 40 36 34 -
44 42 40 36 34 -
5.0 18 20 22 24 26 28 30
42 42 40 38 36 32
42 42 38 36 34 30
42 40 38 34 34 -
40 40 38 34 34 -
5.0 13 20 22 24 26 28 30
44 44 42 40 38 34
44 42 38 36 34 30
44 42 38 34 34 -
44 40 38 34 34 -
5.0 20 20 22 24 26 28 30
42 42 40 38 36 32
42 42 38 36 34 30
40 40 38 34 34 -
40 40 38 34 34 -
5.0 22 22 24 26 28 30
34 34 32 32 32
34 34 32 32 30
34 32 32 30 -
34 32 32 30 -
5.0 15 20 22 24 26 28 30
42 42 40 38 36 32
42 42 38 36 34 30
42 40 38 34 34 -
40 40 38 34 34 - 5.0 24 24
26 28 30
30 30 30 28
30 30 28 26
30 28 28 -
30 28 28 -
Note : ‘-‘ indicates no safe payload for this application Legal payload : 26 tonnes
Page III-15 RS2007-IG02
Table III- 8. Maximum payload (tonnes) – 6-axle – very low traction (snow/ice :traction coefficient 0.20)
Cummulative distance prior
to pitch
Average grade
prior to pitch
Critical pitch grade
Critical pitch length (m) Cummulative distance prior
to pitch
Average grade
prior to pitch
Critical pitch grade
Critical pitch length (m)
(km) (%) (%) 50 100 200 300 (km) (%) (%) 50 100 200 300 0.5 10 10
12 14 16 18
52 52 52 52 -
52 52 52 - -
52 52 52 - -
52 52 52 - -
1.5 10 10 12 14 16 18
52 52 52 52 -
52 52 52 - -
52 52 52 - -
52 52 52 - -
0.5 13 14 16 18
52 48 -
52 - -
52 - -
52 - -
1.5 13 14 16 18
44 44 -
44 - -
42 - -
42 - -
0.5 15 16 18
- -
- -
- -
- -
1.5 15 16 18
- -
- -
- -
- -
3 10 10 12 14 16 18
40 40 38 38 -
38 38 38 - -
38 38 38 - -
38 38 38 - -
5 10 10 12 14 16 18
32 32 32 32 -
32 32 32 - -
32 32 32 - -
32 32 32 - -
3 13 14 16 18
32 32 -
32 - -
32 - -
32 - -
5 13 14 16 18
28 28 -
28 - -
28 - -
28 - -
3 15 16 18
- -
- -
- -
- -
5 15 16 18
- -
- -
- -
- -
Note : ‘-‘ indicates no safe payload for this application Legal payload : 33 tonnes
Page III-16 RS2007-IG02

Table III- 9. Maximum payload (tonnes) – 6-axle –low traction (loose gravel/wet hardpan :traction coefficient 0.30) for descents less than 1.5 kilometers
Cummulative distance prior
to pitch
Average grade
prior to pitch
Critical pitch grade
Critical pitch length (m) Cummulative distance prior
to pitch
Average grade
prior to pitch
Critical pitch grade
Critical pitch length (m)
(km) (%) (%) 50 100 200 300 (km) (%) (%) 50 100 200 300 0.5 10 20
22 24 26 28
52 52 52 52 -
52 52 52 - -
52 52 52 - -
52 52 52 - -
0.5 18 20 22 24 26 28
52 52 50 46 -
52 52 46 - -
50 50 44 - -
50 50 44 - -
0.5 13 20 22 24 26 28
52 52 52 48 -
52 52 50 - -
52 52 50 - -
52 52 50 - -
0.5 20 20 22 24 26 28
50 50 48 44 -
50 48 44 - -
48 46 42 - -
46 46 42 - -
0.5 22 22 24 26 28
50 46 - -
48 44 - -
46 42 - -
46 42 - -
0.5 15 20 22 24 26 28
52 52 52 48 -
52 52 50 - -
52 52 48 - -
52 52 48 - - 0.5 24 24
26 28
44 - -
44 - -
42 - -
42 - -
1.5 10 20 22 24 26 28
52 52 52 50 -
52 52 52 - -
52 52 50 - -
52 52 48 - -
1.5 18 20 22 24 26 28
36 34 32 - -
32 32 30 - -
32 32 30 - -
32 32 30 - -
1.5 13 20 22 24 26 28
52 52 50 46 -
52 52 48 - -
52 50 46 - -
52 50 46 - -
1.5 20 20 22 24 26 28
28 26 26 - -
26 26 24 - -
26 26 24 - -
26 26 24 - -
1.5 22 22 24 26 28
- - - -
- - - -
- - - -
- - - -
1.5 15 20 22 24 26 28
48 48 44 40 -
48 44 42 - -
48 44 40 - -
46 42 38 - - 1.5 24 24
26 28
- - -
- - -
- - -
- - -
Note : ‘-‘ indicates no safe payload for this application Legal payload : 33 tonnes
Page III-17 RS2007-IG02
Table III- 10. Maximum payload (tonnes) – 6-axle –low traction (loose gravel/wet hardpan :traction coefficient 0.30) for descents greater than 1.5 kilometers
Cummulative distance prior
to pitch
Average grade
prior to pitch
Critical pitch grade
Critical pitch length (m) Cummulative distance prior
to pitch
Average grade
prior to pitch
Critical pitch grade
Critical pitch length (m)
(km) (%) (%) 50 100 200 300 (km) (%) (%) 50 100 200 300 3.0 10 20
22 24 26 28
52 52 50 46 -
52 48 46 - -
52 48 46 - -
52 48 44 - -
3.0 18 20 22 24 26 28
20 20 20 - -
20 20 20 - -
20 20 20 - -
20 20 20 - -
3.0 13 20 22 24 26 28
44 42 40 38 -
42 40 40 - -
42 40 38 - -
42 40 38 - -
3.0 20 20 22 24 26 28
- - - - -
- - - - -
- - - - -
- - - - -
3.0 22 22 24 26 28
- - - -
- - - -
- - - -
- - - -
3.0 15 20 22 24 26 28
30 30 30 30 -
30 30 30 - -
30 30 28 - -
30 30 28 - - 3.0 24 24
26 28
- - -
- - -
- - -
- - -
5 10 20 22 24 26 28
52 52 50 46 -
52 48 46 - -
52 48 40 - -
52 48 40 - -
5 18 20 22 24 26 28
- - - - -
- - - - -
- - - - -
- - - - -
5 13 20 22 24 26 28
38 38 36 34 -
38 36 34 - -
36 34 32 - -
36 34 32 - -
5 20 20 22 24 26 28
- - - - -
- - - - -
- - - - -
- - - - -
5 22 22 24 26 28
- - - -
- - - -
- - - -
- - - -
5 15 20 22 24 26 28
24 24 24 - -
24 24 22 - -
24 22 - - -
24 22 - - - 5 24 24
26 28
- - -
- - -
- - -
- - -
Note : ‘-‘ indicates no safe payload for this application Legal payload : 33 tonnes
Page III-18 RS2007-IG02
Table III- 11. Maximum payload (tonnes) – 6-axle –moderate traction (compact gravel :traction coefficient 0.45) for descents less than 1.5 kilometers
Cummulative distance prior
to pitch
Average grade
prior to pitch
Critical pitch grade
Critical pitch length (m) Cummulative distance prior
to pitch
Average grade
prior to pitch
Critical pitch grade
Critical pitch length (m)
(km) (%) (%) 50 100 200 300 (km) (%) (%) 50 100 200 300 0.5 10 20
22 24 26 28
52 52 52 52 52
52 52 52 48 46
52 52 52 48 46
52 52 52 48 44
0.5 18 20 22 24 26 28
52 52 52 50 46
52 52 50 46 42
52 52 50 46 42
52 50 48 44 40
0.5 13 20 22 24 26 28
52 52 52 52 50
52 52 52 48 44
52 52 52 48 44
52 52 52 46 42
0.5 20 20 22 24 26 28
52 52 52 50 46
52 52 50 46 42
52 52 50 46 42
52 50 48 44 40
0.5 22 22 24 26 28
50 50 48 44
50 50 46 42
50 48 44 42
50 48 44 40
0.5 15 20 22 24 26 28
52 52 52 52 48
52 52 52 48 44
52 52 52 48 44
52 52 50 46 42 0.5 24 24
26 28
48 44 42
46 44 40
46 42 40
44 42 38
1.5 10 20 22 24 26 28
52 52 52 50 46
52 52 50 46 42
52 52 48 44 42
52 52 48 44 40
1.5 18 20 22 24 26 28
46 46 44 42 40
46 46 42 40 38
46 44 42 38 36
46 44 42 38 36
1.5 13 20 22 24 26 28
52 52 52 48 44
52 52 48 44 42
52 50 46 42 40
52 50 46 42 40
1.5 20 20 22 24 26 28
38 38 36 34 32
38 36 36 32 30
36 36 34 30 30
36 36 34 30 30
1.5 22 22 24 26 28
34 34 32 30
32 32 30 28
32 30 28 26
32 30 28 26
1.5 15 20 22 24 26 28
52 52 52 48 44
52 52 48 44 42
52 50 46 42 40
52 50 46 42 40 1.5 24 24
26 28
24 24 24
22 22 22
22 22 20
22 22 20
Note : Legal payload : 33 tonnes
Page III-19 RS2007-IG02
Table III- 12. Maximum payload (tonnes) – 6-axle –moderate traction (compact gravel :traction coefficient 0.45) for descents greater than 1.5 kilometers
Cummulative distance prior
to pitch
Average grade
prior to pitch
Critical pitch grade
Critical pitch length (m) Cummulative distance prior
to pitch
Average grade
prior to pitch
Critical pitch grade
Critical pitch length (m)
(km) (%) (%) 50 100 200 300 (km) (%) (%) 50 100 200 300 3.0 10 20
22 24 26 28
52 52 50 46 44
52 48 46 44 40
52 48 46 42 40
52 48 44 42 38
3.0 18 20 22 24 26 28
38 38 36 36 34
38 36 36 34 32
36 36 34 34 32
36 34 34 34 32
3.0 13 20 22 24 26 28
52 50 48 46 44
52 48 46 44 40
50 48 46 42 40
50 48 44 42 38
3.0 20 20 22 24 26 28
26 26 26 26 26
26 26 26 24 24
26 26 24 24 24
26 26 24 24 24
3.0 22 22 24 26 28
- - - -
- - - -
- - - -
- - - -
3.0 15 20 22 24 26 28
50 48 46 44 42
48 46 44 42 40
48 44 42 42 40
48 44 42 40 38 3.0 24 24
26 28
- - -
- - -
- - -
- - -
5 10 20 22 24 26 28
52 52 50 46 44
52 48 46 44 40
52 48 46 42 40
52 48 44 42 38
5 18 20 22 24 26 28
26 26 26 26 26
26 26 24 24 24
24 24 24 24 24
24 24 24 24 24
5 13 20 22 24 26 28
52 50 48 46 44
50 48 46 44 40
50 48 46 42 40
50 48 44 42 38
5 20 20 22 24 26 28
- - - - -
- - - - -
- - - - -
- - - - -
5 22 22 24 26 28
- - - -
- - - -
- - - -
- - - -
5 15 20 22 24 26 28
44 42 40 38 38
42 40 38 38 36
40 40 38 36 34
40 38 38 36 34 5 24 24
26 28
- - -
- - -
- - -
- - -
Note : ‘-‘ indicates no safe payload for this application Legal payload : 33 tonnes
Page III-20 RS2007-IG02
Table III- 13. Maximum payload (tonnes) – 6-axle –high traction ( smooth compact gravel :traction coefficient 0.60) for descents less than 1.5 kilometers
Cummulative distance prior
to pitch
Average grade
prior to pitch
Critical pitch grade
Critical pitch length (m) Cummulative distance prior
to pitch
Average grade
prior to pitch
Critical pitch grade
Critical pitch length (m)
(km) (%) (%) 50 100 200 300 (km) (%) (%) 50 100 200 300 0.5 10 20
22 24 26 28 30
52 52 52 52 52 52
52 52 52 48 46 44
52 52 52 48 46 -
52 52 52 48 46 -
0.5 18 20 22 24 26 28 30
52 52 52 50 50 48
52 52 52 48 46 42
52 52 52 48 46 -
52 52 52 48 44 -
0.5 13 20 22 24 26 28 30
52 52 52 52 52 52
52 52 52 48 46 44
52 52 52 48 46 -
52 52 52 48 46 -
0.5 20 20 22 24 26 28 30
52 52 52 50 50 46
52 52 52 48 46 42
52 52 52 46 46 -
52 52 52 46 44 -
0.5 22 22 24
Page III-21 RS2007-IG02
26 28 30
52 52 50 50 46
52 52 48 46 42
52 52 48 46 -
52 50 46 44 -
0.5 15 20 22 24 26 28 30
52 52 52 52 52 50
52 52 52 48 46 42
52 52 52 48 46 -
52 52 52 48 46 - 0.5 24 24
26 28 30
52 48 46 44
52 46 44 42
50 46 44 -
50 46 44 -
0.5 26 26 28 30
46 46 42
46 44 40
44 42 -
44 42 -
0.5 28 28 30
44 42
44 40
42 -
42 -
1.5 10 20 22 24 26 28 30
52 52 52 52 50 48
52 52 52 48 46 42
52 52 52 46 44 -
52 52 50 46 44 -
1.5 18 20 22 24 26 28 30
48 46 46 44 42 40
48 46 44 42 40 38
46 46 44 42 40 -
46 46 44 40 38 -
1.5 13 20 22 24 26 28 30
52 52 52 52 50 46
52 52 52 48 46 42
52 52 52 46 44 -
52 52 50 46 44 -
1.5 20 20 22 24 26 28 30
44 44 42 42 40 38
44 44 42 40 38 36
44 42 40 38 38 -
44 42 40 38 36 -
1.5 15 20 22 24 26 28 30
52 52 52 50 48 44
52 52 50 46 44 42
52 50 50 44 44 -
52 50 48 44 42 -
1.5 22 22 24 26 28 30
44 42 42 40 38
44 42 40 38 36
42 40 38 38 -
42 40 38 36 -
1.5 24 24 26 28 30
40 38 38 36
40 38 36 34
40 38 36 -
38 36 36 -
1.5 26 26 28 30
26 26 26
26 26 26
26 26 -
26 26 -
1.5 28 28 30
24 24
24 24
24 -
24 -
Note : ‘-‘ indicates no safe payload for this application Legal payload : 33 tonnes
Table III- 14. Maximum payload (tonnes) – 6-axle –high traction ( smooth compact gravel :traction coefficient 0.60) for descents greater than 1.5 kilometers
Cummulative distance prior
to pitch
Average grade
prior to pitch
Critical pitch grade
Critical pitch length (m) Cummulative distance prior
to pitch
Average grade
prior to pitch
Critical pitch grade
Critical pitch length (m)
(km) (%) (%) 50 100 200 300 (km) (%) (%) 50 100 200 300 3.0 10 20
22 24 26 28 30
52 52 52 52 50 48
52 52 52 48 46 42
52 52 52 46 44 -
52 52 50 46 44 -
3.0 18 20 22 24 26 28 30
48 46 44 44 42 40
48 46 44 42 40 38
46 44 42 40 40 -
46 44 42 40 38 -
3.0 13 20 22 24 26 28 30
52 52 52 52 50 46
52 52 52 48 46 42
52 52 52 46 44 -
52 52 50 46 44 -
3.0 20 20 22 24 26 28 30
44 44 42 40 40 38
44 42 40 38 38 36
42 40 38 36 36 -
42 40 38 36 36 -
3.0 22 22 24 26 28 30
38 36 36 36 34
38 36 34 34 32
38 36 34 34 -
38 36 34 34 -
3.0 15 20 22 24 26 28 30
52 52 52 50 48 44
52 52 50 46 44 42
52 50 50 44 44 -
52 50 48 44 42 -
3.0 26 26 28 30
- - -
- - -
- - -
- - -
3.0 24 24 26 28 30
20 20 20 20
20 20 20 20
20 20 20 -
20 20 20 -
5.0 10 20 22 24 26 28 30
52 52 52 52 50 48
52 52 52 48 46 42
52 52 52 46 44 -
52 52 50 46 44 -
5.0 18 20 22 24 26 28 30
44 44 42 40 40 38
44 42 40 38 38 36
42 40 40 38 38 -
42 40 40 38 38 -
5.0 13 20 22 24 26 28 30
52 52 52 52 50 46
52 52 52 48 46 42
52 52 52 46 44 -
52 52 50 46 44 -
5.0 20 20 22 24 26 28 30
40 38 38 36 36 34
38 38 36 36 34 32
38 38 36 34 34 -
38 38 36 34 34 -
5.0 22 22 24 26 28 30
34 34 32 32 32
34 34 32 32 30
34 32 30 30 -
34 32 30 30 -
5.0 15 20 22 24 26 28 30
52 52 52 50 48 44
52 52 50 46 44 42
52 50 50 44 44 -
52 50 48 44 42 - 5.0 24 24
26 28 30
- - - -
- - - -
- - - -
- - - -
Note : ‘-‘ indicates no safe payload for this application Legal payload : 33 tonnes
Page III-22 RS2007-IG02
Table III- 15. Maximum payload (tonnes) – 7-axle – very low traction (snow/ice :traction coefficient 0.20)
Cummulative distance prior
to pitch
Average grade
prior to pitch
Critical pitch grade
Critical pitch length (m) Cummulative distance prior
to pitch
Average grade
prior to pitch
Critical pitch grade
Critical pitch length (m)
(km) (%) (%) 50 100 200 300 (km) (%) (%) 50 100 200 300 0.5 10 10
12 14 16 18
60 60 60 52 -
60 60 60 - -
60 60 60 - -
60 60 60 - -
1.5 10 10 12 14 16 18
60 60 60 52 -
60 60 60 - -
60 60 60 - -
60 60 60 - -
0.5 13 14 16 18
60 52 -
60 - -
60 - -
60 - -
1.5 13 14 16 18
60 52 -
60 - -
60 - -
60 - -
0.5 15 16 18
50 -
- -
- -
- -
1.5 15 16 18
48 -
- -
- -
- -
3 10 10 12 14 16 18
60 60 60 52 -
60 60 60 - -
60 60 60 - -
60 60 60 - -
5 10 10 12 14 16 18
60 60 60 52 -
60 60 60 - -
60 60 60 - -
60 60 60 - -
3 13 14 16 18
50 46 -
50 - -
50 - -
50 - -
5 13 14 16 18
38 34 -
38 - -
38 - -
38 - -
3 15 16 18
- -
- -
- -
- -
5 15 16 18
- -
- -
- -
- -
Note : ‘-‘ indicates no safe payload for this application Legal payload : 40 tonnes
Page III-23 RS2007-IG02
Table III- 16. Maximum payload (tonnes) – 7-axle –low traction (loose gravel/wet hardpan :traction coefficient 0.30) for descents less than 1.5 kilometers
Cummulative distance prior
to pitch
Average grade
prior to pitch
Critical pitch grade
Critical pitch length (m) Cummulative distance prior
to pitch
Average grade
prior to pitch
Critical pitch grade
Critical pitch length (m)
(km) (%) (%) 50 100 200 300 (km) (%) (%) 50 100 200 300 0.5 10 20
22 24 26 28
60 60 60 50 -
60 60 56 - -
60 60 54 - -
60 60 52 - -
0.5 18 20 22 24 26 28
60 60 60 - -
60 60 56 - -
60 60 54 - -
60 60 52 - -
0.5 13 20 22 24 26 28
60 60 60 50 -
60 60 56 - -
60 60 54 - -
60 60 52 - -
0.5 20 20 22 24 26 28
60 60 58 - -
60 60 54 - -
58 58 54 - -
58 58 52 - -
0.5 22 22 24 26 28
60 56 - -
60 54 - -
58 52 - -
58 52 - -
0.5 15 20 22 24 26 28
60 60 60 - -
60 60 56 - -
60 60 54 - -
60 60 52 - - 0.5 24 24
26 28
- - -
- - -
- - -
- - -
1.5 10 20 22 24 26 28
60 60 60 50 -
60 60 56 - -
60 60 54 - -
60 60 52 - -
1.5 18 20 22 24 26 28
58 54 52 - -
56 52 48 - -
54 50 - - -
54 50 - - -
1.5 13 20 22 24 26 28
60 60 56 50 -
60 58 52 - -
60 56 50 - -
60 56 50 - -
1.5 20 20 22 24 26 28
48 46 44 - -
48 44 42 - -
46 42 - - -
46 42 - - -
1.5 22 22 24 26 28
34 34 - -
34 32 - -
32 - - -
32 - - -
1.5 15 20 22 24 26 28
60 60 56 - -
60 56 50 - -
58 54 48 - -
58 54 48 - - 1.5 24 24
26 28
- - -
- - -
- - -
- - -
Note : ‘-‘ indicates no safe payload for this application Legal payload : 40 tonnes
Page III-24 RS2007-IG02
Table III- 17. Maximum payload (tonnes) – 7-axle –low traction (loose gravel/wet hardpan :traction coefficient 0.30) for descents greater than 1.5 kilometers
Cummulative distance prior
to pitch
Average grade
prior to pitch
Critical pitch grade
Critical pitch length (m) Cummulative distance prior
to pitch
Average grade
prior to pitch
Critical pitch grade
Critical pitch length (m)
(km) (%) (%) 50 100 200 300 (km) (%) (%) 50 100 200 300 3.0 10 20
22 24 26 28
60 58 54 - -
58 54 50 - -
56 52 48 - -
56 52 48 - -
3.0 18 20 22 24 26 28
28 28 - - -
28 28 - - -
28 26 - - -
28 26 - - -
3.0 13 20 22 24 26 28
54 52 50 - -
52 50 46 - -
50 48 44 - -
50 48 44 - -
3.0 20 20 22 24 26 28
22 22 - - -
22 22 - - -
22 20 - - -
22 20 - - -
3.0 22 22 24 26 28
- - - -
- - - -
- - - -
- - - -
3.0 15 20 22 24 26 28
54 52 48 - -
52 50 46 - -
50 48 44 - -
50 48 44 - - 3.0 24 24
26 28
- - -
- - -
- - -
- - -
5 10 20 22 24 26 28
60 58 54 - -
58 54 50 - -
56 52 48 - -
56 52 48 - -
5 18 20 22 24 26 28
20 20 - - -
20 20 - - -
20 20 - - -
20 20 - - -
5 13 20 22 24 26 28
54 52 50 - -
52 50 - - -
50 48 - - -
50 48 - - -
5 20 20 22 24 26 28
- - - - -
- - - - -
- - - - -
- - - - -
5 22 22 24 26 28
- - - -
- - - -
- - - -
- - - -
5 15 20 22 24 26 28
50 48 46 - -
48 46 - - -
46 44 - - -
46 44 - - - 5 24 24
26 28
- - -
- - -
- - -
- - -
Note : ‘-‘ indicates no safe payload for this application Legal payload : 40 tonnes
Page III-25 RS2007-IG02

Table III- 18. Maximum payload (tonnes) – 7-axle –moderate traction (compact gravel :traction coefficient 0.45) for descents less than 1.5 kilometers
Cummulative distance prior
to pitch
Average grade
prior to pitch
Critical pitch grade
Critical pitch length (m) Cummulative distance prior
to pitch
Average grade
prior to pitch
Critical pitch grade
Critical pitch length (m)
(km) (%) (%) 50 100 200 300 (km) (%) (%) 50 100 200 300 0.5 10 20
22 24 26 28
60 60 60 58 54
60 60 60 56 52
60 60 60 56 52
60 60 60 56 50
0.5 18 20 22 24 26 28
60 60 60 56 52
60 60 60 54 50
60 60 58 54 48
60 60 58 54 48
0.5 13 20 22 24 26 28
60 60 60 58 52
60 60 60 56 50
60 60 60 56 50
60 60 60 56 50
0.5 20 20 22 24 26 28
60 60 60 56 52
60 60 60 54 50
60 60 58 54 48
60 60 58 54 48
0.5 22 22 24 26 28
60 60 56 52
60 60 54 50
60 58 54 48
60 58 54 48
0.5 15 20 22 24 26 28
60 60 60 58 52
60 60 60 56 50
60 60 60 54 50
60 60 60 54 50 0.5 24 24
26 28
60 56 52
60 54 50
58 54 48
58 54 48
1.5 10 20 22 24 26 28
60 60 60 56 50
60 60 58 54 48
60 60 56 52 48
60 60 56 52 48
1.5 18 20 22 24 26 28
60 60 56 52 48
60 56 52 50 46
60 56 52 48 44
60 56 52 48 44
1.5 13 20 22 24 26 28
60 60 56 52 48
60 58 54 50 46
60 56 52 48 44
60 56 52 48 44
1.5 20 20 22 24 26 28
60 58 54 50 48
60 56 52 50 46
58 54 50 48 44
58 54 50 48 44
1.5 22 22 24 26 28
52 50 48 46
52 50 46 44
52 48 46 42
52 48 46 42
1.5 15 20 22 24 26 28
60 60 56 52 48
60 56 52 50 46
60 56 52 48 44
60 56 52 48 44 1.5 24 24
26 28
38 36 34
38 36 34
36 34 32
36 34 32
Note : Legal payload : 40 tonnes
Page III-26 RS2007-IG02
Table III- 19. Maximum payload (tonnes) – 7-axle –moderate traction (compact gravel :traction coefficient 0.45) for descents greater than 1.5 kilometers
Cummulative distance prior
to pitch
Average grade
prior to pitch
Critical pitch grade
Critical pitch length (m) Cummulative distance prior
to pitch
Average grade
prior to pitch
Critical pitch grade
Critical pitch length (m)
(km) (%) (%) 50 100 200 300 (km) (%) (%) 50 100 200 300 3.0 10 20
22 24 26 28
60 60 56 52 48
60 56 52 50 46
60 56 52 48 44
60 56 52 48 44
3.0 18 20 22 24 26 28
52 50 50 48 44
52 50 48 46 42
52 50 48 44 40
52 50 48 44 40
3.0 13 20 22 24 26 28
56 54 52 48 44
54 52 48 46 42
52 50 48 44 40
52 50 48 44 40
3.0 20 20 22 24 26 28
50 48 48 46 44
50 48 46 44 42
50 48 46 44 40
50 48 46 44 40
3.0 22 22 24 26 28
44 42 42 40
44 42 40 40
44 42 40 38
44 42 40 38
3.0 15 20 22 24 26 28
56 54 52 48 44
54 52 48 46 42
52 50 48 44 40
52 50 48 44 40 3.0 24 24
26 28
24 24 24
24 24 22
24 22 20
24 22 20
5 10 20 22 24 26 28
60 58 54 52 48
58 56 52 50 46
58 56 52 48 44
58 54 52 48 44
5 18 20 22 24 26 28
52 50 48 46 44
52 50 48 46 42
50 48 46 44 40
50 48 46 44 40
5 13 20 22 24 26 28
56 54 52 48 44
54 52 48 46 42
52 50 48 44 40
52 50 48 44 40
5 20 20 22 24 26 28
46 46 44 40 40
46 46 44 40 40
46 44 42 40 38
46 44 42 40 38
5 22 22 24 26 28
40 40 38 38
40 40 38 36
40 38 36 36
40 38 36 36
5 15 20 22 24 26 28
56 54 52 48 44
54 52 48 46 42
52 50 48 44 40
52 50 48 44 40 5 24 24
26 28
- - -
- - -
- - -
- - -
Note : ‘-‘ indicates no safe payload for this application Legal payload : 40 tonnes
Page III-27 RS2007-IG02

Table III- 20. Maximum payload (tonnes) – 7-axle –high traction ( smooth compact gravel :traction coefficient 0.60) for descents less than 1.5 kilometers
Cummulative distance prior
to pitch
Average grade
prior to pitch
Critical pitch grade
Critical pitch length (m) Cummulative distance prior
to pitch
Average grade
prior to pitch
Critical pitch grade
Critical pitch length (m)
(km) (%) (%) 50 100 200 300 (km) (%) (%) 50 100 200 300 0.5 10 20
22 24 26 28 30
60 60 60 60 58 52
60 60 60 56 54 48
60 60 60 56 54 -
60 60 60 56 52 -
0.5 18 20 22 24 26 28 30
60 60 60 58 58 52
60 60 60 56 52 48
60 60 58 54 52 -
60 60 58 54 52 -
0.5 13 20 22 24 26 28 30
60 60 60 60 58 52
60 60 60 56 54 48
60 60 60 56 54 -
60 60 60 56 52 -
0.5 20 20 22 24 26 28 30
60 60 60 58 56 52
60 60 60 56 52 48
60 60 58 54 52 -
60 60 58 54 52 -
0.5 22 22 24 26 28 30
60 60 58 54 50
60 60 56 52 48
60 58 54 52 -
60 58 54 52 -
0.5 15 20 22 24 26 28 30
60 60 60 60 58 52
60 60 60 56 52 48
60 60 60 54 52 -
60 60 60 54 52 - 0.5 24 24
26 28 30
60 56 52 48
60 56 52 48
58 54 52 -
58 54 52 -
0.5 26 26 28 30
56 52 48
56 52 48
54 52 -
54 52 -
0.5 28 28 30
50 48
50 48
50 -
50 -
1.5 10 20 22 24 26 28 30
60 60 60 60 56 52
60 60 60 54 52 48
60 60 58 54 52 -
60 60 58 54 50 -
1.5 18 20 22 24 26 28 30
60 60 60 56 54 50
60 60 56 52 50 46
60 58 54 50 50 -
60 58 54 50 48 -
1.5 13 20 22 24 26 28 30
60 60 60 56 54 50
60 60 56 52 50 46
60 58 54 52 50 -
60 58 54 52 48 -
1.5 20 20 22 24 26 28 30
60 60 60 56 54 50
60 60 56 52 50 46
60 58 54 50 50 -
60 58 54 50 48 -
1.5 22 22 24 26 28 30
60 60 56 54 50
60 56 52 50 46
58 54 50 50 -
58 54 50 48 -
1.5 15 20 22 24 26 28 30
60 60 60 56 54 50
60 60 56 52 50 46
60 58 54 50 50 -
60 58 54 50 48 - 1.5 24 24
26 28 30
56 54 52 48
56 52 50 46
54 50 50 -
54 50 48 -
1.5 26 26 28 30
52 50 48
52 50 46
50 50 -
50 48 -
1.5 28 28 30
40 38
40 38
40 -
40 -
Note : ‘-‘ indicates no safe payload for this application Legal payload : 40 tonnes
Page III-28 RS2007-IG02
Table III- 21. Maximum payload (tonnes) – 7-axle –high traction ( smooth compact gravel :traction coefficient 0.60) for descents greater than 1.5 kilometers
Cummulative distance prior
to pitch
Average grade
prior to pitch
Critical pitch grade
Critical pitch length (m) Cummulative distance prior
to pitch
Average grade
prior to pitch
Critical pitch grade
Critical pitch length (m)
(km) (%) (%) 50 100 200 300 (km) (%) (%) 50 100 200 300 3.0 10 20
22 24 26 28 30
60 60 60 58 56 52
60 60 56 52 50 48
60 60 56 52 50 -
60 60 56 52 50 -
3.0 18 20 22 24 26 28 30
60 60 60 56 54 50
60 60 56 52 50 46
60 58 54 50 50 -
60 58 54 50 48 -
3.0 13 20 22 24 26 28 30
60 60 60 58 54 52
60 60 56 52 50 48
60 60 56 52 50 -
60 60 56 52 50 -
3.0 20 20 22 24 26 28 30
60 60 60 56 54 50
60 60 56 52 50 46
60 58 54 50 50 -
60 58 54 50 48 -
3.0 22 22 24 26 28 30
58 56 54 54 50
58 56 52 50 46
58 54 50 50 -
58 54 50 48 -
3.0 15 20 22 24 26 28 30
60 60 60 56 54 50
60 60 56 52 50 46
60 60 56 52 50 -
60 60 56 52 50 -
3.0 26 26 28 30
46 46 44
46 46 44
46 44 -
46 44 -
3.0 24 24 26 28 30
52 50 50 48
52 50 48 46
52 48 48 -
52 48 48 -
5.0 10 20 22 24 26 28 30
60 60 60 58 56 52
60 60 56 52 50 48
60 60 56 52 50 -
60 60 56 52 50 -
5.0 18 20 22 24 26 28 30
60 60 60 56 54 50
60 60 56 52 50 46
60 58 54 50 50 -
60 58 54 50 48 -
5.0 13 20 22 24 26 28 30
60 60 60 58 54 52
60 60 56 52 50 48
60 60 56 52 50 -
60 60 56 52 50 -
5.0 20 20 22 24 26 28 30
60 60 58 56 54 50
60 60 56 52 50 46
60 58 54 50 50 -
60 58 54 50 48 -
5.0 22 22 24 26 28 30
54 54 52 52 50
56 54 52 50 46
54 52 50 50 -
54 52 50 48 -
5.0 15 20 22 24 26 28 30
60 60 60 56 54 50
60 60 56 52 50 46
60 60 56 52 50 -
60 60 56 52 50 - 5.0 24 24
26 28 30
50 48 48 46
50 48 46 44
48 46 46 -
48 46 46 -
Note : ‘-‘ indicates no safe payload for this application Legal payload : 40 tonnes
Page III-29 RS2007-IG02
Recommended