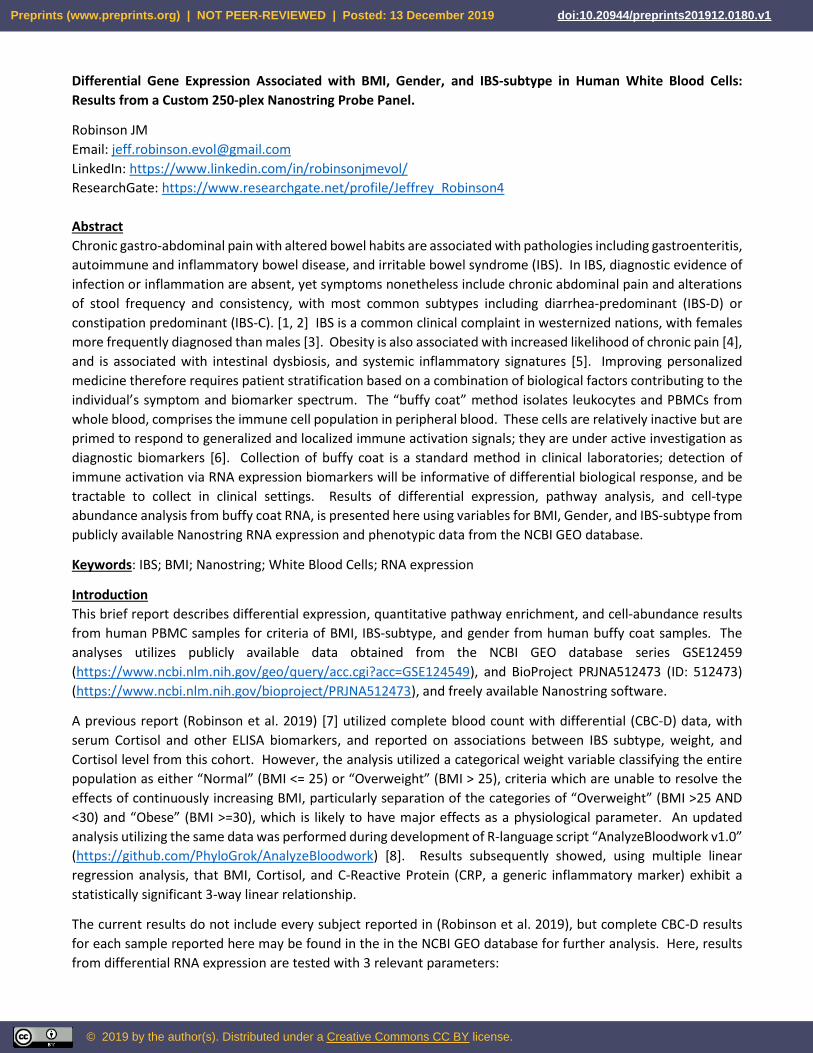
Differential Gene Expression Associated with BMI, Gender, and IBS-subtype in Human White Blood Cells:
Results from a Custom 250-plex Nanostring Probe Panel.
Robinson JM
Email: [email protected]
LinkedIn: https://www.linkedin.com/in/robinsonjmevol/
ResearchGate: https://www.researchgate.net/profile/Jeffrey_Robinson4
Abstract
Chronic gastro-abdominal pain with altered bowel habits are associated with pathologies including gastroenteritis,
autoimmune and inflammatory bowel disease, and irritable bowel syndrome (IBS). In IBS, diagnostic evidence of
infection or inflammation are absent, yet symptoms nonetheless include chronic abdominal pain and alterations
of stool frequency and consistency, with most common subtypes including diarrhea-predominant (IBS-D) or
constipation predominant (IBS-C). [1, 2] IBS is a common clinical complaint in westernized nations, with females
more frequently diagnosed than males [3]. Obesity is also associated with increased likelihood of chronic pain [4],
and is associated with intestinal dysbiosis, and systemic inflammatory signatures [5]. Improving personalized
medicine therefore requires patient stratification based on a combination of biological factors contributing to the
individual’s symptom and biomarker spectrum. The “buffy coat” method isolates leukocytes and PBMCs from
whole blood, comprises the immune cell population in peripheral blood. These cells are relatively inactive but are
primed to respond to generalized and localized immune activation signals; they are under active investigation as
diagnostic biomarkers [6]. Collection of buffy coat is a standard method in clinical laboratories; detection of
immune activation via RNA expression biomarkers will be informative of differential biological response, and be
tractable to collect in clinical settings. Results of differential expression, pathway analysis, and cell-type
abundance analysis from buffy coat RNA, is presented here using variables for BMI, Gender, and IBS-subtype from
publicly available Nanostring RNA expression and phenotypic data from the NCBI GEO database.
Keywords: IBS; BMI; Nanostring; White Blood Cells; RNA expression
Introduction
This brief report describes differential expression, quantitative pathway enrichment, and cell-abundance results
from human PBMC samples for criteria of BMI, IBS-subtype, and gender from human buffy coat samples. The
analyses utilizes publicly available data obtained from the NCBI GEO database series GSE12459
(https://www.ncbi.nlm.nih.gov/geo/query/acc.cgi?acc=GSE124549), and BioProject PRJNA512473 (ID: 512473)
(https://www.ncbi.nlm.nih.gov/bioproject/PRJNA512473), and freely available Nanostring software.
A previous report (Robinson et al. 2019) [7] utilized complete blood count with differential (CBC-D) data, with
serum Cortisol and other ELISA biomarkers, and reported on associations between IBS subtype, weight, and
Cortisol level from this cohort. However, the analysis utilized a categorical weight variable classifying the entire
population as either “Normal” (BMI <= 25) or “Overweight” (BMI > 25), criteria which are unable to resolve the
effects of continuously increasing BMI, particularly separation of the categories of “Overweight” (BMI >25 AND
<30) and “Obese” (BMI >=30), which is likely to have major effects as a physiological parameter. An updated
analysis utilizing the same data was performed during development of R-language script “AnalyzeBloodwork v1.0”
(https://github.com/PhyloGrok/AnalyzeBloodwork) [8]. Results subsequently showed, using multiple linear
regression analysis, that BMI, Cortisol, and C-Reactive Protein (CRP, a generic inflammatory marker) exhibit a
statistically significant 3-way linear relationship.
The current results do not include every subject reported in (Robinson et al. 2019), but complete CBC-D results
for each sample reported here may be found in the in the NCBI GEO database for further analysis. Here, results
from differential RNA expression are tested with 3 relevant parameters:
Preprints (www.preprints.org) | NOT PEER-REVIEWED | Posted: 13 December 2019 doi:10.20944/preprints201912.0180.v1
© 2019 by the author(s). Distributed under a Creative Commons CC BY license.
1. IBS subtype. Modeled as categorical independent variable, with separate tests for IBS-D and IBS-C relative to
controls, respectively. It must be stated that the control population is significantly larger than either IBS subtype,
which may influence the results of statistical tests.
2. BMI. DE tested with a linear model from continuous BMI data.
3. Gender. DE tested (arbitrarily) for female relative to male.
Methods
GEO series GSE12459 reports that buffy-coat samples were collected using Lympoprep density gradient protocol,
total RNA was extracted using the miRVana kit. This analysis includes RNA expression data from 97 samples
obtained from an adult population of mixed gender with a subset of individuals with IBS-D or IBS-C diagnosis.
The Nanostring 250-plex custom probe panel “ImmunoGC” is accessioned, with probe sequences, in the GEO
Platform GPL25966 (https://www.ncbi.nlm.nih.gov/geo/query/acc.cgi?acc=GPL25996). Additional probe panel
annotation data is provided here as well (Sup. File 1: Probe Panel Annotations). The probe panel is significantly
enriched for glucocorticoid-responsive immune genes, with citations provided in the supplementary file 1 [9-14].
The GSE12459 description lists the probe panel as an ad-hoc panel that includes probes for genes “1) reported
glucocorticoid immune responsiveness, 2) immune-cell type specific expression, 3) microRNA processing, and 4)
putative stress-associated biomarkers.”
Nanostring methodology is a multiplexed, direct-count method utilizing fluorescent bar-code probes labels with
automated library preparation and optical counting which does not require reverse-transcription or amplification
of RNA samples [15].
Analysis was performed using open-source software Nanostring nSolver 3.0, and Nanostring Advanced Analysis
Module 2.0 [16, 17]. Advanced analysis module includes a relative cellular abundance assay based on cell-type
specific genes, utilizing a validated, published algorithm [18]. Similar algorithms have been developed and
implemented independently, and are increasingly common for cell-type deconvolution (particularly for immune
cells) in heterogeneous samples [19-23].
Results and Discussion
Results presented below represent a selection of results the Nanostring Advanced Analysis Module 2.0 output.
The original output is html-formatted, and the complete results are provided here as .zip format files with the
complete results accessible via the html main menu and in the sub-directories (Sup. File 2: IBS-subtype analysis;
Sup. File 3: BMI analysis; Sup. File 4: Gender analysis).
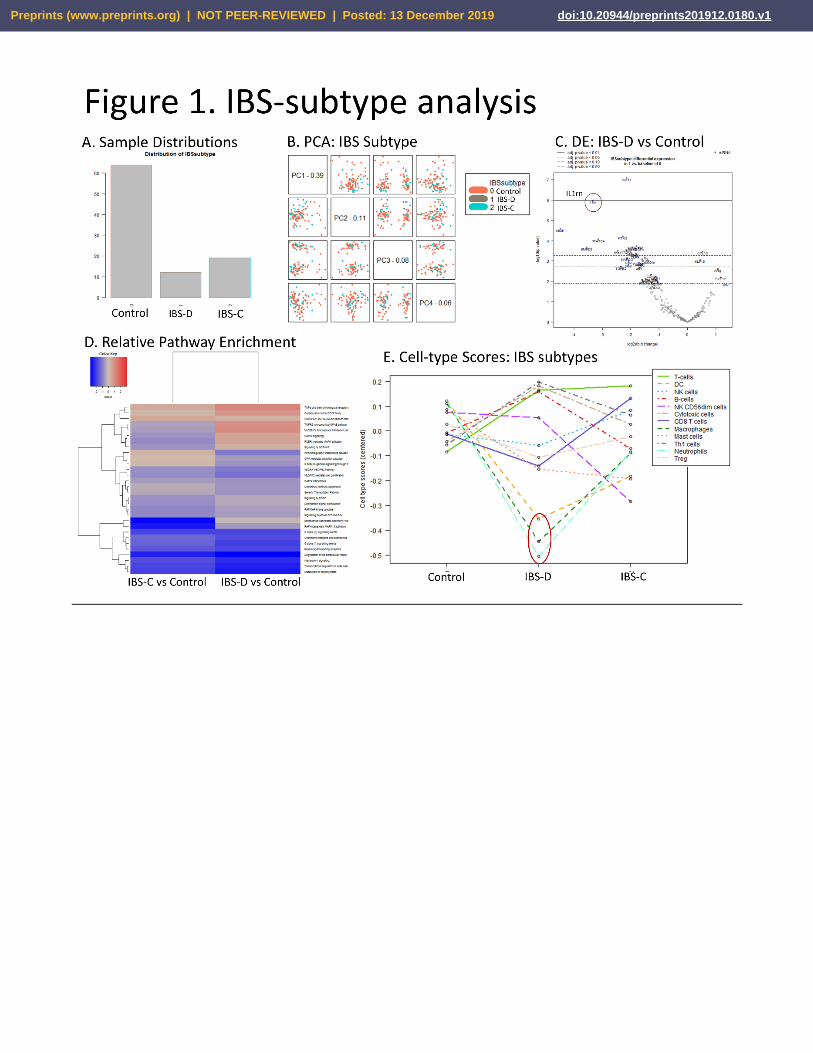
IBS-subtype. In the first analysis, IBS-D and IBS-C were compared to healthy controls (Fig. 1A). No signal between
these groups was seen in the PCA analysis (Fig. 1B). However, several genes were differentially expressed in IBS-
D vs. controls at p < .05 (Fig. 1C, Sup.2) including IL1rn, TLR2, and others, and in IBS-C vs. Control including IL-6
(Sup. File 2). In the gene set enrichment results, decreased pathway enrichment was observed in “Degradation
of extracellular matrix” and “Metabolism of carbohydrates” in both IBS-D and IBS-C vs. controls, and “RAF-
independent MAPK13 activation” specifically in IBS-C vs Controls (Fig. 1D, Sup. 2). Immune-cell abundance
analysis shows an apparent decrease in Neutrophils, Macrophages (Monocytes), and Dendritic Cells (Fig. 1E, Sup.
2). While gene-specific signal from these cells did not reach significance threshold, the decrease in Macrophage
abundance corresponds with observations previously reported from the CBC-D monocyte results from the same
cohort (Robinson et al. 2019).
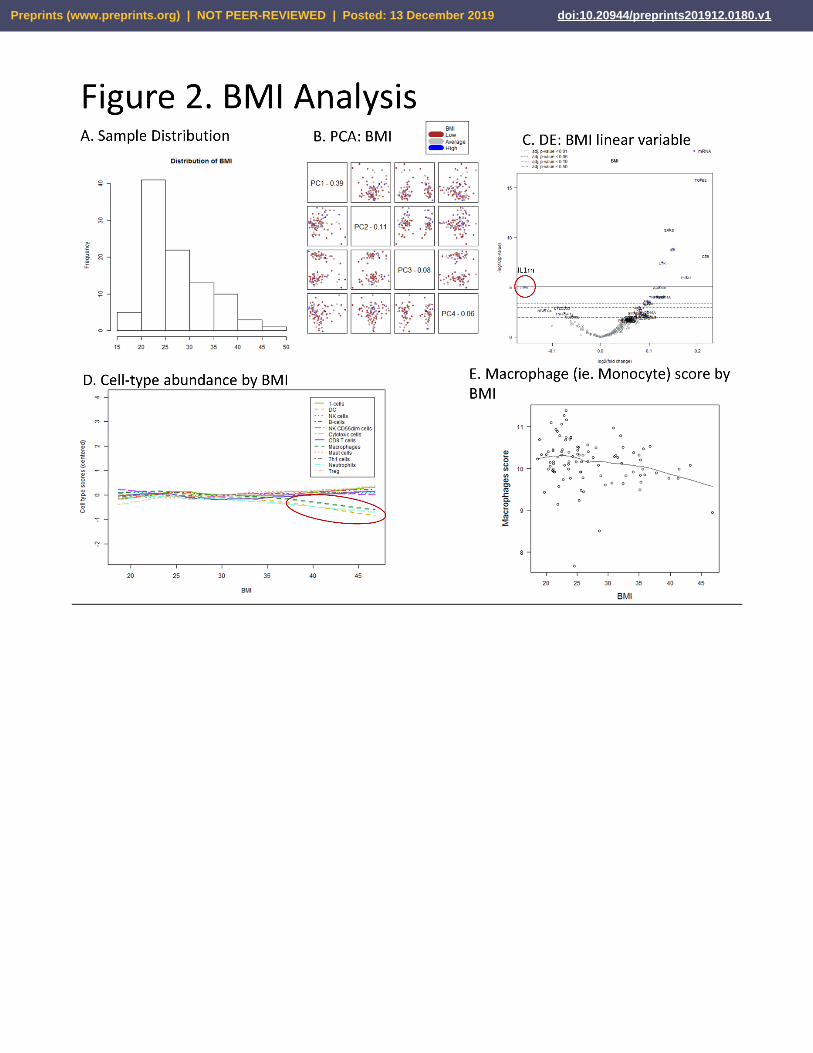
BMI. The second analysis utilized BMI as a continuous variable, using a linear model to assess differential
expression. The distribution of subject BMI’s is provided, once again BMI 18.5-25 is within normal range, 25-30
indicates overweight, while >30 indicates obese (Fig. 2A, Sup. 3). The PCA analysis does not readily identify a
Preprints (www.preprints.org) | NOT PEER-REVIEWED | Posted: 13 December 2019 doi:10.20944/preprints201912.0180.v1
strong signal for this variable (Fig. 2B, Sup. 3). Differential expression shows several significantly increased mRNAs
including TGFB2, SAAS, IL6, CD9, LTK, and F13A1. Interestingly, IL1rn shows decreased expression, similar to that
seen in IBS-D vs. Controls test (Fig. 2C, Sup. 3). Significantly, in BMIs above 35, a clear trend is seen with decreased
cell abundance signal from Neutrophils, DC’s, AND Macrophages (Fig. 2D, 2E, Sup. 3), quite similar to the pattern
observed with IBS-D vs. Controls. This may reflect that that obese subjects are more common in the IBS-D cohort,
and therefore the cell-type signal from IBS-D is influenced by the BMI variable, although it may also reflect an
overlapping cellular response mechanistic commonality between obesity and IBS-D.
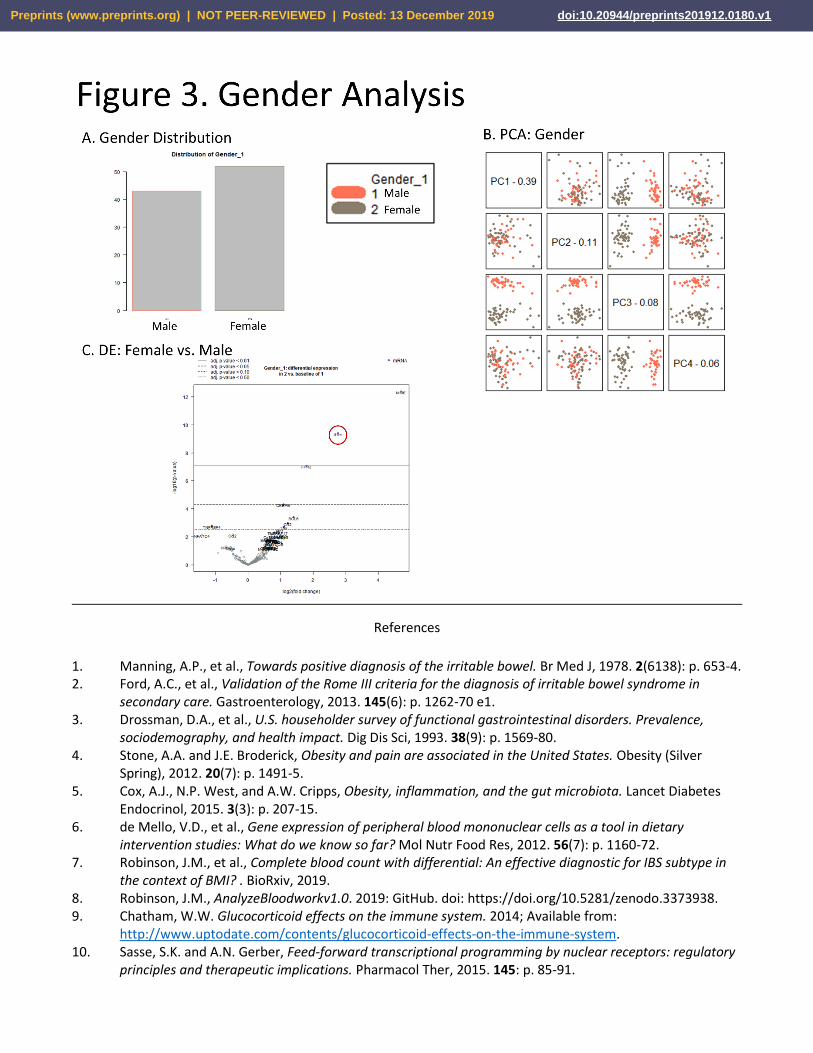
Gender. Distribution between genders in the cohort was approximately equal (Fig. 3A). In this case, the 3rd
principal component (ie. %8 of variation in the dataset), differentiated the overall signal between male and female
(Fig. 3B). Despite the clear differentiation of genders by the PCA analysis, only 3 mRNAs showed differential
expression at p > .05. These included (in females vs. baseline of male) increased in MME, IL1rn (which interestingly
has lower expression in BMI AND IBS), FPR2, and lowered CEBPB expression. (Fig. 3C)
Discussion. These three analyses provide some preliminary results for analysis of the GEO GSE12459 Nanostring
data series. They may be further used in metadata compilations and as a comparison with RNA-seq data from the
many studies which include gender and BMI variables. In understanding the interplay between weight, obesity,
GI pain and gender in personalized medicine, the necessity for addressing these (and other potentially
confounding variables such as race) will provide increasing precision for individualized diagnostic strategies.
Preprints (www.preprints.org) | NOT PEER-REVIEWED | Posted: 13 December 2019 doi:10.20944/preprints201912.0180.v1
Preprints (www.preprints.org) | NOT PEER-REVIEWED | Posted: 13 December 2019 doi:10.20944/preprints201912.0180.v1
Preprints (www.preprints.org) | NOT PEER-REVIEWED | Posted: 13 December 2019 doi:10.20944/preprints201912.0180.v1
References
1. Manning, A.P., et al., Towards positive diagnosis of the irritable bowel. Br Med J, 1978. 2(6138): p. 653-4. 2. Ford, A.C., et al., Validation of the Rome III criteria for the diagnosis of irritable bowel syndrome in
secondary care. Gastroenterology, 2013. 145(6): p. 1262-70 e1. 3. Drossman, D.A., et al., U.S. householder survey of functional gastrointestinal disorders. Prevalence,
sociodemography, and health impact. Dig Dis Sci, 1993. 38(9): p. 1569-80. 4. Stone, A.A. and J.E. Broderick, Obesity and pain are associated in the United States. Obesity (Silver
Spring), 2012. 20(7): p. 1491-5. 5. Cox, A.J., N.P. West, and A.W. Cripps, Obesity, inflammation, and the gut microbiota. Lancet Diabetes
Endocrinol, 2015. 3(3): p. 207-15. 6. de Mello, V.D., et al., Gene expression of peripheral blood mononuclear cells as a tool in dietary
intervention studies: What do we know so far? Mol Nutr Food Res, 2012. 56(7): p. 1160-72. 7. Robinson, J.M., et al., Complete blood count with differential: An effective diagnostic for IBS subtype in
the context of BMI? . BioRxiv, 2019. 8. Robinson, J.M., AnalyzeBloodworkv1.0. 2019: GitHub. doi: https://doi.org/10.5281/zenodo.3373938. 9. Chatham, W.W. Glucocorticoid effects on the immune system. 2014; Available from:
http://www.uptodate.com/contents/glucocorticoid-effects-on-the-immune-system. 10. Sasse, S.K. and A.N. Gerber, Feed-forward transcriptional programming by nuclear receptors: regulatory
principles and therapeutic implications. Pharmacol Ther, 2015. 145: p. 85-91.
Preprints (www.preprints.org) | NOT PEER-REVIEWED | Posted: 13 December 2019 doi:10.20944/preprints201912.0180.v1
11. Xavier, A.M., et al., Gene Expression Control by Glucocorticoid Receptors during Innate Immune Responses. Front Endocrinol (Lausanne), 2016. 7: p. 31.
12. Chinenov, Y., et al., Glucocorticoid receptor coordinates transcription factor-dominated regulatory network in macrophages. BMC Genomics, 2014. 15: p. 656.
13. Sevilla, L.M., et al., Glucocorticoid receptor and Klf4 co-regulate anti-inflammatory genes in keratinocytes. Mol Cell Endocrinol, 2015. 412: p. 281-9.
14. Abey, S.K., et al., Lysozyme association with circulating RNA, extracellular vesicles, and chronic stress. BBA Clin, 2017. 7: p. 23-35.
15. Geiss, G.K., et al., Direct multiplexed measurement of gene expression with color-coded probe pairs. Nat Biotechnol, 2008. 26(3): p. 317-25.
16. Nanostring, nCounter Advanced Analysis Plugin for nSolver Software User Manual, in MAN-10030-01. 2016, Nanostring Technologies, Inc.
17. Nanostring, nSolver 3.0 Analysis Software User Manual, in MAN-C0019-06. 2016, Nanostring Technologies: Seattle
18. Danaher, P., et al., Gene expression markers of Tumor Infiltrating Leukocytes. J Immunother Cancer, 2017. 5: p. 18.
19. Monaco, G., et al., RNA-Seq Signatures Normalized by mRNA Abundance Allow Absolute Deconvolution of Human Immune Cell Types. Cell Rep, 2019. 26(6): p. 1627-1640 e7.
20. Chaussabel, D., Assessment of immune status using blood transcriptomics and potential implications for global health. Semin Immunol, 2015. 27(1): p. 58-66.
21. Li, Y. and X. Xie, A mixture model for expression deconvolution from RNA-seq in heterogeneous tissues. BMC Bioinformatics, 2013. 14 Suppl 5: p. S11.
22. Pollara, G., et al., Validation of Immune Cell Modules in Multicellular Transcriptomic Data. PLoS One, 2017. 12(1): p. e0169271.
23. Chen, B., et al., Profiling Tumor Infiltrating Immune Cells with CIBERSORT. Methods Mol Biol, 2018. 1711: p. 243-259.
Preprints (www.preprints.org) | NOT PEER-REVIEWED | Posted: 13 December 2019 doi:10.20944/preprints201912.0180.v1
Recommended