Professor Paul Jones MD, PhD, FERS
• Emeritus Professor of Respiratory Medicine; St George’s, University of London
• Global Medical Expert; GSK*
Disease progression in COPD:• What is it?
• How should it be measured?
• Can it be modified?
* Financial conflict of interest

755025Age (years)
25
0
50
75
100
Disability
Death
Smoked
regularly and
susceptible to
its effects
FE
V1
(% o
f valu
e a
t ag
e 2
5)
Never smoked
or not
susceptible
to smoke
Stopped
at 45
Stopped at 65
Disease progression – as measured
by FEV1
Fletcher et al, 1976.

1 2 3
1.25
76 ml
1.35
1.40
1.45
1.50
0 3 2 4 6
50 ml/year
59 ml/year
FEV1
(litre)
1.30
1.20
Months
p=0.16
Fluticasone propionate*
Placebo
Burge et al BMJ 2000; 320:1297
* Not licensed for COPD
Rate of decline of FEV1: the ISOLDE trial

TORCH: Exacerbation rate and FEV1 decline
n=1306n=1862n=1735
Adjusted for smoking status, gender, baseline FEV1, region, BMI, prior exacerbations,
treatment, time, time by treatment and covariate by time
Rate
of
decli
ne i
n F
EV
1(m
L/y
r)
Celli et al AJRCCM 2008; 178: 332
65% faster
Exacerbations per year
37% faster
P<0.001

Exacerbations and worsening in health status over 3 years
Exacerbation Category
0
0.5
1.0
1.5
2.0
2.5
3.0
None
in 3 years
Infrequent
<1.65/yr
Frequent
>1.65/yr
ANOVA p<0.0003
SGRQ slope
(units/yr)Getting
worse
faster
Spencer et al. Eur Respir J 2004;23:1-5.

Change in steps per day over 3 years
Washki et al Am J Resp Crit Care Med 2015; 192: 295-30
SE
Daily activity is lower after 3 years with all degrees of severity
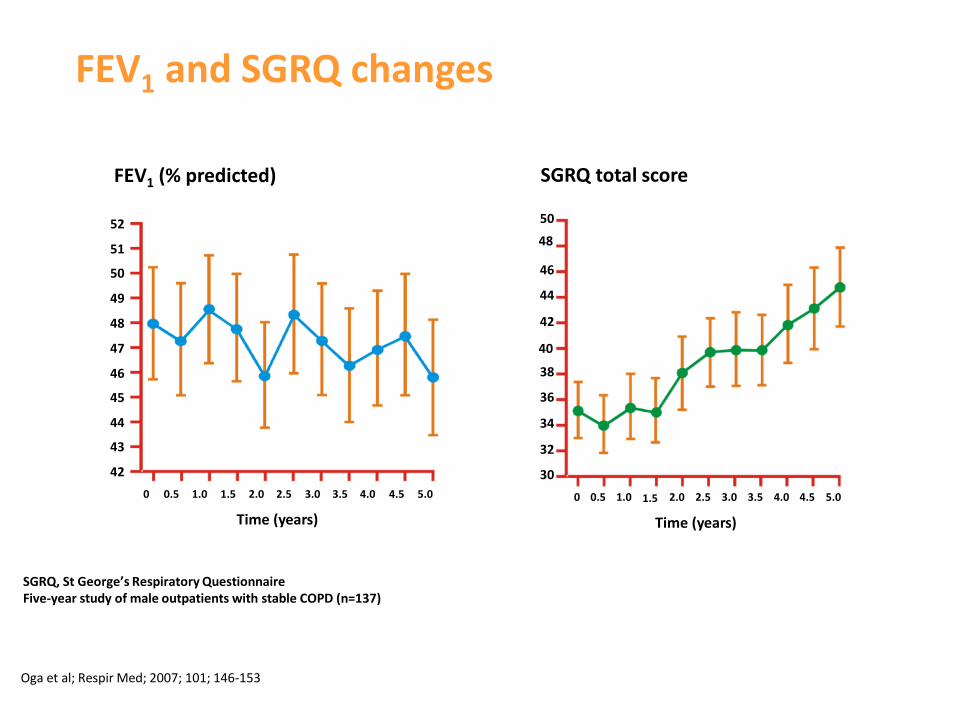
FEV1 and SGRQ changes
SGRQ, St George’s Respiratory QuestionnaireFive-year study of male outpatients with stable COPD (n=137)
Oga et al; Respir Med; 2007; 101; 146-153
48
40
1.5
FEV1 (% predicted)
52
51
50
49
48
47
46
45
44
43
42
0 0.5 1.0 1.5 2.0 2.5 3.0 3.5 4.0 4.5 5.0
Time (years)
42
SGRQ total score
50
46
44
38
36
34
32
30
0 0.5 1.0 2.0 2.5 3.0 3.5 4.0 4.5 5.0
Time (years)

ECLIPSE: Post-bronchodilator FEV1 rate of decline over 3-years
38
31
23
8
0
5
10
15
20
25
30
35
40
Fast decline>40ml
Slow decline 20-40ml
No change +/-20ml
Improvement>20ml
% patients
Vestbo et al; NEJM 2011; 365:1184-92.
Normal or no decline

Half of people with COPD (as determined by FEV1) do
not appear to have abnormal rates of FEV1 decline
FEV1 decline in early COPD cohort1
TR3 = 53 ml/yr (47% of COPD population)
TR4 = 27 ml/yr (53% of COPD population)
Reference: 1.Adapted from Lange P et.al. NEJM 2015 Vol 373 : 111-122 2. supplementary appendix
At time of diagnosis –
no knowledge of how the
patient reached this point

Long-term trial issues

TORCH: Early study withdrawal on placebo: FEV1
rate of decline
Placebo patients with 3-years of data annual decline = 54 ml/year 2
“Healthy survivor issue”
Annual decline in last 6-months leading to withdrawal >100ml/year
1. Adapted from Vestbo J et al Clin. Respir J (2011) 5. 44-49
2. Celli B et al Am J Respir Crit Care Med (2008) 178. 332–338
Early withdrawal patients annual decline = 76 ml/year 2

Clinically Important Deterioration (CID) - Rationale

A composite approach to assess short-
term worsening in COPD
Naya I et al. Thorax. 2015; 70(3): A34 (S57)
Measurable deterioration
Loss of lung function Deterioration in health
statusOccurrence of first
exacerbation

Clinically Important Deteriorations (CID) in COPD
•Decrease of ≥100 mL from baseline in trough FEV1
and/or
•Deterioration in SGRQ ≥4 units
and/or
•Moderate/severe COPD exacerbation

Long term risk based on composite
CID status (+) or (-) at 6-months
(TORCH post hoc analysis):
At 6 months CID+ (n=2870 [54%])
Placebo n=1524
Salmeterol n=1521
Fluticasone n=1534
FP/ SAL combination n=1533
Reason for CID+ status
Exacerbation = 33%
FEV1 = 23%
SGRQ = 17%
2 or more causes = 27%
Naya I et al. Thorax. 2015; 70(3): A34 (S57)
Naya et al; European Respiratory Society Congress 2016 (PA304)

TORCH: 3-year outcome on FEV1 & SGRQ based on composite CID status at 6-months
Naya I et al. Thorax. 2015; 70(3): A34 (S57), DOF: RF/CPD/0041/16
-150
-100
-50
0
50
100
150
-40 10 60 110 160
FE
V1 M
ean
ch
an
ge (
95%
CI)
Time after day 182 (weeks)
FEV1 (mL) deterioration over time
Patients CID -
Patients CID +
SGRQ total score deterioration over time
-10
-8
-6
-4
-2
0
2
4
6
-40 10 60 110 160
SG
RQ
mean
ch
an
ge (
95%
CI)
Time after day 182 (weeks)
Patients CID +
Patients CID -
- 117 ml
p<0.001
+ 6.4
units
p<0.001

TORCH: 3-year risk assessments based on
composite CID status at 6-months
All treatment groups combined in TORCH. At 6-Mo. 2870 [54%] patients were CID (CID+) and 2422 [46%] were (CID-).
Naya et al; European Respiratory Society Congress 2016 (PA304)
Su
bje
cts
wit
h ≥
1 e
xacerb
ati
on
(%
)
Time after day 182 (weeks)
Patients CID+ [73%]
Patients CID- [60%]
Future risk of exacerbations
on treatment
CID+ patients had a 61% increased
risk of an exacerbation (p<0.001)
Median time to event
520 days [CID-] vs. 265 days [CID+]
Time after day 182 (weeks)
All c
au
se d
eath
(%
su
bje
cts
)
Future risk of all cause mortality
on treatment
Patients CID-
[6.6%]
Patients CID+ [8.3%]
CID+ patients
had a 41% increased risk of
all-cause death (p<0.001)

CID in short-term trials

Time to first clinically important
deterioration: Relative Risk (RR) reduction
RR: 43%
(95% CI 31, 53; p<0.001)
UMEC/VI 55/22mcg TIO 18mcg
Singh et al. Int J COPD; 2016; 11; 1413
Post-hoc analysis of ZEP117115: Maleki-Yazdi M et al. Respir Med 2014; 108:1752–1760

All components of the composite endpoint were
significantly better with UMEC/VI vs. tiotropium
RR: 43%
(p<0.001)
RR: 47%
(p=0.044)
RR: 26%
p=0.025
RR: 53%
(p<0.001)
UMEC/VI 55/22mcg TIO 18mcg
*RR = Relative Risk reduction
Singh et al. Am J Respir Crit Care Med 2015:191; A5760 (poster presentation)
Post-hoc analysis of ZEP117115: Maleki-Yazdi M et al. Respir Med 2014; 108:1752–1760
Proportion of patients with a first clinically important deterioration event
Pro
po
rtio
n o
f p
ati
en
ts (
%)
Composite Exacerbations SGRQ≥4 units FEV ≥100 ml decline

Preventing short-term worsening: comparison
between dual and mono bronchodilator therapy
Post hoc analysis of time to a first composite CID
21
(A) Dual bronchodilator therapy
(UMEC/VI) vs. tiotropium
Tiotopium n=869
UMEC/VI n=878
HR 0.62 (0.54, 0.71)
P<0.001
41%
56%
Singh et al ERS abstract PA1487
(C) Open triple therapy
(ICS/LABA + UMEC)
vs.ICS/LABA + placebo
ICS/LABA + PBO n=818
ICS/LABA + UMEC n=819
HR 0.52 (0.45, 0.59)
P<0.001
46%
68%
Singh et al ERS abstract PA1487
(B) Dual bronchodilator therapy
(UMEC/VI) vs. placebo
Placebo n=280
UMEC/VI n=413
HR 0.37 (0.30, 0.45)
P<0.001
44%
75%
0 50 100 150
Time to event (days)
Malaki-Yazdi et al ERS abstract PA1001

• All components contribute to CID worsening
• CID distinguishes between treatments in the short-term
• Short term worsening measured over 6 months may predict long-term outcome
• Prevention of short-term worsening looks a promising therapeutic target
• As a surrogate for long term trials
• To identify potential disease modifying treatments more quickly
Summary
Recommended