Diskussionspapiere Discussion Papers
Risk attitudes of foresters, farmers and students: An experimental multimethod comparison
Philipp Sauter1
Daniel Hermann Oliver Mußhoff
1 Contact: philipp.sauter[at]agr.uni-goettingen.de
Department für Agrarökonomie und Rurale Entwicklung
Universität Göttingen D 37073 Göttingen ISSN 1865-2697
2015
Department für Agrarökonomie und Rurale Entwicklung
Diskussionsbeitrag 1514
1
Risk attitudes of foresters, farmers and students:
An experimental multimethod comparison
Abstract
Many economic decision situations of foresters and farmers are characterized by risk. Thereby, the
individual risk attitude is of particular interest for understanding decision behaviour and, thus, is
fundamental for valuable policy recommendations. The literature provides various methods to measure
risk attitude, however, their respective suitability has not been sufficiently tested. Furthermore,
existing analyses focus mostly on students and the field of resource economics for farmers. However,
there is a lack of knowledge regarding the risk attitude of foresters and how it compares to farmers and
students’ attitudes. Therefore, we investigate to what extent results are comparable across different
methods and whether the risk attitude of foresters differs from that of farmers and forestry students. To
analyse this issue, we conduct an incentivized online experiment using the Holt and Laury (HL) task,
the Eckel and Grossman (EG) task and a self-assessment (SA) questionnaire. As a result, SA values do
not correlate with the HL values, but the EG values correlate with the HL values across all groups,
although, risk-aversion coefficients differ. According to the HL task and the EG task, we reveal higher
risk aversion for foresters in comparison to farmers, while forestry students do not differ from
foresters.
Keywords
Risk attitude, foresters, farmers, Holt and Laury task, Eckel and Grossman task, self-assessment of
risk attitude
2
1 Introduction
Most economic decisions have to be taken in the presence of risk. Foresters and farmers especially are
exposed to several types of risks since they have to deal with a specific type of production risk (e.g.,
plant diseases) including weather risks which are going beyond ordinary business risks such as price
and demand variability (Hardaker 2004). These risks are reflected for instance in the decision of
choosing the optimal tree species or crop to cultivate (Moschini and Hennessy 2001; Herberich and
List 2012). Such wide-ranging decisions influenced by risk are significantly affected by the risk
attitude of the respective decision-maker (Eckel and Grossman 2008). For example, risk-averse
decision-makers may prefer a tree species or a crop with a lower yield variation rather than one with
greater yield variation, which is associated with higher expected yields (Hardaker 2004). In contrast,
risk-neutral decision-makers focus exclusively on the expected value and risk-seeking decision-makers
strive for higher potential income. Therefore, the risk attitude of a decision maker essentially
influences each decision with uncertain outcomes. Knowledge of farmers and foresters’ risk attitudes
is inevitably associated with understanding and forecasting their economic behaviour (Maart-Noelck
and Musshoff 2014). Thus, measuring risk attitude is of particular- interest for understanding decision
behaviour and, therefore, fundamental for valuable policy recommendations.
Experimental elicitation of risk attitudes has become very popular (Lönnqvist et al. 2011), which is
primarily due to the advantages attributed to this approach in comparison to the econometric
estimation alternatives that are based on field data. The main disadvantage of the field data based
estimations is that field data are often only available on an aggregated level (Roe and Just 2009).
Moreover with respect to field data, the framework conditions that influence the decision are very
heterogeneous between individuals, specifically in consideration of financial constraints and the
number of decision alternatives (Eswaran and Kotwal 1990). Additionally, it is often not possible to
establish a connection between the risk attitude and the socio-demographic characteristics of the
decision-makers due to an overall lack of information on the data (Yavaş and Sirmans 2005).
In recent years, the experimental Holt and Laury (HL) task (Holt and Laury 2002) has become one of
the most applied elicitation methods for measuring risk attitude. The HL task has evolved into a so-
3
called “gold standard” (cf. Anderson and Mellor 2009) which has set a benchmark for newly
developed tasks that are intended to measure risk attitude. Nevertheless, additional methods for
measuring the risk attitude have been developed in an effort to enhance the shortcomings of the HL
task, specifically with respect to comprehension difficulties. Alternative methods which have the
advantage of being cognitively easier to understand have been introduced for instance by Eckel and
Grossman (2008), as well as Dohmen et al. (2011). Generally, the measured risk attitude should be
consistent across various methods because of the expectation that all of these methods result in the
same risk attitude. Nevertheless, previous experimental investigations for eliciting the risk attitude
exhibit a possible method-dependence (Lönnqvist et al. 2011; Reynaud and Couture 2012; Maart-
Noelck and Musshoff 2014). Thus far, most of the research comparing the risk attitude when measured
with different methods focuses on one specific group of participants. Convenience groups, such as
students, often serve as experiment participants as it is a typical for experiments in the field of
economics (Harrison and List 2008). Students have the advantage that they are easy to recruit,
constitute a homogenous group and have higher incentive compatibility, all factors which make them
an interesting group for experiments in general. However, conclusions drawn from experiments with
students and transferred on a specific group of entrepreneurs are sometimes viewed critically (Khera
and Benson 1970; Harrison and List 2008); each method must therefore be individually tested for each
group of entrepreneurs. Furthermore, the validity of results based on the decisions of one industry-
specific group, lead to restricted transferability of conclusions to another branch-specific group (Egan
et al. 1997; Brush et al. 2000). For professional branch-specific group, such as foresters, little research
has been done regarding the experimental analysis of their risk attitude. Only a few studies have
elicited the risk attitude of foresters, Musshoff and Maart-Noelck (2014) for instance carry out an HL
task with foresters and use the elicited risk attitude to explain inconsistencies of experimentally
observed harvesting decisions with investment theories. However, the risk attitude of foresters is not
analysed and the risk attitude is not obtained through the use of different lottery-based methods in
order to compare the results.
In consideration of this, the present study pursues the objective of eliciting the risk attitude of
foresters, farmers and forestry students by using three different methods. In particular, we carry out an
4
online experiment that is comprised of the HL task (Holt and Laury 2002), the Eckel and Grossman
(EG) task (Eckel and Grossman 2002) and the self-assessment (SA) questionnaire on the risk attitude
according to Dohmen et al. (2011); foresters, farmers and forestry students then serve as the
participants for the experiment. Based on the experimental data, we compare the EG task and the SA
with the HL task to evaluate whether the results of these methods are comparable. We examine the EG
task and the SA specifically since they are associated with having different advantages than the HL
task when used for eliciting risk attitude (Dave et al. 2010; Dohmen et al. 2011) Additionally, we
compare the separate groups of foresters, farmers and forestry students with regard to their risk
attitude.
This study is an extension of the existing literature regarding four aspects: First, to the best of our
knowledge, this is the first study that investigates whether the EG task and the SA are suitable
substitutes for the HL task when measuring the risk attitude of foresters, farmers and forestry students.
Thus, we extend the methodological comparisons of previous research studies with a comparison of
multilevel methods. Second, we are the first who experimentally measure and analyse the risk attitudes
of foresters. Third, by comparing the stated risk attitudes between foresters and farmers, we are the
first that provide insight into potential differences between these two groups; potential differences are
especially necessary for appropriate policy implications. Fourth, we compare the risk attitude of
foresters and forestry students to investigate whether students can adequately be used as substitutes for
foresters in experiments within the field of forestry economics research. Since experiments are an
upcoming method in forestry economics, we can contribute to the development of this methodical
approach by testing the suitability of students as subjects for risk-related forestry economics
experiments.
The hypotheses are derived from the existing literature in Section 2, while the experimental design is
presented in Section 3. Subsequently, Section 4 presents the descriptive statistics and the validity of
the hypotheses is tested. The article ends with conclusions and future research perspectives, as
provided in Section 5.
5
2 Literature review and hypotheses
Since risk attitude is a key issue in economic decision-making, it is often evaluated in behavioural-
economic studies (cf. in the field of agricultural economics: Reynaud and Couture 2012; Maart-Noelck
and Musshoff 2014; Musshoff and Maart-Noelck 2014). These studies typically employ experiments,
especially lotteries and self-assessments via questionnaires, in order to obtain results. In comparison to
self-assessments, lottery-based experiments hold the advantage of reflecting the participants’ inherent
choice, rather than reflecting their self-perception. The participant’s choice is further supported by
financial incentives in a lottery-based experiment. When using lotteries, risk attitude can be quantified
in terms of the constant relative risk aversion (CRRA) coefficient. The HL task has been established as
a standard in achieving the CRRA (Anderson and Mellor 2009) because it comprises several decision
situations (typically ten or twenty), each of which constitute the choice between two lotteries, one
being a safe option and one a risky option. Thereby, the lottery values are held constant throughout all
decision situations, while probabilities for winning the higher, and the respective lower, value are
systematically varied. This approach allows for the risk measurement to take place within one table
and has the advantageous possibility of transferring the taken decisions into a risk utility function
(Abdellaoui et al. 2011). However, thereby obtained CRRA coefficients might be biased, for which
reason the HL task is also criticized. One point of criticism regarding the HL task is its structure,
which only allows for the specification of a certain range of CRRA coefficients (Abdellaoui et al.
2011). Furthermore, the HL task may suffer from framing effects, since participants might change
from the rather safe to the riskier lottery in the central row of decisions (Lévy-Garboua et al. 2012).
Due to the varying probabilities in the HL task, the results may suffer from probability weighting
(Abdellaoui et al. 2011). According to Tversky and Kahneman (1992), this leads to more risk-averse
behaviour for high probabilities and more risk-seeking behaviour for low probabilities. (4) The HL
task demands that participants have high cognitive math abilities in order to reveal meaningful results
(Eckel and Grossman 2002; Dave et al. 2010).
Alternatively, the EG task is also based on lottery selection and, thus, allows for depicting CRRA
values. In contrast to the HL task, the EG task comprises constant probabilities, while changing lottery
6
values throughout the process. Thus, probability weighting is fixed and equal for all lotteries; changing
values, however, might introduce stake effects. The EG task allows for a less cognitively demanding
choice on behalf of participants in comparison to the structure of the HL task (Dave et al. 2010).
Although there are some differences between the HL and the EG tasks, both methods are based on the
selection of lotteries, which is why their incentive systems can be comparably designed. From doing
so, one might expect equal results. Indeed, Harrison and Rutström (2008) conducted the HL task as
well as the lottery of Binswanger (1980), which is comparable to the EG task, with students and
concluded that both methods reveal roughly the same results in terms of CRRA coefficients. Dave et
al. (2010) worked with Canadian residents and found comparable results with the HL and EG tasks,
but only for participants with high cognitive math abilities; respective results differ for participants
with lower abilities. Loomes and Pogrebna (2014) conducted their experiments with student
participants, where they found highly significant rank correlations between the HL and the EG tasks;
they found, however, that the transferability of precise estimates of the CRRA coefficient between
these two lotteries is limited. Reynaud and Couture (2012) applied the EG and HL tasks on French
farmers and came to the conclusion that the results of both methods are correlated, though the HL task
results in lower risk aversion than the EG task. Generally, the regarded studies found correlating
results, while actual CRRA coefficients mostly differ in their magnitude. However, none of these
studies have focused on foresters and none compare the risk attitude measured across groups for
testing the stability of results and group differences, specifically not in the field of resource
economics. Future usage of elicitation methods in the context of resource economics raises the
question of to which extent the results from the EG task can be compared with those from the HL task,
especially with respect to foresters, farmers and forestry students. Condensing the findings from the
literature, we reached the following hypothesis H1a that is to be investigated:
H1a: The EG task and the HL task result in diverging CRRA values, however, their elicited risk
attitudes correlate at all groups: foresters, farmers and forestry students.
7
Questionnaires are commonly used to measure risk attitudes, especially in household surveys.
Conducting a Self Assessment questionnaire (SA) is less time consuming and costly because financial
incentives are not necessary. Furthermore, the SA tends to be less complex in comparison to most
experimental tasks (Lönnqvist et al. 2011). SA results feature a higher test-retest stability, although,
SA results can hardly be standardized since the central decision for risk-neutrality is the only point of
reference (Lönnqvist et al. 2011). Hence, an SA choice of one cannot be associated with a
standardized risk-aversion value and, thus, it is interpreted subjectively. A recent important study in
this field is that of Dohmen et al. (2011), whose household survey involved a question regarding the
participants’ self-perception of their general risk attitude, using an eleven-point Likert-type-scale (0:
absolutely risk averse to 10: absolutely risk seeking). Maart-Noelck and Musshoff (2014) compared
the results of the HL task with the SA of Dohmen et al. (2011), using German students and farmers, as
well as Kazakhstani farmers as participants. They reveal correlations, however, only for their
subgroups of German farmers and German students. In comparison, Lönnqvist et al. (2011) did not
find any correlation between the HL task and the SA (according to Dohmen et al. (2011). Concerning
the SA, they found correlation between personality traits and the outcome of a trust game; such
correlations could not be confirmed for the HL task. Reynaud and Couture (2012) compared the HL
task with the SA of Blais and Weber (2006) and is comparable to the questionnaire of Dohmen et al.
(2011); they found correlating results of the SA with the HL task, however, only when using high
payoffs in the HL task.1 Overall, results on the comparison of the SA and the HL task do not lead to
equal conclusions, while no direct comparison has yet been made between the HL task and the SA
across the regarded occupational groups. Therefore, we condense the findings from the literature to
form hypothesis H1b and examine its relevance:
H1b: The SA does not serve as an adequate surrogate for the HL task regarding the
classification of the risk attitude for all groups: foresters, farmers and forestry students.
1 For detailed information on hypothetical payoffs, we refer to Reynaud and Couture (2012).
8
To our knowledge, we are the first that compare the risk attitude of foresters with farmers and forestry
students. All other relevant studies that were found measure the risk attitude of either foresters or
farmers in relatively comparable circumstances.
In terms of the HL task, we lean our comparison on the studies of Musshoff and Maart-Noelck (2014)
and Maart-Noelck and Musshoff (2014). Musshoff and Maart-Noelck (2014) carried out an
experiment with German foresters and determined an average HL value2 of 5.9 from ten decision
situations, which exhibits a risk-averse risk attitude. Maart-Noelck and Musshoff (2014) examined the
risk attitude of German farmers and revealed an HL value of 4.4 on average, indicating that they are
slightly risk-averse. Brunette et al. (2014) analysed the risk attitude of French foresters by means of
the EG task, where they obtained an average CRRA value of 1.15, without the use of financial
incentives. Applying the EG task on French farmers in a non-incentivized experiment, Reynaud and
Couture (2012) revealed an average CRRA value of 0.62 when using low hypothetical payoffs and
1.02 when using high hypothetical payoffs.
Regarding the comparison of students and an occupational group, Masclet et al. (2009) compared the
risk attitude of students, salaried workers and self-employed workers. They found that self-employed
participants exhibit an average HL value of 5.5 and, thus, are less risk-averse than students and
salaried workers, who exhibit a very similar average HL value of 6.7 and 6.6, respectively. Maart-
Noelck and Musshoff (2014) found significant differences between farmers and students by revealing
an average HL value of 4.4 for German farmers and 5.8 for German students.
Due to widely varying experimental circumstances, a detailed comparison of the risk attitude among
groups is not suitable. The conducted experiments differ in the selection of participants and the
incentive system, among other divergences, which might influence the respective results. Still,
regarding the comparison of the aforementioned studies, obvious differences between the risk attitude
2 We use the term HL value for the number of safe choices (lottery A) in the HL task (cf. Holt and Laury 2002).
9
of famers and foresters are not expected. For the comparison of forestry students with foresters and
farmers, differences are expected. Hence, hypothesis H2 is as follows:
H2: Measured risk aversion coefficients do not differ significantly between foresters and
farmers; however, they do differ between forestry students and foresters, as along with farmers.
3 Experimental design
In the following section, we describe the three experimental tasks for measuring the risk attitude. First,
the HL task is described, then the conducted EG task is shown and finally, the SA is illustrated. The
fully detailed experimental design is depicted in the appendix.
3.1 Structure of the HL task
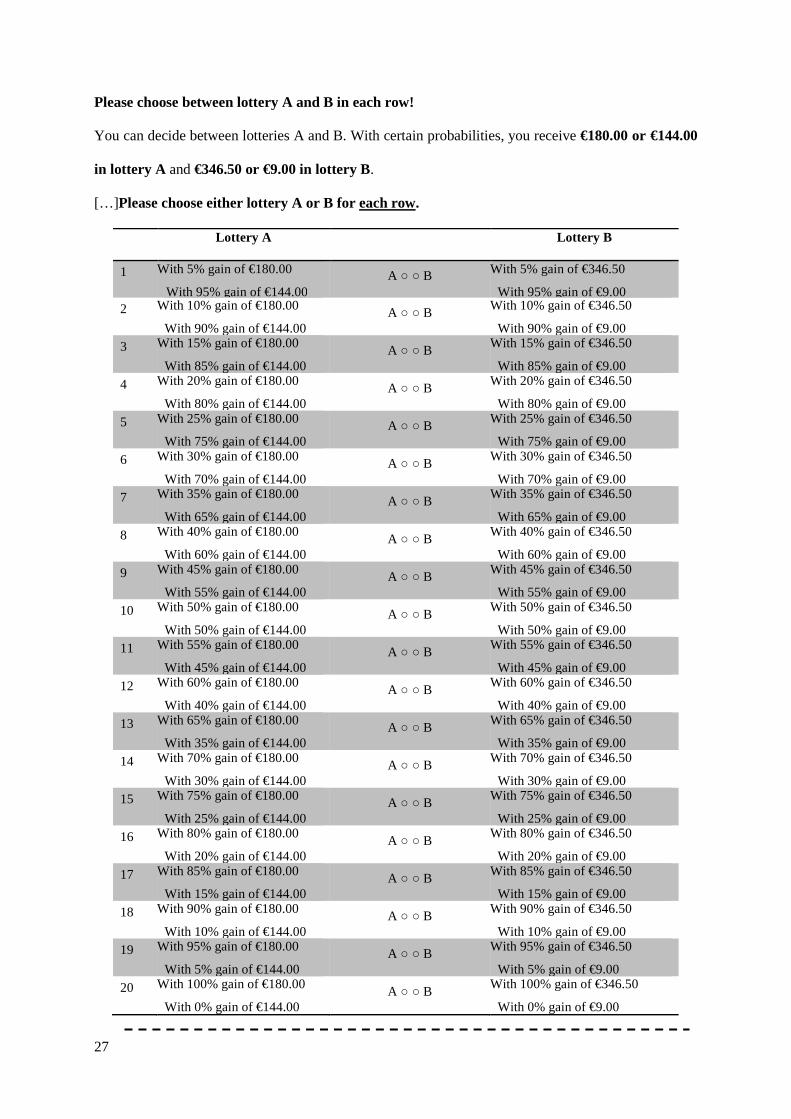
To determine the risk attitude according to Holt and Laury (2002), the participants were asked to
choose between two lotteries (A and B) in 20 decision situations. The task conducted in the present
analysis is an extension of the original HL task (Holt and Laury 2002); this extension was proposed
originally by Laury et al. (2012). In lottery A, €180.00 or €144.00 could be gained, while in lottery B,
participants could receive €346.50 or €9.00. The probabilities for winning one of these monetary
amounts were systematically varied over the 20 decision situations. The higher amount (€180.00 or
€346.50) for both lotteries was received with a probability of 5 per cent in the first decision situation
while gradually being increased in each subsequent decision situation by an additional five per cent
until it reaches 100 per cent in decision-making situation 20. The probability of winning the lower
amount (€144.00 or €9.00) therefore corresponds to 95 per cent in decision situation one and then
gradually being decreased in each subsequent decision situation by five per cent until 0 per cent is
reached in decision situation 20. Lottery B was the riskier option since a greater range of possible
outcomes (€346.50 or €9.00) compared to the possible outcomes in lottery A (€180 or €144) exists.
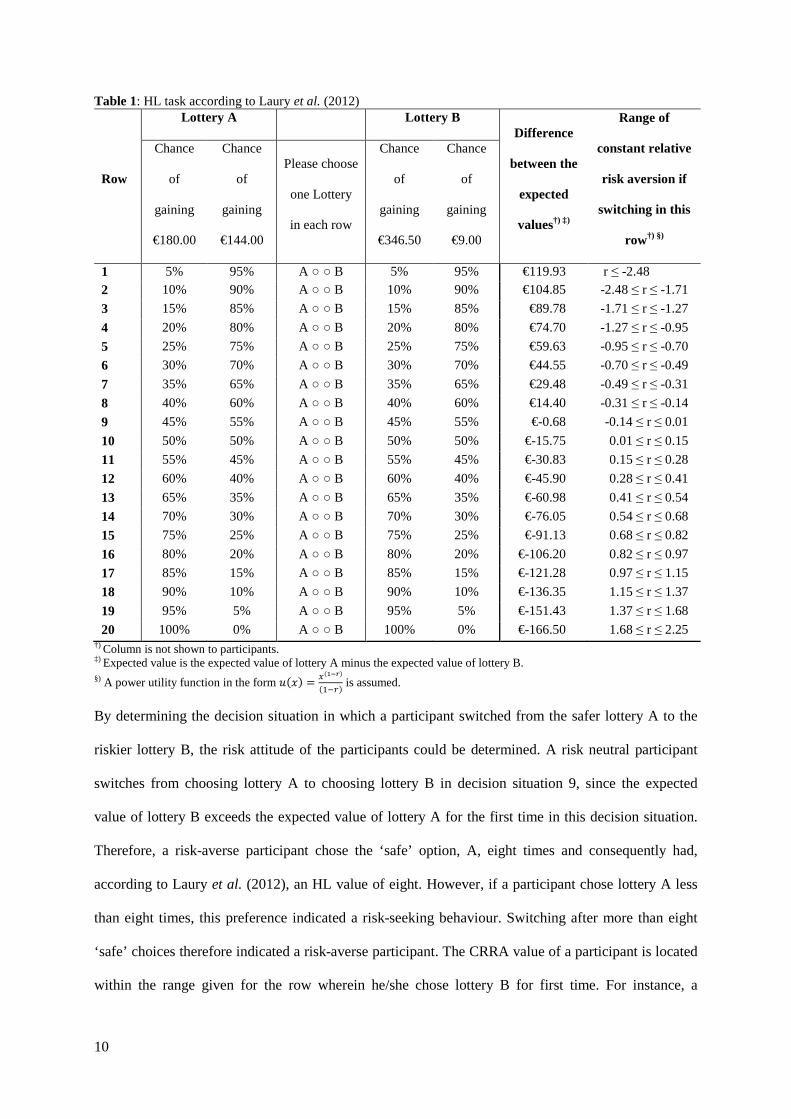
Table 1 depicts the decision situations and the associated lotteries with their respective probabilities.
10
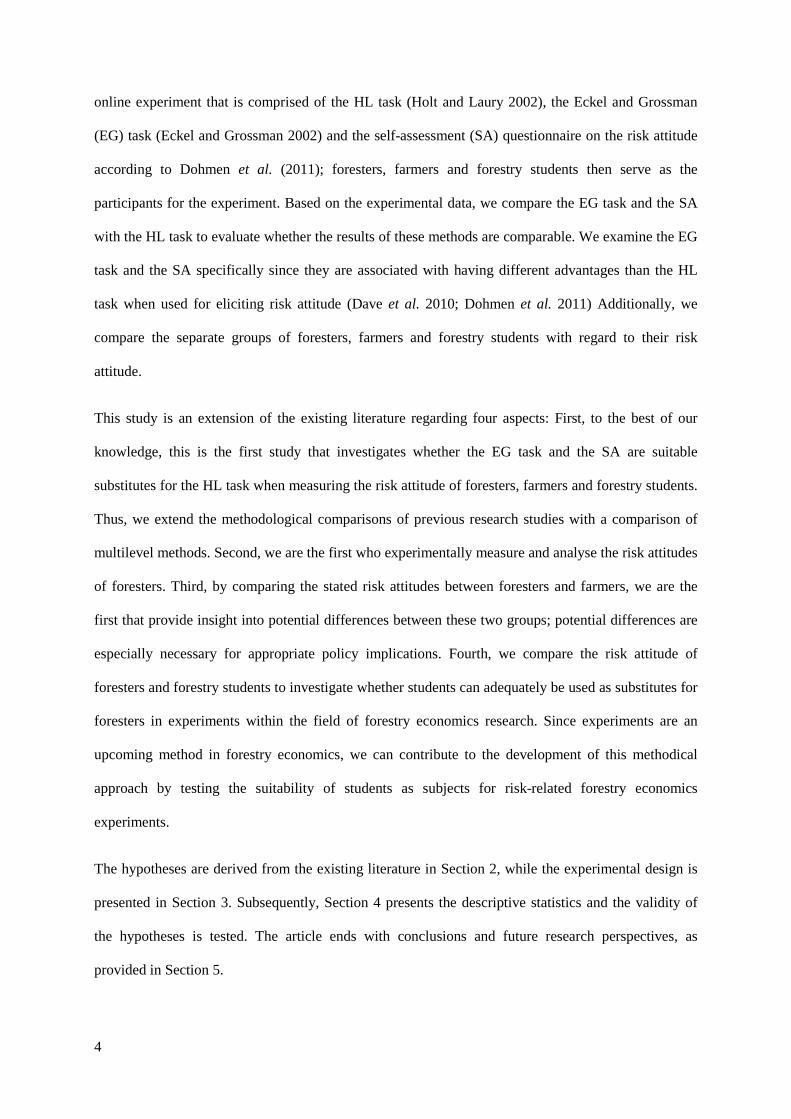
Table 1: HL task according to Laury et al. (2012)
Row
Lottery A Lottery B Difference
between the
expected
values†) ‡)
Range of
constant relative
risk aversion if
switching in this
row†) §)
Chance
of
gaining
€180.00
Chance
of
gaining
€144.00
Please choose
one Lottery
in each row
Chance
of
gaining
€346.50
Chance
of
gaining
€9.00
1 5% 95% A ○ ○ B 5% 95% €119.93 r ≤ -2.48
2 10% 90% A ○ ○ B 10% 90% €104.85 -2.48 ≤ r ≤ -1.71
3 15% 85% A ○ ○ B 15% 85% €89.78 -1.71 ≤ r ≤ -1.27
4 20% 80% A ○ ○ B 20% 80% €74.70 -1.27 ≤ r ≤ -0.95
5 25% 75% A ○ ○ B 25% 75% €59.63 -0.95 ≤ r ≤ -0.70
6 30% 70% A ○ ○ B 30% 70% €44.55 -0.70 ≤ r ≤ -0.49
7 35% 65% A ○ ○ B 35% 65% €29.48 -0.49 ≤ r ≤ -0.31
8 40% 60% A ○ ○ B 40% 60% €14.40 -0.31 ≤ r ≤ -0.14
9 45% 55% A ○ ○ B 45% 55% €-0.68 -0.14 ≤ r ≤ 0.01
10 50% 50% A ○ ○ B 50% 50% €-15.75 0.01 ≤ r ≤ 0.15
11 55% 45% A ○ ○ B 55% 45% €-30.83 0.15 ≤ r ≤ 0.28
12 60% 40% A ○ ○ B 60% 40% €-45.90 0.28 ≤ r ≤ 0.41
13 65% 35% A ○ ○ B 65% 35% €-60.98 0.41 ≤ r ≤ 0.54
14 70% 30% A ○ ○ B 70% 30% €-76.05 0.54 ≤ r ≤ 0.68
15 75% 25% A ○ ○ B 75% 25% €-91.13 0.68 ≤ r ≤ 0.82
16 80% 20% A ○ ○ B 80% 20% €-106.20 0.82 ≤ r ≤ 0.97
17 85% 15% A ○ ○ B 85% 15% €-121.28 0.97 ≤ r ≤ 1.15
18 90% 10% A ○ ○ B 90% 10% €-136.35 1.15 ≤ r ≤ 1.37
19 95% 5% A ○ ○ B 95% 5% €-151.43 1.37 ≤ r ≤ 1.68
20 100% 0% A ○ ○ B 100% 0% €-166.50 1.68 ≤ r ≤ 2.25 †) Column is not shown to participants. ‡) Expected value is the expected value of lottery A minus the expected value of lottery B. §) A power utility function in the form ���� =
�����
���� is assumed.
By determining the decision situation in which a participant switched from the safer lottery A to the
riskier lottery B, the risk attitude of the participants could be determined. A risk neutral participant
switches from choosing lottery A to choosing lottery B in decision situation 9, since the expected
value of lottery B exceeds the expected value of lottery A for the first time in this decision situation.
Therefore, a risk-averse participant chose the ‘safe’ option, A, eight times and consequently had,
according to Laury et al. (2012), an HL value of eight. However, if a participant chose lottery A less
than eight times, this preference indicated a risk-seeking behaviour. Switching after more than eight
‘safe’ choices therefore indicated a risk-averse participant. The CRRA value of a participant is located
within the range given for the row wherein he/she chose lottery B for first time. For instance, a
11
participant with an HL value of 10 chose lottery B
value is located in the range between the CRRA values of 0.15 and 0.28
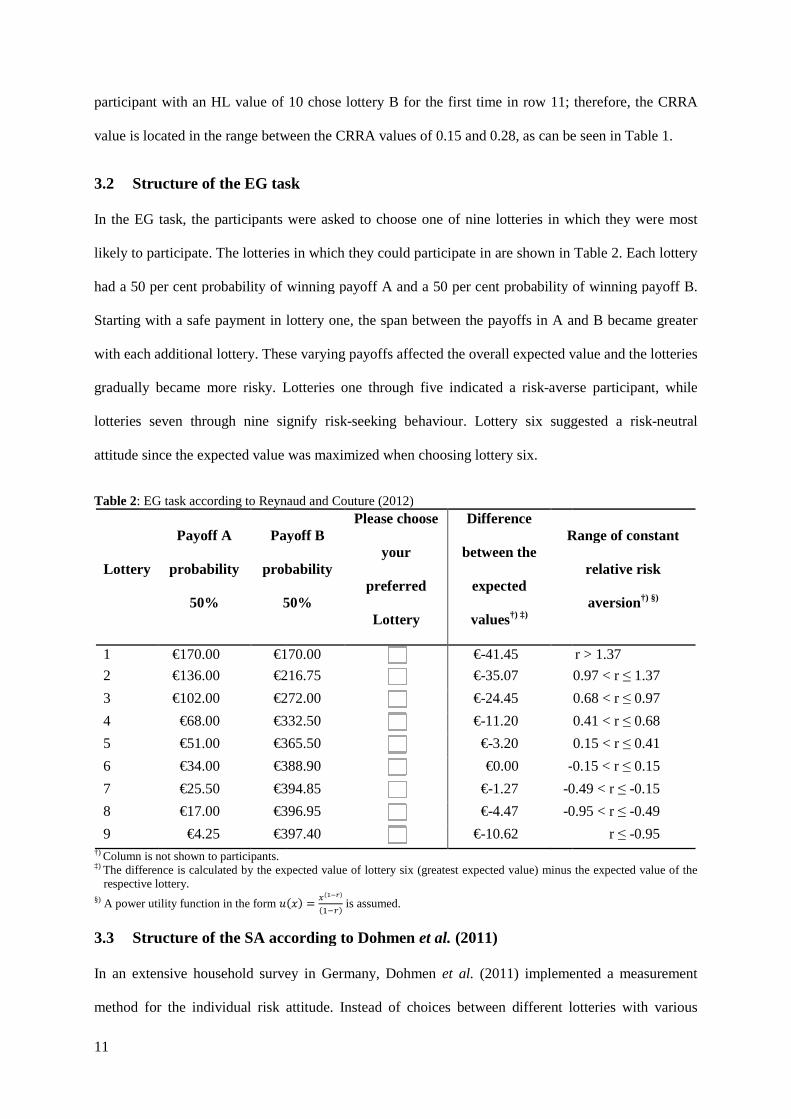
3.2 Structure of the EG task
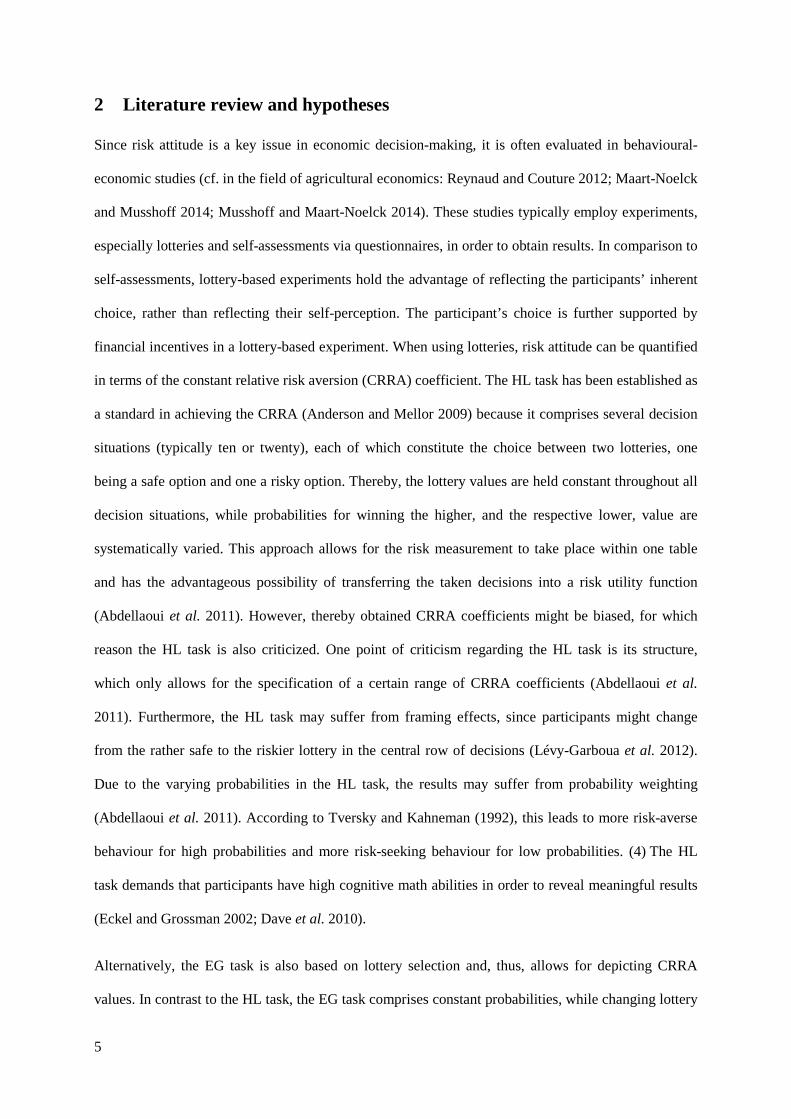
In the EG task, the participants were asked to choose one of nine
likely to participate. The lotteries
had a 50 per cent probability of winning p
Starting with a safe payment in lottery
with each additional lottery. These varying p
gradually became more risky. L
lotteries seven through nine signify
attitude since the expected value wa
Table 2: EG task according to Reynaud and Couture (2012)
Lottery
Payoff A
probability
50%
Payoff B
probability
50%
1 €170.00 €170.00
2 €136.00 €216.75
3 €102.00 €272.00
4 €68.00 €332.50
5 €51.00 €365.50
6 €34.00 €388.90
7 €25.50 €394.85
8 €17.00 €396.95
9 €4.25 €397.40†) Column is not shown to participants. ‡) The difference is calculated by the expected value
respective lottery. §) A power utility function in the form �
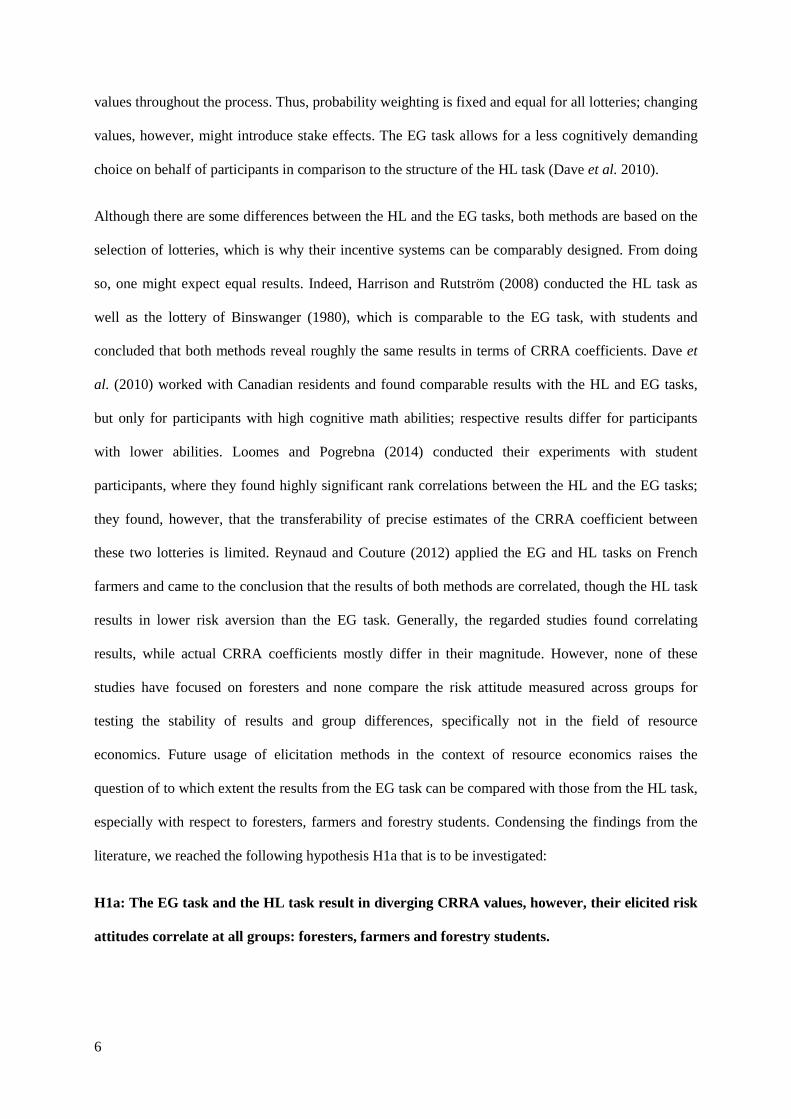
3.3 Structure of the SA according to
In an extensive household survey in Germany
method for the individual risk attitude. Instead of choices between different lotteries with
HL value of 10 chose lottery B for the first time in row 11;
value is located in the range between the CRRA values of 0.15 and 0.28, as can be seen in Table 1
EG task
, the participants were asked to choose one of nine lotteries in which they wer
lotteries in which they could participate in are shown in
probability of winning payoff A and a 50 per cent probability of winning p
lottery one, the span between the payoffs in A and B
These varying payoffs affected the overall expected value
Lotteries one through five indicated a risk-avers
signify risk-seeking behaviour. Lottery six suggested
itude since the expected value was maximized when choosing lottery six.
Reynaud and Couture (2012)
Payoff B
probability
50%
Please choose
your
preferred
Lottery
Difference
between the
expected
values†) ‡)
Range of
170.00 €-41.45
216.75 €-35.07
272.00 €-24.45
332.50 €-11.20
365.50 €-3.20
388.90 €0.00 -
394.85 €-1.27 -0.49 < r
396.95 €-4.47 -0.95 < r
397.40 €-10.62
xpected value of lottery six (greatest expected value) minus
��� =�����
���� is assumed.
according to Dohmen et al. (2011)
household survey in Germany, Dohmen et al. (2011) implement
for the individual risk attitude. Instead of choices between different lotteries with
therefore, the CRRA
, as can be seen in Table 1.
which they were most
are shown in Table 2. Each lottery
probability of winning payoff B.
A and B became greater
expected value and the lotteries
averse participant, while
suggested a risk-neutral
Range of constant
relative risk
aversion†) §)
r > 1.37
0.97 < r ≤ 1.37
0.68 < r ≤ 0.97
0.41 < r ≤ 0.68
0.15 < r ≤ 0.41
-0.15 < r ≤ 0.15
0.49 < r ≤ -0.15
0.95 < r ≤ -0.49
r ≤ -0.95
minus the expected value of the
mented a measurement
for the individual risk attitude. Instead of choices between different lotteries with various
12
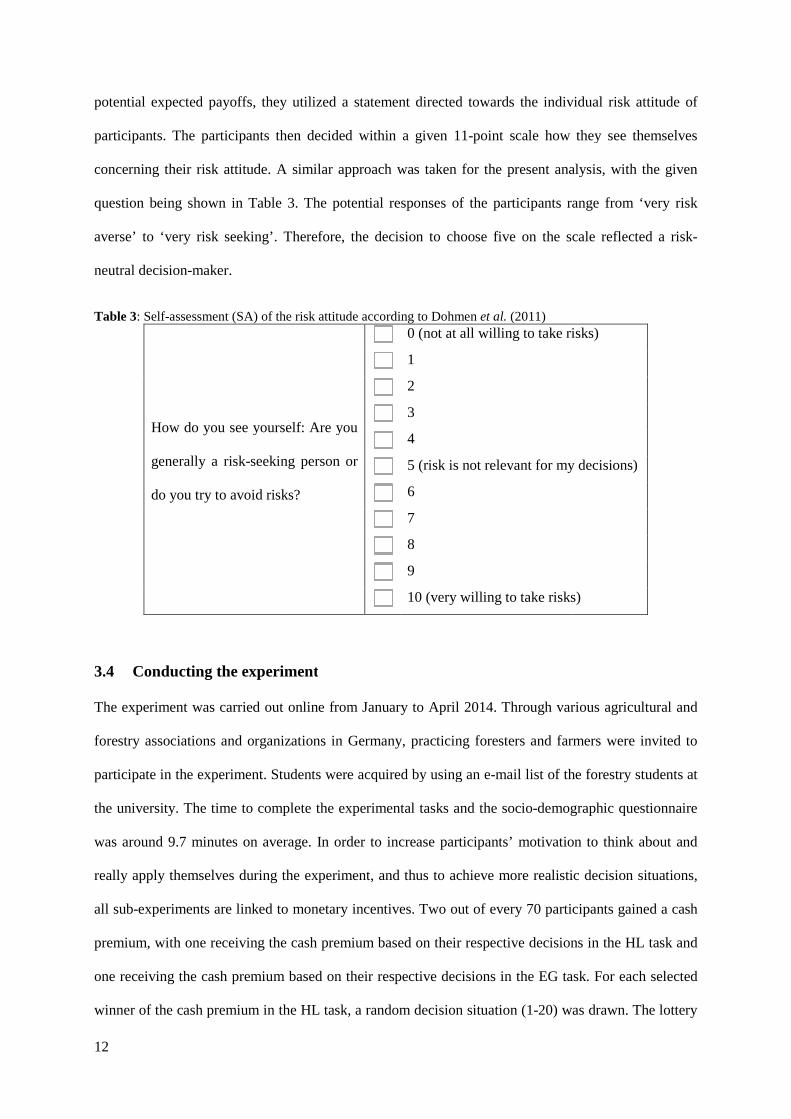
potential expected payoffs, they
participants. The participants then
concerning their risk attitude. A similar approach was taken for the present analysis, with t
question being shown in Table
averse’ to ‘very risk seeking’. Therefore
neutral decision-maker.
Table 3: Self-assessment (SA) of the risk attitude
How do you see yourself: Are you
generally a risk-seeking
do you try to avoid risks?
3.4 Conducting the experiment
The experiment was carried out online from January to April 2014. Through various agricultural
forestry associations and organizations
participate in the experiment. Students were acquired by using an e
the university. The time to complete the experiment
was around 9.7 minutes on average.
really apply themselves during the experiment
all sub-experiments are linked to monetary
premium, with one receiving the cash premium
one receiving the cash premium
winner of the cash premium in the HL task
they utilized a statement directed towards the individual risk attitude
then decided within a given 11-point scale how they see
A similar approach was taken for the present analysis, with t
Table 3. The potential responses of the participants range
. Therefore, the decision to choose five on the scale reflected
of the risk attitude according to Dohmen et al. (2011)
ou see yourself: Are you
seeking person or
you try to avoid risks?
0 (not at all willing to take risk
1
2
3
4
5 (risk is not relevant for my decision
6
7
8
9
10 (very willing to take risks)
Conducting the experiment
The experiment was carried out online from January to April 2014. Through various agricultural
organizations in Germany, practicing foresters and farmers
tudents were acquired by using an e-mail list of the
. The time to complete the experimental tasks and the socio-demographic
on average. In order to increase participants’ motivation
the experiment, and thus to achieve more realistic
experiments are linked to monetary incentives. Two out of every 70 participants
the cash premium based on their respective decisions in
based on their respective decisions in the EG task.
in the HL task, a random decision situation (1-20) was drawn. The
individual risk attitude of
how they see themselves
A similar approach was taken for the present analysis, with the given
range from ‘very risk
on the scale reflected a risk-
0 (not at all willing to take risks)
risk is not relevant for my decisions)
10 (very willing to take risks)
The experiment was carried out online from January to April 2014. Through various agricultural and
and farmers were invited to
the forestry students at
emographic questionnaire
motivation to think about and
istic decision situations,
of every 70 participants gained a cash
decisions in the HL task and
the EG task. For each selected
was drawn. The lottery
13
chosen by the participant in the drawn decision situation was actually performed for this participant.
Therefore, the participant could win between €9.00 and €346.50. For the winner in the EG task, the
individual cash premium was the result of the lottery that the participant chose in the EG task, with the
potential cash premium varying between €4.25 and €397.40. The incentive structure is identical for
each group (foresters, farmers and students).
4 Results
4.1 Descriptive statistics
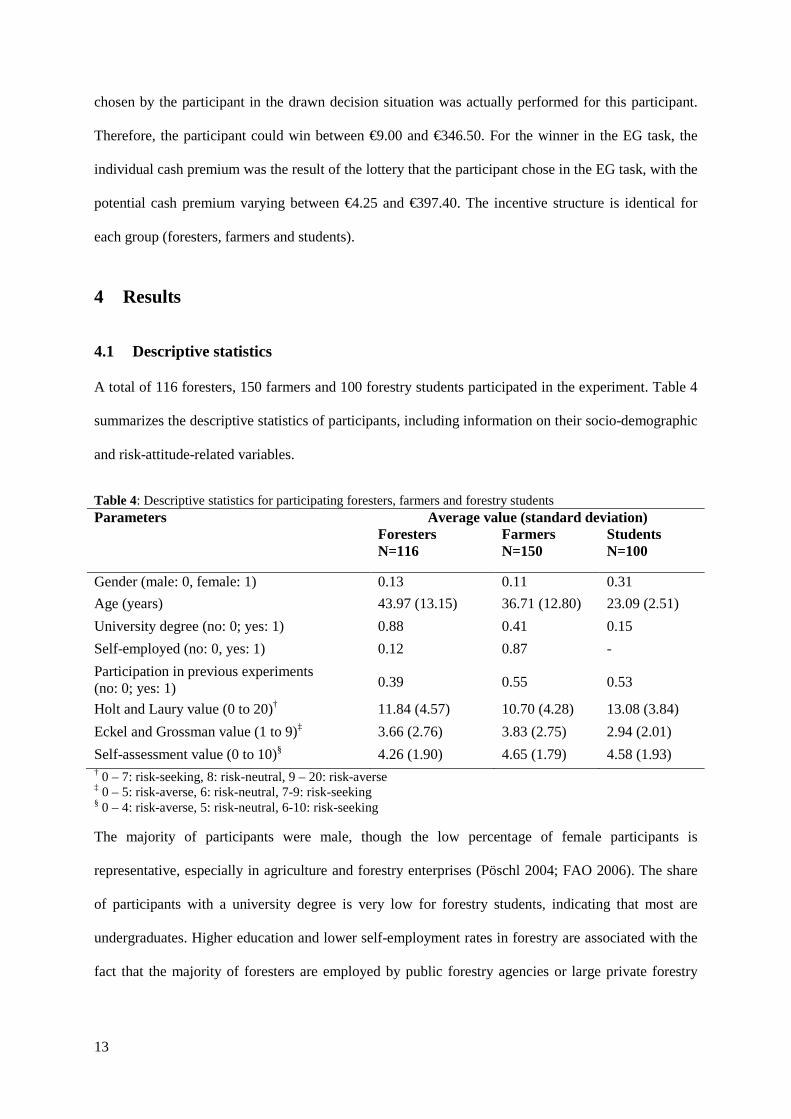
A total of 116 foresters, 150 farmers and 100 forestry students participated in the experiment. Table 4
summarizes the descriptive statistics of participants, including information on their socio-demographic
and risk-attitude-related variables.
Table 4: Descriptive statistics for participating foresters, farmers and forestry students Parameters Average value (standard deviation) Foresters
N=116 Farmers N=150
Students N=100
Gender (male: 0, female: 1) 0.13 0.11 0.31
Age (years) 43.97 (13.15) 36.71 (12.80) 23.09 (2.51)
University degree (no: 0; yes: 1) 0.88 0.41 0.15
Self-employed (no: 0, yes: 1) 0.12 0.87 -
Participation in previous experiments (no: 0; yes: 1) 0.39 0.55 0.53
Holt and Laury value (0 to 20)† 11.84 (4.57) 10.70 (4.28) 13.08 (3.84)
Eckel and Grossman value (1 to 9)‡ 3.66 (2.76) 3.83 (2.75) 2.94 (2.01)
Self-assessment value (0 to 10)§ 4.26 (1.90) 4.65 (1.79) 4.58 (1.93) † 0 – 7: risk-seeking, 8: risk-neutral, 9 – 20: risk-averse ‡ 0 – 5: risk-averse, 6: risk-neutral, 7-9: risk-seeking § 0 – 4: risk-averse, 5: risk-neutral, 6-10: risk-seeking
The majority of participants were male, though the low percentage of female participants is
representative, especially in agriculture and forestry enterprises (Pöschl 2004; FAO 2006). The share
of participants with a university degree is very low for forestry students, indicating that most are
undergraduates. Higher education and lower self-employment rates in forestry are associated with the
fact that the majority of foresters are employed by public forestry agencies or large private forestry
14
companies, where academic education is often required. Farmers on the other hand typically manage
their own farm, which is frequently inherited.
Table 4 depicts the descriptive statistics of the participants, as well as their risk attitude. When
measuring the risk attitudes with the HL task, inconsistent lottery choices can occur. For example, a
participant that initially chooses option A then switches to option B and switches back to option A in
later decision situations. In our analysis, 21 per cent of participants revealed similar inconsistent
lottery choices. Following Holt and Laury (2002), participants with inconsistent lottery choices can
still be included in the analysis by counting only their safe choices (option A). In total, the average HL
values point towards a slightly risk-averse attitude for farmers and foresters, and a risk-averse attitude
for forestry students. The EG values exhibit risk-averse attitudes and have a comparable high standard
deviation. The results from the average SA values indicate slightly risk-averse to almost risk-neutral
attitudes for all groups. Collectively, our results suggest risk aversion, at least to some degree, for all
participating groups across all methods.
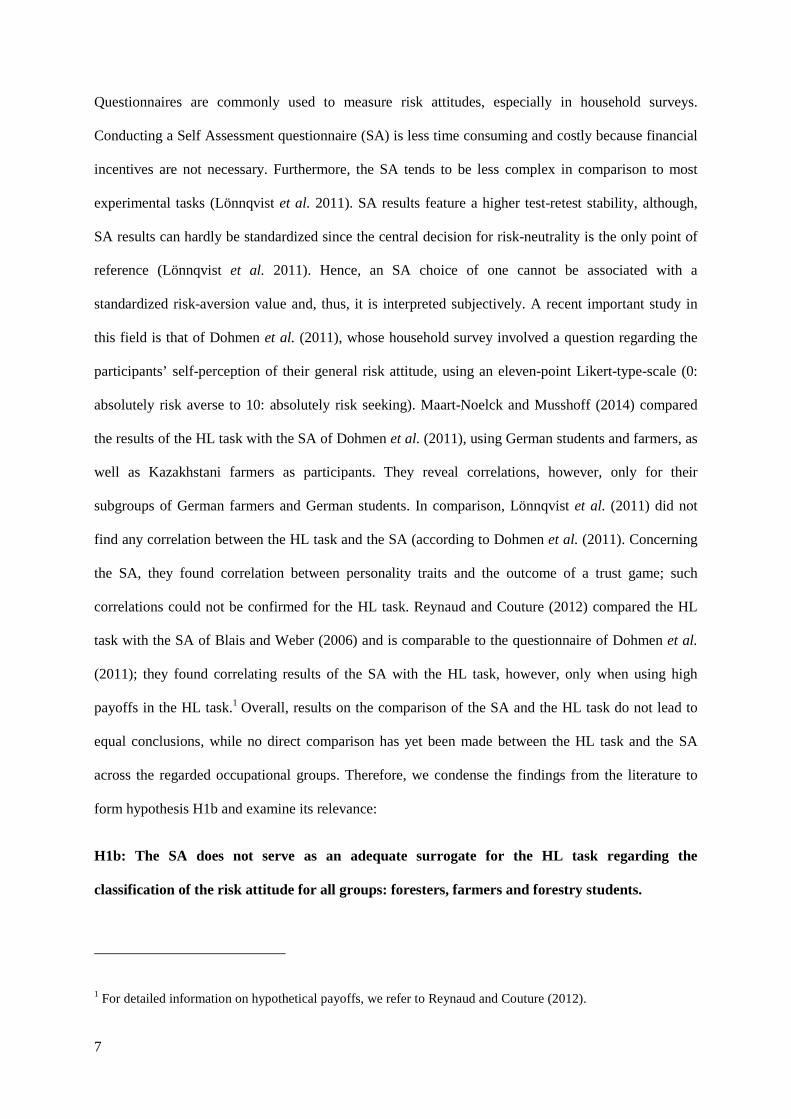
A comparison of all groups and risk measurement methods has been developed in an effort to provide
a graphical depiction (Figure 1) of risk attitudes. Since, the EG task reveals the smallest scale of all
regarded methods, HL values were transformed into EG values by using the CRRA value, as stated in
the HL task; each value was then assigned to its corresponding EG value. For the purpose of
illustration, the SA values are also displayed, although lower and upper values are not standardized.
This means that, e.g., a high SA value represents a risk-seeking attitude, which again indicates a
negative, but not a distinct CRRA or a distinct EG value respectively.3
3 SA values were transformed by calculation, with an SA value of 0 corresponding to an EG value of 1 (risk-
averse), an SA value of 5 corresponding to an EG value of 6 (risk-neutral) and an SA value of 10 corresponding
to an EG value of 9 (risk-seeking).
15
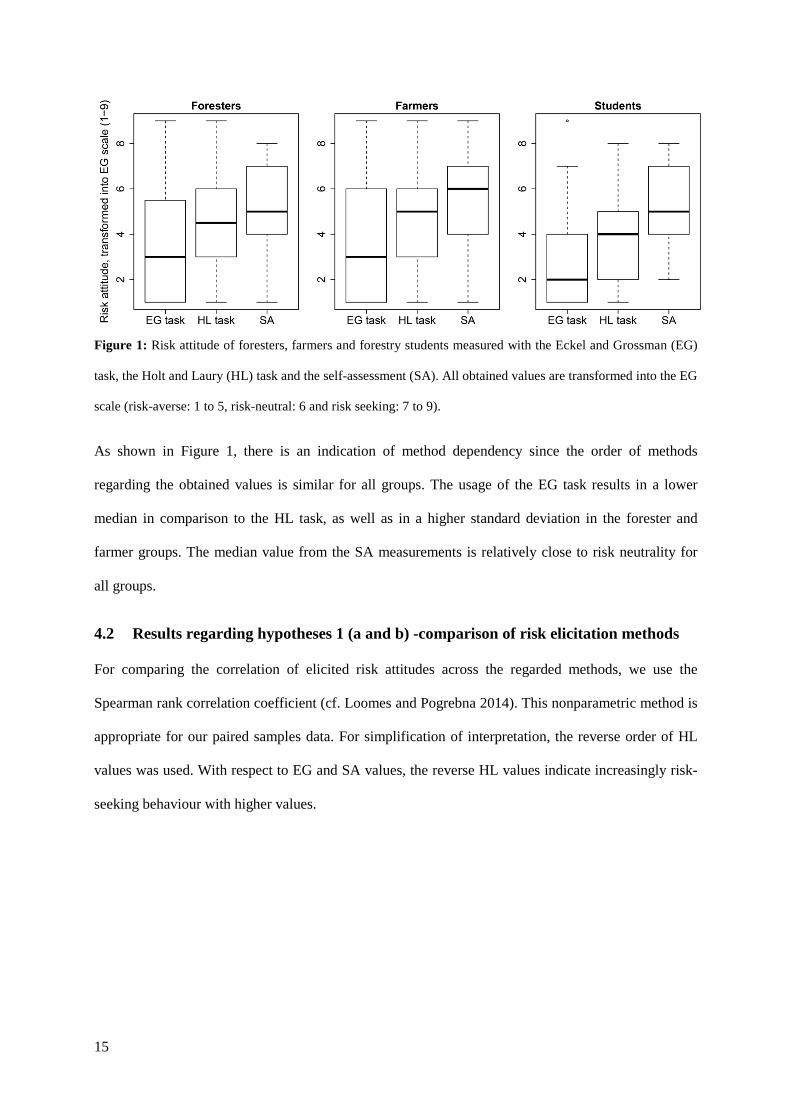
Figure 1: Risk attitude of foresters, farmers and forestry students measured with the Eckel and Grossman (EG)
task, the Holt and Laury (HL) task and the self-assessment (SA). All obtained values are transformed into the EG
scale (risk-averse: 1 to 5, risk-neutral: 6 and risk seeking: 7 to 9).
As shown in Figure 1, there is an indication of method dependency since the order of methods
regarding the obtained values is similar for all groups. The usage of the EG task results in a lower
median in comparison to the HL task, as well as in a higher standard deviation in the forester and
farmer groups. The median value from the SA measurements is relatively close to risk neutrality for
all groups.
4.2 Results regarding hypotheses 1 (a and b) -comparison of risk elicitation methods
For comparing the correlation of elicited risk attitudes across the regarded methods, we use the
Spearman rank correlation coefficient (cf. Loomes and Pogrebna 2014). This nonparametric method is
appropriate for our paired samples data. For simplification of interpretation, the reverse order of HL
values was used. With respect to EG and SA values, the reverse HL values indicate increasingly risk-
seeking behaviour with higher values.
16
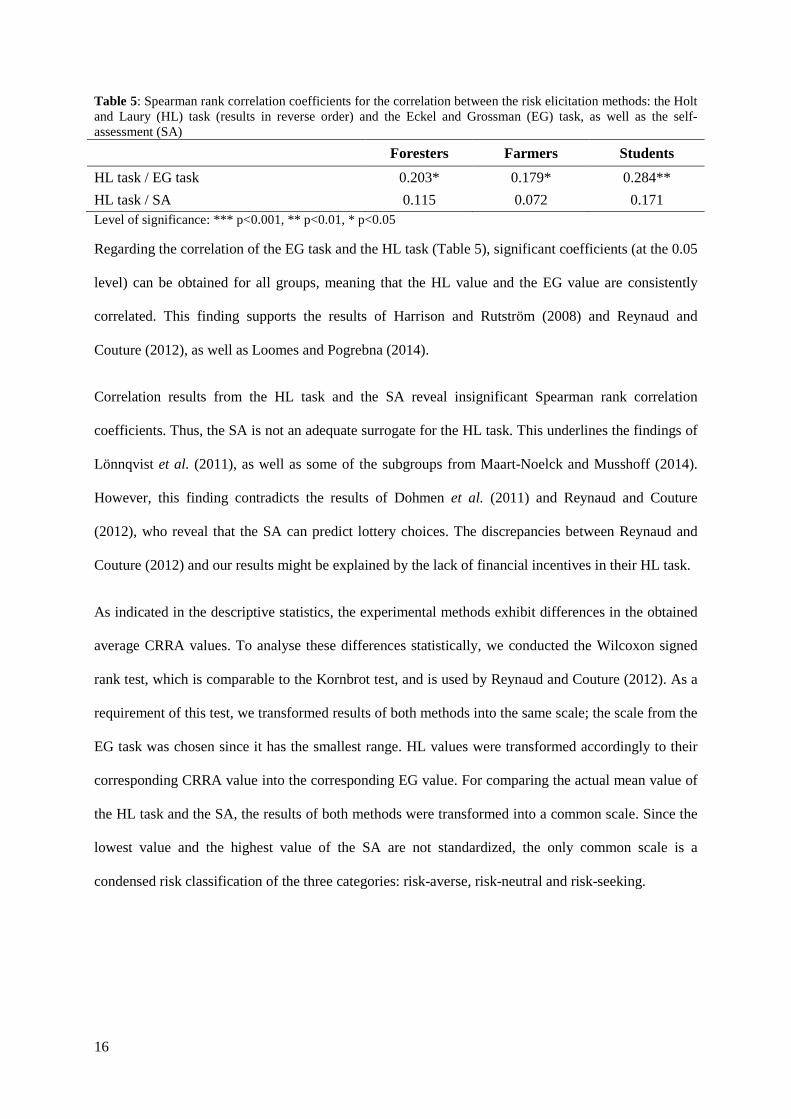
Table 5: Spearman rank correlation coefficients for the correlation between the risk elicitation methods: the Holt and Laury (HL) task (results in reverse order) and the Eckel and Grossman (EG) task, as well as the self-assessment (SA)
Foresters Farmers Students HL task / EG task 0.203* 0.179* 0.284**
HL task / SA 0.115 0.072 0.171 Level of significance: *** p<0.001, ** p<0.01, * p<0.05
Regarding the correlation of the EG task and the HL task (Table 5), significant coefficients (at the 0.05
level) can be obtained for all groups, meaning that the HL value and the EG value are consistently
correlated. This finding supports the results of Harrison and Rutström (2008) and Reynaud and
Couture (2012), as well as Loomes and Pogrebna (2014).
Correlation results from the HL task and the SA reveal insignificant Spearman rank correlation
coefficients. Thus, the SA is not an adequate surrogate for the HL task. This underlines the findings of
Lönnqvist et al. (2011), as well as some of the subgroups from Maart-Noelck and Musshoff (2014).
However, this finding contradicts the results of Dohmen et al. (2011) and Reynaud and Couture
(2012), who reveal that the SA can predict lottery choices. The discrepancies between Reynaud and
Couture (2012) and our results might be explained by the lack of financial incentives in their HL task.
As indicated in the descriptive statistics, the experimental methods exhibit differences in the obtained
average CRRA values. To analyse these differences statistically, we conducted the Wilcoxon signed
rank test, which is comparable to the Kornbrot test, and is used by Reynaud and Couture (2012). As a
requirement of this test, we transformed results of both methods into the same scale; the scale from the
EG task was chosen since it has the smallest range. HL values were transformed accordingly to their
corresponding CRRA value into the corresponding EG value. For comparing the actual mean value of
the HL task and the SA, the results of both methods were transformed into a common scale. Since the
lowest value and the highest value of the SA are not standardized, the only common scale is a
condensed risk classification of the three categories: risk-averse, risk-neutral and risk-seeking.
17
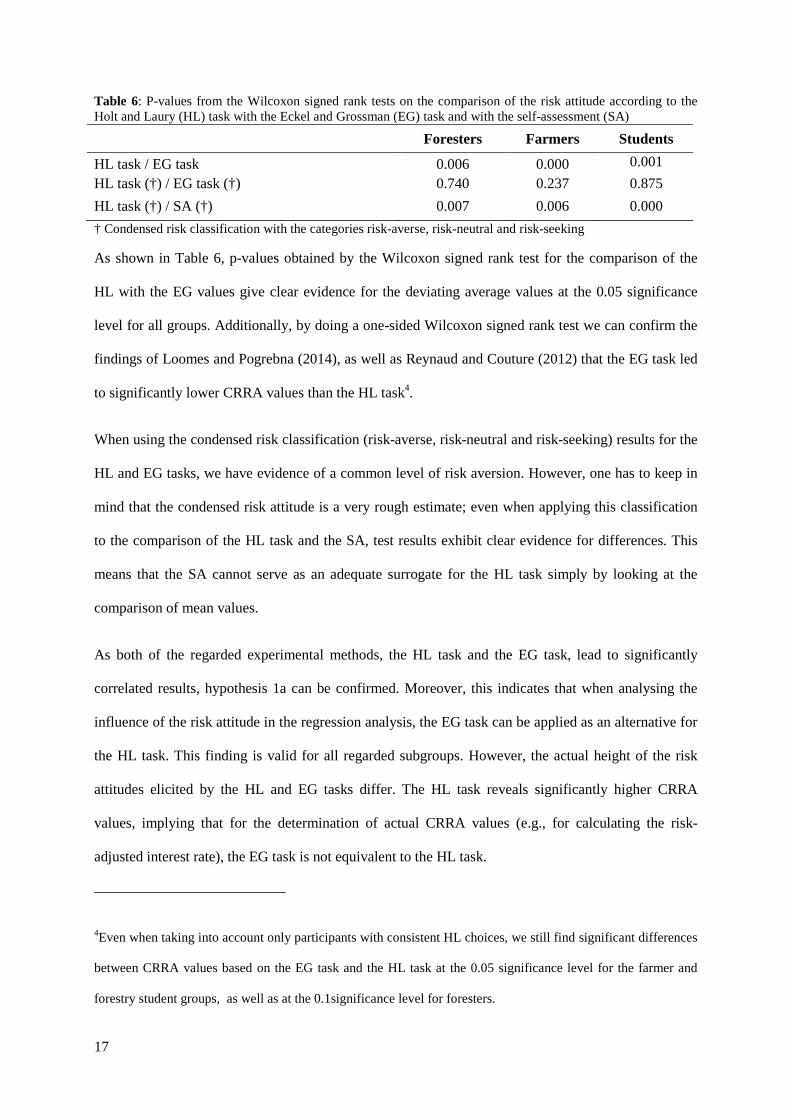
Table 6: P-values from the Wilcoxon signed rank tests on the comparison of the risk attitude according to the Holt and Laury (HL) task with the Eckel and Grossman (EG) task and with the self-assessment (SA)
Foresters Farmers Students
HL task / EG task 0.006 0.000 0.001
HL task (†) / EG task (†) 0.740 0.237 0.875
HL task (†) / SA (†) 0.007 0.006 0.000
† Condensed risk classification with the categories risk-averse, risk-neutral and risk-seeking
As shown in Table 6, p-values obtained by the Wilcoxon signed rank test for the comparison of the
HL with the EG values give clear evidence for the deviating average values at the 0.05 significance
level for all groups. Additionally, by doing a one-sided Wilcoxon signed rank test we can confirm the
findings of Loomes and Pogrebna (2014), as well as Reynaud and Couture (2012) that the EG task led
to significantly lower CRRA values than the HL task4.
When using the condensed risk classification (risk-averse, risk-neutral and risk-seeking) results for the
HL and EG tasks, we have evidence of a common level of risk aversion. However, one has to keep in
mind that the condensed risk attitude is a very rough estimate; even when applying this classification
to the comparison of the HL task and the SA, test results exhibit clear evidence for differences. This
means that the SA cannot serve as an adequate surrogate for the HL task simply by looking at the
comparison of mean values.
As both of the regarded experimental methods, the HL task and the EG task, lead to significantly
correlated results, hypothesis 1a can be confirmed. Moreover, this indicates that when analysing the
influence of the risk attitude in the regression analysis, the EG task can be applied as an alternative for
the HL task. This finding is valid for all regarded subgroups. However, the actual height of the risk
attitudes elicited by the HL and EG tasks differ. The HL task reveals significantly higher CRRA
values, implying that for the determination of actual CRRA values (e.g., for calculating the risk-
adjusted interest rate), the EG task is not equivalent to the HL task.
4Even when taking into account only participants with consistent HL choices, we still find significant differences
between CRRA values based on the EG task and the HL task at the 0.05 significance level for the farmer and
forestry student groups, as well as at the 0.1significance level for foresters.
18
Since there are no significant correlations between the results of the HL task and the SA for any of the
observed groups, hypothesis 1b can also be confirmed. Moreover, we have clear evidence for the
differences between these two methods. This suggests that the SA cannot serve as an adequate
surrogate for the HL task, neither for the regression analysis nor for the unambiguous comparison of
results across studies.
4.3 Results on hypothesis 2 (comparison of risk attitudes across groups)
We conduct interval regressions to analyse the differences between foresters and farmers, as well as
forestry students with respect to their risk attitude. This implies that foresters form the reference group
of the analysis. By means of an interval regression, we rationalize the interval structure of the CRRA
values that result from the HL and EG tasks and serve as dependent variables. Furthermore, we can
control the influence of additional parameters on the risk attitude (cf. Harrison and Rutström 2008).
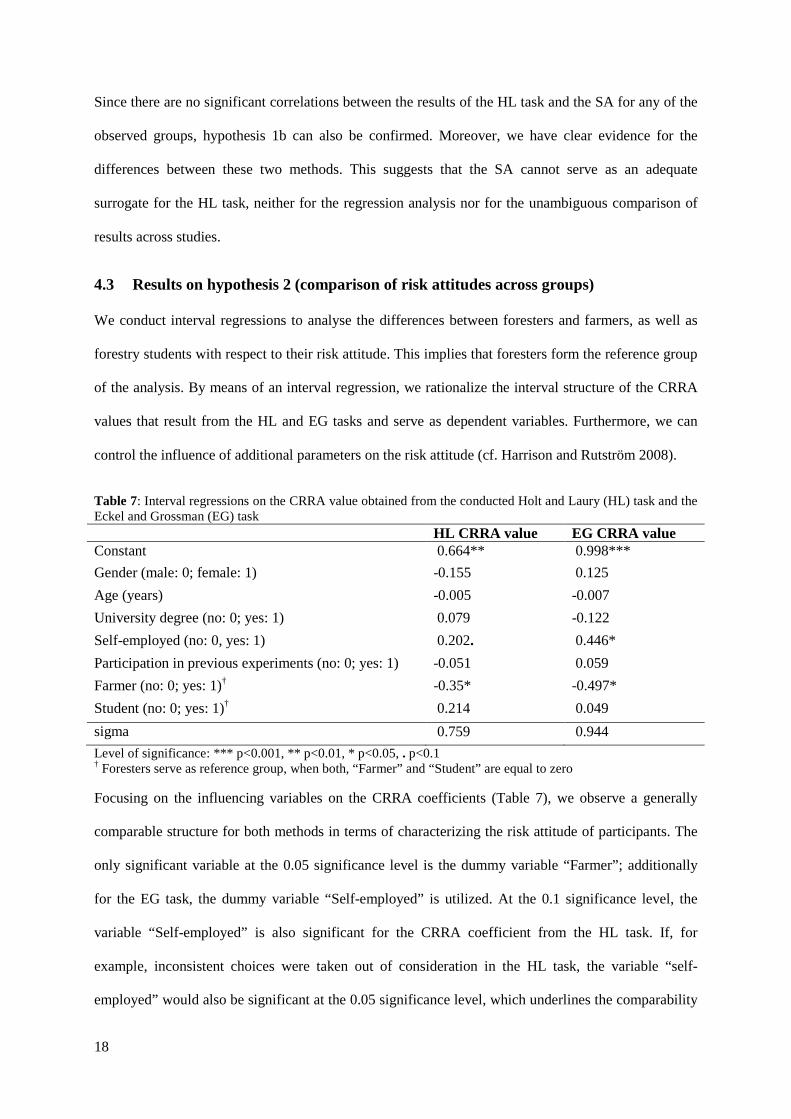
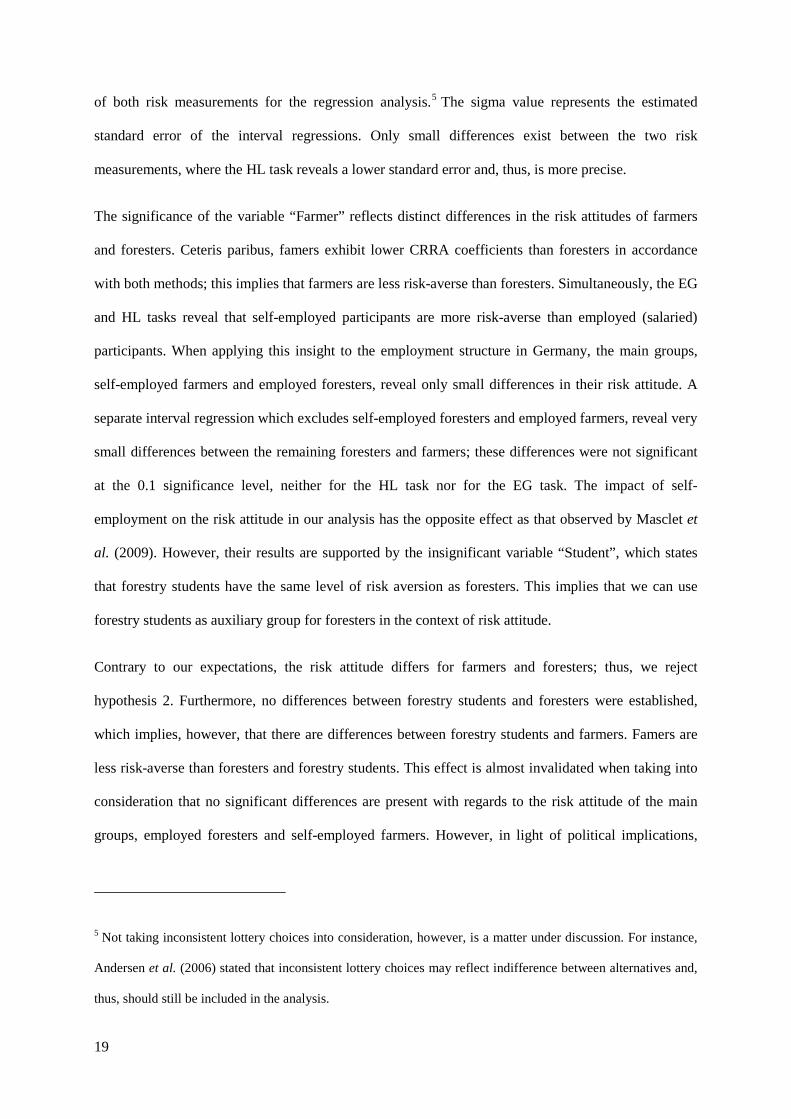
Table 7: Interval regressions on the CRRA value obtained from the conducted Holt and Laury (HL) task and the Eckel and Grossman (EG) task HL CRRA value EG CRRA value Constant 0.664** 0.998***
Gender (male: 0; female: 1) -0.155 0.125
Age (years) -0.005 -0.007
University degree (no: 0; yes: 1) 0.079 -0.122
Self-employed (no: 0, yes: 1) 0.202. 0.446*
Participation in previous experiments (no: 0; yes: 1) -0.051 0.059
Farmer (no: 0; yes: 1)† -0.35* -0.497*
Student (no: 0; yes: 1)† 0.214 0.049
sigma 0.759 0.944
Level of significance: *** p<0.001, ** p<0.01, * p<0.05, . p<0.1 † Foresters serve as reference group, when both, “Farmer” and “Student” are equal to zero
Focusing on the influencing variables on the CRRA coefficients (Table 7), we observe a generally
comparable structure for both methods in terms of characterizing the risk attitude of participants. The
only significant variable at the 0.05 significance level is the dummy variable “Farmer”; additionally
for the EG task, the dummy variable “Self-employed” is utilized. At the 0.1 significance level, the
variable “Self-employed” is also significant for the CRRA coefficient from the HL task. If, for
example, inconsistent choices were taken out of consideration in the HL task, the variable “self-
employed” would also be significant at the 0.05 significance level, which underlines the comparability
19
of both risk measurements for the regression analysis.5 The sigma value represents the estimated
standard error of the interval regressions. Only small differences exist between the two risk
measurements, where the HL task reveals a lower standard error and, thus, is more precise.
The significance of the variable “Farmer” reflects distinct differences in the risk attitudes of farmers
and foresters. Ceteris paribus, famers exhibit lower CRRA coefficients than foresters in accordance
with both methods; this implies that farmers are less risk-averse than foresters. Simultaneously, the EG
and HL tasks reveal that self-employed participants are more risk-averse than employed (salaried)
participants. When applying this insight to the employment structure in Germany, the main groups,
self-employed farmers and employed foresters, reveal only small differences in their risk attitude. A
separate interval regression which excludes self-employed foresters and employed farmers, reveal very
small differences between the remaining foresters and farmers; these differences were not significant
at the 0.1 significance level, neither for the HL task nor for the EG task. The impact of self-
employment on the risk attitude in our analysis has the opposite effect as that observed by Masclet et
al. (2009). However, their results are supported by the insignificant variable “Student”, which states
that forestry students have the same level of risk aversion as foresters. This implies that we can use
forestry students as auxiliary group for foresters in the context of risk attitude.
Contrary to our expectations, the risk attitude differs for farmers and foresters; thus, we reject
hypothesis 2. Furthermore, no differences between forestry students and foresters were established,
which implies, however, that there are differences between forestry students and farmers. Famers are
less risk-averse than foresters and forestry students. This effect is almost invalidated when taking into
consideration that no significant differences are present with regards to the risk attitude of the main
groups, employed foresters and self-employed farmers. However, in light of political implications,
5 Not taking inconsistent lottery choices into consideration, however, is a matter under discussion. For instance,
Andersen et al. (2006) stated that inconsistent lottery choices may reflect indifference between alternatives and,
thus, should still be included in the analysis.
20
self-employed farmers and self-employed foresters mainly influence decision-making in their
enterprises and these two groups exhibit distinct differences in their risk attitude.
5 Conclusions
Decisions made in the presence of risk are crucial affected by the risk attitude of the respective
decision-maker. Hence, knowledge regarding the risk attitude of decision-makers in the agricultural
and forestry sector is of special interest for understanding decision behaviour, as well as for
contributing valuable policy recommendations. The present study examines the risk attitude of
foresters, farmers and forestry students with three different elicitation methods. A within subject
method comparison was carried out to investigate whether the risk attitudes measured by a lottery
based and incentive compatible Eckel and Grossman (EG) task and the self-assessment (SA) are
comparable to the lottery based and incentive compatible Holt and Laury (HL) task. The HL task is
regarded as being the benchmark for such methods and is often referred to as the “gold standard”.
Moreover, we compare the risk attitude of foresters, farmers and forestry students in a between
subjects comparison and investigate whether there are differences between the three groups.
Our results reveal that the risk attitudes elicited with lottery based tasks, namely the HL task and the
EG task, are significantly correlated for foresters, farmers and forestry students. However, the HL task
and the EG task do not depict the same average value for the constant relative risk aversion. On
average, foresters, farmers and forestry students displayed a more risk-averse attitude in the EG task
than in the HL task. The SA measured risk attitude, however, is not at all correlated with the HL task
across all occupational groups. Additionally, we found significant differences in the degree of risk
aversion for self-employed farmers and foresters, with foresters being more risk averse than farmers.
Furthermore, forestry students reveal a degree of risk aversion that is comparable to salaried foresters
and are therefore suitable experimentation surrogates for this specific group.
The difference in the risk attitude between farmers and foresters is especially relevant for political
measures, specifically with respect to promoting risk management in the agricultural and forestry
sector. It is necessary to take into account that self-employed foresters have higher amounts of risk
21
premia than self-employed farmers in order to design efficient policy measures. Based on our results,
we can also conclude that the choice in methodology possibly affects the direction of a regression
estimation coefficient for risk attitude because the results of the SA are not correlated with the results
of the HL task. Additionally, detected differences in risk aversion could be solely based on different
elicitation methods and should therefore be validated through the utilization of the same method.
Furthermore, our results complement the findings of Loomes and Pogrebna (2014) in that the result of
imprecise preferences across the different elicitation methods reveal a core structure which is stable
over three occupational groups. It is necessary to mention here that each group was determined to have
a lower degree of risk aversion the HL task than in the EG task. Psychological factors in the structure
of the elicitation methods or in the illustration of the methods may be responsible for the differences
between the three methods, something that should be addressed in future research. Furthermore, the
risk attitude elicitation methods need to be tested with real forestry and farm data in order to further
investigate which method best measures risk attitude. Moreover, such risk elicitation measurements
should be conducted at various points in time with the same group of participants to test whether the
findings are consistent over time. The risk attitude of other occupational groups from different sectors
could additionally be examined to determine potential differences between occupational groups.
22
References
Abdellaoui, M., Driouchi, A. and, L’Haridon, O. (2011). Risk aversion elicitation: reconciling
tractability and bias minimization. Theory and Decision 71, 63–80.
Andersen, S., Harrison, G.W., Lau, M.I. and, Rutström, E.E. (2006). Elicitation using multiple
price list formats. Experimental Economics 9, 383–405.
Anderson, L.R. and Mellor, J.M. (2009). Are risk preferences stable? Comparing an
experimental measure with a validated survey-based measure. Journal of Risk and
Uncertainty 39, 137–160.
Binswanger, H.P. (1980). Attitudes toward Risk: Experimental Measurement in Rural India.
American Journal of Agricultural Economics 62, 395.
Blais, A.-R. and Weber, E.U. (2006). A Domain-Specific Risk-Taking (DOSPERT) scale for
adult populations. Judgment and Decision Making 1, 33–47.
Brunette, M., Foncel, J. and, Kéré, E.N. (2014). Attitude towards Risk and Production
Decision: An Empirical analysis on French private forest owners. Etudes et Documents
No. 10 (CERIUM - Centre d'études et de recherches internationales: Clermont Ferrand,
France). Available at: http://www.cerdi.org/uploads/ed/2014/2014.10.pdf (17.10.2014).
Brush, R., Chenoweth, R.E. and, Barman, T. (2000). Group differences in the enjoyability of
driving through rural landscapes. Landscape and Urban Planing 47, 39–45.
Dave, C., Eckel, C.C., Johnson, C.A. and, Rojas, C. (2010). Eliciting risk preferences: When
is simple better? Journal of Risk and Uncertainty 41, 219–243.
Dohmen, T., Falk, A., Huffman, D., Sunde, U., Schupp, J. and, Wagner, G.G. (2011).
Individual Risk Attitudes: Measurement, Determinants and Behavioral Consequences.
Journal of the European Economic Association 9, 522–550.
Eckel, C.C. and Grossman, P.J. (2002). Sex differences and statistical stereotyping in attitudes
toward financial risk. Evolution and Human Behavior 23, 281–295.
23
Eckel, C.C. and Grossman, P.J. (2008). Forecasting risk attitudes: An experimental study
using actual and forecast gamble choices. Journal of Economic Behavior & Organization
68, 1–17.
Egan, A.F., Rowe, J., Peterson, D. and, Philippi, G. (1997). West Virginia Tree Farmers and
Consulting Foresters: A Comparison of Views on Timber Harvesting. Northern Journal of
Applied Forestry 14, 16–19.
Eswaran, M. and Kotwal, A. (1990). Implications of credit constraints for risk behaviour in
less developed economies. Oxford Economic Papers 42, 473–482.
FAO (2006). Time for action: Changing the gender situation in forestry. Report of the team of
specialists on gender and forestry [Online]. Available at: http://www.unece.org/forests/tc-
publ.html (2014.10.20).
Hardaker, J.B. (2004). Coping with risk in agriculture (2nd edn). CABI Publ, Wallingford,
Oxfordshire.
Harrison, G.W. and List, J.A. (2008). Naturally occurring markets and exogenous laboratory
experiments: A case study of the winner's curse. Economic Journal 118, 822–843.
Harrison, G.W. and Rutström, E.E. (2008). Risk Aversion in the Laboratory. In: Cox, JC and
Harrison, GW (eds) Risk aversion in experiments, pp. 41–196. Emerald Group Publishing
Limited, Bingley, UK.
Herberich, D.H. and List, J.A. (2012). Digging into Background Risk: Experiments with
Farmers and Students. American Journal of Agricultural Economics 94, 457–463.
Holt, C.A. and Laury, S.K. (2002). Risk Aversion and Incentive Effects. American Economic
Review 92, 1644–1655.
Khera, I.P. and Benson, J.D. (1970). Are students really poor substitutes for business
businessman in behavioral research. Journal of Marketing Research 7, 529–532.
Laury, S.K., McInnes, M.M. and, Swarthout, J.T. (2012). Avoiding the curves: Direct
elicitation of time preferences. Journal of Risk and Uncertainty 44, 181–217.
24
Lévy-Garboua, L., Maafi, H., Masclet, D. and, Terracol, A. (2012). Risk aversion and framing
effects. Experimental Economics 15, 128–144.
Lönnqvist, J.-E., Verkasalo, M., Walkowitz, G. and, Wichardt, P.C. (2011). Measuring
individual risk attitudes in the lab: Task or ask? An empirical comparison. Working paper.
SOEPpapers on Multidisciplinary Panel Data Research (DIW Berlin: Berlin, Germany).
Available at: http://www.diw.de/sixcms/detail.php?id=diw_01.c.371649.de (09.01.2015).
Loomes, G. and Pogrebna, G. (2014). Measuring Individual Risk Attitudes when Preferences
are Imprecise. The Economic Journal 124, 569–593.
Maart-Noelck, S.C. and Musshoff, O. (2014). Measuring the risk attitude of decision-makers:
are there differences between groups of methods and persons? Australian Journal of
Agricultural and Resource Economics 58, 336–352.
Masclet, D., Colombier, N., Denant-Boemont, L. and, Lohéac, Y. (2009). Group and
individual risk preferences: A lottery-choice experiment with self-employed and salaried
workers. Journal of Economic Behavior & Organization 70, 470–484.
Moschini, G. and Hennessy, D.A. (2001). Uncertainty, risk aversion, and risk management for
agricultural producers. Handbook of agricultural economics 1A, 87–153.
Musshoff, O. and Maart-Noelck, S.C. (2014). An experimental analysis of the behavior of
forestry decision-makers — The example of timing in sales decisions. Forest Policy and
Economics 41, 31–39.
Pöschl, H. (2004). Frauen in der Landwirtschaft: Ein nachrangiges Thema in den
Agrarstatistiken. Statistisches Bundesamt, Wirtschaft und Statistik, 1017–1027.
Reynaud, A. and Couture, S. (2012). Stability of risk preference measures: results from a field
experiment on French farmers. Theory and Decision 73, 203–221.
Roe, B.E. and Just, D.R. (2009). Internal and External Validity in Economics Research:
Tradeoffs between Experiments, Field Experiments, Natural Experiments, and Field Data.
American Journal of Agricultural Economics 91, 1266–1271.
25
Tversky, A. and Kahneman, D. (1992). Advances in prospect theory: Cumulative
representation of uncertainty. Journal of Risk and Uncertainty 5, 297–323.
Yavaş, A. and Sirmans, C.F. (2005). Real options: Experimental evidence. The Journal of
Real Estate Finance and Economics 31, 27–52.
26
Appendix
Experiment description, translation from German
Instruction
To investigate the influence of risk on your decision making behaviours, we offer different lottery
opportunities. There is no right or wrong answer!
The experiment consists of two parts: First, you decide between different payouts, afterwards, you will
be asked a few questions regarding your farm and yourself.
What can you gain?
Each participant has a 10 per cent chance of being drawn for winning a cash premium. More precisely,
5 of every 50 participants will receive a cash premium and, for each of these winners, one of the
following five lotteries and choice decisions will be randomly selected for determining a cash
premium. The maximum cash premium per participant can be up to €388.45. Through your
decisions, you determine the amount of your potential cash premium!
For a detailed explanation of the chances of winning, please click the ‘stack of coins’ button on the
respective page. […]
We will then inform you via e-mail if you have won a cash premium. The disbursement of the cash
premium occurs either immediately after drawing a winner or at the time specified in the respective
sub-experiment.
The completion of the experiment will take approximately 20 minutes. Your information will be kept
confidentially and anonymously. For further questions, please do not hesitate to contact us. […]
Part 1: Lotteries
[The order of the following two lotteries was randomized.]
27
Please choose between lottery A and B in each row!
You can decide between lotteries A and B. With certain probabilities, you receive €180.00 or €144.00
in lottery A and €346.50 or €9.00 in lottery B.
[…]Please choose either lottery A or B for each row.
Lottery A Lottery B
1 With 5% gain of €180.00
With 95% gain of €144.00 A ○ ○ B With 5% gain of €346.50
With 95% gain of €9.00 2 With 10% gain of €180.00
With 90% gain of €144.00 A ○ ○ B With 10% gain of €346.50
With 90% gain of €9.00 3 With 15% gain of €180.00
With 85% gain of €144.00 A ○ ○ B With 15% gain of €346.50
With 85% gain of €9.00 4 With 20% gain of €180.00
With 80% gain of €144.00 A ○ ○ B
With 20% gain of €346.50
With 80% gain of €9.00 5 With 25% gain of €180.00
With 75% gain of €144.00 A ○ ○ B With 25% gain of €346.50
With 75% gain of €9.00 6 With 30% gain of €180.00
With 70% gain of €144.00 A ○ ○ B With 30% gain of €346.50
With 70% gain of €9.00 7 With 35% gain of €180.00
With 65% gain of €144.00 A ○ ○ B With 35% gain of €346.50
With 65% gain of €9.00 8 With 40% gain of €180.00
With 60% gain of €144.00 A ○ ○ B
With 40% gain of €346.50
With 60% gain of €9.00 9 With 45% gain of €180.00
With 55% gain of €144.00 A ○ ○ B With 45% gain of €346.50
With 55% gain of €9.00 10 With 50% gain of €180.00
With 50% gain of €144.00 A ○ ○ B With 50% gain of €346.50
With 50% gain of €9.00 11 With 55% gain of €180.00
With 45% gain of €144.00 A ○ ○ B With 55% gain of €346.50
With 45% gain of €9.00 12 With 60% gain of €180.00
With 40% gain of €144.00 A ○ ○ B
With 60% gain of €346.50
With 40% gain of €9.00 13 With 65% gain of €180.00
With 35% gain of €144.00 A ○ ○ B With 65% gain of €346.50
With 35% gain of €9.00 14 With 70% gain of €180.00
With 30% gain of €144.00 A ○ ○ B With 70% gain of €346.50
With 30% gain of €9.00 15 With 75% gain of €180.00
With 25% gain of €144.00 A ○ ○ B With 75% gain of €346.50
With 25% gain of €9.00 16 With 80% gain of €180.00
With 20% gain of €144.00 A ○ ○ B
With 80% gain of €346.50
With 20% gain of €9.00 17 With 85% gain of €180.00
With 15% gain of €144.00 A ○ ○ B With 85% gain of €346.50
With 15% gain of €9.00 18 With 90% gain of €180.00
With 10% gain of €144.00 A ○ ○ B With 90% gain of €346.50
With 10% gain of €9.00 19 With 95% gain of €180.00
With 5% gain of €144.00 A ○ ○ B With 95% gain of €346.50
With 5% gain of €9.00 20 With 100% gain of €180.00
With 0% gain of €144.00 A ○ ○ B
With 100% gain of €346.50
With 0% gain of €9.00
28
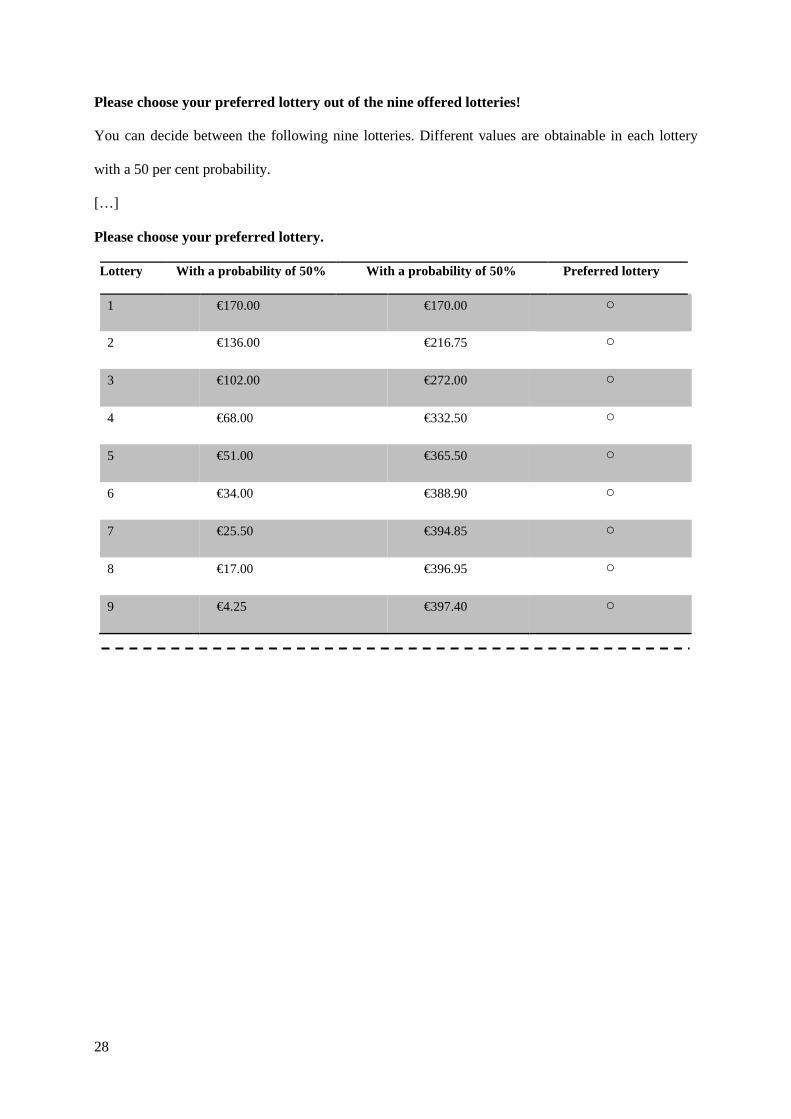
Please choose your preferred lottery out of the nine offered lotteries!
You can decide between the following nine lotteries. Different values are obtainable in each lottery
with a 50 per cent probability.
[…]
Please choose your preferred lottery.
Lottery With a probability of 50% With a probability of 50 % Preferred lottery
1 €170.00 €170.00 ○
2 €136.00 €216.75 ○
3 €102.00 €272.00 ○
4 €68.00 €332.50 ○
5 €51.00 €365.50 ○
6 €34.00 €388.90 ○
7 €25.50 €394.85 ○
8 €17.00 €396.95 ○
9 €4.25 €397.40 ○
29
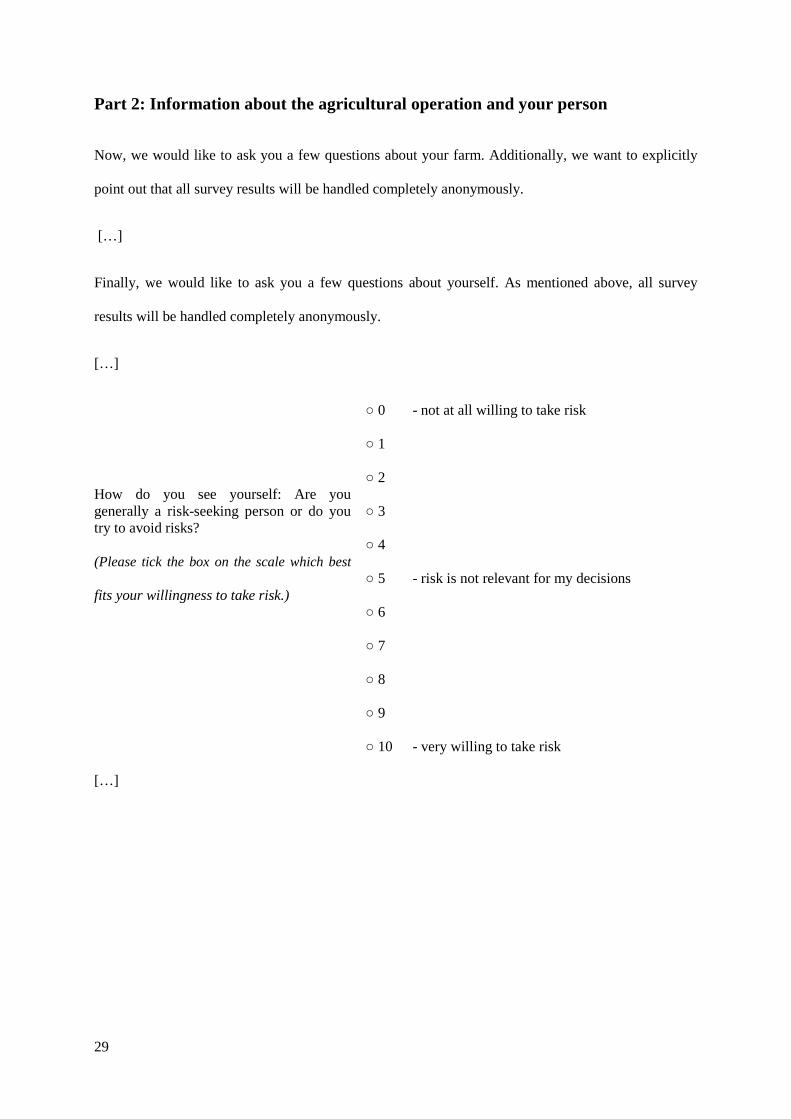
Part 2: Information about the agricultural operatio n and your person
Now, we would like to ask you a few questions about your farm. Additionally, we want to explicitly
point out that all survey results will be handled completely anonymously.
[…]
Finally, we would like to ask you a few questions about yourself. As mentioned above, all survey
results will be handled completely anonymously.
[…]
How do you see yourself: Are you generally a risk-seeking person or do you try to avoid risks? (Please tick the box on the scale which best
fits your willingness to take risk.)
○ 0 - not at all willing to take risk
○ 1
○ 2
○ 3
○ 4
○ 5 - risk is not relevant for my decisions
○ 6
○ 7
○ 8
○ 9
○ 10 - very willing to take risk
[…]
Diskussionspapiere 2000 bis 31. Mai 2006 Institut für Agrarökonomie Georg-August-Universität, Göttingen
2000
0001 Brandes, W. Über Selbstorganisation in Planspielen: ein Erfahrungsbericht, 2000
0002 von Cramon-Taubadel, S. u. J. Meyer
Asymmetric Price Transmission: Factor Artefact?, 2000
2001
0101 Leserer, M. Zur Stochastik sequentieller Entscheidungen, 2001
0102 Molua, E. The Economic Impacts of Global Climate Change on African Agriculture, 2001
0103 Birner, R. et al. ‚Ich kaufe, also will ich?’: eine interdisziplinäre Analyse der Entscheidung für oder gegen den Kauf besonders tier- u. umweltfreundlich erzeugter Lebensmittel, 2001
0104 Wilkens, I. Wertschöpfung von Großschutzgebieten: Befragung von Besuchern des Nationalparks Unteres Odertal als Baustein einer Kosten-Nutzen-Analyse, 2001
2002
0201 Grethe, H. Optionen für die Verlagerung von Haushaltsmitteln aus der ersten in die zweite Säule der EU-Agrarpolitik, 2002
0202 Spiller, A. u. M. Schramm Farm Audit als Element des Midterm-Review : zugleich ein Beitrag zur Ökonomie von Qualitätsicherungssytemen, 2002
2003
0301 Lüth, M. et al. Qualitätssignaling in der Gastronomie, 2003
0302 Jahn, G., M. Peupert u. A. Spiller
Einstellungen deutscher Landwirte zum QS-System: Ergebnisse einer ersten Sondierungsstudie, 2003
0303 Theuvsen, L. Kooperationen in der Landwirtschaft: Formen, Wirkungen und aktuelle Bedeutung, 2003
0304 Jahn, G. Zur Glaubwürdigkeit von Zertifizierungssystemen: eine ökonomische Analyse der Kontrollvalidität, 2003
Georg-August-Universität Göttingen Department für Agrarökonomie und Rurale Entwicklung
2004
0401 Meyer, J. u. S. von Cramon-Taubadel Asymmetric Price Transmission: a Survey, 2004
0402 Barkmann, J. u. R. Marggraf The Long-Term Protection of Biological Diversity: Lessons from Market Ethics, 2004
0403 Bahrs, E. VAT as an Impediment to Implementing Efficient Agricultural Marketing Structures in Transition Countries, 2004
0404 Spiller, A., T. Staack u. A. Zühlsdorf
Absatzwege für landwirtschaftliche Spezialitäten: Potenziale des Mehrkanalvertriebs, 2004
0405 Spiller, A. u. T. Staack Brand Orientation in der deutschen Ernährungswirtschaft: Ergebnisse einer explorativen Online-Befragung, 2004
0406 Gerlach, S. u. B. Köhler Supplier Relationship Management im Agribusiness: ein Konzept zur Messung der Geschäftsbeziehungsqualität, 2004
0407 Inderhees, P. et al. Determinanten der Kundenzufriedenheit im Fleischerfachhandel
0408 Lüth, M. et al. Köche als Kunden: Direktvermarktung landwirtschaftlicher Spezialitäten an die Gastronomie, 2004
2005
0501 Spiller, A., J. Engelken u. S. Gerlach
Zur Zukunft des Bio-Fachhandels: eine Befragung von Bio-Intensivkäufern, 2005
0502 Groth, M.
Verpackungsabgaben und Verpackungslizenzen als Alternative für ökologisch nachteilige Einweggetränkeverpackungen? Eine umweltökonomische Diskussion, 2005
0503 Freese, J. u. H. Steinmann
Ergebnisse des Projektes ‘Randstreifen als Strukturelemente in der intensiv genutzten Agrarlandschaft Wolfenbüttels’, Nichtteilnehmerbefragung NAU 2003, 2005
0504 Jahn, G., M. Schramm u. A. Spiller
Institutional Change in Quality Assurance: the Case of Organic Farming in Germany, 2005
0505 Gerlach, S., R. Kennerknecht u. A. Spiller
Die Zukunft des Großhandels in der Bio-Wertschöpfungskette, 2005
2006
0601 Heß, S., H. Bergmann u. L. Sudmann
Die Förderung alternativer Energien: eine kritische Bestandsaufnahme, 2006
0602 Gerlach, S. u. A. Spiller Anwohnerkonflikte bei landwirtschaftlichen Stallbauten: Hintergründe und Einflussfaktoren; Ergebnisse einer empirischen Analyse, 2006
0603 Glenk, K. Design and Application of Choice Experiment Surveys in
So-Called Developing Countries: Issues and Challenges,
0604 Bolten, J., R. Kennerknecht u. A. Spiller
Erfolgsfaktoren im Naturkostfachhandel: Ergebnisse einer empirischen Analyse, 2006 (entfällt)
0605 Hasan, Y. Einkaufsverhalten und Kundengruppen bei Direktvermarktern in Deutschland: Ergebnisse einer empirischen Analyse, 2006
0606 Lülfs, F. u. A. Spiller Kunden(un-)zufriedenheit in der Schulverpflegung: Ergebnisse einer vergleichenden Schulbefragung, 2006
0607 Schulze, H., F. Albersmeier u. A. Spiller
Risikoorientierte Prüfung in Zertifizierungssystemen der Land- und Ernährungswirtschaft, 2006
2007
0701 Buchs, A. K. u. J. Jasper For whose Benefit? Benefit-Sharing within Contractural ABC-Agreements from an Economic Prespective: the Example of Pharmaceutical Bioprospection, 2007
0702 Böhm, J. et al. Preis-Qualitäts-Relationen im Lebensmittelmarkt: eine Analyse auf Basis der Testergebnisse Stiftung Warentest, 2007
0703 Hurlin, J. u. H. Schulze Möglichkeiten und Grenzen der Qualitäts-sicherung in der Wildfleischvermarktung, 2007
Ab Heft 4, 2007:
Diskussionspapiere (Discussion Papers), Department für Agrarökonomie und Rurale Entwicklung Georg-August-Universität, Göttingen (ISSN 1865-2697)
0704 Stockebrand, N. u. A. Spiller Agrarstudium in Göttingen: Fakultätsimage und Studienwahlentscheidungen; Erstsemesterbefragung im WS 2006/2007
0705 Bahrs, E., J.-H. Held u. J. Thiering
Auswirkungen der Bioenergieproduktion auf die Agrarpolitik sowie auf Anreizstrukturen in der Landwirtschaft: eine partielle Analyse bedeutender Fragestellungen anhand der Beispielregion Niedersachsen
0706 Yan, J., J. Barkmann u. R. Marggraf
Chinese tourist preferences for nature based destinations – a choice experiment analysis
2008
0801 Joswig, A. u. A. Zühlsdorf Marketing für Reformhäuser: Senioren als Zielgruppe
0802 Schulze, H. u. A. Spiller Qualitätssicherungssysteme in der europäischen Agri-Food Chain: Ein Rückblick auf das letzte Jahrzehnt
0803 Gille, C. u. A. Spiller Kundenzufriedenheit in der Pensionspferdehaltung: eine empirische Studie
0804 Voss, J. u. A. Spiller Die Wahl des richtigen Vertriebswegs in den Vorleistungsindustrien der Landwirtschaft –
Konzeptionelle Überlegungen und empirische Ergebnisse
0805 Gille, C. u. A. Spiller Agrarstudium in Göttingen. Erstsemester- und Studienverlaufsbefragung im WS 2007/2008
0806 Schulze, B., C. Wocken u. A. Spiller
(Dis)loyalty in the German dairy industry. A supplier relationship management view Empirical evidence and management implications
0807 Brümmer, B., U. Köster u. J.-P. Loy
Tendenzen auf dem Weltgetreidemarkt: Anhaltender Boom oder kurzfristige Spekulationsblase?
0808 Schlecht, S., F. Albersmeier u. A. Spiller
Konflikte bei landwirtschaftlichen Stallbauprojekten: Eine empirische Untersuchung zum Bedrohungspotential kritischer Stakeholder
0809 Lülfs-Baden, F. u. A. Spiller Steuerungsmechanismen im deutschen Schulverpflegungsmarkt: eine institutionenökonomische Analyse
0810 Deimel, M., L. Theuvsen u. C. Ebbeskotte
Von der Wertschöpfungskette zum Netzwerk: Methodische Ansätze zur Analyse des Verbundsystems der Veredelungswirtschaft Nordwestdeutschlands
0811 Albersmeier, F. u. A. Spiller Supply Chain Reputation in der Fleischwirtschaft
2009
0901 Bahlmann, J., A. Spiller u. C.-H. Plumeyer
Status quo und Akzeptanz von Internet-basierten Informationssystemen: Ergebnisse einer empirischen Analyse in der deutschen Veredelungswirtschaft
0902 Gille, C. u. A. Spiller Agrarstudium in Göttingen. Eine vergleichende Untersuchung der Erstsemester der Jahre 2006-2009
0903 Gawron, J.-C. u. L. Theuvsen „Zertifizierungssysteme des Agribusiness im interkulturellen Kontext – Forschungsstand und Darstellung der kulturellen Unterschiede”
0904 Raupach, K. u. R. Marggraf Verbraucherschutz vor dem Schimmelpilzgift Deoxynivalenol in Getreideprodukten Aktuelle Situation und Verbesserungsmöglichkeiten
0905 Busch, A. u. R. Marggraf Analyse der deutschen globalen Waldpolitik im Kontext der Klimarahmenkonvention und des Übereinkommens über die Biologische Vielfalt
0906 Zschache, U., S. von Cramon-Taubadel u. L. Theuvsen
Die öffentliche Auseinandersetzung über Bioenergie in den Massenmedien - Diskursanalytische Grundlagen und erste Ergebnisse
0907 Onumah, E. E.,G. Hoerstgen-Schwark u. B. Brümmer
Productivity of hired and family labour and determinants of technical inefficiency in Ghana’s fish farms
0908 Onumah, E. E., S. Wessels, N. Wildenhayn, G. Hoerstgen-Schwark u. B. Brümmer
Effects of stocking density and photoperiod manipulation in relation to estradiol profile to enhance spawning activity in female Nile tilapia
0909 Steffen, N., S. Schlecht u. A. Spiller
Ausgestaltung von Milchlieferverträgen nach der Quote
0910 Steffen, N., S. Schlecht u. A. Spiller
Das Preisfindungssystem von Genossenschaftsmolkereien
0911 Granoszewski, K.,C. Reise, A. Spiller u. O. Mußhoff
Entscheidungsverhalten landwirtschaftlicher Betriebsleiter bei Bioenergie-Investitionen - Erste Ergebnisse einer empirischen Untersuchung -
0912 Albersmeier, F., D. Mörlein u. A. Spiller
Zur Wahrnehmung der Qualität von Schweinefleisch beim Kunden
0913 Ihle, R., B. Brümmer u. S. R. Thompson
Spatial Market Integration in the EU Beef and Veal Sector: Policy Decoupling and Export Bans
2010
1001 Heß, S., S. von Cramon-Taubadel u. S. Sperlich
Numbers for Pascal: Explaining differences in the estimated Benefits of the Doha Development Agenda
1002 Deimel, I., J. Böhm u. B. Schulze
Low Meat Consumption als Vorstufe zum Vegetarismus? Eine qualitative Studie zu den Motivstrukturen geringen Fleischkonsums
1003 Franz, A. u. B. Nowak Functional food consumption in Germany: A lifestyle segmentation study
1004 Deimel, M. u. L. Theuvsen
Standortvorteil Nordwestdeutschland? Eine Untersuchung zum Einfluss von Netzwerk- und Clusterstrukturen in der Schweinefleischerzeugung
1005 Niens, C. u. R. Marggraf Ökonomische Bewertung von Kindergesundheit in der Umweltpolitik - Aktuelle Ansätze und ihre Grenzen
1006
Hellberg-Bahr, A., M. Pfeuffer, N. Steffen, A. Spiller u. B. Brümmer
Preisbildungssysteme in der Milchwirtschaft -Ein Überblick über die Supply Chain Milch
1007 Steffen, N., S. Schlecht, H-C. Müller u. A. Spiller
Wie viel Vertrag braucht die deutsche Milchwirtschaft?- Erste Überlegungen zur Ausgestaltung des Contract Designs nach der Quote aus Sicht der Molkereien
1008 Prehn, S., B. Brümmer u. S. R. Thompson Payment Decoupling and the Intra – European Calf Trade
1009 Maza, B., J. Barkmann, F. von Walter u. R. Marggraf
Modelling smallholders production and agricultural income in the area of the Biosphere reserve “Podocarpus - El Cóndor”, Ecuador
1010 Busse, S., B. Brümmer u. R. Ihle
Interdependencies between Fossil Fuel and Renewable Energy Markets: The German Biodiesel Market
2011
1101 Mylius, D., S. Küest, C. Klapp u. L. Theuvsen
Der Großvieheinheitenschlüssel im Stallbaurecht - Überblick und vergleichende Analyse der Abstandsregelungen in der TA Luft und in den VDI-Richtlinien
1102 Klapp, C., L. Obermeyer u. F. Thoms
Der Vieheinheitenschlüssel im Steuerrecht - Rechtliche Aspekte und betriebswirtschaftliche Konsequenzen der Gewerblichkeit in der Tierhaltung
1103 Göser, T., L. Schroeder u. C. Klapp
Agrarumweltprogramme: (Wann) lohnt sich die Teilnahme für landwirtschaftliche Betriebe?
1104
Plumeyer, C.-H., F. Albersmeier, M. Freiherr von Oer, C. H. Emmann u. L. Theuvsen
Der niedersächsische Landpachtmarkt: Eine empirische Analyse aus Pächtersicht
1105 Voss, A. u. L. Theuvsen Geschäftsmodelle im deutschen Viehhandel: Konzeptionelle Grundlagen und empirische Ergebnisse
1106 Wendler, C., S. von Cramon-Taubadel, H. de Haen, C. A. Padilla Bravo u. S. Jrad
Food security in Syria: Preliminary results based on the 2006/07 expenditure survey
1107 Prehn, S. u. B. Brümmer Estimation Issues in Disaggregate Gravity Trade Models
1108 Recke, G., L. Theuvsen, N. Venhaus u. A. Voss
Der Viehhandel in den Wertschöpfungsketten der Fleischwirtschaft: Entwicklungstendenzen und Perspektiven
1109 Prehn, S. u. B. Brümmer “Distorted Gravity: The Intensive and Extensive Margins of International Trade”, revisited: An Application to an Intermediate Melitz Model
2012
1201 Kayser, M., C. Gille, K. Suttorp u. A. Spiller
Lack of pupils in German riding schools? – A causal- analytical consideration of customer satisfaction in children and adolescents
1202 Prehn, S. u. B. Brümmer Bimodality & the Performance of PPML
1203 Tangermann, S. Preisanstieg am EU-Zuckermarkt: Bestimmungsgründe und Handlungsmöglichkeiten der Marktpolitik
1204 Würriehausen, N., S. Lakner u. Rico Ihle
Market integration of conventional and organic wheat in Germany
1205 Heinrich, B. Calculating the Greening Effect – a case study approach to predict the gross margin losses in different farm types in Germany due to the reform of the CAP
1206 Prehn, S. u. B. Brümmer A Critical Judgement of the Applicability of ‘New New Trade Theory’ to Agricultural: Structural Change, Productivity, and Trade
1207 Marggraf, R., P. Masius u. C. Rumpf
Zur Integration von Tieren in wohlfahrtsökonomischen Analysen
1208
S. Lakner, B. Brümmer, S. von Cramon-Taubadel J. Heß, J. Isselstein, U. Liebe, R. Marggraf, O. Mußhoff, L. Theuvsen, T. Tscharntke, C. Westphal u. G. Wiese
Der Kommissionsvorschlag zur GAP-Reform 2013 - aus Sicht von Göttinger und Witzenhäuser Agrarwissenschaftler(inne)n
1209 Prehn, S., B. Brümmer u. T. Glauben Structural Gravity Estimation & Agriculture
1210 Prehn, S., B. Brümmer u. T. Glauben
An Extended Viner Model: Trade Creation, Diversion & Reduction
1211 Salidas, R. u. S. von Cramon-Taubadel
Access to Credit and the Determinants of Technical Inefficiency among Specialized Small Farmers in Chile
1212 Steffen, N. u. A. Spiller Effizienzsteigerung in der Wertschöpfungskette Milch ? -Potentiale in der Zusammenarbeit zwischen Milcherzeugern und Molkereien aus Landwirtssicht
1213 Mußhoff, O., A. Tegtmeier u. N. Hirschauer
Attraktivität einer landwirtschaftlichen Tätigkeit - Einflussfaktoren und Gestaltungsmöglichkeiten
2013
1301 Lakner, S., C. Holst u. B. Heinrich
Reform der Gemeinsamen Agrarpolitik der EU 2014
- mögliche Folgen des Greenings für die niedersächsische Landwirtschaft
1302 Tangermann, S. u. S. von Cramon-Taubadel
Agricultural Policy in the European Union : An Overview
1303 Granoszewski, K. u. A. Spiller Langfristige Rohstoffsicherung in der Supply Chain Biogas : Status Quo und Potenziale vertraglicher Zusammenarbeit
1304
Lakner, S., C. Holst, B. Brümmer, S. von Cramon-Taubadel, L. Theuvsen, O. Mußhoff u. T.Tscharntke
Zahlungen für Landwirte an gesellschaftliche Leistungen koppeln! - Ein Kommentar zum aktuellen Stand der EU-Agrarreform
1305 Prechtel, B., M. Kayser u. L. Theuvsen
Organisation von Wertschöpfungsketten in der Gemüseproduktion : das Beispiel Spargel
1306 Anastassiadis, F., J.-H. Feil, O. Musshoff u. P. Schilling
Analysing farmers' use of price hedging instruments : an experimental approach
1307 Holst, C. u. S. von Cramon-Taubadel
Trade, Market Integration and Spatial Price Transmission on EU Pork Markets following Eastern Enlargement
1308 Granoszewki, K., S. Sander, V. M. Aufmkolk u. A. Spiller
Die Erzeugung regenerativer Energien unter gesellschaftlicher Kritik : Akzeptanz von Anwohnern gegenüber der Errichtung von Biogas- und Windenergieanlagen
2014
1401 Lakner, S., C. Holst, J. Barkmann, J. Isselstein u. A. Spiller
Perspektiven der Niedersächsischen Agrarpolitik nach 2013 : Empfehlungen Göttinger Agrarwissenschaftler für die Landespolitik
1402 Müller, K., Mußhoff, O. u. R. Weber
The More the Better? How Collateral Levels Affect Credit Risk in Agricultural Microfinance
1403 März, A., N. Klein, T. Kneib u. O. Mußhoff
Analysing farmland rental rates using Bayesian geoadditive quantile regression
1404 Weber, R., O. Mußhoff u. M. Petrick
How flexible repayment schedules affect credit risk in agricultural microfinance
1405
Haverkamp, M., S. Henke, C., Kleinschmitt, B. Möhring, H., Müller, O. Mußhoff, L., Rosenkranz, B. Seintsch, K. Schlosser u. L. Theuvsen
Vergleichende Bewertung der Nutzung von Biomasse : Ergebnisse aus den Bioenergieregionen Göttingen und BERTA
1406 Wolbert-Haverkamp, M. u. O. Musshoff
Die Bewertung der Umstellung einer einjährigen Ackerkultur auf den Anbau von Miscanthus – Eine Anwendung des Realoptionsansatzes
1407 Wolbert-Haverkamp, M., J.-H. Feil u. O. Musshoff
The value chain of heat production from woody biomass under market competition and different incentive systems: An agent-based real options model
1408 Ikinger, C., A. Spiller u. K. Wiegand
Reiter und Pferdebesitzer in Deutschland (Facts and Figures on German Equestrians)
1409 Mußhoff, O., N. Hirschauer, S. Grüner u. S. Pielsticker
Der Einfluss begrenzter Rationalität auf die Verbreitung von Wetterindexversicherungen : Ergebnisse eines internetbasierten Experiments mit Landwirten
1410 Spiller, A. u. B. Goetzke Zur Zukunft des Geschäftsmodells Markenartikel im Lebensmittelmarkt
1411 Wille, M. ‚Manche haben es satt, andere werden nicht satt‘ : Anmerkungen zur polarisierten Auseinandersetzung um Fragen des globalen Handels und der Welternährung
1412 Müller, J., J. Oehmen, I. Janssen u. L. Theuvsen
Sportlermarkt Galopprennsport : Zucht und Besitz des Englischen Vollbluts
2015
1501 Hartmann, L. u. A. Spiller Luxusaffinität deutscher Reitsportler : Implikationen für das Marketing im Reitsportsegment
1502 Schneider, T., L. Hartmann u. A. Spiller
Luxusmarketing bei Lebensmitteln : eine empirische Studie zu Dimensionen des Luxuskonsums in der Bundesrepublik Deutschland
1503 Würriehausen, N. u. S. Lakner Stand des ökologischen Strukturwandels in der ökologischen Landwirtschaft
1504 Emmann, C. H., D. Surmann u. L. Theuvsen
Charakterisierung und Bedeutung außerlandwirt-schaftlicher Investoren : empirische Ergebnisse aus Sicht des landwirtschaftlichen Berufsstandes
1505 Buchholz, M., G. Host u. Oliver Mußhoff
Water and Irrigation Policy Impact Assessment Using Business Simulation Games : Evidence from Northern Germany
1506 Hermann, D.,O. Mußhoff u. D. Rüther
Measuring farmers‘ time preference : A comparison of methods
1507 Riechers, M., J. Barkmann u. T. Tscharntke
Bewertung kultureller Ökosystemleistungen von Berliner Stadtgrün entlang eines urbanen-periurbanen Gradienten
1508 Lakner, S., S. Kirchweger, D. Hopp, B. Brümmer u. J. Kantelhardt
Impact of Diversification on Technical Efficiency of Organic Farming in Switzerland, Austria and Southern Germany
1509 Sauthoff, S., F. Anastassiadis u. O. Mußhoff
Analyzing farmers‘ preferences for substrate supply contracts for sugar beets
1510 Feil, J.-H., F. Anastassiadis, O. Mußhoff u. P. Kasten
Analyzing farmers‘ preferences for collaborative arrangements : an experimental approach
1511 Weinrich, R., u. A. Spiller Developing food labelling strategies with the help of extremeness aversion
1512 Weinrich, R., A. Franz u. A. Spiller
Multi-level labelling : too complex for consumers?
1513 Niens, C., R. Marggraf u. F. Hoffmeister
Ambulante Pflege im ländlichen Raum : Überlegungen zur effizienten Sicherstellung von Bedarfsgerechtigkeit
Diskussionspapiere 2000 bis 31. Mai 2006:
Institut für Rurale Entwicklung
Georg-August-Universität, Göttingen)
Ed. Winfried Manig (ISSN 1433-2868)
32 Dirks, Jörg J. Einflüsse auf die Beschäftigung in nahrungsmittelverabeitenden ländlichen Kleinindustrien in West-Java/Indonesien, 2000
33 Keil, Alwin Adoption of Leguminous Tree Fallows in Zambia, 2001
34 Schott, Johanna Women’s Savings and Credit Co-operatives in Madagascar, 2001
35 Seeberg-Elberfeldt, Christina Production Systems and Livelihood Strategies in Southern Bolivia, 2002
36 Molua, Ernest L. Rural Development and Agricultural Progress: Challenges, Strategies and the Cameroonian Experience, 2002
37 Demeke, Abera Birhanu Factors Influencing the Adoption of Soil Conservation Practices in Northwestern Ethiopia, 2003
38 Zeller, Manfred u. Julia Johannsen
Entwicklungshemmnisse im afrikanischen Agrarsektor: Erklärungsansätze und empirische Ergebnisse, 2004
39 Yustika, Ahmad Erani Institutional Arrangements of Sugar Cane Farmers in East Java – Indonesia: Preliminary Results, 2004
40 Manig, Winfried Lehre und Forschung in der Sozialökonomie der Ruralen Entwicklung, 2004
41 Hebel, Jutta Transformation des chinesischen Arbeitsmarktes: gesellschaftliche Herausforderungen des Beschäftigungswandels, 2004
42 Khan, Mohammad Asif Patterns of Rural Non-Farm Activities and Household Acdess to Informal Economy in Northwest Pakistan, 2005
43 Yustika, Ahmad Erani Transaction Costs and Corporate Governance of Sugar Mills in East Java, Indovesia, 2005
44 Feulefack, Joseph Florent, Manfred Zeller u. Stefan Schwarze
Accuracy Analysis of Participatory Wealth Ranking (PWR) in Socio-economic Poverty Comparisons, 2006
Georg-August-Universität Göttingen Department für Agrarökonomie und Rurale Entwicklung
Die Wurzeln der Fakultät für Agrarwissenschaften reichen in das 19. Jahrhundert zurück. Mit Ausgang des Wintersemesters 1951/52 wurde sie als siebente Fakultät an der Georgia-Augusta-Universität durch Ausgliederung bereits existierender landwirtschaftlicher Disziplinen aus der Mathematisch-Naturwissenschaftlichen Fakultät etabliert. 1969/70 wurde durch Zusammenschluss mehrerer bis dahin selbständiger Institute das Institut für Agrarökonomie gegründet. Im Jahr 2006 wurden das Institut für Agrarökonomie und das Institut für Rurale Entwicklung zum heutigen Department für Agrarökonomie und Rurale Entwicklung zusammengeführt. Das Department für Agrarökonomie und Rurale Entwicklung besteht aus insgesamt neun Lehrstühlen zu den folgenden Themenschwerpunkten:
- Agrarpolitik - Betriebswirtschaftslehre des Agribusiness - Internationale Agrarökonomie - Landwirtschaftliche Betriebslehre - Landwirtschaftliche Marktlehre - Marketing für Lebensmittel und Agrarprodukte - Soziologie Ländlicher Räume - Umwelt- und Ressourcenökonomik - Welternährung und rurale Entwicklung
In der Lehre ist das Department für Agrarökonomie und Rurale Entwicklung führend für die Studienrichtung Wirtschafts- und Sozialwissenschaften des Landbaus sowie maßgeblich eingebunden in die Studienrichtungen Agribusiness und Ressourcenmanagement. Das Forschungsspektrum des Departments ist breit gefächert. Schwerpunkte liegen sowohl in der Grundlagenforschung als auch in angewandten Forschungsbereichen. Das Department bildet heute eine schlagkräftige Einheit mit international beachteten Forschungsleistungen. Georg-August-Universität Göttingen Department für Agrarökonomie und Rurale Entwicklung Platz der Göttinger Sieben 5 37073 Göttingen Tel. 0551-39-4819 Fax. 0551-39-12398 Mail: [email protected] Homepage : http://www.uni-goettingen.de/de/18500.html
Georg-August-Universität Göttingen Department für Agrarökonomie und Rurale Entwicklung
Recommended