Divided Exhaust Period on
Heavy-Duty Diesel Engines
Stefan Gundmalm
Licentiate thesis Department of Machine Design
Royal Institute of Technology
SE-100 44 Stockholm
TRITA – MMK 2013:01 ISSN 1400-1179
ISRN/KTH/MMK/R-13/01-SE
ISBN 978-91-7501-605-4

TRITA – MMK 2013:01
ISSN 1400-1179
ISRN/KTH/MMK/R-13/01-SE
ISBN 978-91-7501-605-4
Divided Exhaust Period on Heavy-Duty Diesel Engines
Stefan Gundmalm
Licentiate thesis
Academic thesis, which with the approval of Kungliga Tekniska Högskolan, will be presented
for public review in fulfilment of the requirements for a Licentiate of Engineering in Machine
Design. The public review is held at Kungliga Tekniska Högskolan, Brinellvägen 83, room
B319 Gladan, 25th of January 2013 at 10:00.

i
Abstract
Due to growing concerns regarding global energy security and environmental
sustainability it is becoming increasingly important to increase the energy
efficiency of the transport sector. The internal combustion engine will probably
continue to be the main propulsion system for road transportation for many
years to come. Hence, much effort must be put in reducing the fuel
consumption of the internal combustion engine to prolong a future decline in
fossil fuel production and to reduce greenhouse gas emissions.
Turbocharging and variable valve actuation applied to any engine has shown
great benefits to engine efficiency and performance. However, using a
turbocharger on an engine gives some drawbacks. In an attempt to solve some
of these issues and increase engine efficiency further this thesis deals with the
investigation of a novel gas exchange concept called divided exhaust period
(DEP). The core idea of the DEP concept is to utilize variable valve timing
technology on the exhaust side in combination with turbocharging. The principle
of the concept is to let the initial high energy blow-down pulse feed the
turbocharger, but bypass the turbine during the latter part of the exhaust stroke
when back pressure dominates the pumping work. The exhaust flow from the
cylinder is divided between two exhaust manifolds of which one is connected to
the turbine, and one bypasses the turbine. The flow split between the manifolds
is controlled with a variable valve train system.
The DEP concept has been studied through simulations on three heavy-duty
diesel engines; one without exhaust gas recirculation (EGR), one with short
route EGR and one with long route EGR. Simulations show a potential
improvement to pumping work, due to reduced backpressure, with increased
overall engine efficiency as a result. Although, the efficiency improvement is
highly dependent on exhaust valve size and configuration due to issues with
choked flow in the exhaust valves. The EGR system of choice also proves to
have a high impact on the working principle of the DEP application.
Furthermore, the DEP concept allows better control of the boost pressure and
allows the turbine to operate at higher efficiency across the whole load and speed
range. The option of discarding both wastegate and variable geometry turbine is
apparent, and there is little need for a twin-entry type turbine since pulse
interference between cylinders is less of an issue.

ii
List of Publications
Paper I
Divided Exhaust Period on Heavy-Duty Diesel Engines
S. Gundmalm, A. Cronhjort, H.E. Ångström
Proceedings of THIESEL 2012 Conference on Thermo- and Fluid Dynamic
Processes in Direct Injection Engines
Presented at the THIESEL 2012 Conference.
11th-14th of September 2012, Valencia, Spain.
Paper II
Divided Exhaust Period: Effects of Changing the Relation between
Intake, Blow-Down and Scavenging Valve Area
S. Gundmalm, A. Cronhjort, H.E. Ångström
SAE Technical Paper 2013
To be presented at the SAE 2013 World Congress & Exhibition.
16th-18th of April 2013, Detroit, Michigan USA.

iii
Preface
This PhD project is funded by the Competence Center for Gas Exchange,
CCGEx. Main partners of CCGEx are the Swedish vehicle OEM’s, the Swedish
Energy Agency and KTH. The aim of CCGEx is to perform demand driven
research within the field of internal combustion engines, with focus on gas
exchange and charging systems/processes as well as strategic engine
components. CCGEx and its partners are greatly acknowledged for the financial
and practical support.
I would like to especially thank my main supervisor Hans-Erik Ångström and my
co-supervisors Andreas Cronhjort and Nils Tillmark for the guidance and the
fruitful discussions. Many thanks also to Martin Örtengren and Daniel Norling
for the practical help on behalf of Scania CV AB. To all my present and former
colleagues at the department of internal combustion engines, thank you for
creating a nice working atmosphere.
To my family, for your support and patience.
January 2013, Stockholm
Stefan Gundmalm

iv
Abbreviations
BDC bottom dead center
BDEVC blow-down exhaust valve closing
BDEVO blow-down exhaust valve opening
BMEP break mean effective pressure
BSFC break specific fuel consumption
CAD crank angle degrees
CI compression ignited
DEP divided exhaust period
EGR exhaust gas recirculation
ESC European stationary cycle
FVVT fully variable valve train
HC hydrocarbons
HCCI homogenous charge compression ignition
ICE internal combustion engine
IMEPG gross indicated mean effective pressure
IMEPN net indicated mean effective pressure
IVC intake valve closing
IVO intake valve opening
LR long route
PMEP pumping mean effective pressure
RPM revolutions per minute
SEVC scavenging exhaust valve closing
SEVO scavenging exhaust valve opening
SI spark ignited
SR short route
TD turbo-discharging
TDC(F) top dead center (firing)
VEMB valve-event modulated boost
VGT variable geometry turbine
VVT variable valve timing
v
Contents
Abstract ................................................................................................................................... i
List of Publications ............................................................................................................... ii
Preface ................................................................................................................................... iii
Abbreviations ........................................................................................................................ iv
CHAPTER 1 Introduction ........................................................................................... 1
1.1 Turbocharging ................................................................................................. 1
1.2 Variable valve actuation ................................................................................. 7
1.3 Motivation ..................................................................................................... 10
1.4 Objectives ...................................................................................................... 11
CHAPTER 2 Divided Exhaust Period ..................................................................... 13
2.1 Technical concept ......................................................................................... 13
2.2 DEP in literature .......................................................................................... 16
2.3 Thesis contribution ...................................................................................... 19
CHAPTER 3 Engine Simulation Tool ..................................................................... 21
3.1 Flow modeling .............................................................................................. 21
3.2 Combustion modeling ................................................................................. 23
3.3 Valve modeling ............................................................................................. 24
3.4 Turbocharger modeling ............................................................................... 25
CHAPTER 4 Methodology ........................................................................................ 29
4.1 Baseline engine models ................................................................................ 29
4.2 DEP model implementation ....................................................................... 31
4.3 Operating conditions ................................................................................... 31
4.4 Optimization procedure .............................................................................. 33
CHAPTER 5 Results ................................................................................................... 35
5.1 Studied cases ................................................................................................. 35
5.2 The non-EGR case ...................................................................................... 35
5.3 The SR-EGR case ........................................................................................ 39
5.4 The LR-EGR case ........................................................................................ 43
5.5 Complementing results ................................................................................ 46
5.6 Discussion ..................................................................................................... 52
vi
CHAPTER 6 Conclusions and Outlook .................................................................. 57
6.1 Conclusions ................................................................................................... 57
6.2 Suggestions for future work ....................................................................... 58
APPENDIX A Pulsating Flow Rig ........................................................................... 61
A.1 Experimental setup ...................................................................................... 61
A.2 Simulation setup ........................................................................................... 63
A.3 Results and discussion ................................................................................. 65
A.4 Summary ........................................................................................................ 68
A.5 Acknowledgements ...................................................................................... 68
References ............................................................................................................................ 69

1
CHAPTER 1
Introduction
The price of conventional fuels will probably continue to be volatile during the
coming years due to growing concerns on global oil scarcity [1], and a CO2 limit
for heavy-duty vehicles is under discussion. Thus it is becoming increasingly
important to reduce the fuel consumption of the internal combustion engine
(ICE) both from an environmental and energy security perspective, as well as for
the sake of the end consumer’s fuel economy. The reduction of fuel
consumption should preferably be achieved while simultaneously keeping or
even exceeding the present performance levels. This creates, together with
increasingly stringent emission legislations, a very tough challenge for engine
developers as these factors usually contradict each other. Engine development is
carried out in many different research areas which when combined creates small
but steady performance improvements as have been seen over the now around
hundred year life span of the ICE. While big technology leaps have been
performed in the past, increasing engine efficiency by several percent each year,
the steps taken today are smaller and more costly. To further move closer to the
theoretical or ideal efficiency of the ICE, improvements need to be made in all
areas such as combustion efficiency, thermal efficiency, friction and pumping
work. Two of the research areas that have become more and more prominent
during the last years are turbocharging and variable valve train technology. The
divided exhaust period (DEP) concept aims at combining the positive effects of
using a turbocharger while removing some of the negative aspects, with the use
of a variable valve timing (VVT) system on the exhaust side. In this thesis the
feasibility of the DEP concept, when applied to heavy-duty diesel engines, is
investigated. This chapter will present an introduction to turbocharging and
variable valve timing as well as a brief motivation and main objectives of the
thesis.
1.1 Turbocharging
Turbocharging of the ICE is a means of utilizing the otherwise wasted exhaust
gas energy to increase the inlet air density and is one of the oldest waste heat

2
recovery measures found for the ICE [2]. This is done with a turbine driven
compressor, where the exhaust gas expanded through the turbine will power the
compressor, which in turn will compress the inlet air, increasing its density.
Increased inlet air density brings the possibility to combust a proportionally
larger amount of fuel and the power output of the engine is increased. For a
schematic drawing of a turbocharging system see Figure 1.1.
FIGURE 1.1. Schematic of a turbocharger system. Image from BTN Turbo (www.btnturbo.com).
The working principle of the turbocharger system is to use the turbine to expand
the high pressure and high temperature exhaust gas that is expelled from the
engine cylinder after combustion. Roughly 30-40 % of the energy released from
combustion appears as energy in the exhaust gas [3]. The power extracted from
the exhaust gas by the turbine wheel, is used to drive the compressor wheel
which is connected via the turbocharger shaft. The compressor wheel will
compress the incoming air above ambient pressure, increasing its density and
oxygen content. The air temperature will also increase during this compression
phase and it is common to cool it through a charge air cooler, further increasing
the density, before inducing it into the cylinder. With a larger charge mass
containing more oxygen, more fuel can be combusted which will increase the
power output of the engine. Inversely, with constant power output the cylinder
size can be reduced for increased engine efficiency which is referred to as down-
sizing. This is especially true for spark-ignited (SI) engines which suffer from
throttle losses at part load [4]. However, there are limitations to how much the
inlet air mass can be increased. Firstly, the mechanical loading of the engine is
limited by the peak cylinder pressure. By increasing the inlet air pressure and

3
amount of fuel burnt, the cylinder pressure during combustion will also increase
and the structural design of the engine will set a limit for the peak cylinder
pressure. Secondly, the thermal loading limit is set by combustion temperature
which increases with increased levels of boosting. Too high in-cylinder and
exhaust gas temperature can damage engine components, such as the turbine
wheel. Furthermore, in pre-mixed combustion systems where the air and fuel is
mixed before it is ignited there is a risk of pre-ignitions or onset of knock due to
high in-cylinder gas temperature or component (injector, valves, spark plugs etc.)
temperatures. The boost level limits can be adjusted by changing the
compression ratio. For a certain compression ratio and turbocharger setup,
exceeding the thermal and mechanical limits during engine operation can be
avoided by using a wastegate or retarding the combustion process. The wastegate
is basically a pressure valve that lets exhaust gas bypass the turbine, thus
reducing the amount of work extracted by the turbine and reducing the charge
pressure.
1.1.1 Utilization of exhaust gas energy
As mentioned above the exhaust gas energy expelled from the cylinder can
contain 30-40 % of the total fuel energy released during combustion. The ability
to extract a part of this energy in an efficient way in the turbine can have a large
effect on total engine performance. The principle on which this otherwise
wasted energy is utilized in a turbocharged engine is explained with the help of
Figure 1.2.
FIGURE 1.2. Ideal cylinder pressure vs. volume diagram for a turbocharged engine [3].

4
After the expansion phase (3-4) when the exhaust valves open at point 4 the
cylinder content still has high pressure and temperature which in a naturally
aspirated engine is wasted to the atmosphere. If the gas could be expanded in the
cylinder further down to point 9 the energy represented by the area 4-9-10,
commonly referred to as the blow-down energy, could theoretically be
recovered. Instead of expanding it in the cylinder, the exhaust gas can be
expanded in a turbine. The exhaust energy can be extracted with a turbine in
mainly two ways, with a constant pressure or pulse pressure system.
A constant pressure system is achieved if the manifold volume is large enough to
damp out any pressure pulsations from the exhaust valve events. When the
exhaust valves open at point 4 the gas expands through the valve to point 5.
During blow-down phase and the remaining exhaust stroke (5-6) the manifold
and turbine inlet pressure remains constant and equal to pex. Hence, the kinetic
energy and the high pressure of the blow-down pulse are not utilized for turbine
work. The advantage with a constant pressure system is that the turbine will
work under steady state conditions for which it can be optimized and a higher
efficiency is therefore achieved.
As a way to recover a part of the blow-down energy, a pulse pressure system can
be used instead. This is achieved if the manifold volume is kept to a minimum
that will cause no damping of pressure pulsations. When the exhaust valves open
at point 4, the pressure pulse caused by the cylinder pressure falling from 4-5 will
be utilized by the turbine. The turbine inlet pressure will then fall from 4 and
ideally down to 9 recovering the whole of the blow-down energy represented by
the area 4-9-10. This is the ideal case where the turbine inlet pressure would need
to reach cylinder pressure instantaneously at point 4 and then the manifold
pressure would need to expand completely down to ambient. In reality this is not
possible since there are flow losses in the valves, and with practical turbines
there will always be a pressure drop over the turbine. Hence, for the real
application only a part of the theoretically available blow-down energy (area 4-9-
10) can be utilized due to these two reasons. The down-side to this system is that
the turbine will only operate momentarily at its design point and the efficiency
will suffer. The energy available for conversion is larger, but the efficiency of
conversion will be lower. However, in most automotive application the pulse
pressure system have shown larger overall benefits and is most commonly used.

5
1.1.2 A note on pumping work
To clarify, this section will briefly define what is being refereed to when
discussing pumping work. Throughout the thesis the pumping mean effective
pressure (PMEP) will be used as defined by Equation 1.1.
∫
(1.1)
Where is cylinder pressure, is cylinder volume and is the displacement
volume. PMEP is then calculated as an average of all cylinders. Pumping work is
proportional to PMEP but with a different unit. PMEP multiplied by gives
pumping work in joules per cycle. Hence, PMEP is a measure of pumping work
where the work has been normalized by the displacement volume so that engines
of different size can be compared to each other. In short, PMEP is the work
added to the crankshaft during the exhaust and intake stroke and is linked to the
work it takes to exchange the exhaust gas with the fresh charge. This means that
with positive PMEP, work is added to the crankshaft during the gas exchange
phase. With negative PMEP, work is subtracted. Consequently, a higher positive
PMEP is better for engine efficiency than a negative PMEP.
Pumping work exists in all engine types, naturally aspirated as well as
turbocharged. For turbocharged applications, pumping work can be explained
with the help of Figure 1.2. During the intake stroke (7-1) the higher than
ambient pressure pin will push the piston down, adding work to the crankshaft.
During the exhaust stroke (5-6) the piston needs to push against the pressure pex
which subtracts work from the crankshaft. The total pumping work or PMEP is
then represented by the area 1-5-6-7. Since the intake pressure is higher than the
exhaust pressure, PMEP will be positive and consequently add work to the
crankshaft. Let’s assume that pex is higher than pin, then work is still added to the
crankshaft during the intake stroke. However, the work subtracted during the
exhaust stroke is larger, resulting in a total PMEP that is negative and
consequently subtracting work from the crankshaft when looking at the whole
gas exchange cycle. Total engine efficiency is then reduced.
1.1.3 Issues with turbocharging
Even though the overall effect of turbocharging gives a benefit in terms of both
performance and efficiency some issues arise when applying a turbo machine to
the internal combustion engine. The DEP concept aims at resolving some of

6
these issues described below. More on how they can be resolved will be
discussed in Chapter 5.6.
(i)
Due to the reciprocating nature of the ICE, and the fact that the turbocharger is
a rotary device, makes it difficult to match the two machines together. The ICE
is basically a displacement pump where the flow out of the cylinders is highly
pulsating and the total mass flow through it varies within a large span depending
on engine speed. The characteristics of a turbine instead are that of a nozzle
where the pressure ratio across the turbine is proportional to the density and the
square of the flow velocity. This means that at low engine speeds and low mass
flow rates, the expansion ratio is low leading to low power output. For high
engine speeds and mass flow rates the turbine eventually becomes choked or
gives too much power to the compressor. The problem of matching the
turbocharger to the engine which operates at a large span of engine speeds and
mass flow rates then becomes apparent.
(ii)
Since the turbo machine is a rotary device, its optimal and highest efficiency
operating condition is during steady state flow with a certain mass flow and
pressure ratio. This becomes a problem since the exhaust flow of the ICE is
highly pulsating due to the blow-down and exhaust stroke events described
previously. This in turn will result in a situation where the turbine only operates
with its highest efficiency during a part of the whole duration of the engine cycle
[3]. Hence, for the on engine application, it is only during small range of engine
speed and only during a part of the whole exhaust period that the turbine will
operate at its highest efficiency.
(iii)
Introducing a turbocharger on the engine will cause a backpressure that the
piston has to work against as it expels the exhaust gas from the cylinder during
the exhaust stroke. This leads to reduced pumping work. As explained above,
some of this lost work is recovered in the turbine.
(iv)
The backpressure that the turbine creates also causes a larger amount of hot
residuals to be trapped in the cylinder since it will be more difficult to evacuate
all the burnt gases against this backpressure. High backpressure and more hot
residuals will affect engine performance in a variety of ways. Higher
backpressure will cause a backflow of the exhaust gas into the intake manifold.
Together with a larger amount of hot residuals (with higher density) this will

7
decrease the volumetric efficiency, or the amount of fresh charge that can be
induced. More residuals can lead to abnormal combustion phenomena such as
knock in SI engines (since the in-cylinder temperature is increased) or it can
affect NOx and soot emissions for diffusion type combustion [4].
(v)
The turbocharger will affect the transient response of the engine. Since the
power output of the engine is directly related to the induced mass flow, a rapid
increase in mass flow is required to achieve a fast transient response when
increasing engine torque. However, the exhaust gas energy delivered to the
turbine must first be used to increase the turbocharger speed before it can
deliver sufficient power to the compressor to increase the air flow to the engine.
The time it takes for the turbocharger to spin up is referred to as turbocharger
lag, and it results in an engine torque increase that is delayed.
(vi)
Due to the difficulties matching the turbocharger to the ICE explained above, if
a large turbocharger is chosen it will operate with high efficiency at high load and
engine speed but the efficiency will be poor for low load and speed. The
turbocharger lag will also be more severe with a larger turbocharger. If a small
turbocharger is chosen, it will operate with high efficiency at low load and speed
and the turbocharger lag will be reduced. However, at high load and speed the
efficiency will be poor and due to choking of the turbine and the need to limit
boost pressure at high load, a wastegate might be required. By introducing a
wastegate a part of the energy available from the exhaust gas will not be utilized
since a part of the mass flow bypasses the turbine wheel. With opened wastegate
the pressure ratio and mass flow is reduced and consequently the total
turbocharger efficiency is also reduced. This in turn leads to decreased PMEP.
1.2 Variable valve actuation
In this section a brief introduction to variable valve actuation will be given. The
first part will present some common variable valve train systems and the second
part will present ways in which variable valve timing strategies can be applied to
internal combustion engines.
1.2.1 Variable valve train systems
The development from the conventional fixed camshaft driven valve train
systems to the camless fully variable valve train (FVVT) has gone through many
phases. The conventional fixed camshaft driven system works on the principle
that the cam lobe situated on the camshaft (which rotates with half the engine

8
speed) will push the valve down against a valve spring. The valve spring will
force the valve to a closed position on the way back. This kind of system is
cheap to manufacture and operate but gives a fixed valve lift event. Since optimal
valve timing is different at low and high speeds these fixed system will always
represent a compromise.
The first step to move away from this compromise was to incorporate variable
phasing systems of the camshaft. With this system it is possible to change the
opening and closure time of the valve, though not independently of each other.
This is done through a mechanism that allows the camshaft to be rotated in
respect to the crankshaft. Note that with this system the duration of the valve
event is still fixed. The first manufacturer to incorporate this system in
production engines was Alfa Romeo based on a patent from 1980 [5].
Following that, was the implementation of cam profile switching system which
can be done in many different ways but follows the same principle. By switching
between, usually two, different cam lobes different valve lift heights and
durations are possible. This kind of system was presented by Honda under the
name VTEC [6]. Furthermore, by combining this type of cam switching system
with a phasing system it is possible to vary both the opening time and duration
of the valve event. This type of system was for example introduced on the
Porsche 911 Turbo engine under the name VarioCam Plus [7].
The change to fully variable cam shaft based systems followed shortly after
which made it possible to change the valve lift height continuously instead of just
discrete steps. One of these systems is Valvetronic manufactured by BMW [8].
This system combines a phasing system with a mechanism that allows
continuous adjustments to valve lift height. This is done through a conventional
primary cam shaft with a variable phasing mechanism. However, a secondary
eccentric shaft in connection with a series of levers and rollers acting on the
valves makes it possible to regulate the impact that the primary cam lobe has on
the valve itself. The levers are regulated continuously with an electric motor,
resulting in a continuous variation of the valve lift and duration.
A lost-motion system is based on a conventional camshaft but incorporates a
hydraulic link between camshaft and valve. The pressure in this hydraulic link is
controlled by a solenoid. The oil in this link acts as a rigid body, making the
valve follow the lift profile of the cam lobe. If the pressure in the hydraulic link
is released by the solenoid the valve closes independently of the cam lobe
position. This makes it possible to vary the duration of the valve lift or use
multiple valve lift during one cycle. Currently the only mass produced valve
9
system of this kind is the UniAir [9] system developed by Schaeffler Group and
Fiat Group. This system also goes under the name of MultiAir [10] when
incorporated into Fiat Group products.
During the last few years the development of camless valve actuation systems
has progressed rapidly. Some examples of these are an electromagnetic system
from GM [11], an electro-hydraulic system from Lotus [12] and an electro-
pneumatic system from Cargine Engineering [13]. The advantage of these
systems is the total control of the valve opening event considering
opening/closure time and lift height. The disadvantage is that they are still quite
complex and expensive and there are still stability issues when running on the
engine especially when opening against high pressures.
1.2.2 Application of variable valve timing
VVT systems are used for many different applications and engine types and
there are of course numerous publications on this topic and just a few examples
will be given in this section, with focus on compression ignited (CI) engines. For
SI engines the main reason for using variable valve trains is to optimize the gas
exchange process and cylinder charge filling for the whole engine speed range.
Lately with the introduction of fully variable camshaft based valve systems it is
also possible to remove the intake throttle and therefore removing the negative
pumping work that comes with it. Throttle-less SI engines utilizing VVT are
presented in [10,14]. In these engines the focus is on the intake side whereas in
[15] for example more focus is put on the variation of the exhaust valve timing
to optimize it together with a variable geometry turbine.
For CI engines the use of variable valve trains are less common in production
engines. This is mainly because of the much smaller engine speed range of the CI
engine, and the need to optimize the gas exchange process for a wide speed
range is not as critical as for the SI engine. There is also no intake throttle in
conventional CI applications. Even so, studies of VVT on diesel engines have
been performed in several publications from which some examples will follow.
In [16], the potential of increase in output torque was shown by optimizing the
intake and exhaust valve timing together with the turbocharger. In [17] the
conclusion from using a VVT system on a single-cylinder CI engine was that
there was no significant improvement to pumping work as compared to SI
engines, but it showed to be useful for emission reduction by the use of internal
exhaust gas recirculation (EGR). Improvement in low-end torque and fuel
consumption by optimizing the cylinder charging was shown in [18] where the

10
authors also concludes that the VVT system offers fast and accurate control of
internal EGR. Improvements in warm-up abilities and control of exhaust gas
temperature was proved with better catalyst efficiency and particle filter
regeneration as an effect. Improvement of fuel consumption of up to 6 % by
improved cylinder charging with the use of VVT was presented in [19].
A common research area for FVVT systems is for homogenous charge
compression ignition (HCCI) engines where the full variability is essential to
control the phasing of the complex HCCI combustion process. For example, by
means of varying the valve events, the effective compression ratio can be
changed, thus controlling at which point the fuel and air mixture will auto ignite.
Studies on HCCI combustion by the use of VVT have been presented in
publications such as [20,21] to mention two examples.
A more non-conventional field where the use of some kind of VVT is required is
the pneumatic- or air-hybrid engine. The main concept is that the engine’s
cylinders are connected to a pressurized tank which is charged by the ICE with
the use of VVT strategies. The energy stored in this tank can then be used as
complementary energy source for vehicle propulsion. Studies on pneumatic
hybridization have been done in publications such as [22,23].
VVT also enables the possibility for Miller and Atkinson cycling which both
lowers the effective compression ratio compared to the expansion ratio. This is
done by either early intake valve closing (IVC) which is the Miller cycle or late
IVC which is defined as the Atkinson cycle. Both cycles aim at decreasing the in-
cylinder combustion process temperature and as a consequence the NOx
formation is reduced. Substantial emission reduction, in particular NOx, by the
use of late IVC was shown in both [24] and [25]. The conclusion is the same in
[26] but the authors see no advantage of the Miller/Atkinson cycle compared to
conventional EGR systems.
1.3 Motivation
As the road towards increasing engine efficiency continues, incremental
improvements in all aspects of the complete engine system are needed as well as
the introduction of new disruptive technologies. The introduction of
turbocharging and variable valve actuation are two examples of how new
groundbreaking technologies in the past have allowed big leaps in engine
efficiency. As was shown in the previous section, turbocharging has some
inherent drawbacks even though the overall effect it has on engine performance
is positive. The aim of this thesis is to show the potential of the DEP concept to

11
improve some aspects of turbocharging, such as pumping work, by means of
variable valve actuation. The DEP concept has previously shown positive results
to engine efficiency on light-duty SI engines but investigations on heavy-duty CI
engines are much scarcer. Therefore, this thesis will present an in-depth study to
the advantages and disadvantages of introducing the DEP concept on heavy-
duty diesel engines.
1.4 Objectives
The aim of this thesis is to present how the DEP concept affects engine
performance and efficiency when introduced on a heavy-duty diesel engine. This
will be performed through engine simulation on three different engines; without
EGR, with short route (SR) and with long route (LR) configuration of the EGR
systems. To be more specific, when applying the DEP concept, the objective is
to investigate if it is possible to:
Increase pumping work and thereby reduce fuel consumption
Reduce residual gas content for increased volumetric efficiency
Improve the use of the turbocharger’s operating range
Improve the boost control by using one exhaust valve as a wastegate
Improve transient response
In addition to this, the effect different valve size configuration has to the DEP
concept will be studied. This will be done by:
Using standard exhaust valve area
Increasing total exhaust valve area
Increasing exhaust valve area, by decreasing intake area and thereby maintaining total valve area
Changing the valve area relation between the two exhaust valves

12

13
CHAPTER 2
Divided Exhaust Period
This chapter will describe how some aspects of turbocharging are improved by
means of variable valve timing when introducing the DEP concept. The basic
idea behind the concept will be explained and a brief presentation of DEP from
literature will be given. Lastly, the contribution from this thesis to the research
field will be discussed.
2.1 Technical concept
Introducing a turbocharger on an engine creates an exhaust back pressure for the
piston to work against during the exhaust stroke as shown in the previous
chapter. As a way to improve the pumping work a second exhaust manifold is
introduced, that leads the exhaust gases past the turbine. The standard two
exhaust valves are each assigned to one of the two manifolds, as can be seen in
Figure 2.1. The valves and manifold connected to the turbine are denoted as the
blow-down system, while the valves and manifold that are bypassing the turbine
are denoted as the scavenging system. The strategy of the DEP concept is to let
the initial high energy blow-down pulse run the turbine, but lead the exhaust
gases through the scavenging system during the rest of the exhaust stroke. Since
the piston then can expel the exhaust gas out of the cylinder against ambient
pressure instead of the turbine back pressure, an increase of pumping work is
achieved. This in turn leads to a potential reduction in break specific fuel
consumption (BSFC).
To be able to control the quantity of the exhaust flow distribution (which
depends on the operating condition) to the different manifolds, the DEP
concept requires a variable valve train system for the exhaust side, see Figure 2.2.
Since the blow-down valve only needs a variable closure time but requires
stability because it opens at high cylinder pressure, a lost-motion valve system
similar to the UniAir system [9] may be considered. The scavenging valve on the
other hand requires more degrees of freedom in terms of opening- and closure
time, but it opens at low pressure. Therefore a FVVT system such as the one

14
developed by Cargine Engineering [27] may be considered. It should be noted
that no study has been made as to which valve system is best suited, but these
systems have been acting as templates in this thesis for a possible real
implementation.
FIGURE 2.1. Sketch of manifold layout for the DEP concept.
FIGURE 2.2. Conceptual valve lift curves for the DEP concept.
As can be seen in Figure 2.2, the strategy is to let the blow-down valve follow
the lift profile of the original cam lobe until the blow-down phase is over, at
which point it will be closed. The scavenging valve will then open to reduce the
cylinder pressure to ambient level. This allows easier expulsion of the exhaust
gases during the last phase of the exhaust stroke. A certain overlap between the
blow-down and the scavenging valve is necessary to avoid choked flow. The
closure time of the scavenging valve can be adjusted accordingly depending on
what is being optimized, fuel consumption or residual gas content. The term early

15
scavenging will be used to refer to early closure of the blow-down valve and early
opening of the scavenging valve. The term late scavenging will be used to refer to
late closure of the blow-down valve and late opening of the scavenging valve.
The theory behind the concept can also be explained with a cylinder pressure vs.
volume (p-V) diagram, see Figure 2.3. Note that this theoretical p-V diagram is
far from the real process in an engine when flow losses and non-instantaneous
combustion and valve lift events are considered. It serves only as a simplification
to explain the principle. The area enclosed by the blue line is the gross indicated
mean effective pressure (IMEPG), meaning work done to the piston during the
compression, combustion and expansion phase. At the end of the expansion
stroke when the exhaust valves opens at (A), the cylinder gas temperature and
pressure is still high which means a loss in potential work. By introducing a
turbocharger the exhaust gases can be expanded further in a turbine and a part
of this potential work (grey area) is recovered to drive the compressor as
described in the previous chapter.
FIGURE 2.3. Theoretical cylinder pressure vs. volume with a positive and a negative pumping loop.
As mentioned previously the turbine introduces a drawback in terms of an
exhaust back pressure that the piston has to work against. If this back pressure is
higher than the intake charge pressure, a negative PMEP is achieved. As the
piston travels upwards from bottom dead center (BDC) to top dead center
(TDC) the cylinder pressure is higher than when it travels downwards, this
means that it takes more work from the piston on the exhaust stroke than the
piston gains on the intake stroke. This is seen as the red pump loop in Figure
2.3, starting at point B and going in an anti-clockwise direction.

16
With the DEP concept, the idea is to open the blow-down valve at point A to let
the high energy blow-down pulse drive the turbine. When the pressure is
equalized between the cylinder and exhaust manifold the blow-down valve is
closed and the scavenging valve is opened instead (C). Since the pressure in the
scavenging manifold is close to ambient level the piston will work with less
resistance, compared to the usual turbine back pressure, as it travels from BDC
to TDC. With an equal intake charge pressure, a positive PMEP is achieved. This
is seen as the green pump loop in Figure 2.3, starting at point C and going in a
clock-wise direction.
The net indicated mean effective pressure (IMEPN) equals IMEPG plus PMEP,
which makes it clear that the total indicated work done during the whole cycle
will theoretically become larger with the DEP concept. This is also true for the
cases where the standard turbocharged engine has a positive PMEP, since the
positive PMEP for a DEP engine will theoretically be larger for the same intake
pressure. A larger IMEPN for the same IMEPG (same amount of fuel injected)
can also be translated into a reduction in fuel consumption if IMEPN is kept
constant.
Aside from improved pumping work, the DEP concept offers other benefits as
well and resolves some of the issues described in section 1.1.3. These benefits
will be explained further in section 5.6.
2.2 DEP in literature
The base of this concept was first mentioned in a British patent from 1924 [28]
and further patent claims have been made since then by several companies, e.g.
Deutz AG [29], Fleming Thermodynamics Ltd. [30] and Saab Automobile AB
[31]. In connection to the Saab patents the DEP concept was investigated by
means of both simulation and engine tests [32]. The investigation was carried out
on a passenger car SI engine with camshafts that gave fixed blow-down valve
duration and three different scavenging valve durations. The exhaust valve area
was increased by 30 %. Results from this study show improved full load torque
and efficiency due to improved pumping work and reduced residual gas content
(increases cylinder filling and knock resistance). Catalyst light-off time was
reduced since the exhaust mass flow can bypass the turbine (which acts as a heat
sink) through the scavenging manifold. Some negative aspects such as high
turbine inlet temperature, choking of valves at high speeds and the need for a
VVT system were pointed out. Due to the limitation of the fixed valve timing
there was a need to implement a trapping valve located in the scavenging
manifold. At low load for example the trapping valve needed to be closed to get

17
sufficient mass flow over the turbine. Furthermore, the trapping valve needed to
be closed to avoid blow through of the fresh charge to the scavenging manifold.
The trapping valve causes a backpressure in the scavenging manifold which
contradicts the purpose of the DEP concept. Both of these situations could be
avoided if it was possible to change the valve duration of both exhaust valves,
and the trapping valve could be removed. Lastly, it was pointed out that a
standard turbocharger was used which made it difficult to reach target boost
levels at low engine speeds since a part of the exhaust flow is bypassed the
turbine. A new turbocharger matching using a smaller turbine could have
addressed this issue.
A numerical study of this concept was performed at TU Dresden with the help
of VVT [33]. The difference in this study is that the two exhaust manifolds are
both connected to one turbocharger each to offer the possibility of sequential or
two-stage turbo charging. This setup allows the two turbines to be adapted for
the different characteristics of the mass flow in the beginning and the end of the
exhaust stroke. At low engine speeds valve timing is set so that a large part of the
exhaust flow is directed through the blow-down valve to the primary
turbocharger (sequential setup) or the high-pressure turbine (two-stage setup)
and a large scavenging and intake valve overlap is used to reduce residuals. The
reduced residuals and the use of a smaller turbine than baseline, gives
improvement in both stationary and transient conditions at low engine speeds.
When engine speed is increased the scavenging valve duration is increased to
direct more flow to the secondary turbine (sequential setup) or the low-pressure
turbine (two-stage setup) to limit further torque increase. This has the same
function of a wastegate but the exhaust energy is still utilized in the second
turbocharger stage. As engine speed increases further the scavenging valve
opening time will be identical to the blow-down valve resulting in parallel
operation of both turbines (sequential setup) and phasing out of the high-
pressure stage (two-stage setup). The conclusion from this study was clear
improvement in the scavenging behavior at low speeds, reduction of fuel
consumption at rated power and improved torque build up. This has been
patented for SI engines in a German patent [34]. It should be pointed out that
this concept does not improve pumping work in the same manner explained
previously since a turbine, that creates backpressure, is used for both manifolds.
BorgWarner have explored the DEP concept further with both simulations and
engine tests for a turbocharged SI engine with different EGR routing [35,36].
Their concept, called valve-event modulated boost (VEMB) system, incorporates
a concentric cam system powered by cam phasers which allow the opening and
closure time of both blow-down and scavenging valve to be adjusted

18
individually. Note that the duration of both valve events are fixed with this valve
train. The EGR flow is deducted from the scavenging manifold to preserve
energy to the turbine, gain PMEP benefits and re-burn hydrocarbons. The EGR
can be delivered to either the compressor inlet (at high load), via an EGR cooler
for maximum knock relief, or un-cooled to the intake manifold (at low load)
where the pressure difference is enhanced by the intake throttle. A thorough
turbocharger matching was performed resulted in a single entry turbine smaller
than baseline. As mentioned above, no wastegate is needed since the scavenging
valve event has the same function. Exhaust valve area was increased by 6.5 %
and port flow characteristics were improved by 13-15 %. Results from both
simulations and engine tests showed improvements in both boost control and
boost levels. Improved fuel efficiency by 1.5-5.5 % due to improved pumping
work was shown. Furthermore, by reducing the backpressure at valve overlap
the residual gas fraction was reduced, leading to a spark advance by up to 17°
which in turn improved efficiency further for a total 12.3 % fuel consumption
reduction. The reduced residuals would also make it possible to increase the
compression ratio without risk of knock. The authors suggest that the
compression ratio could be increased by 2-3 whole ratios for further efficiency
improvements across the whole operating range. By taking the EGR flow from
the scavenging manifold the 3-5 times higher HC content in this manifold could
be rebreathed. For 15 % EGR rate, 40-70 % of the total hydrocarbon (HC)
emissions were burnt in the cylinder instead of the catalyst. Exhaust valve
choking at high engine speeds were apparent in this study as well.
At Loughborough University, DEP has been studied in a turbo-discharging (TD)
concept by means of both simulations and engine tests [37,38]. TD can be
applied to both naturally aspirated and turbocharged engines. For naturally
aspirated engines the principle is to use a turbine on the blow-down manifold
while the scavenging manifold is bypassed the turbine, similar to Figure 2.1.
However, the difference is that the outlet of blow-down and scavenging
manifold are both connected to the compressor driven by the turbine. The
compressor outlet goes to the atmosphere. Hence, the compressor is here used
to depressurize the scavenging manifold and post turbine side instead of
increasing intake manifold pressure. What this depressurization does is that the
scavenging manifold will have sub-atmospheric pressure (<0.5 bar) causing
significantly improved pumping work during the scavenging phase. The
depressurization of the post turbine side leads to an increase pressure ratio over
the turbine for the same blow-down pulse pressure. The principle is the same
when implementing TD on a turbocharged engine. In this case, both the
scavenging manifold and primary turbine outlet is connected to a secondary
turbine before the primary compressor. The secondary compressor is then used

19
to compress the intake air. This has the same effect of increasing pumping work
and increase the pressure ratio over the turbines for the same blow-down pulse
pressure. Result from simulations show that TD can increase the total pumping
work, and even add work during the exhaust stroke, which in turn leads to fuel
economy improvements of ~5 % or torque increase by 7 %. Similarly to the
studies above, a reduction of hot residuals are proven due to the decreased
exhaust pressure during valve overlap, which in turn reduces risk of knock and
spark advance can improve efficiency further. Initial experimental tests seem to
agree with the simulations. The TD concept was run with fixed exhaust valve
timing where both exhaust valves had equal duration and a large overlap between
them. The authors claim that the system performance was insensitive to exhaust
valve timing. However, only blow-down valve opening and scavenging valve
closure was varied in the sensitivity test. As will be seen in this thesis, the blow-
down valve closing and scavenging valve opening has a large effect on the DEP
concept. Hence, the TD concept would most likely benefit with a more
extensive valve timing investigation. Further need for turbocharger matching was
also pointed out.
The only study of DEP on heavy-duty diesel engines found to date is an
engineering thesis from KTH performed in collaboration with Scania [39]. This
study covers DEP both with and without EGR. The EGR cases are divided in
one with short route EGR and one with scavenge sourced EGR. Note that the
scavenging sourced EGR is directed to the post-compressor side, causing a
backpressure for the piston, opposing the basic idea of DEP. Sweeps of different
blow-down and scavenging valve duration were performed together with three
different turbine sizes. One set of sweeps included the two exhaust valves to be
open in series with a small overlap between them. Another set of sweeps were
performed were the exhaust valves opened in parallel, with the blow-down valve
always fully open, and the scavenging valve had varied duration. None of the
cases studied here showed any improvement to engine performance. The reason
is probably that in the first set of sweeps, the overlap between the valves was too
small and the turbine size was not decreased enough to reach target boost level.
The second set of sweeps, with both exhaust valves opened in parallel will cause
the pressure ratio over the turbine to be decreased, again leading to problems
reaching target boost level. Larger overlap for the series sweep and a smaller
turbine could have resolved this issue.
2.3 Thesis contribution
From the previous section it is clear that the DEP concept displays a large
potential to increase engine efficiency. However, most studies concerns DEP on

20
passenger car SI engines. This is probably due to their inherent problems with
throttle losses, large amount of residuals, spark timing and compression ratio
limitations, which makes a DEP implementation on SI engines more alluring. In
spite of this the DEP concept in its basic form is in no way restricted to SI
applications since the potential of pumping work improvements applies to all
turbocharged engines. The study on heavy-duty diesel engine discussed in the
previous section proved no benefit of using DEP, but due to the time-frame and
scope of that study more in depth analysis is needed to understand the reason
for this. Hence, this thesis will contribute with a more elaborate investigation of
the DEP concept on heavy-duty diesel engines to complement the already
positive potential of DEP shown on SI engines. The thesis will include a more
extensive study of which the effects of DEP are when valve timing, valve size,
turbocharger size and manifold geometry is allowed to be varied in a more
unrestricted way.

21
CHAPTER 3
Engine Simulation Tool
The DEP concept has been studied through simulations with GT-Power, which
is a 1D fluid dynamic simulation tool for engine applications. GT-Power solves
the Navier-Stokes equations in one dimension for the flow in the piping system
of the engine and uses simplified models, maps and lookup tables for other
critical parts such as valves, turbocharger, cylinders, friction and combustion.
These simplified models usually require extensive calibration which is performed
based on measurement data from real engine tests. This chapter will give a brief
description of how the fluid flow and some of these critical components are
modeled. For more detailed information regarding GT-Power see [40].
3.1 Flow modeling
An engine model in GT-Power is built up by a large number of objects
representing different components of the engine. A large part of these objects
consists of the engine’s piping system; intake pipe, inter-cooler, intake manifold
and ports, exhaust manifolds and ports, exhaust pipe, EGR routing, EGR cooler
etc. These different pipe objects represent the geometry of the real engine and
describe straight pipes, pipe bends, flow splits and junctions. The whole piping
system is discretized with a staggered grid approach, see Figure 3.1. This means that
each pipe object is discretized into many sub volumes, and each sub volume is
connected to its neighbor via a boundary. Scalar variables such as pressure,
temperature, density and enthalpy are assumed to be uniform across each sub
volume and are calculated at its centroid. Vector variables such as mass flux and
velocity are calculated at each boundary of the sub volumes.

22
FIGURE 3.1. Schematic of staggered grid approach: scalars calculated at centroid, vector quantities at boundaries [40].
The fluid flow model then involves the solution of the Navier-Stokes equations,
namely conservation of mass, momentum and energy. These equations are
solved in one dimension, which means that all quantities are averaged across the
flow direction. Mass conservation states that the rate of change of mass within a
sub volume equals the sum of mass flux in and out of the sub volume:
∑
(3.1)
Where is the mass of the volume, subscript b denotes the boundaries and is
the boundary mass flux.
Momentum conservation states that the rate of change of momentum in the sub
volume is equal to the net pressure forces and wall shear forces acting in a
system plus the net flow of momentum in and out of the sub volume:
∑ | |
( | |)
(3.2)
Where is the pressure, is the flow area, is the velocity at the boundary, is
the equivalent diameter, is the density and is the discretization length. is
the skin friction coefficient and accounts to flow losses due to wall friction
which is a function of both wall surface roughness and Reynolds number. is
the pressure loss coefficient and accounts for other flow losses than friction.
This could for example be due to changing cross-sections, tapered pipes or pipe
bends. The pressure loss coefficient can be set by the user or calculated by the
code.
Energy conservation states that the rate of change of energy in a sub volume is
equal to the sum of energy transfer in and out of the sub volume. Energy

23
transfer in the volume involves energy connected to work, mass flow and heat
transfer:
∑ ( )
(3.3)
Where is total internal energy, is the volume, is total enthalpy, is the heat
transfer coefficient, is the heat transfer surface area and and are the
fluid and wall temperatures respectively. The heat transfer coefficient is
calculated at every time step and is a function of the fluid velocity, the thermo-
physical properties of the fluid and the wall surface roughness.
The conservation equations are then solved for each time step and sub volume.
The preferred time integration method for most engine simulations is the explicit
method since it more accurately captures pressure pulsations but requires small
time steps. The implicit method allows larger time steps and therefore has faster
execution time but does not capture pulsations as accurately, and is there for
more suited for long duration simulations, e.g. exhaust system warm-up or
cooling systems. In the explicit method the primary solution variables (mass flux,
density and internal energy) are calculated based on the conservation equations
by using values from the previous time step of the current sub volume and its
neighbors. This gives the derivative of the primary variables and allows the value
at the new time step to be calculated. At each time step the pressure and
temperature are calculated by first solving the continuity and energy equations
which will give the mass and energy in the volume. With mass known, density
and energy can be calculated. The solver will then iterate on pressure and
temperature (through the equation of state) until they satisfy the density and
energy calculated for the time step. The time step is in turn restricted to satisfy
the Courant condition which in turn depends on the discretization length. A
small discretization length will result in more accurate predictions but a longer
execution time.
When the flow in the engine’s piping system is solved, simplified models, maps
and look-up tables are used to represent the remaining components of the
engine. The treatment of three key components will be discussed in the
following sections.
3.2 Combustion modeling
When the in-cylinder mass has been predicted by the flow solver, a model is
required to simulate the amount of chemical energy released as heat in the

24
cylinder during the combustion phase. One common approach is to express this
in the heat release rate, which is the energy release as a function of time. The
heat release rate can be calculated by the following equation, which states that
the energy released by combustion ( ) of the fuel equals the heat transfer to the
cylinder walls ( ), energy lost into the crevices ( ), the change in
internal energy ( ) and the amount of work done by the system ( :
(3.4)
The heat release rate can then be expressed as a function of cylinder pressure
and crank angle:
(3.5)
Where is the combustion chamber surface area, is the heat transfer
coefficient, and are the gas and wall temperatures, is the specific heat
ratio, is the cylinder pressure, is the cylinder volume and is the crankshaft
angle. The heat transfer coefficient is estimated by the Woschni correlation [4].
The loss due to crevices can be treated in different ways, but since these are
usually small the term can be omitted. Especially for diesel combustion since
there will be no unburnt hydrocarbons stored in the crevices. With measured
cylinder pressure, the heat release rate can then be calculated and inserted in GT-
Power to model the combustion process.
A simplified way of describing the heat release rate is through the Wiebe
function [4]. This equation describes the percentage of burnt fuel mass as a
function of angle of start of combustion, combustion duration and two tunable
parameters. By derivation, this will result in a bell shaped curved that with tuning
of the parameters should resemble the real heat release rate.
3.3 Valve modeling
To correctly predict the induced mass into and out of the cylinder, flow losses
across intake and exhaust valves need to be modeled. All valves (intake/exhaust
valves, ball valves, throttles etc.) are in GT-Power handled in the same way but
this section will focus on the intake and exhaust valves. The valve object itself
does not contain any volume, instead it will describe the flow losses that will
occur when the fluid travels from the volume upstream to the volume
downstream of the valve object. This is done through a discharge coefficient which is
defined as the ratio between the effective flow area and a reference flow area,
usually the geometric area of the connecting pipe. It includes friction losses and

25
errors in assumptions of velocity profiles in the orifice equations. For simple
flow restrictions the code can calculate the discharge coefficient but for more
complex geometries like valves, the discharge coefficient needs to be entered by
the user. For intake and exhaust valves the discharge coefficient is usually
entered as a function of valve lift. The discharge coefficient is calculated with the
following equations (isentropic flow through an orifice), based on measurement
data performed on the cylinder head:
(3.6)
(3.7)
√ {
[
]}
⁄
(3.8)
Where is the effective flow area, is the density at the throat, is the
isentropic velocity at the throat, is the discharge coefficient, is the
reference flow area (on which the measurements are based on), is the
upstream stagnation density, is the absolute pressure ratio (static outlet
pressure/total inlet pressure), is the gas constant and is the upstream
stagnation temperature. For choked flow Equation 3.7 and 3.8 is modified to be
only a function of the upstream density, temperature, and .
A common practice within industry is to measure across intake and exhaust
valve for different valve lift heights but for only one pressure ratio. This pressure
ratio is usually very small (~0.95). Compare this to the relatively large pressure
ratios (~0.53) that can occur during exhaust valve opening causing critical flow
during the initial stage of the exhaust phase. This becomes especially important
for the DEP concept since the two exhaust valves opens at completely different
pressure ratios but use the same values. It is suggested by Blair that to
properly account for the real flow losses across valves in internal combustion
engines, needs to be a function of both valve lift and a large range of pressure
ratios. Furthermore it should be measured for both intake and exhaust valve
separately and in both directions [41].
3.4 Turbocharger modeling
In analogy with the valve objects, the turbine and compressor object in GT-
Power is just a more sophisticated look-up table. The turbine and compressor
object does not contain any volume itself for which the flow is solved, instead

26
they contain performance maps. These performance maps are used to calculate
the upstream and downstream condition of the turbocharger which is then used
by the flow solver for the rest of the piping system. The performance maps
contain information about turbine and compressor efficiency as a function of
mass flow, pressure ratio and turbocharger speed. The input data to these
performance maps come from steady state measurements performed in a gas
stand. These measured values are then inter- and extrapolated to cover the whole
map. Since instantaneous turbine performance is required for the simulation the
turbine is modeled with a quasi-steady approach. This means that it is assumed
that the turbine performs under non-steady flow in the same manner as it would
if those instantaneous conditions were steady [2]. An example of one of these
performance maps with the measured values included can be seen in Figure 3.2.
FIGURE 3.2. Example of turbine performance map generated by GT-Power. Contour lines are the turbine efficiency, white triangles the raw data input on which the map is built. The full cycle and cycle average values from the simulation is included as well. Speed lines are omitted for sake of visibility.
The turbine is then modeled in the following iterative manner (the process is
similar for compressor and is not included here). The pressure in the adjacent
sub volumes upstream and downstream the turbine is predicted by the flow
solver and the turbine speed is known from the previous time step. The
performance map is then used to look up the mass flow rate and efficiency that
is then imposed in the solution. The isentropic enthalpy change across the
turbine is then calculated based on the upstream conditions with the following
equations:
27
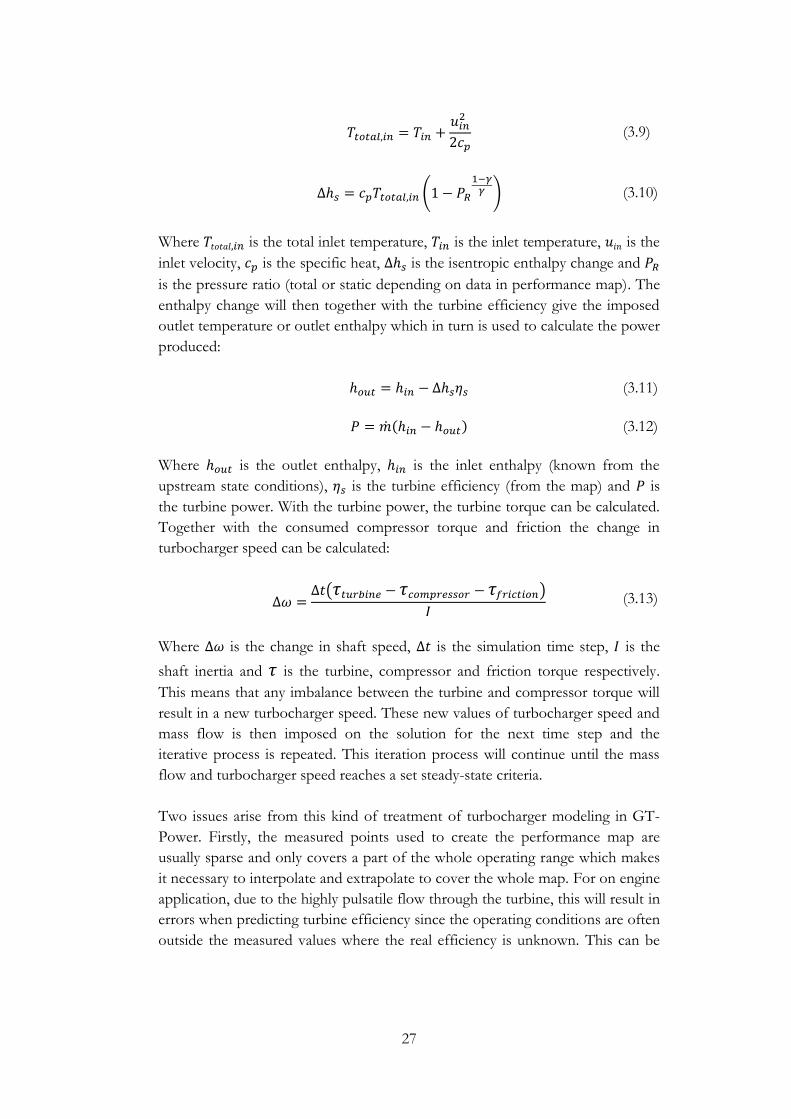
(3.9)
(
) (3.10)
Where is the total inlet temperature, is the inlet temperature, is the
inlet velocity, is the specific heat, is the isentropic enthalpy change and
is the pressure ratio (total or static depending on data in performance map). The
enthalpy change will then together with the turbine efficiency give the imposed
outlet temperature or outlet enthalpy which in turn is used to calculate the power
produced:
(3.11)
(3.12)
Where is the outlet enthalpy, is the inlet enthalpy (known from the
upstream state conditions), is the turbine efficiency (from the map) and is
the turbine power. With the turbine power, the turbine torque can be calculated.
Together with the consumed compressor torque and friction the change in
turbocharger speed can be calculated:
( )
(3.13)
Where is the change in shaft speed, is the simulation time step, is the
shaft inertia and is the turbine, compressor and friction torque respectively.
This means that any imbalance between the turbine and compressor torque will
result in a new turbocharger speed. These new values of turbocharger speed and
mass flow is then imposed on the solution for the next time step and the
iterative process is repeated. This iteration process will continue until the mass
flow and turbocharger speed reaches a set steady-state criteria.
Two issues arise from this kind of treatment of turbocharger modeling in GT-
Power. Firstly, the measured points used to create the performance map are
usually sparse and only covers a part of the whole operating range which makes
it necessary to interpolate and extrapolate to cover the whole map. For on engine
application, due to the highly pulsatile flow through the turbine, this will result in
errors when predicting turbine efficiency since the operating conditions are often
outside the measured values where the real efficiency is unknown. This can be

28
seen in Figure 3.2 where it is clear that a large part of the cycle is outside the
measured values. For low load points that have lower pressure ratio and mass
flow, this issue is even more pronounced. The implication this has to the engine
simulation has for example been studied by Westin [42]. Secondly, the turbine
object in GT-Power does not account for the internal volume of the turbine.
Due to the highly unsteady flow in the turbine, the effects of mass accumulation
in the volute are not considered. The implication of this has been studied in [43]
where the exhaust pulse peak pressure is shown to be overestimated by ~12 %
when the volute volume is not integrated into the engine model. This in turn led
to an overestimation of the low-end torque by 1.8 bar of break mean effective
pressure (BMEP). They suggest a solution where the proper volute volume is
added as a pipe object directly upstream the turbine object. The discrepancy in
both time resolved pressure pulsation amplitude and engine torque was
eliminated with this solution.

29
CHAPTER 4
Methodology
This chapter describes the three engines and their baseline models for which the
investigation has been carried out and the implementation of the DEP concept
on these models. A motivation to the selected operating conditions will be given
and lastly a short note on optimization procedure is discussed.
4.1 Baseline engine models
The DEP concept has been studied with GT-Power on three different heavy-
duty diesel engines, one without EGR, one with a SR-EGR system and one with
a LR-EGR system. The models for these three cases are in turn based on two
Scania production engines, see Table 4.1.
TABLE 4.1. Engine specification for the two engines for which the models are based on.
Engine label Scania DC1201
Scania DC1306
Emission class Euro 3 Euro 5 Max. power [hp] 380 360 Max. torque [Nm] 1900 1900 Displacement [dm3] 11.7 12.7 Bore [mm] 127 130 Stroke [mm] 154 160 Conn. rod length [mm] 255 255 Compression ratio 18 17.3 IVO [°ATDC] 346 344 IVC [°ATDC] -142 -136 EVO [°ATDC] 136 118 EVC [°ATDC] 359 378 Intake dia. [mm] 41 44 Exhaust dia. [mm] 39 41
Turbocharger type Twin-entry VGT EGR System - Short route
The case without EGR is based on the Scania DC1201 which is an 11.7 liter, six
cylinder, in-line heavy-duty diesel engine. This engine incorporates a twin-entry
30
turbine and no EGR system. The baseline model for this engine was calibrated
for full load in a previous work [44] and it was used as the base for the
simulations. From now on this engine will be referred to as the non-EGR case.
The cases with SR-EGR and LR-EGR are based on the Scania DC1306 which is
a 12.7 liter six cylinder, in-line heavy-duty diesel engine. This baseline engine has
a variable geometry turbine (VGT) turbocharger and a SR-EGR system leading
the EGR flow from the pre-turbine side to post-compressor/intercooler side, via
a two-stage EGR cooling system. The VGT is used to regulate the backpressure
to drive the EGR flow to the intake side, via an EGR-valve. The GT-Power
model for this engine was then modified to incorporate a LR-EGR system,
leading EGR flow from post-turbine side to pre-compressor side. An EGR
throttle on the exhaust pipe is used to drive the correct EGR flow to the intake
side. Here the VGT was replaced by a twin-entry turbine. The EGR rates are the
same as in the SR-EGR engine and λ was kept identical as far as the fix geometry
turbine allowed. From now on these two configurations will be referred to as the
SR-EGR and LR-EGR case.
The baseline GT-Power model for the DC1306 engine was calibrated and
provided by the engine manufacturer and was verified to measurements
performed on the engine at the KTH engine test facility. The verification was
performed based on measurements for the European stationary cycle (ESC)
points. Key parameters were measured, such as:
Cylinder pressure
Intake pressure
Exhaust backpressure
Turbocharger speed
Air and fuel mass flow
Temperature before and after turbine
Temperature before and after compressor
Measured pressures, mass flows and turbocharger speed deviated less than ±5 %
of simulation results, and temperatures less than ±10 % of simulation results (in
°C). The larger temperature discrepancies may be due to a modified intercooler
and engine cooling system of the KTH engine test facility. Since the current
study aims at comparing a baseline model to a modified version of the model,
any discrepancy from measurements is assumed to equally affect both models.
Therefore, no further calibration of the provided model was performed for the
purpose of this study.

31
4.2 DEP model implementation
The three baseline engine models described above were then modified to
incorporate the DEP concept. A second manifold connected to one valve per
cylinder was introduced that leads the exhaust gas to the post-turbine side
according to Figure 2.1. A single-entry, fixed geometry, turbine was used with
the DEP concept for all three engine configurations. Since only the scavenging
valve is open at the end of the exhaust stroke, there will be no expected blow-
down pulse interference between the cylinders which is usually the case in an in-
line six cylinder engine. Note that the baseline non-EGR and LR-EGR engines
use a twin-entry turbine due to this pulse interference. In the SR-EGR case the
VGT turbine can be omitted for the DEP configuration since it is possible to
change the exhaust valve timing to control the backpressure instead. The
backpressure is adjusted with proper valve timing strategies to get the necessary
pressure difference to drive the EGR flow to the intake side.
The valve lift profiles for the scavenging valves were based on an idealization of
the valve dynamics of the Cargine valve and data for opening/closure velocity
were used accordingly [13,45]. The blow-down valve lift profile was modeled
with a lost motion system in mind and valve closure velocity was set to the
original valve system closing velocity.
Turbocharger matching was performed by scaling the mass flow axis (using mass
multiplier in GT-Power) of the standard engines turbocharger maps. In the non-
EGR and SR-EGR case, when a good match was achieved for the selected valve
timings, new performance maps were implemented. These new maps correspond
to the scaled maps, but represent a turbocharger in production. In this way a
large number of turbochargers could be tested without handling a large number
of different performance maps. For the LR-EGR case both the baseline and
DEP engine use the same performance maps, and only mass multiplier has been
used to differentiate the size of the turbocharger. This was done for a more fair
comparison, so that any difference between baseline and DEP models is due to
the concept itself and not to specific turbocharger maps. For both the SR-EGR
and LR-EGR case, the DEP models were run with the same EGR rates as
baseline and λ could vary within ±4 %. By keeping identical EGR rates and λ,
the same combustion model could be used and emission formation was assumed
to be identical to baseline.
4.3 Operating conditions
The strategy for the simulations was to optimize the engine with the DEP
concept for one load point considered important from a fuel economy

32
perspective. This means that the hardware like exhaust valve size, exhaust
manifold geometry, turbocharger etc. were chosen based on optimization around
this one load point. The optimization for the rest of the engine operating map
was then based solely on valve timing strategies of the two exhaust valves.
Parallel to this study a thesis was performed investigating engine operating time
statistics [46]. The aim of the thesis was to investigate at which torque and speed
a truck engine operates most of its run time in the vehicle. At the time of the
GT-Power simulations of the non-EGR case all the data for this thesis was not
complete and therefore the load point was chosen somewhat arbitrary but still
reasonable. The operating condition to optimize the hardware around was
chosen in a medium load/speed point, which is denoted A7 in Figure 4.1. The
rest of the load points (A1-A14) were chosen to cover the extremes of the
engine’s operating range.
FIGURE 4.1. Map of chosen load points for the non-EGR case.
For the SR- and LR-EGR case, the results from [46] was used when the
optimization load point was chosen. Depending on vehicle load and type of road
(highway, city, hillside) the trends on which load point had most operating hours
differed. A trend that can be seen though is that the automatic gearbox controls
the engine speed to stay within a quite narrow range around 1400 RPM for most
cases. For engine torque it is harder to find a single point that is more prominent
than others. For city and hillside driving operating hours are more spread out in
terms of torque, but always close to 1400 RPM. For highway driving the most
prominent operating point lays around 100 kW and 1400 RPM. Since the
comparisons between the baseline and the DEP engines are carried out on the
ESC cycle points, it was decided to optimize the hardware for an ESC load point

33
close to this condition. The chosen load point is denoted B9 in Figure 4.2. Aside
from the 12 ESC cycle points (idle is omitted) four 100 kW points were added to
the study to represent highway driving at different gears.
FIGURE 4.2. Map of chosen load points for the SR-EGR and LR-EGR cases.
4.4 Optimization procedure
The optimization procedure of all three cases where performed in an iterative
procedure. It was not possible to optimize one parameter at a time since it was
apparent already at an early stage that there were strong interaction effects
between turbine size, valve size, valve timing, manifold geometry etc. It was
decided to not test all parameters against each other, to limit the test matrix.
Instead the optimization went through an iterative process, for which an
example will be given here. Beginning with some initial valve and manifold size
the exhaust valve timing was swept together with turbocharger size. The exhaust
valve timing sweep consists of changing blow-down exhaust valve closing
(BDEVC) and scavenging exhaust valve opening (SEVO). Some limitations were
put to how early BDEVC timing was and how large the overlap between
BDEVC and SEVO could be. Blow-down exhaust valve opening (BDEVO) and
scavenging exhaust valve closing (SEVC) timing was identical to the baseline
case in the first iteration. When an optimal match was found between
turbocharger size and valve timing, this setting was run with different manifold
geometry and valve size. The manifold geometry was changed in terms of pipe
diameter only, since the length is restricted by the distance between the cylinders.
In effect it is the manifold volume that is changed. For the scavenging manifold
the length of the pipe after the junction (which connects all cylinders) was
changed since in some cases there was a pulsatile flow also in this manifold. The

34
length was changed to get low pressure at the scavenging port during the
scavenging phase. At this stage SEVC was optimized as well. The valve timing
and turbocharger sweeps were then re-run for this new geometry setting. When
the same settings were achieved in the new iteration step the optimization was
considered finalized. This procedure was only performed for the optimized load
points A7 and B9. For the remaining load points it was only valve timing that
was optimized (BDEVC, SEVO and SEVC). Tests with changing BDEVO were
performed as well but without improving the total efficiency. There are
obviously many more parameters that could need optimization when switching
to the DEP concept, e.g. injection strategies, boost requirements or the
combustion system, but further optimization of the complete engine system was
deemed to be outside the scope of this thesis.

35
CHAPTER 5
Results
In this chapter a brief summary of the result from the appended papers will be
given. The three studied cases will first be discussed individually, followed by
some complementary results not presented in the papers. The chapter is finalized
with a discussion around the similarities between the three cases. For more
detailed results the reader is referred to the appended papers.
5.1 Studied cases
The DEP concept has been studied on three different cases and a brief
motivation to why these cases were chosen will be presented in this section. As
mentioned in Chapter 2, the reason to focus on heavy-duty diesel engines was
due to the lack of publications of the DEP concept applied to this segment of
engines. The investigation was initialized on an engine without any EGR system.
The reason for this was to keep the complexity of the engine system at a
minimum so that the effects of the DEP concept could be studied in isolation.
With this as a base, the investigation was moved to an engine with a SR-EGR
system to understand the interaction between the EGR system and the DEP
concept. This added to the complexity since the DEP concept in this case
strongly interacts with the control of EGR rate. In an attempt to separate the
DEP concept from the EGR system, allowing more freedom for valve timing
strategies and turbocharger matching, a third case study was initialized. In this
third study, the DEP concept was introduced on an engine with a LR-EGR
system, which is a well-established and simple system to introduce cooled EGR
[47]. From now on these three cases will be referred to as the non-EGR case, the
SR-EGR case and the LR-EGR case. More information on these engines can be
found in section 4.1.
5.2 The non-EGR case
This section presents the main results from the non-EGR case study. Results
presented here concerns the pumping loop for the optimized load point,

36
turbocharger performance and fuel consumption for all investigated operating
conditions. For more detailed information regarding this case, the reader is
referred to Paper 1.
5.2.1 Gas exchange process
As mentioned in Chapter 4, the hardware was chosen for load point A7 in Figure
4.1, and the optimal valve time strategy was sought while matching the
turbocharger to give the lowest BSFC. The intake pressure was set to be the
same as the baseline engine to not affect the combustion process or emission
formation. With similar in-cylinder conditions the emission formation is assumed
to be unaffected. Note that the exhaust valve size is 30 % larger than baseline.
The resulting pumping loop with optimal valve timing and turbocharger size is
presented in Figure 5.1.
FIGURE 5.1. Cylinder pressure vs. volume for the non-EGR baseline and DEP engine during the gas exchange loop for load point A7.
Comparing the baseline and DEP pumping loop, the process is similar as it
moves from exhaust valve opening at point (A) to point (B). In this blow-down
phase the mass flow is mainly driven by the pressure difference between cylinder
and exhaust port. In both cases this blow-down pulse feeds the turbine. The
reason for the higher cylinder pressure for the DEP case is due a smaller turbine
size and the fact that only one exhaust valve is open, restricting the outgoing
flow. However, when moving from point (B) to point (C) the cylinder pressure
curves starts to deviate. The mass flow in this scavenging phase is mainly driven
by motion of the piston. In the baseline case, the turbine will create a
backpressure for the piston to work against as it moves towards TDC. Close to
37
TDC the blow-down pulse from the next cylinder in firing order will interrupt
the scavenging process causing the backpressure to increase. This is seen as a
small pressure peak at the end of the exhaust stroke. For the DEP case instead,
the blow-down valve will close and the scavenging valve open at point (B). Since
the scavenging valve is connected to a manifold with ambient pressure the
cylinder pressure drops quickly. The piston can then expel the remaining exhaust
gas against ambient pressure instead as it moves towards TDC. At point (C) both
exhaust valves are closed and the intake valves open, increasing cylinder pressure
to charge pressure level. The intake pressure difference between baseline and
DEP is in this case 0.04 bar and is due to the optimization procedure. As PMEP
equals the enclosed surface areas in Figure 5.1, one can see that PMEP for the
DEP case is larger than the baseline case. PMEP is in this case increased from
0.04 bar to 0.22 bar resulting in a BSFC reduction of 2.1 %.
5.2.2 Turbocharger performance
The reason why it is possible to keep the charge pressure at the same level even
though the mass flow to the turbine is reduced can be explained by comparing
the turbine performance maps. Figure 5.2 shows the performance map for the
baseline engine with the full cycle and cycle mean values of reduced mass flow
and pressure ratio. The turbine efficiency is represented by the contour lines.
Due to the highly pulsatile exhaust flow, the mass flow and pressure ratio will
vary within a wide range in the performance map, consequently affecting the
turbine efficiency. The same performance map for the DEP engine is presented
in Figure 5.3. The mass flow capacity or size of the DEP turbine is 38 % smaller
than baseline. Here one can see that the mass flow and pressure ratio varies with
a narrower range within the performance map. When only the high pressure
blow-down pulse is directed to the turbine, the flow will be less pulsatile but with
the same peak pressure. With a proper valve timing strategy it is possible to
control the mass flow and pressure ratio of the turbine to make it operate in a
high efficiency area to larger extent than the baseline engine. Furthermore, the
scavenging phase that is present in the baseline case but not in the DEP case,
does not contribute much to the total turbine work since it has low mass flow,
low pressure ratio and low efficiency. To conclude, even though the mass flow is
reduced in the DEP case it is possible to produce the same turbine work since
the average pressure and efficiency is higher due to the less pulsatile flow.
While this is true for load point A7, the same trend is valid for the rest of the
load points. In the baseline case the turbine will work with reduced efficiency at
off-design load points. However, in the DEP case it is possible to control the
turbine mass flow and pressure ratio with valve timing strategies, making the

38
turbine work in its high efficiency area to larger extent. More details on this can
be found in Paper 1.
FIGURE 5.2. Turbine performance map for the baseline engine operating at load point A7.
FIGURE 5.3. Turbine performance map for the DEP engine operating at load point A7.
5.2.3 Full operating range
Based on the hardware chosen for load point A7 the remaining load points were
optimized solely by changing valve timing. Fuel consumption was minimized
while keeping charge pressure at the level close to the baseline engine. The

39
change in BSFC for all load points investigated can be seen in Figure 5.4. Note
that this figure is presented in Paper 1, but is showing the BSFC reduction when
comparing to the baseline engine with standard exhaust valve size. Figure 5.4
presents the BSFC reduction when both engines use 30 % larger exhaust valve
area, for a more fair comparison. As can be seen, the difference between Figure
5.4 and Figure 6a in Paper 1 is not that large which means that the DEP concept
benefits much more from larger valves than the baseline engines does.
FIGURE 5.4. Change in BSFC for the DEP engine compared to the baseline engine, both with 30 % larger exhaust valve area.
The general trend is that at low load points, the backpressure is low and there is
less to gain from the DEP concept. At high loads where the backpressure is
higher, the potential to reduce this backpressure is higher. Therefore the BSFC
reduction is higher at high loads. When changing engine speed the trend is that
at low engine speed the BSFC reduction is higher than at high speed. The reason
for this is due to flow restriction in the valves. Since only one exhaust valve is
open at a time in the DEP case, it becomes more prone to choking at high
engine speeds and higher mass flow rates. At low engine speed the valves are less
choked and it is easier to expel the exhaust gas during the scavenging process,
hence the BSFC gain is higher. Load point A14, which is above the full load
curve, shows that with a smaller turbine the boost pressure is increased and it is
possible to increase the full load torque for the same λ value.
5.3 The SR-EGR case
This section presents the main results from the SR-EGR case study. Results
presented here concerns the pumping loop for the optimized load point, a study

40
of different valve area and ratios, and fuel consumption for all investigated
operating conditions. For more detailed information regarding this case, the
reader is referred to both Paper 1 and Paper 2.
5.3.1 Gas exchange process
The procedure for this case was the same as for the non-EGR case. The
hardware was optimized for load point B9 and valve timing was based on
minimizing the BSFC while maintaining the same λ value and EGR rate as the
baseline engine. In this case the valve area was kept identical to the baseline
engine but the ratio between the blow-down and scavenging valve area was
changed, where the optimal ratio was shown to be 2.7. The corresponding pump
loop for the optimized case can be seen in Figure 5.5.
FIGURE 5.5. Cylinder pressure vs. volume for the SR-EGR baseline and DEP engine during the gas exchange loop for load point B9.
For the SR-EGR case the blow-down valve closes and the scavenging valve
opens at around point (A). This is much later than the non-EGR case, and is due
to the EGR system. Since the blow-down pulse is now used for both turbine
work and EGR flow, the duration of the blow-down valve needs to be increased.
The duration of the scavenging valve in turn, will affect the pressure in the
turbine manifold and will therefore control the ability to drive EGR flow to the
intake side. This combined will cause less freedom in choosing a valve timing
strategy that maximizes both pumping and turbine work, since valve timing now
also controls EGR flow. Another reason for the long blow-down valve duration
is due to choking in the valves. If the scavenging valve duration is increased the
mass flow through that valve will increase and it will eventually cause a flow
restriction. If the scavenge valve size is increased to avoid this choking, the

41
blow-down valve needs to be decreased, and choking will occur there instead.
More details on this can be found in Paper 2.
Even with late scavenging it is possible to reduce PMEP also in the SR-EGR
case. As can be seen in Figure 5.5, the baseline engine has a large pressure peak
at the end of the exhaust stroke. This pressure peak is caused by the blow-down
pulse from the next cylinder in firing order. Since the baseline engine has a single
entry VGT turbine, this pressure peak will not be mitigated as it was in the non-
EGR case. In the DEP case instead, even though it also uses a single entry
turbine, it is possible to mitigate this pressure peak since the blow-down valve is
closed and scavenging valve opened at this point. Furthermore the DEP concept
allows the EGR rate to be controlled without a VGT turbine. The BSFC
reduction for this load point is 1 % when using exhaust valve area equal to the
baseline engine.
5.3.2 Effects of changing valve area ratio
Since it was clear that the valve size was of high importance for the DEP
concept, investigations were made on different settings of blow-down to
scavenging valve area ratios. These sweeps were performed for a number of
different total valve area settings aside from the baseline area. Three settings are
with reduced intake area, where the exhaust area was increased correspondingly.
Two settings are with increased exhaust area. These sweeps can be seen together
with the baseline engine in Figure 5.6.
FIGURE 5.6. BSFC as a function of blow-down to scavenging area ratio for different settings of total intake and exhaust area on the SR-EGR engine.

42
It is clear that decreasing the intake area only gives a benefit for the DEP Intake -
10 % case. When decreasing the intake area further, the intake losses will be
higher than the benefit of using larger exhaust valves. If the intake area is not
changed, but the exhaust area is increased, there is reduction in BSFC. When
compared to the baseline engine, one can see that the baseline engine benefits
less from increased exhaust area. This is due to the fact that DEP engine, with
only one exhaust valve open at a time, is closer to choked flow than the baseline
engine. Therefore it becomes much more important for the DEP engine to
increase the exhaust valve area. For all area sweeps the trend is the same,
increasing the area ratio decreases BSFC. This is due to the long blow-down
valve duration requirement for sufficient EGR flow. With long blow-down valve
duration, this valve needs a larger area due to the higher mass flow through this
valve. As mentioned above, with standard valve area the BSFC reduction is 1 %.
When exhaust area is increased by 30 % the BSFC reduction is 2 %.
5.3.3 Full ESC cycle results
Figure 5.7 presents the BSFC reduction for the ESC and 100 kW load points. All
load points in the DEP case have identical EGR rate and λ was kept within 4 %
of the baseline engine. As mentioned above, the valve timing does not only
control the PMEP vs. turbine work trade-off, but also the EGR driving pressure
and mass flow. Hence there are more limitations to how valve timing can be set.
This also causes the general trends discussed for Figure 5.4 to be invalid for the
SR-EGR case. Here the BSFC reduction is basically due to the mitigation of the
blow-down pulse interference only, and the pumping work improvement is a
function of which EGR rate that is required. Higher EGR rates will lead to
longer blow-down valve duration and less improvement of the pumping work.
Even so it is possible to achieve an efficiency increase with the DEP concept,
and this is done without the use of a VGT turbine.

43
FIGURE 5.7. Change in BSFC for the DEP engine compared to the baseline engine. Load point marked ** exceeds target λ by 17 %.
5.4 The LR-EGR case
This section presents the main results from the LR-EGR case study. Results
presented here concerns the pumping loop for the optimized load point, a study
of different valve area and ratios, and fuel consumption for all investigated
operating conditions. For more detailed information regarding this case, the
reader is referred to Paper 2.
5.4.1 Gas exchange process
For the LR-EGR case there was no fuel consumption benefit when using
standard exhaust valve area for the optimized load point (B9). More results
regarding valve area and ratio sweeps will be presented in the next subsection.
Only when increasing the valve area by 40 % was there a benefit in PMEP, for
reasons that can be explained with the help of Figure 5.8. For the baseline engine
there is a small reduction in backpressure with 30 % increased exhaust area, but
increasing it further does not affect the backpressure notably. This tells us that
the valves are not the restriction anymore, but the backpressure of the turbine.
For the DEP engine instead, it is clear that changing the exhaust valve area has a
larger effect. With standard exhaust valve area, there is a need to scavenge quite
late (SEVO at 300 CAD). Because the area ratio in this case is large, the
scavenging valve duration is short to avoid choking in this valve. If the duration
is increased the scavenging valve will be choked and there will be re-compression
of the cylinder gas at the end of the exhaust stroke. If scavenging area is
increased (decreasing the blow-down area), choked flow in the scavenging valve

44
will be avoided but will occur in the blow-down valve instead. For this case the
fuel consumption is identical to the baseline engine.
FIGURE 5.8. Cylinder pressure vs. volume for the LR-EGR baseline and DEP engine for standard, +30 % and +40 % exhaust area
If the total exhaust area is increased by 30 % the pump loop changes its
appearance. Since the scavenging area can be increased without decreasing the
blow-down area, it is possible to scavenging much earlier (SEVO at 270 CAD)
without choking the scavenging valve. As can be seen in Figure 5.8 the cylinder
pressure drops down to ambient levels as soon as the blow-down valve closes as
well. If the area is increased by 40 % the backpressure is reduced further,
especially during the scavenging phase. Again it is clear that the DEP concept
benefits much more from increased valve area than the baseline engine does.
Even though the increased exhaust area gives higher pumping work, the benefit
compared to the baseline engine is still very small in this load point. With +40 %
increased exhaust area, BSFC is reduced with merely 0.3 %, To summarize, the
DEP concept on the LR-EGR engine does not show the same PMEP benefit as
was shown previously in the non-EGR engine and the SR-EGR engine. This is
mainly due to generally higher pressure levels compared to the non-EGR case,
making this case more prone to choked flow. It is also due to the fact that the
twin-entry turbine in the baseline LR-EGR engine already mitigates the blow-
down pulse interference, which the VGT did not in the baseline SR-EGR case.
In the LR-EGR case, more mass flow is passed through the turbine and
compressor compared to the SR-EGR case, thus increasing the required
turbocharger power output. This might also have an effect on the overall

45
performance of the turbocharger in combination with the DEP application, but
requires further investigation.
5.4.2 Effects of changing valve area ratio
Valve area and ratio sweeps were also performed for the LR-EGR engine in the
same manner as explained in 5.3.2. These sweeps are presented in Figure 5.9. As
can be seen, there is no benefit from decreasing the intake area to allow larger
exhaust area. Again, this is due to the intake losses being larger than the benefit
received with larger exhaust area. With standard and +30 % exhaust area, BSFC
is identical to the baseline engine. Not until the area is increased by 40 % is there
benefit in a BSFC. The trend when changing area ratio is for the standard area
case similar to the SR-EGR case, increasing the ratio decreases BSFC, for
reasons explained above. Late scavenging requires larger blow-down area. If
scavenging occurs early instead, the scavenging valve will be choked for large
ratios, or the blow-down valve will be choked for small ratios. Furthermore,
early scavenging (low ratio) requires a smaller turbine to keep the boost pressure,
due to the lowered turbine mass flow, which in turn leads to higher
backpressure. When increasing the exhaust area by 30 % and 40 % the trend
changes, increasing the ratio will increase BSFC. This is because at a certain
point there is a tipping effect where the scavenging valve will not be choked and
it is more beneficial to scavenge early. With early scavenging the area ratio needs
to be smaller since the duration of the scavenging valve is increased and more
mass flow will pass through it. More on this can be found in Paper 2.
FIGURE 5.9. BSFC as a function of blow-down to scavenging area ratio for different settings of total intake and exhaust area on the LR-EGR engine.
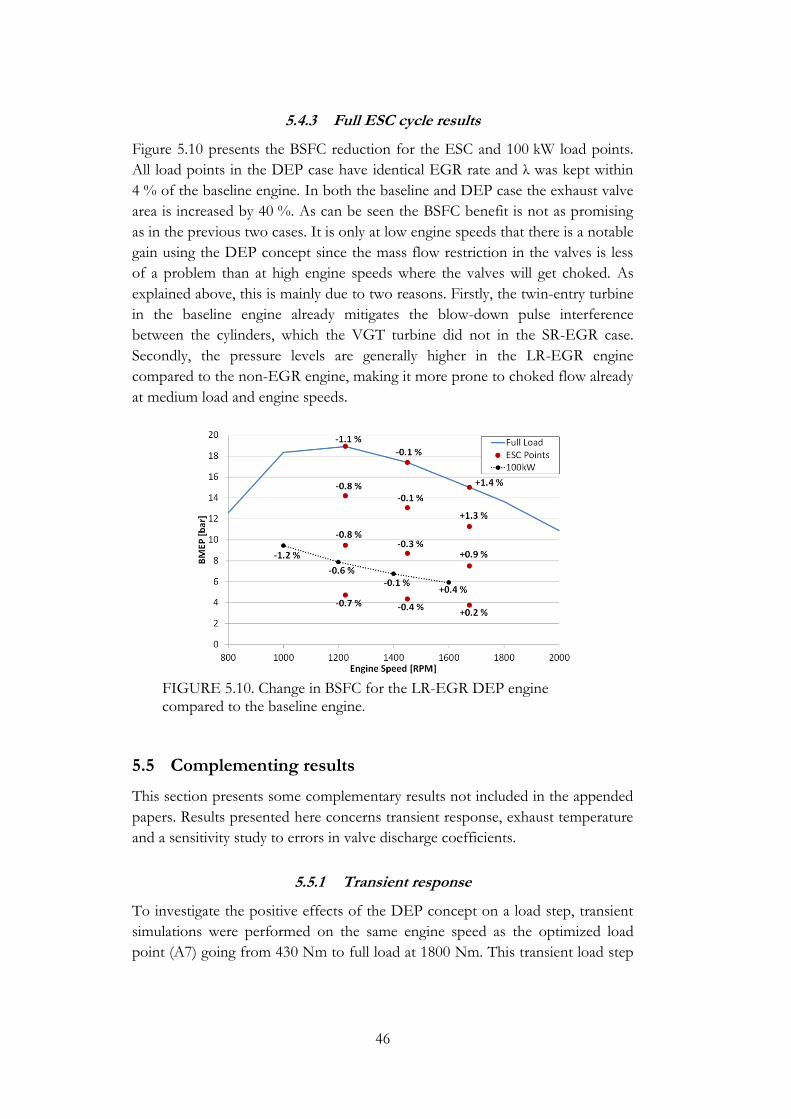
46
5.4.3 Full ESC cycle results
Figure 5.10 presents the BSFC reduction for the ESC and 100 kW load points.
All load points in the DEP case have identical EGR rate and λ was kept within
4 % of the baseline engine. In both the baseline and DEP case the exhaust valve
area is increased by 40 %. As can be seen the BSFC benefit is not as promising
as in the previous two cases. It is only at low engine speeds that there is a notable
gain using the DEP concept since the mass flow restriction in the valves is less
of a problem than at high engine speeds where the valves will get choked. As
explained above, this is mainly due to two reasons. Firstly, the twin-entry turbine
in the baseline engine already mitigates the blow-down pulse interference
between the cylinders, which the VGT turbine did not in the SR-EGR case.
Secondly, the pressure levels are generally higher in the LR-EGR engine
compared to the non-EGR engine, making it more prone to choked flow already
at medium load and engine speeds.
FIGURE 5.10. Change in BSFC for the LR-EGR DEP engine compared to the baseline engine.
5.5 Complementing results
This section presents some complementary results not included in the appended
papers. Results presented here concerns transient response, exhaust temperature
and a sensitivity study to errors in valve discharge coefficients.
5.5.1 Transient response
To investigate the positive effects of the DEP concept on a load step, transient
simulations were performed on the same engine speed as the optimized load
point (A7) going from 430 Nm to full load at 1800 Nm. This transient load step

47
had been measured in a test bed and the model had been calibrated for the
original engine in a previous work [44]. The strategy for these simulations was to
achieve high boost pressure as fast as possible using proper valve timing. This
was done for the DEP engine using the same inertia as the baseline turbocharger
and using the real inertia of the new smaller turbocharger. The reason for using
these two inertia values was to be able to separate the change in transient
performance based on gas exchange effects only and the change based on the
fact that a smaller turbine is used for the DEP engine. For both the original and
the DEP engine a λ limit of 1.4 has been used during the transient. The result in
transient response, or the time to reach full load, is shown in Figure 5.11.
FIGURE 5.11. Comparison of transient response for the non-EGR baseline and DEP engine.
The load step takes 18 engine cycles for the original engine. When using the
inertia of the baseline turbocharger on the DEP engine the load step takes 16
engine cycles. This corresponds to an improvement of 11 % on the transient
response. The improvement is both based on increased pumping work and the
fact that the turbocharger works in a more efficient operating point as has been
explained previously. For the second case when the inertia is set to the real
inertia value of the new turbocharger the load step takes 10 engine cycles. This
corresponds to an improvement of 44 % on the transient response compared to
the baseline engine. The reason for the drastic change is obvious; as the inertia is
lower the change in turbocharger rotational speed for each cycle is equally larger
for the same amount of excess torque produced by the turbine. The conclusion
of this study is that the biggest improvement to the transient response comes
from the fact that a smaller turbine is being used and not the DEP concept in
itself, even if that improves the response as well.

48
The valve timing strategy for the simulations was as follows. At low load the
valve timing that gives the lowest BSFC has been used. As the transient starts the
valve timing is changed to very late scavenging to send all exhaust gases to the
turbine. Compare this to closing a VGT during a transient. Even with very late
scavenging, the scavenging valve opens shortly at the end to puncture the
cylinder pressure. Looking at Figure 5.1 for example it is clear that the cylinder
pressure increases quite fast at the end of the exhaust stroke for the original
engine. If the scavenging valve is instead opened the cylinder pressure will drop
to close to ambient level right before the intake valve opens and there will be a
better filling of the cylinder. When the target load is reached the valve timing is
again changed to a setting that gives the lowest BSFC for that specific load.
Investigations of changing the valve timing strategy also during the transient
were performed but without improving the result notably.
5.5.2 Exhaust temperature
Paper 1 presents results of change in in-cylinder and exhaust temperature due to
the DEP concept for the non-EGR case. The conclusion was that no drastic
changes occurred due to reduced residuals, since the amount of residuals was
low in the baseline case to start with. However, reduced injected fuel mass (for
the cases with increased efficiency) resulted in lower peak cylinder temperature
and lower exhaust temperature for the DEP case. Furthermore, a more efficient
expansion over the turbine in the DEP case lowered the exhaust temperature for
some load points. There was no drastic change in turbine inlet temperature.
However, what was not presented was the temperature difference between the
blow-down and scavenging manifold, which can differ quite much. Table 5.1
presents the mass averaged temperature difference between the manifolds for all
three studied cases. Note that the speed and torque differs between load points
A and B and cannot be compared to each other directly (see Figure 4.1 and
Figure 4.2).
For all cases the blow-down manifold has a higher temperature than the
scavenging manifold. When the blow-down valve opens the cylinder gas still has
high temperature and pressure but as the cylinder gas expands the temperature
will decrease, according to adiabatic expansion, resulting in lower temperature
during the scavenging phase. For the non-EGR case the trend is that at higher
loads the temperature difference is larger. This is due to the trend discussed in
section 5.2.3, at higher loads scavenging occurs earlier causing a larger part of the
cooler scavenging flow bypass the blow-down manifold. This leads to higher
temperature differences for early scavenging. With late scavenging more of the
cooler scavenging flow will pass through the blow-down manifold, and the

49
temperature difference will be evened out more. This can especially be seen for
the SR-EGR case, where all load points runs with very late scavenging causing
the temperature difference between the manifolds to be much lower than the
non-EGR case. The LR-EGR case runs with scavenging timing somewhere in
between the other two cases, resulting in a temperature difference that is
generally higher than the SR-EGR case, but lower than the non-EGR case. This
ability to control the exhaust gas temperature between the manifolds, with valve
timing strategies, could be an important aspect to consider from a thermal
management or aftertreatment point of view.
TABLE 5.1. Difference in mass averaged temperature between blow-down and scavenging manifold for the non-EGR, SR-EGR and LR-EGR case. Positive ΔT means higher temperature for blow-down side.
Load Point
non-EGR ΔT [K]
Load Point
SR-EGR ΔT [K]
LR-EGR ΔT [K]
A1 249 B1 121 144 A2 97 B2 80 100 A3 294 B3 71 80 A4 190 B4 72 83 A5 269 B5 53 64 A6 109 B6 59 55 A7 182 B7 54 64 A8 239 B8 78 94 A9 171 B9 84 102 A10 215 B10 95 119 A11 164 B11 135 171 A12 87 B12 103 139 A13 143 B13 102 116
A14 327 B14 117 133 - - B15 120 171 - - B16 113 220
Table 5.2 presents the mass averaged temperature difference between the turbine
outlet and scavenging manifold for all three studied cases. Here it is clear that the
temperature difference is smaller due to the temperature drop over the turbine.
The general trend is that load points with high load and speed have a higher
temperature drop over the turbine (up to 120 °C). In the non-EGR case, which
has a large temperature difference between the two manifolds, the temperature is
still higher at the turbine outlet compared to the scavenging manifold. Only for
the highest load and speed points is the temperature difference almost equalized.
For the two EGR cases, which have a smaller temperature difference between
the two manifolds, the temperature difference between the turbine outlet and
scavenging manifold is almost equalized for all cases.

50
TABLE 5.2. Difference in mass averaged temperature between turbine outlet and scavenging manifold for the non-EGR, SR-EGR and LR-EGR case. Positive ΔT means higher temperature for turbine outlet.
Load Point
non-EGR ΔT [K]
Load Point
SR-EGR ΔT [K]
LR-EGR ΔT [K]
A1 207 B1 85 103 A2 88 B2 43 57 A3 224 B3 33 30 A4 146 B4 22 19 A5 183 B5 32 40 A6 78 B6 31 21 A7 115 B7 16 18 A8 133 B8 6 16 A9 92 B9 22 39 A10 95 B10 45 61 A11 51 B11 40 84 A12 20 B12 10 44 A13 25 B13 1 9 A14 276 B14 -12 7
- - B15 -7 51 - - B16 -5 113
5.5.3 Sensitivity to change in CD
When changing the valve area the valve discharge coefficient, , remains the
same as the standard valve size. Since it is clear that changing valve area has a big
effect on the DEP concept it was of importance to investigate how potential
errors or a change in would affect BSFC. This study was done for the non-
EGR case for the full load curve at different engine speed, since it is at full load
valve choking occurs. The results for the baseline case can be seen in Figure
5.12, where was increased and decreased by 10 and 20 % respectively.
It can be seen that low engine speeds are affected the least, while at high engine
speeds a change in have a larger effect on BSFC. Higher engine speed gives
higher mass flow and more restriction in the valves. Since the valves are closer to
choked flow at higher engine speeds, a small change in has a larger impact
than it has on lower engine speeds. It is also clear that BSFC is increased more
with lower than what it is decreased with higher . This is due to the fact
that once choked flow is avoided a further increase in does not affect the
pumping work as much. The closer the valves are to choked flow, the more
dramatic the effect will be of decreasing . For the highest engine speed, an
increase or decrease of by 20 % results in change of BSFC by -1 % and +2 %
respectively.

51
FIGURE 5.12. The effects on BSFC by changing the exhaust valve discharge coefficient for the baseline non-EGR engine at full load for different engine speeds.
FIGURE 5.13. The effects on BSFC by changing the exhaust valve discharge coefficient for the DEP non-EGR engine at full load for different engine speeds.
The results for the DEP case can be seen in Figure 5.13, where was increased
and decreased by 10 and 20 % respectively. Here the trends are the same, high
engine speeds are more sensitive to a change in . The case of 800 RPM is an
exception to this trend. This is due to a very long scavenging valve duration,
which causes a large restriction in the scavenging valve which makes it more
sensitive to changes in . It is clear also here that the slopes of the curves are
steeper for reduced than for increased . As explained above, the closer the

52
valve gets to choked flow, the more dramatic is the effect of lower . When
comparing Figure 5.12 and Figure 5.13, it is clear that a change in has a much
larger impact for the DEP case than for the baseline case. This is in analogy with
changing valve area as explained above. The DEP concept is much more
sensitive to changes in valve area or since only one valve is open at a time
which makes them more likely to choke. For the highest engine speed, an
increase of by 20 % results in a change of BSFC by -2 % and a decrease of
by 20 % results in a change of BSFC by and +4.4 %.
5.6 Discussion
In the previous sections the three cases have been discussed individually and
some differences have been highlighted. This section will instead present a
summary and discussion on what they have in common, that is inherent in the
DEP concept. All cases have shown some benefit to pumping work and results
from this have been presented above. However, this section will focus on
aspects of DEP that are not only connected to the pumping work and some
conditions are presented for when DEP could be a feasible concept to be
considered.
(a) Choking valves
From the results presented here and in the appended papers it is clear that the
exhaust valve size is of paramount importance to the DEP concept. Since only
one exhaust valve is open at a time the DEP concept becomes very sensitive to
flow restriction in the valves. A comparison between the three cases shows that
even though the EGR system was disconnected from the DEP system in the
LR-EGR case, valve timing strategies were still limited by the valve size. With
small total exhaust area there was a need for larger blow-down valve size and
duration compared to the non-EGR case. With increased valve area, both the
scavenging valve area and duration could be increased. Hence, there is a strong
interaction between valve size and duration, which in turn limits valve timing
strategies. Furthermore, it is also clear that there was a need for larger exhaust
area on the LR-EGR case compared the non-EGR case to get an efficiency
benefit. This is due to the generally higher boost levels in the LR-EGR case,
leading to larger flow restriction in the valves already at medium engine speeds.
As shown in Paper 2, with lower boost demand the choking could be partly
avoided and a larger increase of pumping work could be achieved. To
summarize, choking valves is the single biggest issue for the concept and needs
to be addressed either through increased valve area or decreased flow losses
across ports and valves.

53
(b) Down-speeding
Another solution to the choked valves is to run on lower engine speeds. As
shown above, there was a larger BSFC benefit at lower engine speeds than at
high engine speeds. Higher engine speed brings higher mass flow and the
exhaust valves are more likely to choke when only one valve is opened at a time.
At lower engine speed this becomes less of a problem and there is more to gain
from the DEP concept. Consequently, the DEP concept should be considered
with simultaneous down-speeding. If down-speeding is combined with a dual
clutch gearbox, which narrows the engine operating speed range, choked flow
could probably be avoided to a large extent.
(c) Wastegate
The DEP concept makes the use of a traditional wastegate obsolete. Instead of
opening a wastegate to limit boost pressure, the scavenging valve has the same
function. Furthermore, a smaller turbine can be used and at high loads the
scavenging valve opening can limit the turbine mass flow instead. With a
wastegate operated turbine there will still be a backpressure which is avoided in
the DEP case. Hence, the scavenging valve works as an improved wastegate.
(d) Variable geometry turbine
As explained more in detail in Paper 1, the DEP concept adds the functionality
of a VGT but with a fixed geometry turbine. With a VGT the geometry of the
turbine is changed to adapt to the mass flow. In the DEP case the mass flow is
adapted to the geometry of the turbine, by means of suitable valve timing. This
allows the turbine to always work in a condition with high efficiency for a wide
range of load points.
(e) Transient response
As explained above, the combination of using a smaller turbine with the VGT
functionality of the DEP concept, the transient response of the engine is
improved. Firstly, a smaller turbine has a lower inertia which shortens the speed-
up time of the turbocharger. Secondly, the smaller turbine in combination with a
late scavenging valve timing strategy will results in a higher starting boost
pressure than in the baseline case. Consequently, more fuel can be injected
before reaching the λ limit, resulting in a faster torque buildup.
(f) Pulse interference
Adding to the functionality described in (d) the DEP concept makes it possible
to avoid pulse interference between cylinders even if a single entry turbine is
used. Since it is only the scavenging valve that is opened at the end of the
exhaust stroke, the blow-down pulse of the next cylinder in firing order will not

54
interrupt the scavenging process. In the SR-EGR case where the baseline engine
uses a single entry VGT, this was shown to have a big impact on the pumping
work.
(g) Residuals
Continuing on the above; the fact that only the scavenging valve is open, at the
time of intake valve opening, will reduce the residual gas fraction in the cylinder.
Since the intake manifold pressure will always be higher than the scavenging
manifold pressure, there will be an improved scavenging process of burnt
residuals. This in turn allows for longer overlap duration between scavenging and
intake valve for optimal volumetric efficiency. Lower amount of hot residuals
results in lower in-cylinder temperature at start of combustion, which could have
an effect on NOx formation. Furthermore, this will reduce the risk of knock in
Otto-type applications and makes it possible to advance the spark timing and
increase compression ratio for increased efficiency. Reduced residuals could also
reduce the risk of pre-ignitions which was apparent in a diesel dual fuel
application of the Scania engine [48].
(h) Scavenging of HC emissions
Emissions of un-burnt hydrocarbons due to release from the crevice volumes in
the end of the exhaust stroke is a well-established mechanism in SI engines [4].
This can also be seen in time resolved measurements in the above mentioned
diesel dual fuel application and the amount of emissions exhausted during this
phase can be substantial [49]. With the DEP concept it could be possible to
direct the exhaust flow from the scavenging manifold (which contains these
crevice hydrocarbons) as EGR and in this way re-burn the HC.
(i) Thermal management
The DEP concept could be considered from a thermal management point of
view as well, to aid the aftertreatment system. With variable exhaust valves it
could be possible to combine DEP with different measures to increase the
exhaust temperature, such as early exhaust valve opening/closing or exhaust
valve opening during the intake stroke [50]. Furthermore, with the possibility to
let all exhaust flow bypass the turbine, which acts as a heat sink, catalyst light-off
time could be reduced or filter regeneration could be made more efficient.
(j) Internal EGR
In analogy with above, the external EGR system could be replaced with internal
EGR. This could for example be done through a late scavenging valve closing,
combined with late intake valve opening (since the intake pressure is higher than
the scavenging manifold pressure). Early scavenging valve closure could also be

55
used to introduce internal EGR. Alternatively, the blow-down valve could be
opened during the intake stroke. In this case the intake valve can keep its original
opening time since there is a backpressure in the blow-down manifold. However,
the issues that uncooled internal EGR brings in terms of increased in-cylinder
temperature, which affects volumetric efficiency and emission formation, need
to be addressed further.

56

57
CHAPTER 6
Conclusions and Outlook
This chapter will present the main conclusion that can be drawn based on the
results presented in the thesis and the appended papers. Suggestions for possible
future work will be given as well.
6.1 Conclusions
Simulations of the DEP concept show potential to decrease fuel consumption.
With proper valve timing and turbocharger matching, a part of the backpressure
created by the turbine can be avoided during the last part of the exhaust stroke
and pumping work is increased. However, it is apparent that the efficiency gain is
largely dependent on the exhaust valve size and valve configuration. Since only
one exhaust valve is opened at a time, the DEP engine is more prone to choke
during the exhaust phase. To avoid choked flow in the valves, the DEP engine
needs to either run at lower engine speeds or have its exhaust valve size
increased. Exhaust valve size and configuration is also largely dependent on the
valve timing strategies. Depending on the individual duration of the two exhaust
valves, their size needs to be adapted accordingly to avoid choked flow.
By adjusting valve timing towards either late or early scavenging, the trade-off
between turbine power and pumping work can be controlled. This in turn allows
control of boost pressure. This essentially gives the fixed geometry turbine the
function of a variable geometry turbine, since the inlet conditions can be
controlled with the valve timing. For low engine speed and mass flow essentially
all exhaust gas can feed the turbine. At high engine speed and load, the mass
flow can be limited by opening the scavenging valve. This has the same effect as
a wastegate, but without the added backpressure. Furthermore, since the low
pressure and low mass flow phase of the exhaust stroke is not passed to the
turbine, it operates with high efficiency to a greater extent. The possibility of
controlling the mass flow to the turbine over the whole engine speed and load
map greatly extends the range for which the turbine operates with high
efficiency.
58
The DEP concept benefits from using a smaller turbine than baseline. This
greatly improves the boosting capabilities at low engine speeds, improving the
low-end torque curve. The smaller turbine (lower inertia) together with the
functionality of controlling the mass flow to the turbine, which in turn controls
the boost pressure, greatly improves the transient response during load steps.
By removing the backpressure during the overlap period between intake and
scavenging valve, the residual gas fraction was reduced. The reduced
backpressure also allows larger overlap durations without increasing residuals.
With proper adjustment of the overlap duration the ability for more complete
cylinder filling and higher volumetric efficiency was possible.
The choice of EGR system proved to impact the outcome of the DEP concept.
When no EGR is used, the valve timing strategies are based solely on the
optimization of the turbine work vs. pumping work trade-off. With the SR-EGR
system, the valve timing strategies also need to include control of EGR driving
pressure. This greatly hampered the flexibility of the valve timing strategies.
However, since a fixed geometry turbine could be used instead of a VGT, blow-
down pulse interference could be reduced, increasing pumping work. With a LR-
EGR system, the valve timing strategies are again independent of the EGR flow
control and can be adjusted for optimal efficiency as in the non-EGR case.
However, due to higher pressure levels on the LR-EGR engine causing choked
flow already at medium engine speeds and load, a fuel efficiency benefit was not
found until the exhaust valve size was greatly increased.
6.2 Suggestions for future work
Based on the results and conclusions presented in this thesis, these are some
suggestions on possible paths for future work:
The simulations should be validated against measurements on a DEP
prototype engine. As a starting point this could be done with a fixed cam
based valve train, with a discrete set of different cam lobes before a VVT
system is implemented to keep the cost down.
Investigations could be performed on how much the exhaust valves can
be increased or how much the flow characteristics of the ports can be
improved when implementing DEP on a real cylinder head.
Based on the results, DEP should be considered with simultaneous
down-speeding. Hence, the simulations could be re-run with the same
optimization procedure but with the purpose of optimizing the concept

59
at a lower speed range. Possibilities of combining this with a dual clutch
gearbox could also be included.
Development of control strategies for the variable valve timing could be
investigated. Valve timing was shown to largely depend on speed and
load and one can imagine that engine calibration or control strategies
during transient operation or during real driving cycles could possibly be
quite complex.
A complete mapping of the variable valve timing strategies could be
performed for the whole operating range of the engine, both stationery
and transient. With this as a base it could be investigated if it would be
possible to make some simplifications on the variability of the valves, to
avoiding the need for a FVVT.
An investigation could be made on the cost trade-off between the extra
energy required to operate a specific VVT system and the fuel efficiency
that is gained when implementing DEP.
Further investigations should be made as to how turbine efficiency is
affected by the different exhaust pressure pulse train that the DEP
concept generates. According to GT-Power calculations it is possible to
maintain the same turbine power with lower mass flow, but this needs to
be verified by extending the performance map under pulsatile flow.
Further studies on valve modeling should be performed. In this study the
two exhaust valves are allowed to change size. Furthermore, compared to
a standard engine the two exhaust valves open at completely different
cylinder pressure. However, both exhaust valves use the same discharge
coefficient which is measured for very low pressure ratios. A more in-
depth analysis how this affects the real application is needed.
The suggestions from the two last bullets could be investigated by means of
measurements on the CCGEx pulsating flow rig. There, both turbine
performance measurements for different pulse modulation and discharge
coefficient measurements for different pressure ratio could be performed.
Preferably the discharge coefficients could be instantaneously measured during
the valve opening and closing event to investigate dynamic effects. The
groundwork for these kinds of studies and the corresponding simulation in GT-
Power of the same experiments has already been started. Simulations of the
pulsating flow rig, with and without a turbine have shown good agreement. More
information on these simulations can be found in Appendix A.

60

61
APPENDIX A
Pulsating Flow Rig
This appendix deals with the 1D simulation with GT-Power [40] of the pulsating
flow rig developed within the CICERO laboratory at KTH CCGEx. The
purpose of this study was to investigate the possibilities of correctly simulating
the behavior of the highly pulsatile flow in the rig both with and without a
turbocharger. The flow rig model can then be used as a complementary tool for
future experiments concerning gas exchange related topics in the flow rig
laboratory. A short introduction to the experimental and simulation setup will be
given and results from measurements and calculations on experiments both with
and without a turbocharger will be presented.
A.1 Experimental setup
The flow rig system consists of compressors and tanks feeding the rig with
compressed air of up to 0.5 kg/s at 5 bar through a pipe system. Upstream the
flow rig, the air is heated in an electric heater to avoid the temperature from
falling below the dew point downstream a turbine for instance. The flow is then
directed to a ball valve where the ball, planed on two opposite sides, is able to
rotate within a circular pipe. The ball is rotated with a frequency controlled AC
motor causing the valve to open twice per revolution. In this way a pulsatile flow
downstream the ball valve (chopper) is achieved. A by-pass line with a control
valve in parallel with the chopper allows the pulse amplitude to be varied.
Downstream the chopper it is possible to mount any measurement devices. For
more details regarding the flow rig and its measurement equipment the reader is
referred to [51]. Two sets of experiments were performed with corresponding
simulations in GT-Power. The first concerns pulsatile flow with a contraction
downstream the chopper, and the second concerns pulsatile flow with a turbine
downstream the chopper.

62
A.1.1 Setup with contraction
The first set of experiments was performed with a contraction, which acts as
turbine, downstream the chopper. Static pressure was measured upstream the
chopper and at three locations downstream the chopper (p2 not used due to
faulty sensor), while temperature was measured directly downstream the
chopper, see Figure A.1. Temperature was measured both averaged and time
resolved. Average mass flow rate was measured upstream the electrical heater, at
the laboratory inlet line, with a hot film flow meter. Measurements were
performed both without and with a contraction (25 % of the pipe area) at the
outlet orifice. Tests were run for two different pulse frequencies (60 and 100 Hz)
and mass flow rates ranging from 58 to 146 g/s for a total of 22 cases.
FIGURE A.1. Schematic representation of the flow rig setup and its instrumentation with the contraction. pi is pressure sensors (i=1, Kistler 4045A10; i=3-5 Kistler 4045A5). Ti is temperature sensors (i=1, thermocouple; i=2, cold wire). Lengths and diameters in [mm].
A.1.2 Setup with turbocharger
The second set of experiments were performed with a turbine connected
downstream the chopper, see Figure A.2. Time resolved static pressure (p1T, p2T),
total pressure (p01T), stagnation temperature (T01T, T02T) and flow velocity (U1T,
U2T) were measured upstream and downstream the turbine. Average pressure
and temperature were measured on the compressor side but are not included in
this study. Time resolved pressure was measured with piezo-resistive pressure
transducers and temperature with cold wires (Ø5μm wolfram). The time
resolved flow velocity upstream and downstream the turbine was measured with
vortex shedding meters. With measured pressure and temperature the density
was calculated using the gas law. Density and velocity gives in turn the
instantaneous mass flow rate. Measurements were performed for three different
pulse frequencies (40, 60 and 80 Hz) and four mass flow rates (55, 80, 105, 130
g/s). The turbocharger used was a Garret GT17 NS. For more details regarding
the instrumentation, measurement techniques and results from these
measurement the reader is referred to [51].

63
FIGURE A.2. Schematic representation of the flow rig setup and its instrumentation with a turbocharger. 1. Inlet regulator valve, 2. Electric heater, 3. Pulse generator, 4. By-pass line, 5. Turbine, 6. Compressor [51].
A.2 Simulation setup
The GT-Power model of the flow rig is built up from pipe objects 3 meters
upstream the chopper and 10 m downstream the turbine. In the case with the
contraction the model ends at the contraction location. The by-pass line (not
used in the measurements) and electrical heater is not included in the model. The
pipe objects represent the real geometry of the flow rig piping system and
surface roughness and heat transfer coefficients are set according to values for
smooth steel. The turbine is modeled with the corresponding performance map
for the Garret GT17 NS turbocharger according to standard methods, see
Section 3.4. More details on the modeling of the chopper and a short note on the
boundary conditions used will be presented below.
765mm
745mm

64
A.2.1 Chopper modeling
As described in Section 3.3, all valves are modeled in GT-Power through the
input of discharge coefficients, . This can be a single value or a function of
one or more parameters like valve lift, angle, pressure and so forth. For simple
geometries the coefficient can be set by the code (tabulated from database of
known geometries) but for more complex geometries, e.g. valves, needs to be
entered by the user. The discharge coefficient for the chopper valve was
calculated from Equation 3.6-3.8. Input for these calculations came from
measurements performed on the flow rig under steady state conditions for a
range of mass flow rates, valve angles and pressure ratios over the chopper, see
Figure A.3. Average mass flow rate and temperature was measured upstream the
chopper and static pressure was measured directly upstream and downstream of
the chopper. For total inlet pressure, the dynamic pressure was estimated with
the help of the mass flow rate, temperature and pipe area. With these
measurements, Equations 3.6-3.8 were used to calculate as a function of valve
angle and pressure drop over the chopper. Due to measurement uncertainties at
low mass flow rates and pressure drops, did not show a smooth trend in this
range and a curve fit was applied as input for GT-Power. When calculating the
mass flow rate, using the curve fit of the values, result still show good
agreement with the measured mass flow rate, see Figure A.3.
FIGURE A.3. Measured and modeled values for mass flow rate as a function of valve angle and pressure drop over the chopper.

65
A.2.2 Boundary conditions
Inlet boundary conditions are averaged temperature and instantaneous pressure
from measurements for the case with the contraction. In the turbocharger case
the instantaneous pressure upstream the chopper was not available but the
average mass flow rate was used instead. Outlet boundary conditions are in both
cases ambient pressure and temperature. For the pipe wall an isothermal
boundary condition was used where the temperature was set equal to the
measured inlet air temperature. The turbine was set with a fixed rotational speed
given by the measured turbocharger speed.
Since the instantaneous pressure upstream the chopper was not available for the
simulations of the turbocharger setup, this model required some tuning. To
capture the correct pulse amplitude downstream of the chopper the length of the
pipe upstream the chopper had to be adjusted. Since the distance between the
inlet boundary and the chopper will greatly affect the pulse propagation
behavior, caused by the reflecting pressure pulses as the valve closes, the length
required tuning for good agreement with measurements. Note that this tuning to
get the correct pressure pulse propagation was not required in the case with the
contraction since the measured instantaneous pressure could be used as
boundary condition. Note also that no further tuning or calibration of the model,
in terms of pressure loss, heat transfer, friction coefficients etc., was performed
for the results presented below.
A.3 Results and discussion
This section will present some examples of results from both the case with the
contraction and with the turbocharger to show the validity of the simulations
when compared to measurements.
A.3.1 Contraction results and discussion
A highlight from the results when comparing the measured temperature and
pressure to the simulated ones, are presented in Figure A.4. Temperature and
pressures are the measured and simulated values at the locations according to
Figure A.1. Since the measured pressure upstream the chopper (p1) is used as the
boundary condition, the simulated value is the same and is not included. The two
cases presented are with 60 and 100 Hz pulse frequency and a mass flow rate of
110 g/s. The contraction area is 25 % of the connecting pipe area. It is clear that
the GT-Power simulation agrees very well with the measurements and is able to
capture both the pressure waves generated by the chopper and the reflecting
waves caused by the restriction. There are slightly larger discrepancies between

66
measured and simulated temperature, at least for the 60 Hz case, but the general
trend is captured within reasonable limits. The same agreement can be observed
for the remaining 20 cases where the simulation model is able to capture the
pressure pulsations also for other mass flow rates and contraction areas. For
higher mass flow rates (>146 g/s), the discrepancy is slightly larger between
measurements and simulations, this is especially true for the temperature, but the
reason for this has not yet been found. It could be an error in the discharge
coefficient at choked conditions but needs to be confirmed by re-evaluating the
measurements and calculations performed for establishing the values.
FIGURE A.4. Measured and simulated temperature and pressure at three locations downstream the chopper for two pulse frequencies (60 and 100 Hz), with mass flow rate of 110 g/s and outlet contraction of 25 % of total pipe area.
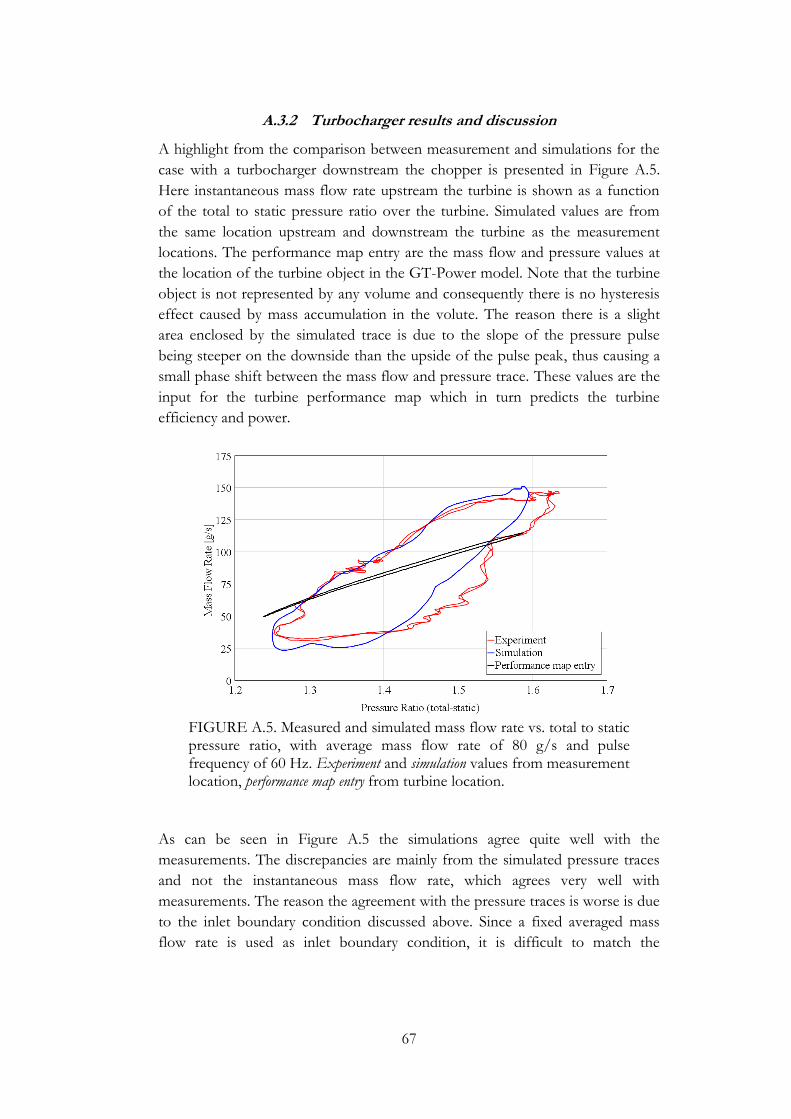
67
A.3.2 Turbocharger results and discussion
A highlight from the comparison between measurement and simulations for the
case with a turbocharger downstream the chopper is presented in Figure A.5.
Here instantaneous mass flow rate upstream the turbine is shown as a function
of the total to static pressure ratio over the turbine. Simulated values are from
the same location upstream and downstream the turbine as the measurement
locations. The performance map entry are the mass flow and pressure values at
the location of the turbine object in the GT-Power model. Note that the turbine
object is not represented by any volume and consequently there is no hysteresis
effect caused by mass accumulation in the volute. The reason there is a slight
area enclosed by the simulated trace is due to the slope of the pressure pulse
being steeper on the downside than the upside of the pulse peak, thus causing a
small phase shift between the mass flow and pressure trace. These values are the
input for the turbine performance map which in turn predicts the turbine
efficiency and power.
FIGURE A.5. Measured and simulated mass flow rate vs. total to static pressure ratio, with average mass flow rate of 80 g/s and pulse frequency of 60 Hz. Experiment and simulation values from measurement location, performance map entry from turbine location.
As can be seen in Figure A.5 the simulations agree quite well with the
measurements. The discrepancies are mainly from the simulated pressure traces
and not the instantaneous mass flow rate, which agrees very well with
measurements. The reason the agreement with the pressure traces is worse is due
to the inlet boundary condition discussed above. Since a fixed averaged mass
flow rate is used as inlet boundary condition, it is difficult to match the

68
simulation to the measurements solely by tuning of the inlet pipe length for
proper pulse propagation. Furthermore, this result in a situation where this pipe
tuning is required for all cases individually, e.g. the pipe length used for this case
will not give good agreement for other mass flow rates or frequencies. This issue
could likely be resolved by using instantaneous pressure measurements upstream
the chopper as inlet boundary condition, as was done in the case with the
contraction.
A.4 Summary
To summarize, the GT-Power model of the flow rig appears to agree well with
measurements when comparing both the case with the contraction and with the
turbocharger. This is done without any major tuning or calibration of the model.
However, there was a need to measure the discharge coefficient of the chopper
valve for accurate prediction of the pulse amplitude. Issues with a correct
prediction at higher mass flow rates were found and could be due to erroneous
values for the chopper at critical flow cases. Furthermore, it was clear that an
instantaneous pressure measurement upstream the chopper should preferably be
used as an inlet boundary condition. This is to avoid the need for pipe length
tuning for individual cases, and a correct prediction of pressure pulse
propagation both upstream and downstream the chopper. In addition to this, it
would be of interest to measure the instantaneous mass flow rate closer to the
turbine. In this setup the mass flow rate was assessed quite far from the turbine
inlet and outlet (app. 15 pipe diameters). This makes it difficult to analyze the
mass accumulation effect in the relatively small volute volume, since the pipe
volume between measured mass flow rate and turbine is much larger.
With this GT-Power model in combination with future experiments on the
pulsating flow rig with instantaneous mass flow rate measurements, further
studies can be made on turbocharger performance behavior under un-steady
conditions. For future studies it would be of interest to also measure turbine
power or torque. Investigations could then be made if GT-Power can correctly
predict the efficiency and power produced also under pulsating conditions. If
not, the error caused by the quasi-steady assumption and negation of the mass
accumulation effect in the volute could be assessed further.
A.5 Acknowledgements
Fredrik Laurantzon, Nils Tillmark and Ramis Örlü are greatly acknowledged for
performing all the experiments and providing the measurement data used for the
simulations.

69
References
1. K. Aleklett, Peeking at Peak Oil. New York: Springer-Verlag New York Inc.,
2012.
2. N. Watson and M.S. Janota, Turbocharging the Internal Combustion Engine.
London: The MacMillan Press Ltd., 1982.
3. Nicholas C. Baines, Fundamentals of Turbocharging. Vermont: Concepts
NREC, 2004.
4. John B. Heywood, Internal Combustion Engine Fundamentals. New York:
McGraw-Hill Book Company, 1988.
5. G. Garcea, "Timing variator for the timing system of a reciprocating internal
combustion engine," United States Patent 4231330, November 1980.
6. K. Inoue, K. Nagahiro, Y. Ajiki, and N. Kishi, "A High Power, Wide
Torque Range, Efficient Engine with a Newly Developed Variablea-Valve-
Lift and -Timing Mechanism", SAE Technical Paper 890675.
7. C. Brüstle and D. Schwarzenthal, "VarioCam Plus - A Highlight of the
Porsche 911 Turbo Engine", SAE Technical Paper 2001-01-0245.
8. R. Flierl and M. Klüting, "The Third Generation of Valvetrains - New
Fully Variable Valvetrains for Throttle-Free Load Control", SAE Technical
Paper 2000-01-1227.
9. M. Haas and M. Rauch, "Electro-Hydraulic Fully Variable Valve Train
System", MTZ, vol. 71-03/2010.
10. L. Bernard et al., "Electro-hydraulic Valve Control with MultiAir
Technology", MTZ, vol. 70-12/2009.
11. D. Cope, A. Wright, C. Corcoran, K Pasch, and D. Fischer, "Fully
Flexible Electromagnetic Valve Actuator: Design, Modeling, and
Measurements", SAE Technical Paper 2008-01-1350.
12. J. Allen and D. Law, "Production Electro-Hydraulic Variable Valve-Train
for a New Generation of I.C. Engines", SAE Technical Paper 2002-01-1109.
13. S. Trajkovic, A. Milosavljevic, P. Tunestål, and B. Johansson, "FPGA
Controlled Pneumatic Variable Valve Actuation", SAE Technical Paper
2006-01-0041.
14. W. Kiefer, N. Klauer, M. Krauss, W. Mährle, and E. Schünemann, "The

70
New BMW Inline Six-Cylinder Spark Ignition Engine", MTZ, vol. 65-
12/2004.
15. G. Ericsson, F. Westin, and H.E. Ångström, "Optimizing the transient of
an SI-engine equipped with variable cam timing and variable turbine", SAE
Technical Paper 2010-01-1233.
16. C. Tai, T.C. Tsao, N. Schörn, and M. Levin, "Increasing Torque Output
from a Turbodiesel with Camless Valvetrain", SAE Technical Paper 2002-01-
1108.
17. G.B. Parvate-Patil, H. Hong, and B. Gordon, "Analysis of Variable Valve
Timing Events and Their Effects on Single Cylinder Diesel Engine", SAE
Technical Paper 2004-01-2965.
18. H. Fessler and M. Genova, "An Electro-Hydraulic ”Lost Motion” VVA
System for a 3.0 Liter Diesel Engine", SAE Technical Paper 2004-01-3018.
19. J. Deng and R. Stobart, "BSFC Investigation Using Variable Valve Timing
in a Heavy Duty Diesel Engine", SAE Technical Paper 2009-01-1525.
20. F. Agrell, Control of HCCI by aid of Variable Valve Timings with Specialization in
Usage of a Non-Linear Quasi-Static Compensation. Stockholm: Doctoral Thesis,
Royal Institute of Technology, 2006.
21. Y. Kodama et al., "Full-Load HCCI Operation with Variable Valve
Actuation System in a Heavy-Duty Diesel Engine", SAE Technical Paper
2007-01-0215.
22. S. Trajkovic, The Pneumatic Hybrid Vehicle - A New Concept for Fuel Consumption
Reduction. Lund: Doctoral Thesis, Lund University, 2010.
23. L. Guzzella, C. Onder, C. Dönitz, C. Voser, and I. Vasile, "The
Pneumatic Hybridization Concept For Downsizing and Supercharging
Gasoline Engines", MTZ, vol. 71-01/2010.
24. A. Munnannur, S.C. Kong, and R.D. Reitz, "Performance Optimization
of Diesel Engines with Variable Intake Valve Timing Via Genetic
Algorithms", SAE Technical Paper 2005-01-0374.
25. X. He, R.P. Durrett, and Z. Sun, "Late Intake Valve Closing as en
Emissions Control Strategy at Tier 2 Bin 5 Engine-Out NOx Level", SAE
Technical Paper 2008-01-0637.
26. E. Schutting et al., "Miller- and Atkinson-Cycle on a Turbocharged Diesel
Engine", MTZ, vol. 68-06/2007.
27. Cargine Engineering AB. (2012) Free Valve Technology. [Online].
http://www.cargine.com
28. Société Rateau, "Improvements in or relating to Internal Combustion
Engines," British Patent 179,926, February 1924.

71
29. Deutz AG, "Turbocharged four stroke cycle fuel injection engine," United
States Patent 2,979,887, April 1961.
30. Fleming Thermodynamics Ltd., "I.C. engine with an exhaust driven
turbine or positive displacement expander," British Patent 2,185,286, July
1987.
31. SAAB Automobile AB, Family of Swedish Patents SE507030C2,
SE521615C2, SE521174C2, SE514806C2, SE514969C2, SE512943C2,
SE518687C2, 1998-2003.
32. C. Elmqvist-Möller, P. Johansson, B. Grandin, and F. Lindström,
"Divided Exhaust Period – a gas exchange system for turbocharged SI
engines", SAE Technical Paper 2005-01-1150.
33. T. Ross and H. Zellbeck, "New Approach To Turbochargers For Four-
Cylinder Gasoline Engines", MTZ, vol. 5-12/2010.
34. T. Ross, "Mehrzylinder-Ottomotor mit Abgasturboaufladung und Verfahren
zu dessen Betrieb," German Patent DE102008036308A, April 2010.
35. D. Roth and P. Keller, "Valve-Event Modulated Boost System", SAE
Technical Paper 2010-01-1222.
36. D. Roth and M. Becker, "Valve-Event Modulated Boost System: Fuel
Consumption and Performance with Scavenge-Sourced EGR", SAE Int. J.
Engines, vol. 5(2):538-546, 2012.
37. A. Williams, A. Baker, and C. Garner, "Turbo-Discharging: Predicted
Improvements in Engine Fuel Economy and Performance", SAE Technical
Paper 2011-01-0371.
38. A. Williams, A. Baker, and C. Garner, "Turbo-Discharging for improved
engine torque and fuel economy", Proc. of IMechE: 10th International
Conference on Turbocharging and Turbochargers, pp. 15-23, 2012.
39. M. Makdissi, Simulering av DEP på en 12-liters Scaniadiesel. Stockholm: Master
Thesis, Royal Institute of Technology, 2004.
40. Gamma Technologies Inc. (2012) Flow Theory Manual 7.2. [Online].
http://www.gtisoft.com
41. Gordon P. Blair, Design and Simulation of Four-Stroke Engines. Warrendale:
SAE Inc., 1998.
42. F. Westin, Simulation of turbocharged SI-engines - with focus on the turbine.
Stockholm: Doctoral Thesis, Royal Institute of Technology, 2005.
43. R. Aymanns, J. Scharf, T. Uhlmann, and S. Pischinger, "Turbocharger
Efficiencies in Pulsating Exhaust Gas Flow", MTZ, vol. 07-08/2012.
44. N. Winkler, Transient simulations of heavy-duty diesel engines with focus on the turbine.
Stockholm: Licentiate Thesis, Royal Institute of Technology, 2008.

72
45. J. Ma, H. Schock, U. Carlson, A. Hoglund, and M. Hedman, "Analysis
and Modeling of an Electronically Controlled Pneumatic Hydraulic Valve for
an Automotive Engine", SAE Technical Paper 2006-01-0042.
46. J. Kuyper, Drifttidsanalys av dieselmotorer i tunga fordon. Stockholm: Bachelor
Thesis, Royal Institute of Technology, 2010.
47. S. Reifarth and H.E. Ångström, "Transient EGR in a High-Speed DI
Diesel Engine for a set of different EGR-routings", SAE Int. J. Engines, vol.
3(1):1071-1078, 2010.
48. F. Königsson, Advancing the Limits of Dual Fuel Combustion. Stockholm:
Licentiate Thesis, Royal Institute of Technology, 2012.
49. F. Königsson, J. Kuyper, P. Stålhammar, and H.E. Ångström, "The
Influence of Crevices on Hydrocarbon Emissions from a Diesel Dual Fuel
Engine", SAE Technical Paper 2013.
50. A. Wickström, Variable Valve Actuation Strategies for Exhaust Thermal
Management on a HD Diesel Engine. Stockholm: Master Thesis, Royal Institute
of Technology, 2012.
51. F. Laurantzon, Flow measurements related to gas exchange applications. Stockholm:
Doctoral Thesis, Royal Institute of Technology, 2012.
Recommended