DOCKETED
Docket Number: 17-BSTD-01
Project Title: 2019 Building Energy Efficiency Standards PreRulemaking
TN #: 220969
Document Title: Presentation - Proposed 2019 Building Energy Efficiency Standards ZNE Strategy
Description: Presentation by Maziar Shirakh, made at the 8-30-17 Staff Workshop.
Filer: Adrian Ownby
Organization: California Energy Commission
Submitter Role: Commission Staff
Submission Date:
8/30/2017 3:53:13 PM
Docketed Date: 8/30/2017
Building Energy Efficiency Standards
Proposed 2019 Building Energy Efficiency Standards ZNE Strategy Building Standards Office: Mazi Shirakh, PE ZNE Lead and Advisor for Building Energy Efficiency Standards (BEES) Christopher Meyer Manager, Building Standards Office Bill Pennington Senior Technical and Program Advisor to the Energy Efficiency Division Payam Bozogchami, PE Project Manager, BEES Danny Tam Mechanical Engineer
Countdown to 2020
August 30, 2017
2019 ZNE Strategy
Content 1. Proposed ZNE Strategy – Parts 6 and 11
2. CBECC-Res Software Tools for ZNE
2
3
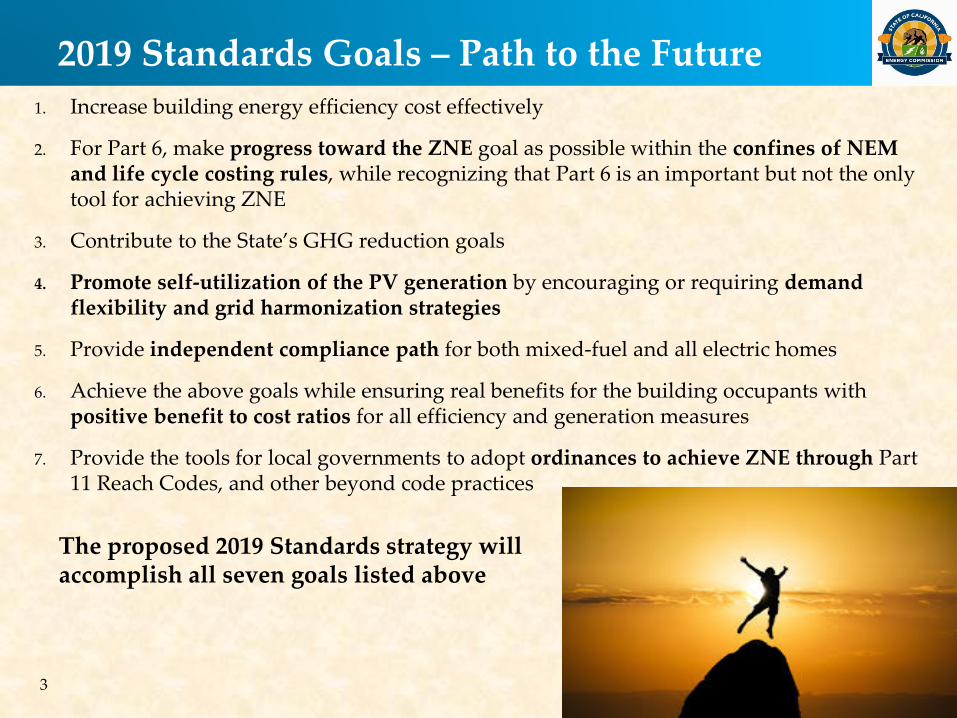
2019 Standards Goals – Path to the Future 1. Increase building energy efficiency cost effectively
2. For Part 6, make progress toward the ZNE goal as possible within the confines of NEM and life cycle costing rules, while recognizing that Part 6 is an important but not the only tool for achieving ZNE
3. Contribute to the State’s GHG reduction goals
4. Promote self-utilization of the PV generation by encouraging or requiring demand flexibility and grid harmonization strategies
5. Provide independent compliance path for both mixed-fuel and all electric homes
6. Achieve the above goals while ensuring real benefits for the building occupants with positive benefit to cost ratios for all efficiency and generation measures
7. Provide the tools for local governments to adopt ordinances to achieve ZNE through Part 11 Reach Codes, and other beyond code practices
The proposed 2019 Standards strategy will accomplish all seven goals listed above
4
ZNE Goals – Grid Harmonization Grid harmonization strategies (GHS) must be coupled with customer owned PV systems to bring maximum benefits to the grid, environment, and the home owner
GHSs are strategies that maximize self-utilization of the PV array output and minimize exports back to the grid; examples of GHS include but are not limited to battery storage, demand response, thermal storage, and for some homeowners, EV grid integration.
5
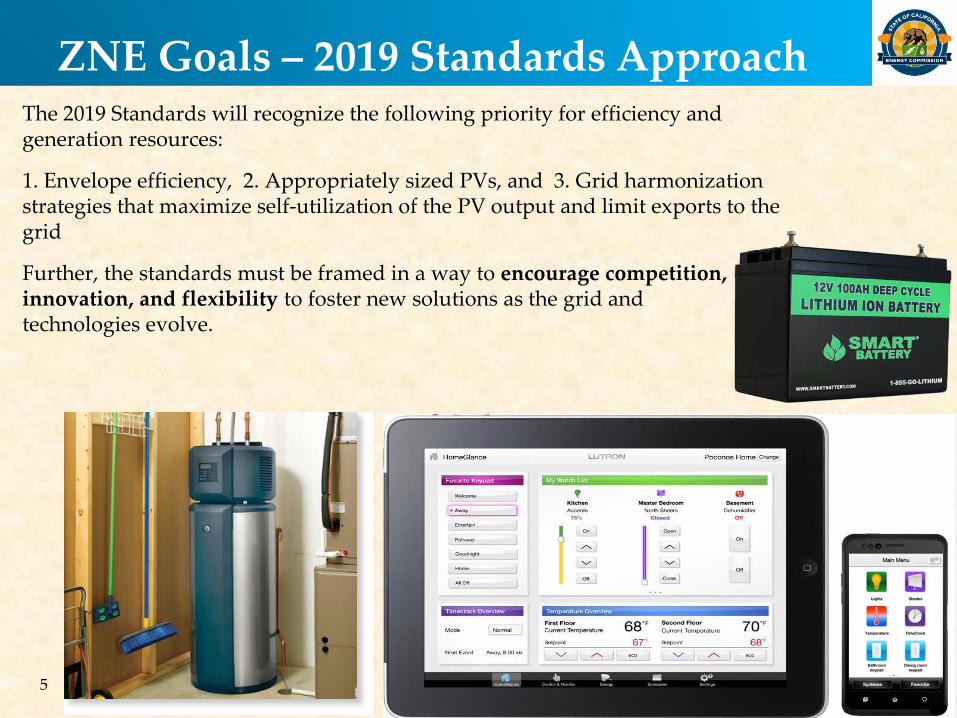
ZNE Goals – 2019 Standards Approach The 2019 Standards will recognize the following priority for efficiency and generation resources:
1. Envelope efficiency, 2. Appropriately sized PVs, and 3. Grid harmonization strategies that maximize self-utilization of the PV output and limit exports to the grid
Further, the standards must be framed in a way to encourage competition, innovation, and flexibility to foster new solutions as the grid and technologies evolve.

6
Standards and PV Sizing
• For Part 6, PV is sized to net out the buildings annual kWh; larger PV array may be installed but will not receive additional compliance credit
• For Part 11 compliance, CBECC allows PV array coupled with a 6 kWh battery storage system to be oversized by a factor of 1.6; this PV size:
Provides additional flexibility for the grid; the battery enables the increased PV capacity to be used by the utility to meet high demand during critical peak periods
Promotes self-utilization on peak since PV is coupled with battery storage
The 1.6 cap ensures a greater than 1.0 benefit to cost ratio for the building owner even if hourly exports are compensated only at avoided cost
• CBECC provides a size limit bypass checkbox that once checked allows exceeding the 1.6 times size limit, with a warning that this option may violate NEM sizing rules
7
Builds on Commission’s Energy Design Rating Tool
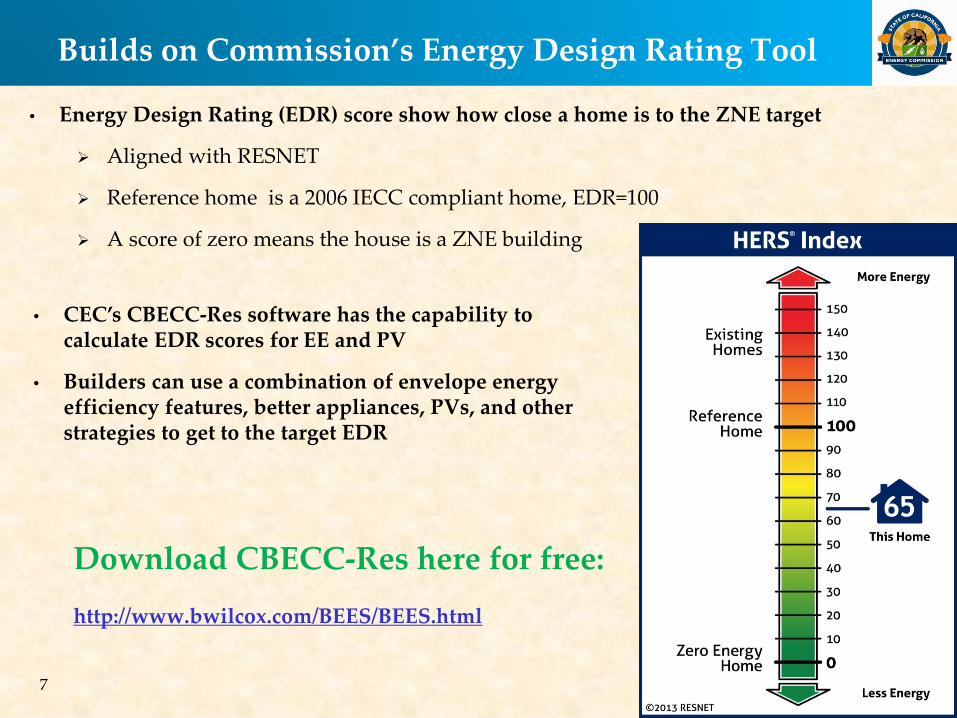
• Energy Design Rating (EDR) score show how close a home is to the ZNE target
Aligned with RESNET
Reference home is a 2006 IECC compliant home, EDR=100
A score of zero means the house is a ZNE building
• CEC’s CBECC-Res software has the capability to calculate EDR scores for EE and PV
• Builders can use a combination of envelope energy efficiency features, better appliances, PVs, and other strategies to get to the target EDR
Download CBECC-Res here for free: http://www.bwilcox.com/BEES/BEES.html
8
Proposed 2019 Standards Approach
Energy Design Rating (EDR) targets for each climate zone: 1. An EDR level for energy efficiency features based on 2019 prescriptive
measures – This EDR target can only be met using energy efficiency measures, i.e., no PV tradeoff
2. An EDR Contribution for the PV system that is sized to displace the home’s annual kWhs
3. Subtract the PV EDR Contribution from the energy efficiency EDR to determine the final target EDR

9
Proposed 2019 Standards Approach 1. Maximize envelope efficiency as allowed by LCC and calculate EE EDR
i. HPA to R19 in severe CZs – Currently R13
ii. HPW to 0.043 ~ 0.046 U-factor in severe CZs – Currently 0.051
iii. Windows U-factor of 0.30 and SHGC of 0.23 – Currently 0.32 and 0.25
iv. QII as a prescriptive requirement
Establish an Energy Design Rating (EDR) for energy efficiency in each CZ that can only be met with efficiency measures (no PV tradeoff against EE)
2. Calculate EDR of PV system as follows:
i. Calculate the PV size required to displace the kWh in each CZ
ii. Calculate the EDR contribution of the PV array
3. Subtract the PV EDR contribution from the EE EDR contribution to establish the final EDR that the building must meet to comply in each CZ
Note: Examples are presented in later slides
10
Target EDR’s Many Advantages 1. A target EDR establishes a performance benchmark that the building must
meet to comply; consistent with the Warren-Alquist Act performance standards expectation to provide builders with compliance flexibility
2. Target EDR allows the builder to use more efficiency and less PV to get to the target; such as high performance glazing, Energy Star appliances, and higher than minimum HVAC systems that we are prevented from requiring because of preemption issues
3. The EDR concept can be used to right size the PV system for low EDR and ZNE goals by taking advantage of grid harmonization strategies including battery storage, thermal storage, and demand response and flexibility strategies
4. Target EDR is fully compatible with setting reach codes, local jurisdiction simply identifies a lower target EDR (or zero) that can be met with a combination of additional EE, PV, demand response/flexibility, EV integration, or storage
5. Target EDR works well with varying building sizes – static PV size does not

11
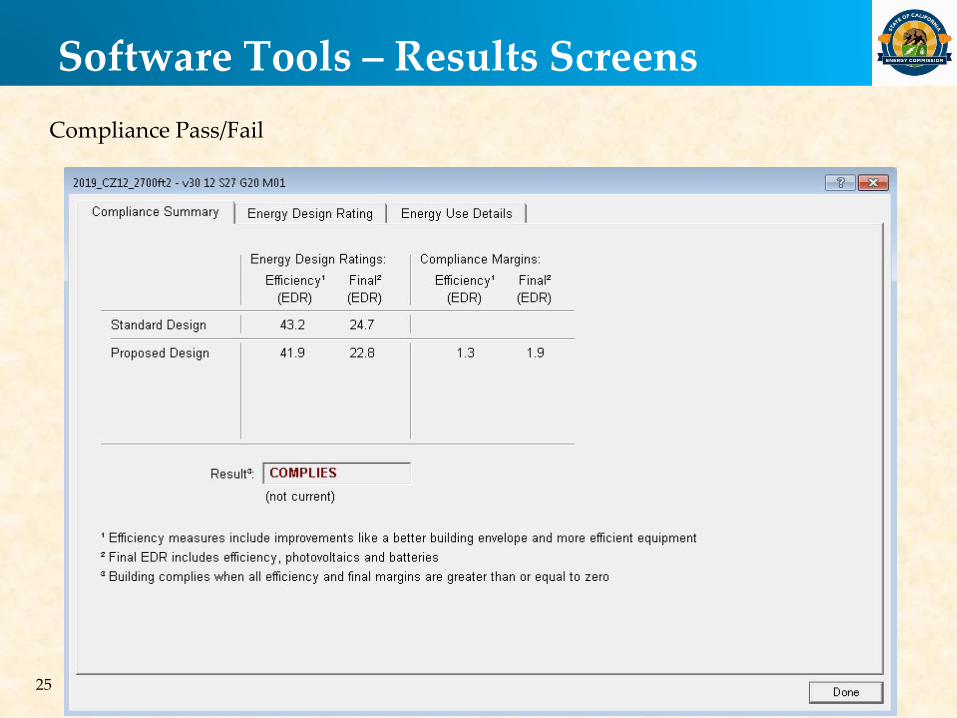
Target EDR Advantages - Example Here is an example of how CBECC-Res calculates the Target EDR for both EE and PV in CZ12 for the 2,700 sf house:
12
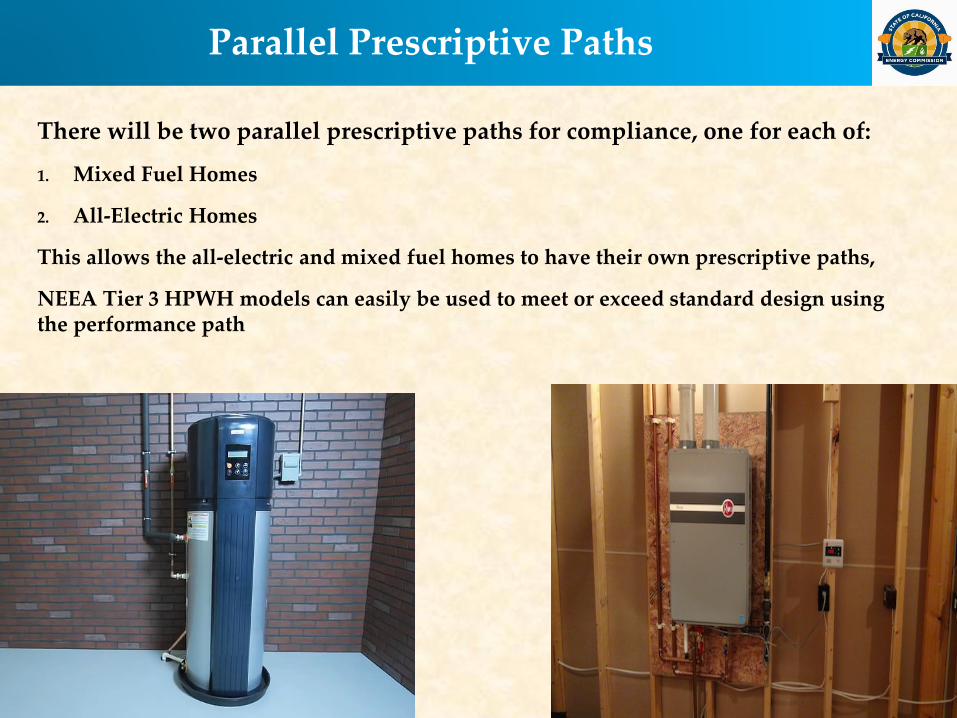
Parallel Prescriptive Paths
There will be two parallel prescriptive paths for compliance, one for each of:
1. Mixed Fuel Homes
2. All-Electric Homes
This allows the all-electric and mixed fuel homes to have their own prescriptive paths,
NEEA Tier 3 HPWH models can easily be used to meet or exceed standard design using the performance path
13
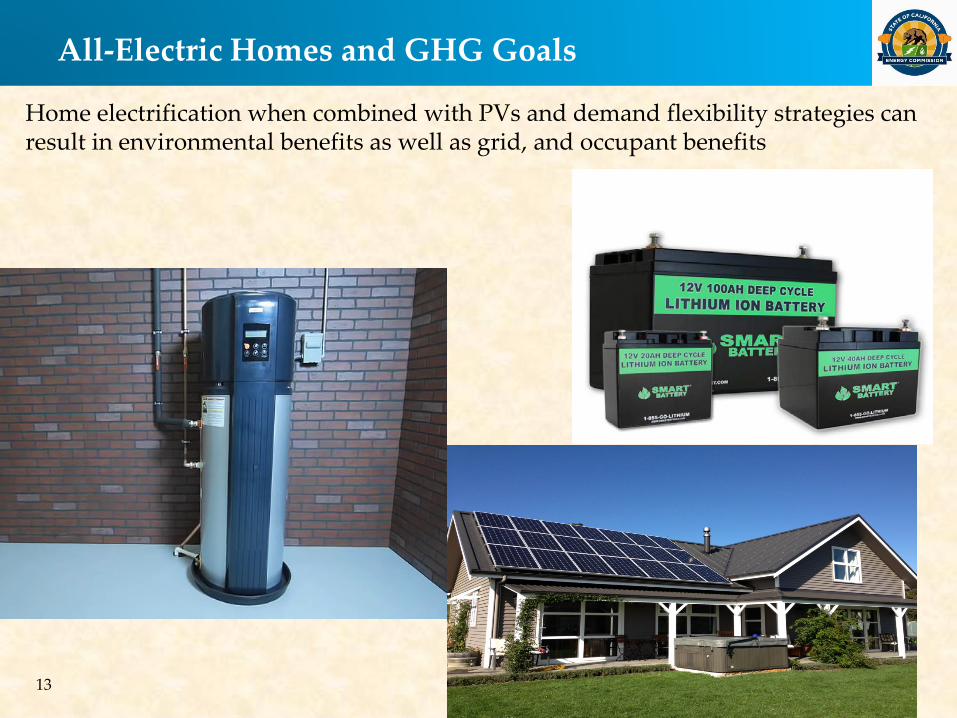
All-Electric Homes and GHG Goals Home electrification when combined with PVs and demand flexibility strategies can
result in environmental benefits as well as grid, and occupant benefits
14
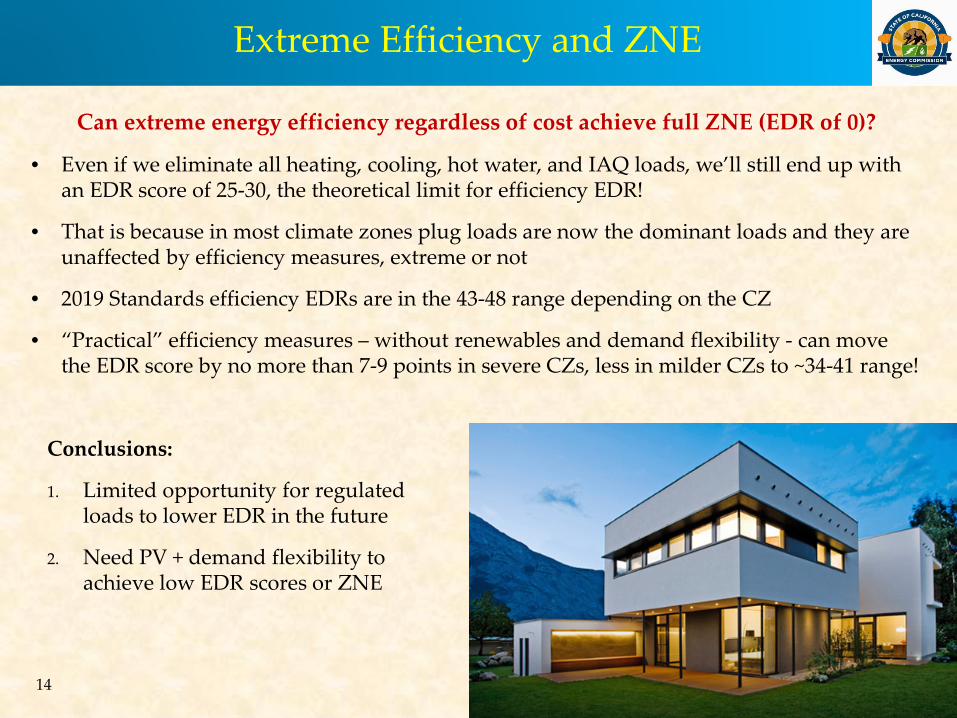
Extreme Efficiency and ZNE
Conclusions:
1. Limited opportunity for regulated loads to lower EDR in the future
2. Need PV + demand flexibility to achieve low EDR scores or ZNE
Can extreme energy efficiency regardless of cost achieve full ZNE (EDR of 0)?
• Even if we eliminate all heating, cooling, hot water, and IAQ loads, we’ll still end up with an EDR score of 25-30, the theoretical limit for efficiency EDR!
• That is because in most climate zones plug loads are now the dominant loads and they are unaffected by efficiency measures, extreme or not
• 2019 Standards efficiency EDRs are in the 43-48 range depending on the CZ
• “Practical” efficiency measures – without renewables and demand flexibility - can move the EDR score by no more than 7-9 points in severe CZs, less in milder CZs to ~34-41 range!
15
Calgreen Tiers and Target EDR Scores
• 2016 Standards have efficiency EDR scores in mid 50s in most CZs
• 2016 Calgreen has three tiers
• Tier 1 - 15% better than Part 6
• Tier 2 - 30% better than Part 6
• And a ZNE tier with EDR score of zero
• 2019 Standards final EDR scores including PVs are in mid 20s in most CZs
• No need (room) for three Calgreen tiers anymore; two tiers may be sufficient
• A tier 1 that will get halfway to EDR 0 established based on default battery controls and PV oversizing factor of ~ 1.3 or less
• A second tier with EDR score of zero established based on advanced battery controls and PV oversizing factor of ~ 1.4 or less
Builders may use a combination of PV, efficiency measures including higher appliances efficiencies, and demand flexibility measures to reach these target EDRs most cost effectively
Note for following slides: each EDR point is ~ 170 watts of PV, roughly about half a PV panel
16
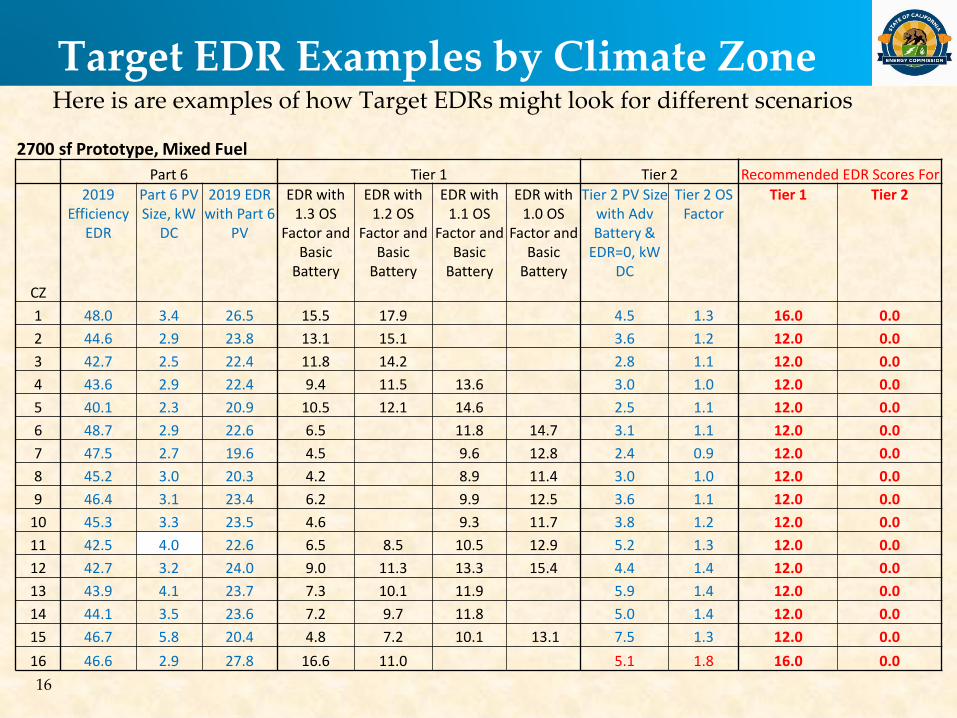
Target EDR Examples by Climate Zone Here is are examples of how Target EDRs might look for different scenarios
2700 sf Prototype, Mixed Fuel Part 6 Tier 1 Tier 2 Recommended EDR Scores For
CZ
2019 Efficiency
EDR
Part 6 PV Size, kW
DC
2019 EDR with Part 6
PV
EDR with 1.3 OS
Factor and Basic
Battery
EDR with 1.2 OS
Factor and Basic
Battery
EDR with 1.1 OS
Factor and Basic
Battery
EDR with 1.0 OS
Factor and Basic
Battery
Tier 2 PV Size with Adv Battery &
EDR=0, kW DC
Tier 2 OS Factor
Tier 1 Tier 2
1 48.0 3.4 26.5 15.5 17.9 4.5 1.3 16.0 0.0 2 44.6 2.9 23.8 13.1 15.1 3.6 1.2 12.0 0.0 3 42.7 2.5 22.4 11.8 14.2 2.8 1.1 12.0 0.0 4 43.6 2.9 22.4 9.4 11.5 13.6 3.0 1.0 12.0 0.0 5 40.1 2.3 20.9 10.5 12.1 14.6 2.5 1.1 12.0 0.0 6 48.7 2.9 22.6 6.5 11.8 14.7 3.1 1.1 12.0 0.0 7 47.5 2.7 19.6 4.5 9.6 12.8 2.4 0.9 12.0 0.0 8 45.2 3.0 20.3 4.2 8.9 11.4 3.0 1.0 12.0 0.0 9 46.4 3.1 23.4 6.2 9.9 12.5 3.6 1.1 12.0 0.0
10 45.3 3.3 23.5 4.6 9.3 11.7 3.8 1.2 12.0 0.0 11 42.5 4.0 22.6 6.5 8.5 10.5 12.9 5.2 1.3 12.0 0.0 12 42.7 3.2 24.0 9.0 11.3 13.3 15.4 4.4 1.4 12.0 0.0 13 43.9 4.1 23.7 7.3 10.1 11.9 5.9 1.4 12.0 0.0 14 44.1 3.5 23.6 7.2 9.7 11.8 5.0 1.4 12.0 0.0 15 46.7 5.8 20.4 4.8 7.2 10.1 13.1 7.5 1.3 12.0 0.0 16 46.6 2.9 27.8 16.6 11.0 5.1 1.8 16.0 0.0

17
Target EDR Examples by Climate Zone Here is are examples of how Target EDRs might look for different scenarios
2100 sf Prototype, Mixed Fuel Part 6 Tier 1 Tier 2 Recommended EDR Scores For
CZ
2019 Efficiency
EDR
Part 6 PV Size, kW
DC
2019 EDR with Part 6
PV
EDR with 1.3 OS
Factor and Basic
Battery
EDR with 1.2 OS
Factor and Basic
Battery
EDR with 1.1 OS
Factor and Basic
Battery
EDR with 1.0 OS
Factor and Basic
Battery
Tier 2 PV Size with Adv Battery &
EDR=0, kW DC
Tier 2 OS Factor
Tier 1 Tier 2
3 47.7 2.2 25.0 13.7 16.4 20.1 2.4 1.1 12.0 0.0
7 49.5 2.3 20.7 7.8 11.6 14.1 2.0 0.9 12.0 0.0
10 46.9 2.7 24.5 9.8 12.6 2.7 1.0 12.0 0.0
12 45.0 2.7 25.3 10.5 12.5 3.2 1.2 12.0 0.0
13 46.6 3.5 25.6 6.1 8.8 11.2 15.0 4.4 1.3 12.0 0.0
15 49.9 5.2 21.8 0.6 7.4 10.8 6.1 1.2 12.0 0.0
16 49.3 2.3 30.2 16.9 4.1 1.8 16.0 0.0
18
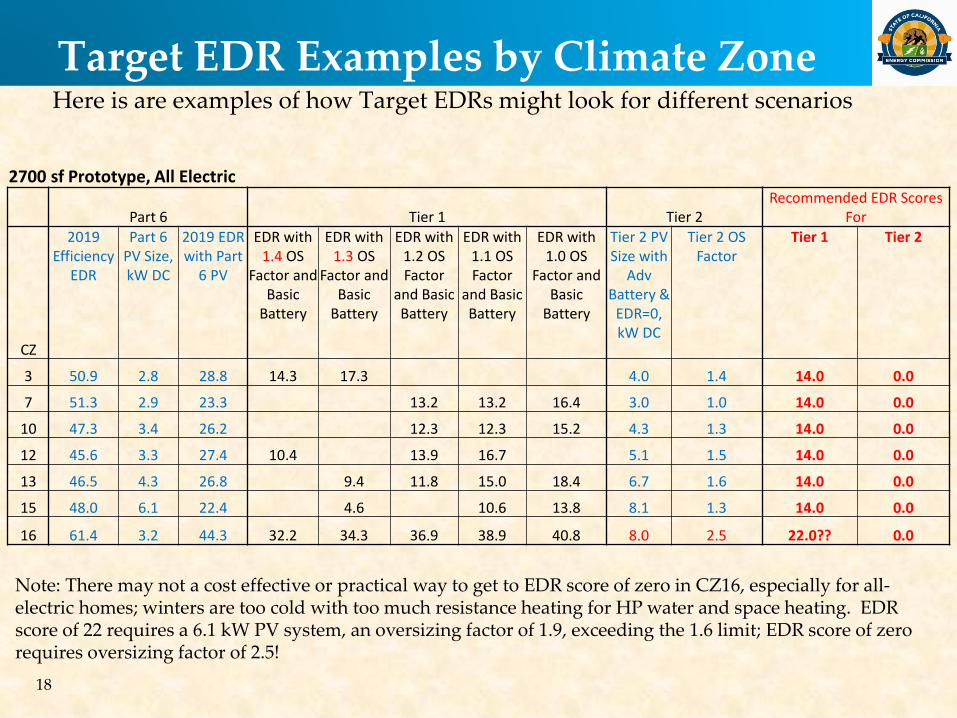
Target EDR Examples by Climate Zone Here is are examples of how Target EDRs might look for different scenarios
2700 sf Prototype, All Electric
Part 6 Tier 1 Tier 2 Recommended EDR Scores
For
CZ
2019 Efficiency
EDR
Part 6 PV Size, kW DC
2019 EDR with Part
6 PV
EDR with 1.4 OS
Factor and Basic
Battery
EDR with 1.3 OS
Factor and Basic
Battery
EDR with 1.2 OS Factor
and Basic Battery
EDR with 1.1 OS Factor
and Basic Battery
EDR with 1.0 OS
Factor and Basic
Battery
Tier 2 PV Size with
Adv Battery &
EDR=0, kW DC
Tier 2 OS Factor
Tier 1 Tier 2
3 50.9 2.8 28.8 14.3 17.3 4.0 1.4 14.0 0.0
7 51.3 2.9 23.3 13.2 13.2 16.4 3.0 1.0 14.0 0.0
10 47.3 3.4 26.2 12.3 12.3 15.2 4.3 1.3 14.0 0.0
12 45.6 3.3 27.4 10.4 13.9 16.7 5.1 1.5 14.0 0.0
13 46.5 4.3 26.8 9.4 11.8 15.0 18.4 6.7 1.6 14.0 0.0
15 48.0 6.1 22.4 4.6 10.6 13.8 8.1 1.3 14.0 0.0
16 61.4 3.2 44.3 32.2 34.3 36.9 38.9 40.8 8.0 2.5 22.0?? 0.0
Note: There may not a cost effective or practical way to get to EDR score of zero in CZ16, especially for all-electric homes; winters are too cold with too much resistance heating for HP water and space heating. EDR score of 22 requires a 6.1 kW PV system, an oversizing factor of 1.9, exceeding the 1.6 limit; EDR score of zero requires oversizing factor of 2.5!
19
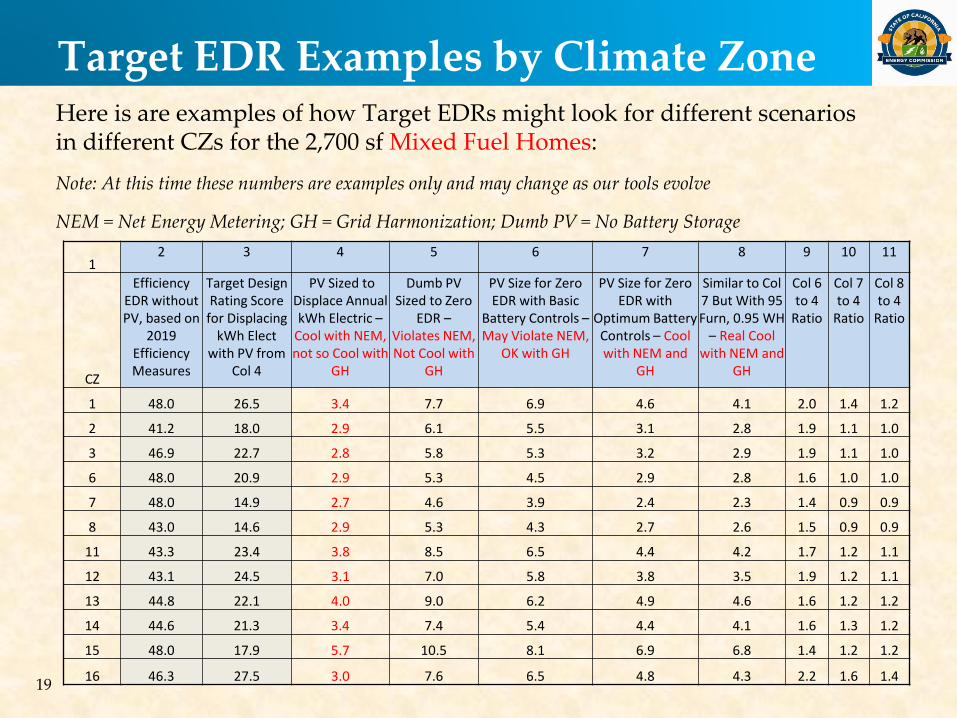
Target EDR Examples by Climate Zone Here is are examples of how Target EDRs might look for different scenarios in different CZs for the 2,700 sf Mixed Fuel Homes: Note: At this time these numbers are examples only and may change as our tools evolve
NEM = Net Energy Metering; GH = Grid Harmonization; Dumb PV = No Battery Storage
1 2 3 4 5 6 7 8 9 10 11
CZ
Efficiency EDR without PV, based on
2019 Efficiency Measures
Target Design Rating Score
for Displacing kWh Elect
with PV from Col 4
PV Sized to Displace Annual kWh Electric –
Cool with NEM, not so Cool with
GH
Dumb PV Sized to Zero
EDR – Violates NEM, Not Cool with
GH
PV Size for Zero EDR with Basic
Battery Controls – May Violate NEM,
OK with GH
PV Size for Zero EDR with
Optimum Battery Controls – Cool with NEM and
GH
Similar to Col 7 But With 95 Furn, 0.95 WH
– Real Cool with NEM and
GH
Col 6 to 4
Ratio
Col 7 to 4
Ratio
Col 8 to 4
Ratio
1 48.0 26.5 3.4 7.7 6.9 4.6 4.1 2.0 1.4 1.2
2 41.2 18.0 2.9 6.1 5.5 3.1 2.8 1.9 1.1 1.0
3 46.9 22.7 2.8 5.8 5.3 3.2 2.9 1.9 1.1 1.0
6 48.0 20.9 2.9 5.3 4.5 2.9 2.8 1.6 1.0 1.0
7 48.0 14.9 2.7 4.6 3.9 2.4 2.3 1.4 0.9 0.9
8 43.0 14.6 2.9 5.3 4.3 2.7 2.6 1.5 0.9 0.9
11 43.3 23.4 3.8 8.5 6.5 4.4 4.2 1.7 1.2 1.1
12 43.1 24.5 3.1 7.0 5.8 3.8 3.5 1.9 1.2 1.1
13 44.8 22.1 4.0 9.0 6.2 4.9 4.6 1.6 1.2 1.2
14 44.6 21.3 3.4 7.4 5.4 4.4 4.1 1.6 1.3 1.2
15 48.0 17.9 5.7 10.5 8.1 6.9 6.8 1.4 1.2 1.2
16 46.3 27.5 3.0 7.6 6.5 4.8 4.3 2.2 1.6 1.4
20
2. Software Tools The CBECC-Res Compliance Software May Be Used For:
• Part 6 Compliance, and
• Part 11 (CALGreen, Reach Codes, etc)
The Software can be used to:
• Size PV for Part 6 compliance or lower target EDRs for Reach Codes
• Assess the impact of battery storage on lowering EDR
• Assess the impact of precooling and other DR strategies on lowering EDR
• Assess the impact of HPWH DR on lowering EDR
• And other options
21
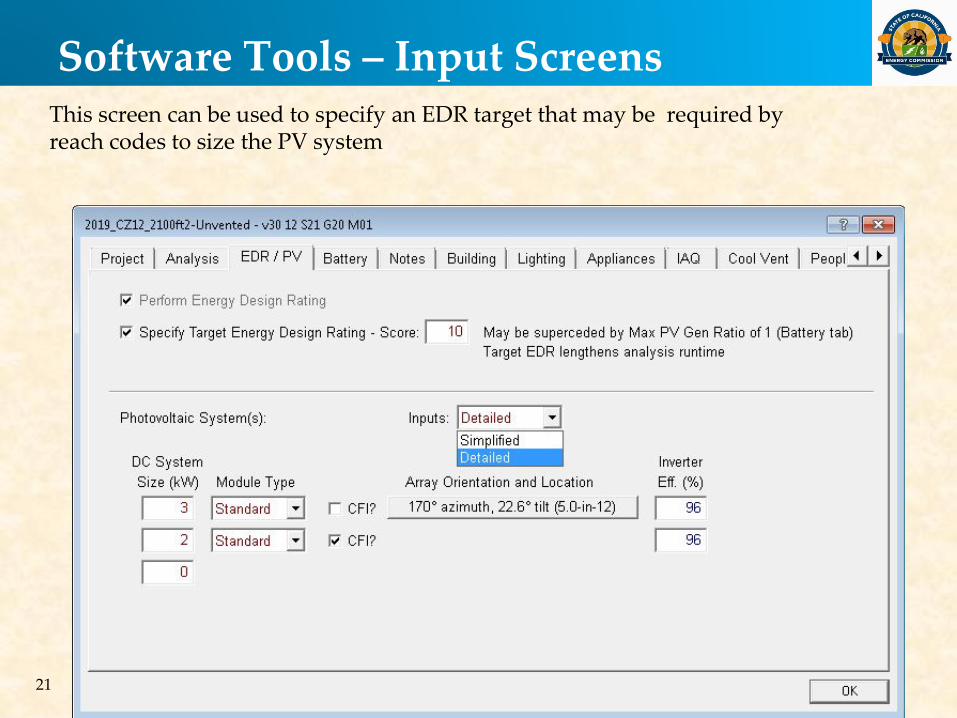
Software Tools – Input Screens
This screen can be used to specify an EDR target that may be required by reach codes to size the PV system
22
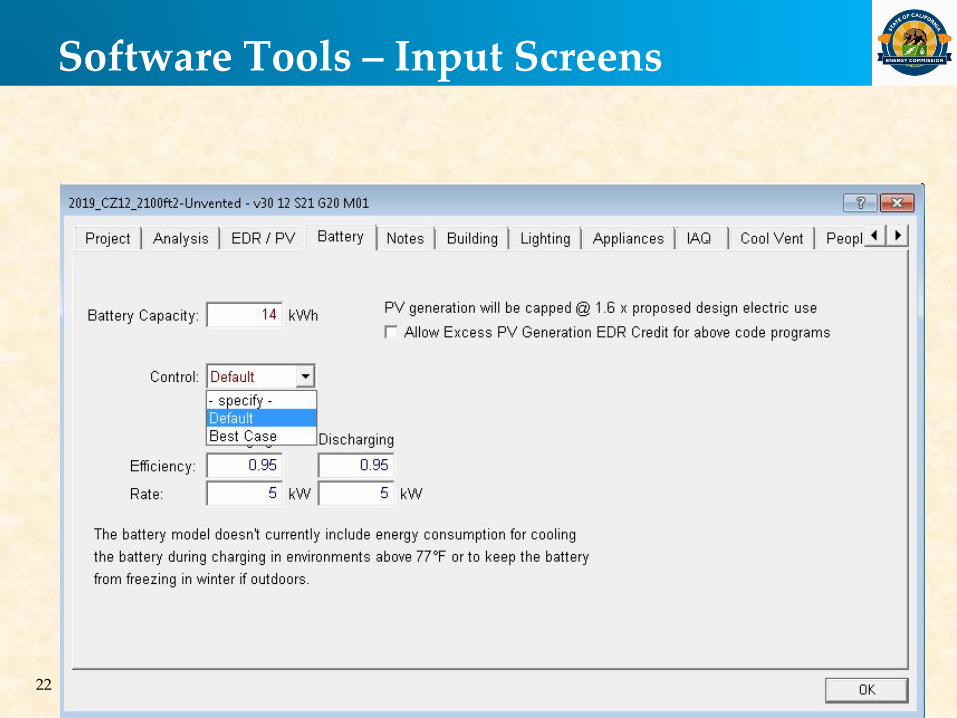
Software Tools – Input Screens
23
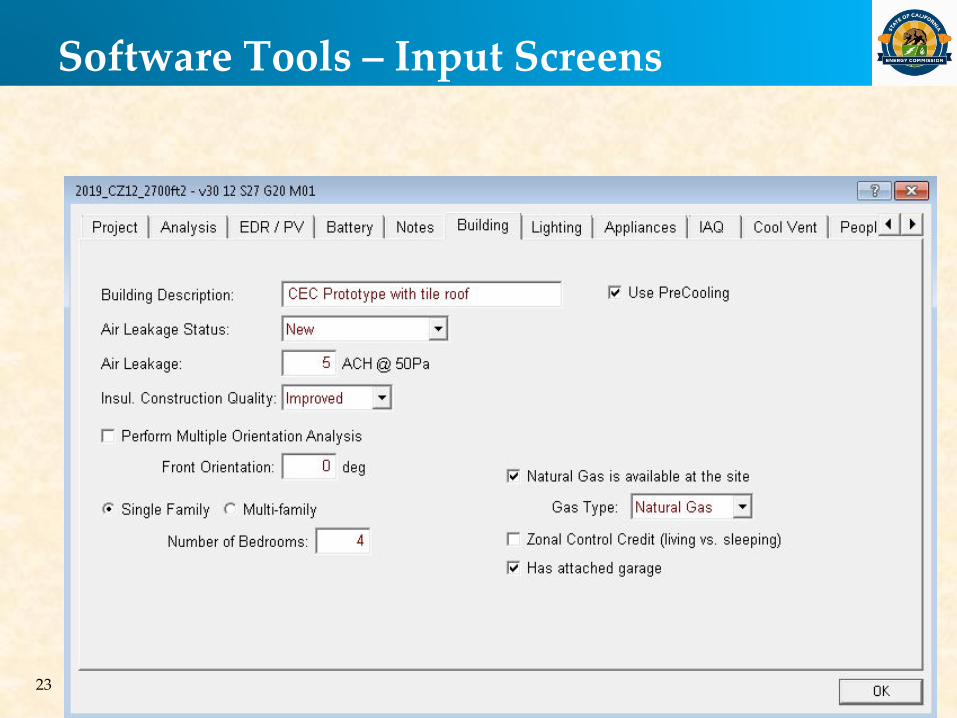
Software Tools – Input Screens

24
Software Tools – Results Screens
For Compliance for Part 6 and Part 11
25
Software Tools – Results Screens
Compliance Pass/Fail

26
Questions?
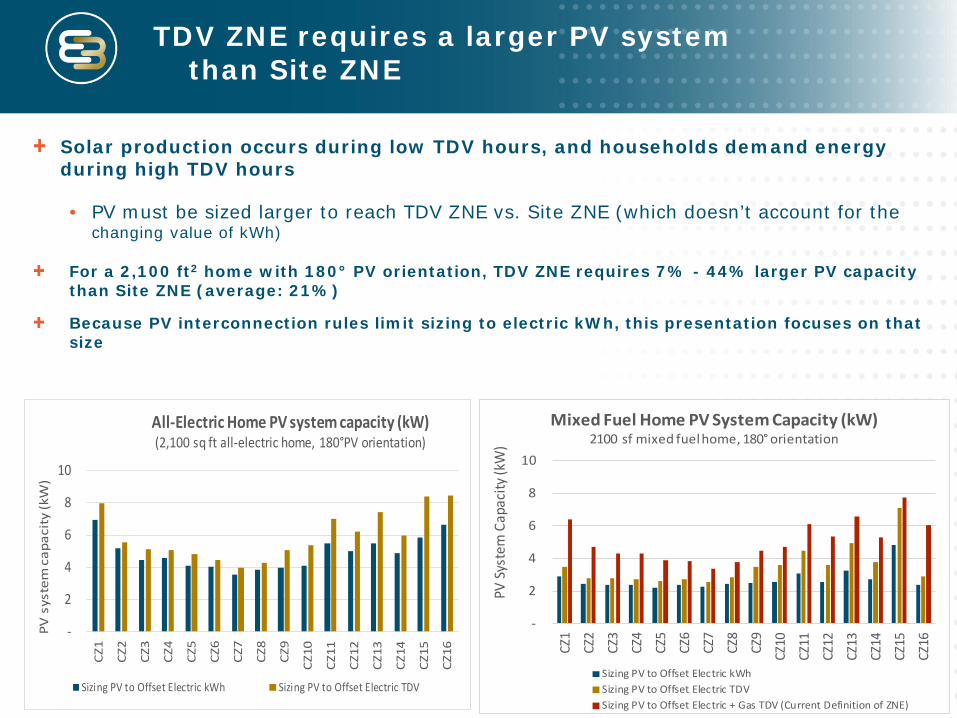
Solar production occurs during low TDV hours, and households demand energy during high TDV hours
• PV must be sized larger to reach TDV ZNE vs. Site ZNE (which doesn’t account for the changing value of kWh)
For a 2,100 ft2 home with 180° PV orientation, TDV ZNE requires 7% - 44% larger PV capacity than Site ZNE (average: 21%)
Because PV interconnection rules limit sizing to electric kWh, this presentation focuses on that size
TDV ZNE requires a larger PV system than Site ZNE
27
-
2
4
6
8
10
CZ1
CZ2
CZ3
CZ4
CZ5
CZ6
CZ7
CZ8
CZ9
CZ10
CZ11
CZ12
CZ13
CZ14
CZ15
CZ16
PV S
yste
m C
apac
ity (k
W)
Mixed Fuel Home PV System Capacity (kW)2100 sf mixed fuel home, 180° orientation
Sizing PV to Offset Electric kWhSizing PV to Offset Electric TDVSizing PV to Offset Electric + Gas TDV (Current Definition of ZNE)
-
2
4
6
8
10
CZ1
CZ2
CZ3
CZ4
CZ5
CZ6
CZ7
CZ8
CZ9
CZ10
CZ11
CZ12
CZ13
CZ14
CZ15
CZ16
PV s
yste
m c
apac
ity
(kW
)
All-Electric Home PV system capacity (kW)(2,100 sq ft all-electric home, 180°PV orientation)
Sizing PV to Offset Electric kWh Sizing PV to Offset Electric TDV
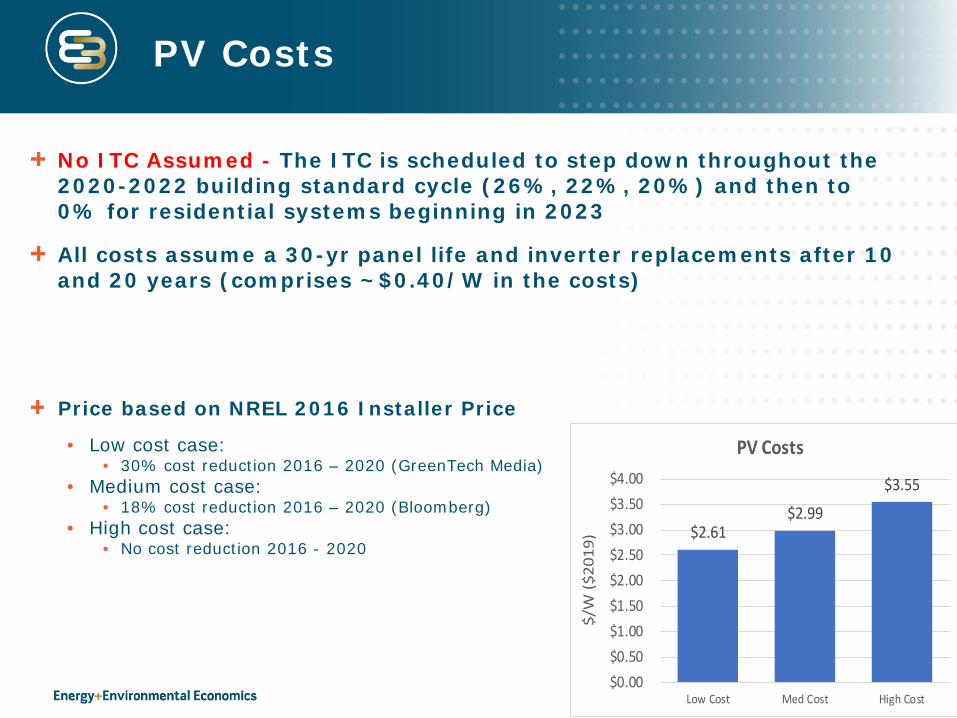
PV Costs
No ITC Assumed - The ITC is scheduled to step down throughout the 2020-2022 building standard cycle (26%, 22%, 20%) and then to 0% for residential systems beginning in 2023
All costs assume a 30-yr panel life and inverter replacements after 10 and 20 years (comprises ~$0.40/W in the costs)
$2.61 $2.99
$3.55
$0.00$0.50$1.00$1.50$2.00$2.50$3.00$3.50$4.00
Low Cost Med Cost High Cost
$/W
($2
019)
PV Costs
Price based on NREL 2016 Installer Price
• Low cost case: • 30% cost reduction 2016 – 2020 (GreenTech Media)
• Medium cost case: • 18% cost reduction 2016 – 2020 (Bloomberg)
• High cost case: • No cost reduction 2016 - 2020
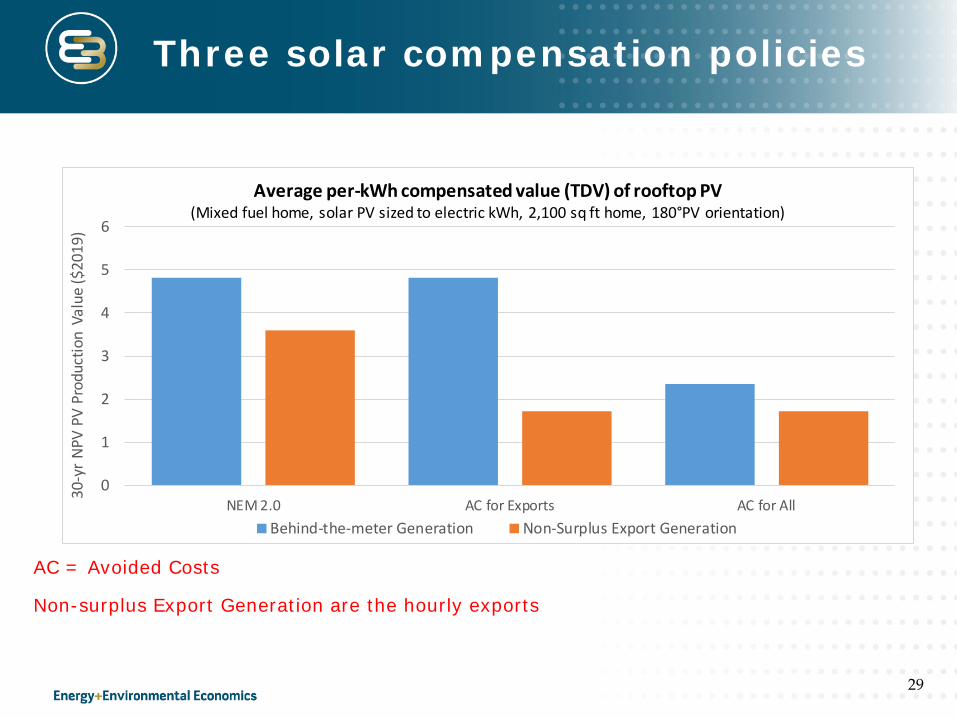
Three solar compensation policies
29
0
1
2
3
4
5
6
NEM 2.0 AC for Exports AC for All
30-y
r NPV
PV
Prod
uctio
n Va
lue
($20
19)
Average per-kWh compensated value (TDV) of rooftop PV(Mixed fuel home, solar PV sized to electric kWh, 2,100 sq ft home, 180°PV orientation)
Behind-the-meter Generation Non-Surplus Export Generation
AC = Avoided Costs
Non-surplus Export Generation are the hourly exports
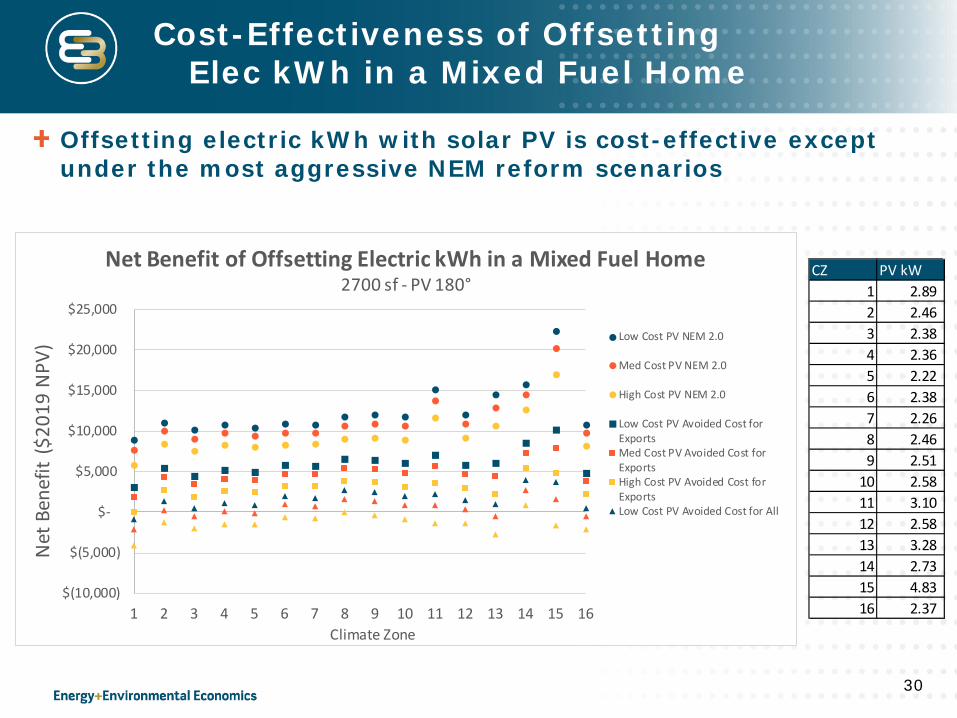
Offsetting electric kWh with solar PV is cost-effective except under the most aggressive NEM reform scenarios
Cost-Effectiveness of Offsetting Elec kWh in a Mixed Fuel Home
30
CZ PV kW1 2.89 2 2.46 3 2.38 4 2.36 5 2.22 6 2.38 7 2.26 8 2.46 9 2.51
10 2.58 11 3.10 12 2.58 13 3.28 14 2.73 15 4.83 16 2.37
$(10,000)
$(5,000)
$-
$5,000
$10,000
$15,000
$20,000
$25,000
1 2 3 4 5 6 7 8 9 10 11 12 13 14 15 16
Net
Ben
efit
($20
19 N
PV)
Climate Zone
Net Benefit of Offsetting Electric kWh in a Mixed Fuel Home2700 sf - PV 180°
Low Cost PV NEM 2.0
Med Cost PV NEM 2.0
High Cost PV NEM 2.0
Low Cost PV Avoided Cost forExportsMed Cost PV Avoided Cost forExportsHigh Cost PV Avoided Cost forExportsLow Cost PV Avoided Cost for All
3 - Strategies for Reach Codes
NEM Rules and Oversizing PV –
DRAFT
March 2, 2017
Snuller Price, Zachary Ming, Brian Conlon
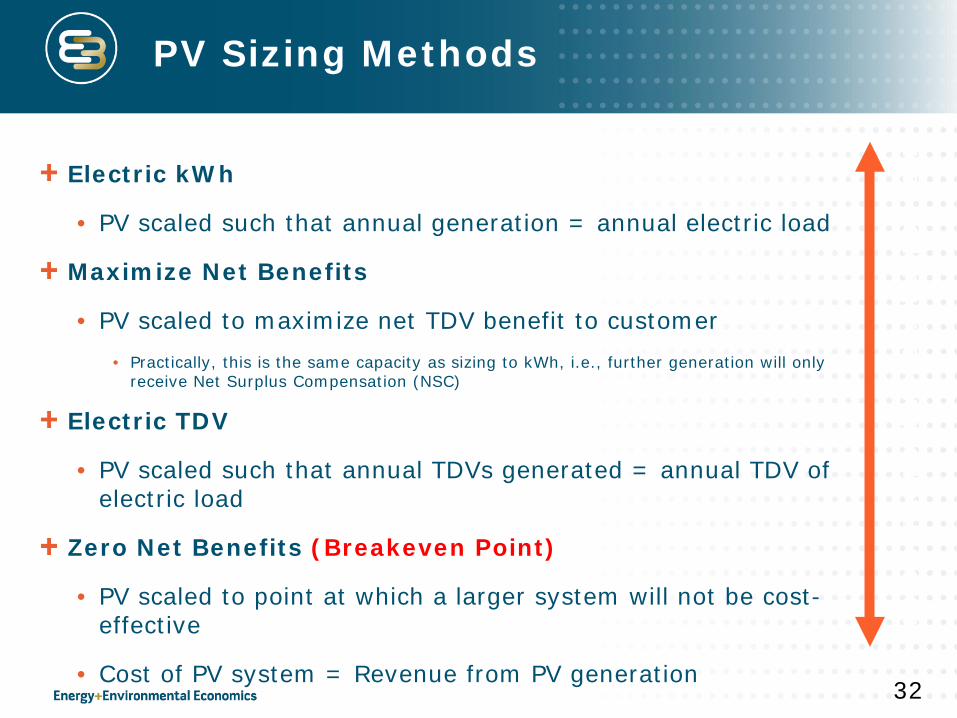
PV Sizing Methods
Electric kWh
• PV scaled such that annual generation = annual electric load
Maximize Net Benefits
• PV scaled to maximize net TDV benefit to customer • Practically, this is the same capacity as sizing to kWh, i.e., further generation will only
receive Net Surplus Compensation (NSC)
Electric TDV
• PV scaled such that annual TDVs generated = annual TDV of electric load
Zero Net Benefits (Breakeven Point)
• PV scaled to point at which a larger system will not be cost-effective
• Cost of PV system = Revenue from PV generation 32
Sizes no longer follow predictable order
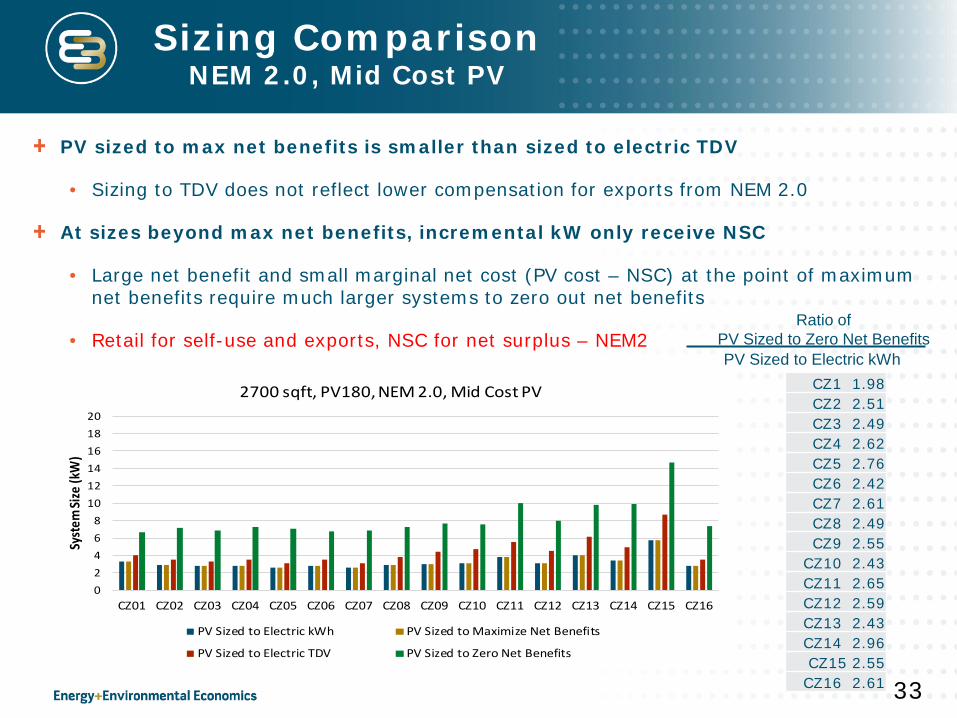
02468
101214161820
CZ01 CZ02 CZ03 CZ04 CZ05 CZ06 CZ07 CZ08 CZ09 CZ10 CZ11 CZ12 CZ13 CZ14 CZ15 CZ16
Syst
em Si
ze (k
W)
2700 sqft, PV180, NEM 2.0, Mid Cost PV
PV Sized to Electric kWh PV Sized to Maximize Net Benefits
PV Sized to Electric TDV PV Sized to Zero Net Benefits
CZ1 1.98 CZ2 2.51 CZ3 2.49 CZ4 2.62 CZ5 2.76 CZ6 2.42 CZ7 2.61 CZ8 2.49 CZ9 2.55
CZ10 2.43 CZ11 2.65 CZ12 2.59 CZ13 2.43 CZ14 2.96 CZ15 2.55 CZ16 2.61
PV sized to max net benefits is smaller than sized to electric TDV
• Sizing to TDV does not reflect lower compensation for exports from NEM 2.0
At sizes beyond max net benefits, incremental kW only receive NSC
• Large net benefit and small marginal net cost (PV cost – NSC) at the point of maximum net benefits require much larger systems to zero out net benefits
• Retail for self-use and exports, NSC for net surplus – NEM2
Sizing Comparison NEM 2.0, Mid Cost PV
33
Ratio of PV Sized to Zero Net Benefits PV Sized to Electric kWh
02468
101214161820
CZ01 CZ02 CZ03 CZ04 CZ05 CZ06 CZ07 CZ08 CZ09 CZ10 CZ11 CZ12 CZ13 CZ14 CZ15 CZ16
Syst
em Si
ze (k
W)
2700 sqft, PV180, Avoided Cost for Exported Energy, Mid Cost PV
PV Sized to Electric kWh PV Sized to Maximize Net Benefits
PV Sized to Electric TDV PV Sized to Zero Net Benefits
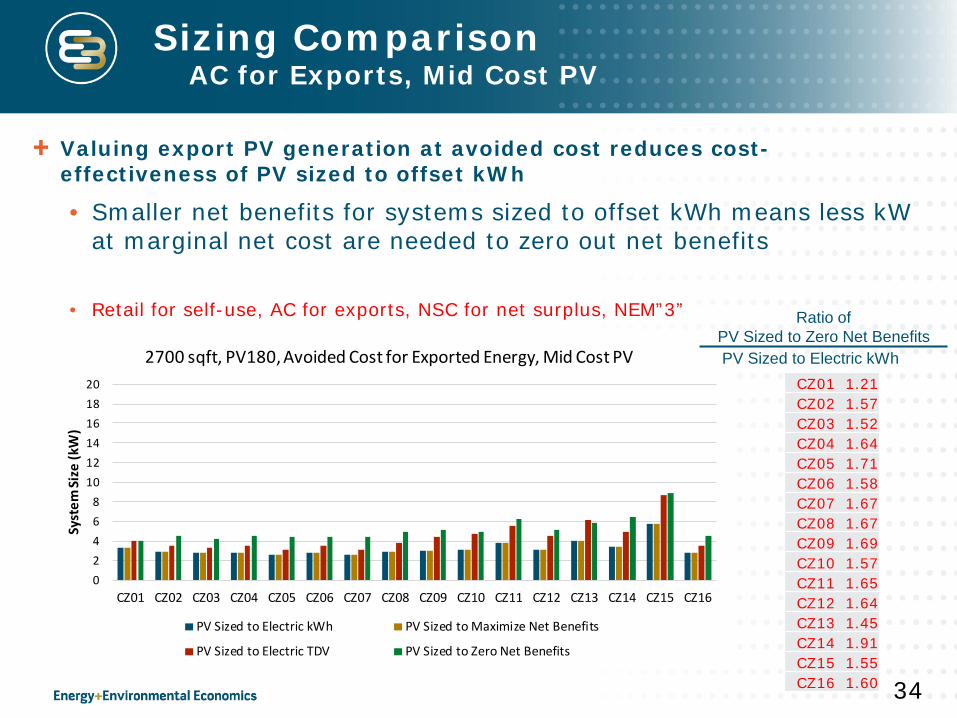
CZ01 1.21 CZ02 1.57 CZ03 1.52 CZ04 1.64 CZ05 1.71 CZ06 1.58 CZ07 1.67 CZ08 1.67 CZ09 1.69 CZ10 1.57 CZ11 1.65 CZ12 1.64 CZ13 1.45 CZ14 1.91 CZ15 1.55 CZ16 1.60
Valuing export PV generation at avoided cost reduces cost-effectiveness of PV sized to offset kWh
• Smaller net benefits for systems sized to offset kWh means less kW at marginal net cost are needed to zero out net benefits
• Retail for self-use, AC for exports, NSC for net surplus, NEM”3”
Sizing Comparison AC for Exports, Mid Cost PV
34
Ratio of PV Sized to Zero Net Benefits PV Sized to Electric kWh
- 2 4 6 8
10 12 14 16 18 20
CZ01 CZ02 CZ03 CZ04 CZ05 CZ06 CZ07 CZ08 CZ09 CZ10 CZ11 CZ12 CZ13 CZ14 CZ15 CZ16
Syst
em Si
ze (k
W)
2700 sqft, PV180, BTM TDV, Mid Cost PV
PV Sized to Electric kWh PV Sized to Maximize Net Benefits
PV Sized to Electric TDV PV Sized to Zero Net Benefits
Sizing Comparison BTM TDV, Mid Cost PV
35
Ratio of PV Sized to Zero Net Benefits
PV Sized to Electric kWh
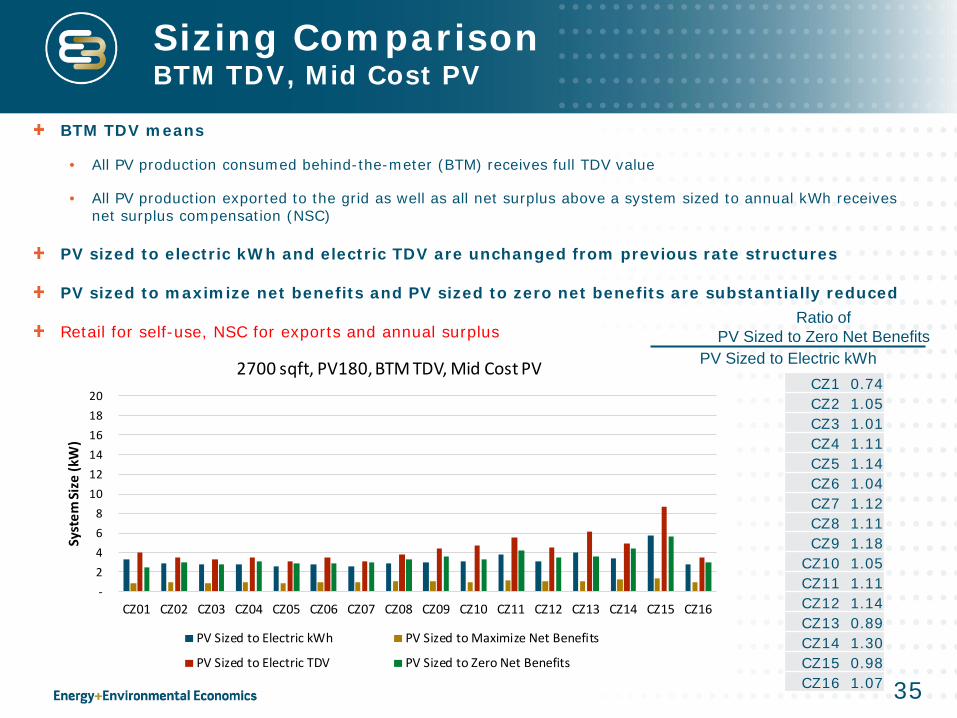
BTM TDV means
• All PV production consumed behind-the-meter (BTM) receives full TDV value
• All PV production exported to the grid as well as all net surplus above a system sized to annual kWh receives net surplus compensation (NSC)
PV sized to electric kWh and electric TDV are unchanged from previous rate structures
PV sized to maximize net benefits and PV sized to zero net benefits are substantially reduced
Retail for self-use, NSC for exports and annual surplus
CZ1 0.74 CZ2 1.05 CZ3 1.01 CZ4 1.11 CZ5 1.14 CZ6 1.04 CZ7 1.12 CZ8 1.11 CZ9 1.18
CZ10 1.05 CZ11 1.11 CZ12 1.14 CZ13 0.89 CZ14 1.30 CZ15 0.98 CZ16 1.07
Storage Overview
E3 analyzed the additional value of a battery storage system to an existing PV system of a 2700 sf, mixed fuel home
BTM TDV rate scenario
• BTM generation receives full TDV value (~$0.20/kWh); exported generation receives net surplus compensation value (~$0.03/kWh)
Battery assumptions
• 14 kWh
• 5 kW
• 90% round trip efficiency
• $500/kWh fully installed
36
02468
101214161820
CZ01 CZ02 CZ03 CZ04 CZ05 CZ06 CZ07 CZ08 CZ09 CZ10 CZ11 CZ12 CZ13 CZ14 CZ15 CZ16
Syst
em Si
ze (k
W)
2700 sqft, PV180, BTM TDV, Mid Cost PV
PV Sized to Electric kWh PV Sized to Maximize Net Benefits
PV Sized to Electric TDV PV Sized to Zero Net Benefits
Sizing Comparison BTM TDV With Storage, Mid Cost PV
Ratio of PV Sized to Zero Net Benefits
PV Sized to Electric kWh
37
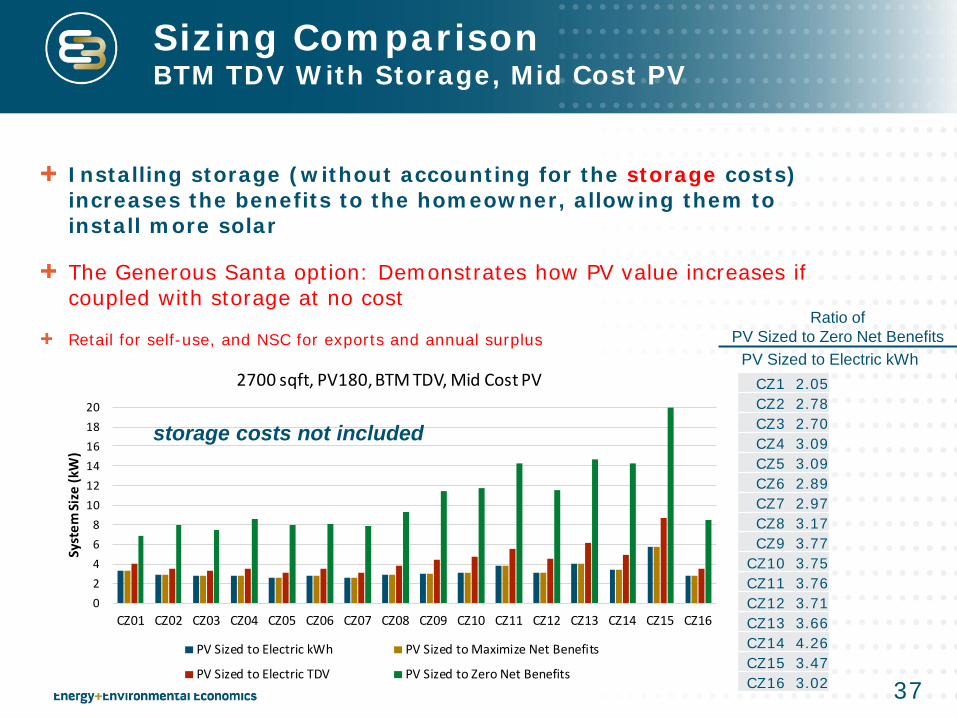
Installing storage (without accounting for the storage costs) increases the benefits to the homeowner, allowing them to install more solar
The Generous Santa option: Demonstrates how PV value increases if coupled with storage at no cost
Retail for self-use, and NSC for exports and annual surplus
CZ1 2.05 CZ2 2.78 CZ3 2.70 CZ4 3.09 CZ5 3.09 CZ6 2.89 CZ7 2.97 CZ8 3.17 CZ9 3.77
CZ10 3.75 CZ11 3.76 CZ12 3.71 CZ13 3.66 CZ14 4.26 CZ15 3.47 CZ16 3.02
storage costs not included
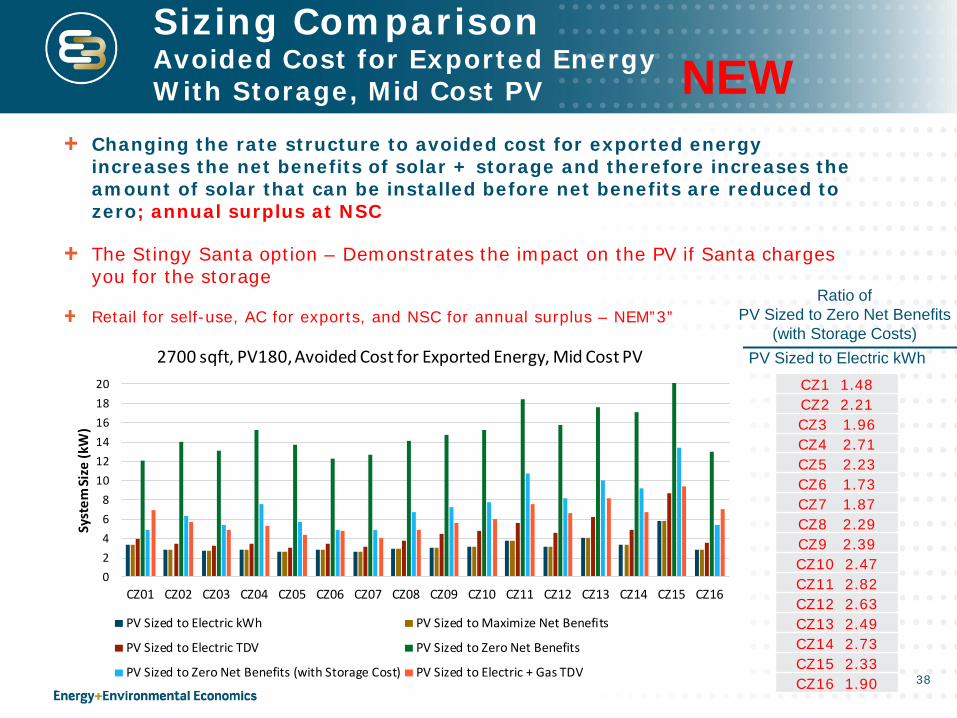
Sizing Comparison Avoided Cost for Exported Energy With Storage, Mid Cost PV
CZ1 1.48 CZ2 2.21 CZ3 1.96 CZ4 2.71 CZ5 2.23 CZ6 1.73 CZ7 1.87 CZ8 2.29 CZ9 2.39 CZ10 2.47 CZ11 2.82 CZ12 2.63 CZ13 2.49 CZ14 2.73 CZ15 2.33 CZ16 1.90 38
Changing the rate structure to avoided cost for exported energy increases the net benefits of solar + storage and therefore increases the amount of solar that can be installed before net benefits are reduced to zero; annual surplus at NSC
The Stingy Santa option – Demonstrates the impact on the PV if Santa charges you for the storage
Retail for self-use, AC for exports, and NSC for annual surplus – NEM”3”
NEW
Ratio of PV Sized to Zero Net Benefits
(with Storage Costs) PV Sized to Electric kWh
02468
101214161820
CZ01 CZ02 CZ03 CZ04 CZ05 CZ06 CZ07 CZ08 CZ09 CZ10 CZ11 CZ12 CZ13 CZ14 CZ15 CZ16
Syst
em Si
ze (k
W)
2700 sqft, PV180, Avoided Cost for Exported Energy, Mid Cost PV
PV Sized to Electric kWh PV Sized to Maximize Net Benefits
PV Sized to Electric TDV PV Sized to Zero Net Benefits
PV Sized to Zero Net Benefits (with Storage Cost) PV Sized to Electric + Gas TDV
$0.00
$0.05
$0.10
$0.15
$0.20
$0.25
$0.30
1 2 3 4 5 6 7 8 9 10 11 12 13 14 15 16
Brea
keve
n Re
tail
Rate
($20
20 re
al le
veliz
ed)
Climate Zone
39
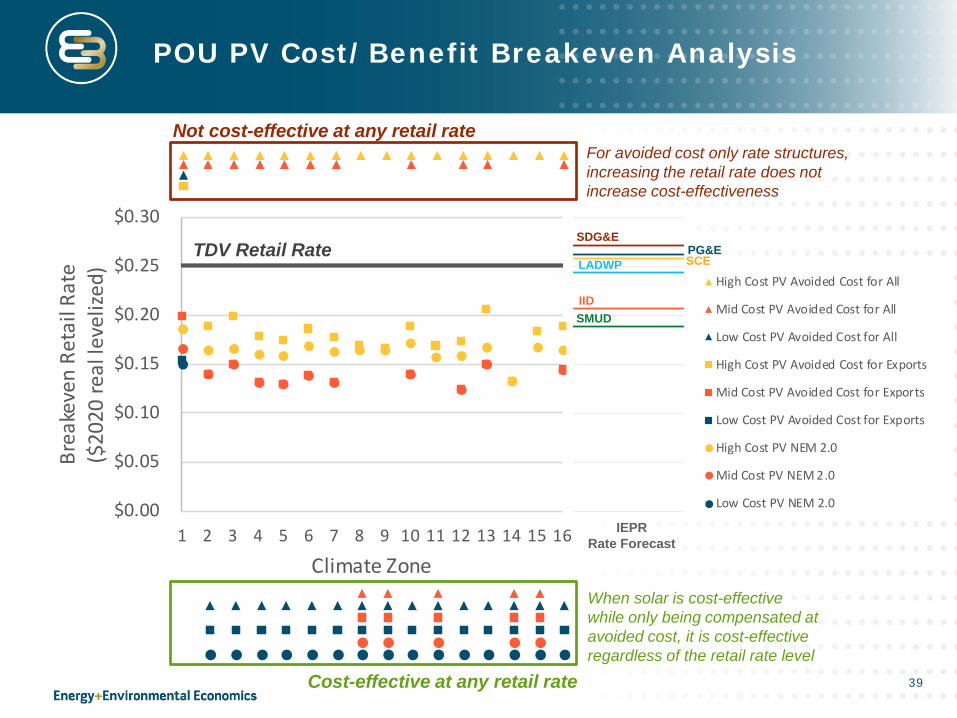
POU PV Cost/Benefit Breakeven Analysis
TDV Retail Rate
Not cost-effective at any retail rate
Cost-effective at any retail rate
For avoided cost only rate structures, increasing the retail rate does not increase cost-effectiveness
When solar is cost-effective while only being compensated at avoided cost, it is cost-effective regardless of the retail rate level
High Cost PV Avoided Cost for All
Mid Cost PV Avoided Cost for All
Low Cost PV Avoided Cost for All
High Cost PV Avoided Cost for Exports
Mid Cost PV Avoided Cost for Exports
Low Cost PV Avoided Cost for Exports
High Cost PV NEM 2.0
Mid Cost PV NEM 2.0
Low Cost PV NEM 2.0
SDG&E PG&E SCE LADWP
IID SMUD
IEPR Rate Forecast
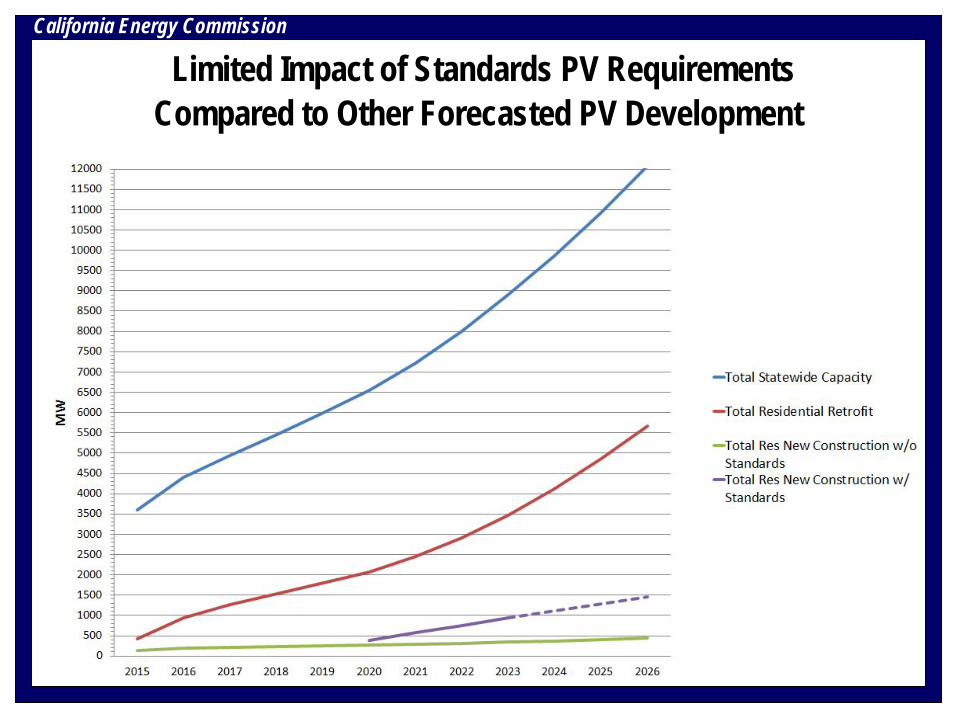
California Energy Commission
Limited Impact of Standards PV Requirements Compared to Other Forecasted PV Development
Recommended