DI
SC
US
SI
ON
P
AP
ER
S
ER
IE
S
Forschungsinstitut zur Zukunft der ArbeitInstitute for the Study of Labor
Does Corporate Governance Reform Necessarily Boost Firm Performance? Recent Evidence from Russia
IZA DP No. 6519
April 2012
Mihails KuznecovsSarmistha Pal
Does Corporate Governance Reform
Necessarily Boost Firm Performance? Recent Evidence from Russia
Mihails Kuznecovs Brunel University
Sarmistha Pal University of Surrey
and IZA
Discussion Paper No. 6519 April 2012
IZA
P.O. Box 7240 53072 Bonn
Germany
Phone: +49-228-3894-0 Fax: +49-228-3894-180
E-mail: [email protected]
Any opinions expressed here are those of the author(s) and not those of IZA. Research published in this series may include views on policy, but the institute itself takes no institutional policy positions. The Institute for the Study of Labor (IZA) in Bonn is a local and virtual international research center and a place of communication between science, politics and business. IZA is an independent nonprofit organization supported by Deutsche Post Foundation. The center is associated with the University of Bonn and offers a stimulating research environment through its international network, workshops and conferences, data service, project support, research visits and doctoral program. IZA engages in (i) original and internationally competitive research in all fields of labor economics, (ii) development of policy concepts, and (iii) dissemination of research results and concepts to the interested public. IZA Discussion Papers often represent preliminary work and are circulated to encourage discussion. Citation of such a paper should account for its provisional character. A revised version may be available directly from the author.
IZA Discussion Paper No. 6519 April 2012
ABSTRACT
Does Corporate Governance Reform Necessarily Boost Firm Performance? Recent Evidence from Russia*
This paper examines whether the introduction of corporate governance (CG) reforms in general and that of transparency and disclosure (T&D) rules in particular can necessarily boost firm performance. Existing literature suggests that CG reforms can boost performance because it can resolve the conflict of interest between the controlling and the minority owners, especially in societies with highly skewed distribution of ownership. We however argue that the success of CG reform would, in addition, depend on whether the reforms may initiate further conflict, e.g., that between the state and the controlling owners. Using recent data from Russia for 2000-2008, we find that the introduction of corporate governance codes in Russia had limited success to improve indices of firm performance in our sample. We argue that this arises from the predatory behavior of the central and local governments: greater transparency make businesses easy targets for aggressive tax enforcement policy by the central government while the decentralized local governments may increase the bribe price to protect businesses from high central taxes, which may also induce some businesses to go underground, thus harming firm performance. JEL Classification: G3, K2, P2 Keywords: corporate governance reform, transparency and disclosure rules, conflict
between state and the controlling owner, taxation and fiscal decentralisation, firm performance, predatory state, Tobin’s Q, Russia
Corresponding author: Sarmistha Pal Faculty of Business, Economics and Law University of Surrey Guildford GU2 7XH United Kingdom E-mail: [email protected]
* Mihails Kuznecovs would like to thank Renewable Energy Systems Ltd. for funding this research. We are much grateful to Sergei Guriev not only for helping us locate the Standard & Poor (S&P) data on Transparency and Disclosure in Russia, but also constructive feedback on an earlier draft of the paper and S&P’s governance services team for sharing the data with us. We would also like to thank Economics and Finance seminar participants at Brunel University for feedback on an earlier draft of the paper. The usual disclaimer applies.
2
1. Introduction
Existing research suggests that the financial markets are more likely to benefit from external
investment if investors enjoy robust legal protection. Both equity and debt investments attract
higher prices when corporate governance laws protect the investors against the expropriation by
controlling owners. By limiting expropriation by controlling owners, especially when ownership
distribution is highly skewed, corporate governance laws may encourage external financing of
corporate investment and hence firm performance and growth. The question is whether this
perceived link between the introduction of corporate governance (CG) codes and firm
performance will necessarily hold always. The present paper tests the validity of this hypothesis
by considering large listed corporations in Russia, a country which introduced the corporate
governance codes in 2002 (and was made effective from 2004 onwards) amidst a series of other
reforms in a radical bid to boost the ailing economy under President Putin.
Russia is a special case in point. Many Russian firms remain family-controlled and
highly concentrated leading to large scale expropriation of small investors including minority
shareholders and creditors. Consequently, Russian firms often face difficulties securing external
funds and are therefore forced to finance most investment internally (Blasi and Shleifer, 1996).
Until 2002, Russia had no recognised accounting standards or other official CG mechanism
capable of insuring the type of corporate integrity within companies that stimulates investment
incentives and financial markets. Low protection of property rights remained a preferred policy
of the rich in a country plagued with a very high degree of income inequality. The result was
significant undervaluation of Russian firms, which necessitated the introduction of better
corporate governance to induce external investors. After years of expropriations of minority
shareholders and fierce battles for assets, Russian oligarchs finally began to understand that the
only way to sustain the development of its companies is by attracting external funds. When Mr.
Putin succeeded Mr. Yeltsin in March 2000, his goal was to reassert Kremlin control over a
chaotic, cash-strapped state. First, there was a radical tax reform in 2001 that strengthened tax
administration and enforcement by the centralized state (Desai, Dyck and Zingales, 2007).1 Next,
Russia quickly caught up with the West in adjusting their company and bankruptcy laws to
Western standards and introduced the corporate governance codes in 2002. However, law
enforcement remains poor (Pistor et al., 2000), primarily due to widespread corruption in courts,
1The distinctive feature of the tax reforms of 2001 has been the significant emphasis placed on compliance with tax
laws and also to introduce changes in administration and enforcement of the laws. In particular, incentives were
offered to regional governments to have greater share of local tax revenue in an attempt to prevent them from
protecting local tax payers from paying central taxes. Further, tax rate on dividends was raised from 15% to 30%
while corporate tax rate remained unchanged at 30% (subsequently it was reduced to a flat rate of 24%). Thus
desperate government attempts to re-establish control on private businesses through aggressive tax enforcement
policy resulted in wars between the state and private businesses.1
3
regulatory bodies and law enforcement agencies and also conflict of interest between central and
local governments (Treisman, 2000) in a decentralized framework.
The question that we raise here is whether the introduction of T&D rules in this kind of
investment climate can necessarily boost firm performance. Despite privatization, different
levels of governments still remain as companies‟ stakeholders. However, the central government
has also a claim on any firm as tax collector and as such there may arise a conflict of interest
between the central government as a the stakeholder and that as a tax collector. While the
introduction of T&D rules (and also the overall CG codes) can resolve the conflict of interest
between the controlling and minority owners, thus boosting firm performance, it may worsen the
conflict between the state as the tax collector and the private controlling owners in Russia. In
particular, increasing transparency of businesses may make them easy targets for aggressive tax
enforcement policy by the central government and may thus reduce income sheltering or tax
evasion. Heinrich (2006) suggests that many oil-and-gas sector firms feared that too much
transparency may make them vulnerable to attack from Russia‟s state agencies. The case of
Mikhail Khodrokovsky, founder of the Russian oil and gas giant Yukos, who has been convicted
of embezzlement, fraud and tax evasion is particularly noteworthy in this context. This has been
a conspicuously aggressive case of state predatory behavior. Further, Treisman (2000) argued
that there arose a conflict of interest between the central and local governments in Russia‟s
decentralized economy, which may thwart the central government objective of lowering tax
evasion. First in Russia‟s politically decentralized society, sub-national governments can attract
businesses to offer protection against the central government tax collectors, regulators or
bankruptcy agency (Treisman, 2000). Second, greater fiscal decentralization in a politically
decentralized society may lower the incentive of the regional government to protect businesses
against paying taxes, but may in turn increase the bribe price for protection of businesses against
central taxes (which in turn may act as additional tax on private businesses). Finally, greater
fiscal decentralization may also induce private enterprises to shift part of their output
underground, thus adversely affecting performance of the legal entity. Thus the objective of firm
value maximization through introduction of T&D rules2 may be compromised by various factors
which inherently characterizes the Russian political and economic set-up. Accordingly, we argue
that the net effect of the introduction of CG reform in Russia could be positive, negative or
insignificant (when the positive and negative effects of CG reform outweigh each other). In the
2 Transparency and disclosure (T&D) is a key aspect of the modern corporate governance mechanism and an
important element affecting how attractive a firm appears to potential investors. This is a set of rules, which covers
various aspects of corporate practices including a firm‟s openness about financial and operational information, its
ownership structure, and shareholders‟ rights under the company‟s governing legal documents and the capabilities
of the individual board members and management.
4
absence of any prior evidence in this respect, we empirically explore the effect of introduction of
corporate governance codes in general and that of T&D rules in particular in Russia.
Our analysis focuses on the largest listed companies in Russia generally for the period
2000-20083, the period which witnessed the introduction, implementation and further
development of CG codes along with the reform of tax administration enforcement and also
political and fiscal decentralization measures. The companies studied are those which are
included by S&P‟s T&D data, covering 80% of the cumulative market capitalisation of the
Russian stock market in 2007, which were all subject to the newly introduced CG codes. We
merge the T&D data compiled by Standard & Poor (S&P) with firm-level accounting data
extracted from the OSIRIS database available from Bureau van Dijk.
T&D data covers six indices on ownership structure, shareholder rights, financial and
operational performance, and board and management structure and processes, all of which are
important elements that affect a firm‟s attractiveness to investors. We also use a measure of
composite T&D (obtained by using principal component analysis of six available indices), which
allows us to test our central hypothesis that better T&D improves a firm‟s performance in
Russia. While we do not observe the sample firms‟ responses to tax reform or alliance with the
local governments to evade central taxes, it can be argued that these factors are controlled by the
firm and year fixed effects in our analysis. For the purpose of this paper, we experiment with two
measures of firm performance as defined by earnings before interest and taxes (EBIT) as a share
of total assets and also Tobin‟s Q (Tobin, 1969); the latter focuses on market valuation of the
firm in relation to the cost of capital. The underlying idea is to examine if the effect of the CG
reform on firm performance differs according to these two indices of firm performance. Since
EBIT is calculated before taxes are imposed, we conjecture that the negative effect of state
intervention may be more pronounced on Tobin‟s Q rather than EBIT share. In the absence of
any prior in this respect, we use our data to explore this further. First, we exploit the inter-firm
variation in the adoption of T&D rules (an exogenous policy intervention) to identify the causal
effect of introducing the CG code on firm performance; in doing so, we also control for
additional firm (e.g., including firm size, leverage, age, and market concentration as measured by
the Herfindahl index), sector characteristics, which may otherwise influence firm performance.
To this end, we use the OLS firm and year fixed effects estimates that minimize the estimation
bias arising from the time-invariant unobserved heterogeneity, e.g., firm response to reform of
taxes and also administration and enforcement introduced in 2001 that remained more or less
time invariant during 2003-2007. Next we compare the effects of T&D rules (pertaining to
ownership structure, shareholder rights, financial and operational performance, and board and
3 Note that our analysis using S&P‟s transparency and disclosure indices only focused on the period 2003-2007 as
this data is only available for this period. Please see further discussion in the data section.
5
management structure and processes) not only on all firms, but also on energy and non-energy
sector firms individually in our sample for the period 2003-2007 for which this data is available.
Finally, we assess the impact of the introduction of the overall CG codes made effective
from 2004 onwards on firm performance indices in Russia using 2000-2008 data. Note that in
this case we are not constrained by 2003-2007 T&D data available from S&P and hence we use a
slightly larger sample that allows us to extend the end data point to 2008 (the latest year
available on Osiris when we initiated this research). Accordingly we replace the T&D rules
indices by a binary indicator of the introduction of corporate governance codes made effective
from 2004 onwards. The variable takes a value 1 for all the years from 2004-2008, but zero
otherwise. However in order to assess the impact of the CG code over this period, we also need
to identify some firms who may be considered as the control group (i.e., those who were not
treated by the introduction of Russian CG codes in 2004). Our analysis in this respect exploits
the variation in the adoption of CG code by those Russian listed firms who were also listed on
international stock exchange. The underlying idea is that in the post-2000 years of rapid Russian
recovery and subsequent growth, some Russian listed firms also got listed in international
financial markets (mainly in London Stock Exchange) to raise external finance. These firms
would often adopt more stringent international CG codes than those listed on Russian stock
exchange only. As such, the adoption of international CG codes by these firms would not
necessarily coincide with the introduction of Russian CG codes and hence we treat these
internationally listed Russian firms as our control group. This allow us to exploit the variation in
the adoption of corporate governance codes between domestic and foreign listed companies
before and after the effective introduction of Russian CG codes in 2004 with a view to identify a
causal effect of introduction of CG codes. The error terms are unlikely to be independent at the
firm level. Firms who abide by the CG codes in time t=1, are also likely to do so in t=2 and so
on. Therefore it is important to use the clustered standard errors at the firm level, which assumes
that the behavior of firms is not correlated in our analysis.
There is evidence from our analysis that both composite T&D rules as well as T&D in
financial and operational information significantly boosted the performance of firms, particularly
for utility firms in our sample. However the effect of T&D of any kind remains insignificant for
explaining firm performance4 among oil-and-gas companies, which holds a particularly
prominent place in Russian economy (see further discussion in Section 2). The latter can perhaps
be attributed to the conflict of interest between the state and the controlling oligarchs as well as
that between the central and the local governments supporting private businesses, thus wiping
out improvement in firm value that would have otherwise taken place. Regarding the impact of
4 Among the two measures of firm performance (EBIT and market valuation based Tobin‟s Q), we find that the
effect of T&D indices on EBIT as a share of total assets is always insignificant; hence, our analysis is essentially
based on the results obtained using Tobin‟s Q.
6
the introduction of CG codes in 2004, results from the second part of our analysis suggest that
internationally listed Russian firms, which require much higher informational disclosure than
Russian stock exchange, have significantly higher firm value though the differential effect of CG
reform of 2004 for internationally listed firms turns out to be insignificant. As expected, we find
that Tobin‟s Q is a better measure in this respect as the effect remains rather insignificant when
we use the EBIT based measure.
Our analysis contributes to a sizeable and growing literature on corporate governance in
emerging economies and also the limited literature on tax and corporate governance. In their
pioneering article Schleifer and Vishny (1997) highlighted the beneficial influence of good
corporate governance laws on firm performance and value. There is evidence from around the
world that firms with better corporate governance practices enjoy lower cost of capital (La Porta
et al., 1998; Ashbaugh-Skaife et al., 2006; Errunza and Mazumdar, 2001; Ashbaugh et al., 2004),
lower credit rate spreads (Yu, 2005) and lower risk (Gompers et al., 2003; Brown and Caylor,
2006). While the earlier literature tends to focus on the ownership and board composition as
derived from the agency-cost theory (an ownership and management separation theory explained
by Jensen and Meckling, 1976), since the 1990s, the focus has shifted to the legal rules (English
common law and French civil law countries) defining creditors‟ and shareholders‟ rights. Other
studies examine legal enforcement in terms of the rule of law, judicial efficiency and corruption
at both country and firm level. Later, Shleifer and Vishny (1997), La Porta et al., (1998) and
others found that combining rules relating to ownership and board composition with legal
protection for shareholders‟ rights provides a better understanding of CG practices. More
recently, the attention has been shifted to the importance of T&D rules. Patel and Dallas (2002)
has been one of the first studies on T&D, which highlighted that firms with good T&D have
lower costs of equity capital. Gompers, et al. (2003) included T&D as one of the components of
corporate governance rules and found that stronger rights in the US has led to better firm
performance. Similarly, Klapper and Love (2002) and Black, et al. (2006) considered T&D
parameters along with other CG practices. Other studies used CG indices provided by specialised
ranking agencies or constructed their own proxies (see, e.g., Black et. al., 2000; McKinsey &
Company, 2002; and Aggarwal et al., 2007). The general consensus in this literature is that better
T&D tend rules tend to lower the cost of capital, increase firm‟s performance and provide a
better understanding of the firm‟s business environment. This is because better corporate
governance resolves the conflict of interest between the controlling and minority owners.
Turning now to the limited literature on corporate governance in Russia, we find three recent
studies, namely, Black (2001); Goetzmann, Spiegel and Ukhov (2004) and Black, Love and
Rachinsky (2006). All these studies tend to focus on a relatively small sample and none of them
particularly focused on the period after the introduction of the corporate governance codes in
7
2002. The most recent of these studies, namely that by Black, Love and Rachinsky (2006)
analysed overall governance indices over the years 1999-2004. Thus the access to the unique
S&P data on T&D rules in the post-reform period allows us to update the effect of corporate
governance on firm performance in Russia. We go beyond this literature in that in addition to the
conflict of interest between controlling and minority owners, our analysis highlights that
introduction of T&D rules may not be an unmixed blessing, especially if it instigates a conflict of
interests between the state and the controlling owners as well as that between the central and the
local governments in a decentralized framework. Further, we conduct a formal impact evaluation
analysis of the introduction of Russian CG codes in 2004 by exploiting the differential behavior
of domestic and internationally listed Russian firms in our sample over 2000-2008. There is
suggestion that the international (as opposed to domestic) listing of Russian firms may improve
performance of Russian firms though the average impact of the CG reform turns out to be
insignificant for the period 2000-2008. Our results also complement the limited literature on tax
and corporate governance that argues that a stringent tax enforcement regime can increase the
amount outside shareholders will receive, even accounting for increased levels of taxation (see,
e.g., Desai, Dyck and Zingales, 2007). Instead we argue that higher taxes and stringent tax
enforcement may generate a conflict of interest not only between the controlling owner and the
central government, but also between the central and local governments (supporting private
businesses), which may counteract the effectiveness of CG reforms (including the T&D rules).
The paper is developed as follows. Section 2 describes the history of corporate
governance in Russia with special reference to the recent corporate governance codes and
Section 3 describes the data. Section 4 refers to methodology, while Section 5 presents and
analyses the results. The final Section 6 concludes.
2. Corporate governance in Russia
Corporate governance (CG) laws/rules have evolved over centuries, often in response to
corporate failures or systemic crises. Many think that inadequate and inconsistent regulation of
financial markets caused the first global economic crisis of the 21st century. The inadequate
availability of accurate information on risk exposure has further highlighted the crucial
importance of risk management and disclosure by financial institutions around the globe. As
President Obama said in his inaugural address, “this crisis has reminded us that without a
watchful eye, the market can spin out of control.” Lax oversight allowed corporations to take on
excessive risks, and poor disclosure practices left investors unaware of the dangers lurking in
their portfolios.
8
2.1. Background
Russia is a unique case in the context of CG. Barring successful corporate governance systems
such as those in the US, Germany or Japan, legal protection of investors in most countries is
rather weak, either because the laws are weak or because the courts do not enforce the laws. As a
consequence, most firms remain family-controlled and highly concentrated leading to large scale
expropriation of small investors including minority shareholders and creditors. This results in
serious undervaluation of Russian firms.
The present paper primarily focuses on one aspect of CG mechanism in Russia that deals
with T&D rules. In our case T&D is the only available, consistent and up-to-date information for
firms in our sample. Russia set good T&D mechanisms in place essentially to protect the rights
of the minority shareholders, creditors and other outsiders who do not have first-hand knowledge
about the firm and its prospects, against extraction of private benefits by insiders taking
advantage of their superior information.
We focus on the period 2000-2008, which has been a period of rapid political and
economic changes in Russia when Mr. Putin succeeded Mr. Yeltsin in March 2000. Putin‟s goal
was to reassert Kremlin control over a chaotic, cash-strapped state dominated by big
businessmen with a view to replace the oligarchs of Boris Yeltsin's presidency, who hustled their
way to wealth in murky post-Soviet privatisations by his own allies. Under President Yeltsin,
high tax rates and low levels of tax enforcement encouraged Russian firms to shelter income
aggressively. Multiple taxes from different levels of government meant that tax obligations could
exceed profits. Company executives were not shy about how this tax burden affected their
behavior. As Yukos Oil CEO Khodorkovsky argued, "As long as the tax regime is unjust, I will
try to find a way around it.”5 Putin radically strengthened the tax enforcement regime with no
change (at least for the first two years) in tax rates and signalled his intentions to crack down on
tax evasion by releasing a memorandum with a list of the worst corporate tax offenders (July 28,
2000).
The result was dramatic. Two Yeltsin allies, Boris Berezovsky and Vladimir Gusinsky,
fled abroad in 2000 facing fraud charges after clashing with the president. Mikhail
Khodorkovsky, owner of oil giant Yukos was arrested three years later on fraud charges and his
oil company was hit with a $28bn back tax bill. The Yukos case taught Putin‟s loyal private
businessmen that they held their assets at the Kremlin's pleasure and became involved in politics
only at their peril. However, there was still conflict of interest between the central and local
governments. In a decentralized set-up, the local goevernments tried to attract private businesses
to their municipalities by protecting these businesses against paying central taxes. The Kremlin
tried to resolve the conflict of interest between the central and the local governments by
5 This quotation directed from “Oligarch? No, I'm just an oil magnate,” Observer, Sunday June 4, 2000
9
increasing the extent of fiscal decentralization that allowed the local governments to retain 100%
of local revenue raised from personal income taxes. Some municipalities still tried to protect
private enterprises from paying central taxes in lieu of high bribe price which is a drag on firm
performance. Sometimes these excessive interventions both from the central and local
governments induced the private businesses to shift part of their output underground, thus
adversely affecting the performance of the legal entity. The result could be a negative or
insignificant (when positive and negative effects outweigh each other) effect of introduction of
CG codes on firm performance.
2.2. The 2002 Russian corporate governance codes
The Russian corporate governance codes, like countless similar documents enacted throughout
Europe, claims to embody universal values of good corporate behavior. Russia asked Coudert
Brothers, an American law firm, to prepare the international level of its CG with the cooperation
of the European Bank for Reconstruction and Development (EBRD), the OECD, the World Bank
and the International Finance Corporation.
Before the CG codes were introduced in 2002, several institutions applied a variety of
measures to assess the level of CG in Russia. These assessments created useful baseline
measures. The Brunswick Warburg investment bank (now as a part of UBS) has rated
governance implications since 1999. The Troika Dialog investment house has been assessing
selected firms since 2000. Two non-profit organizations, Corporate Law and Governance and the
Russian Institute of Directors, have measured CG since 2001 and 2004, respectively. The change
in the corporate environment brought out by the introduction of the CG codes in 2002 has been
facilitated by a set of policies, which necessitates a firm to be open and willing to disclose
financial and management information to the general public (see a detailed explanation of
various CG sub-policies in Bollard, 2003). A growing body of literature suggests, however, that
Russia‟s national culture and socio-political environment will also significantly influence how
the CG system develops (Kakabadse and Kakabadse, 2001).
The CG code has made some progress since its introduction in 2002. Despite all the
drawbacks and lack of a necessary business/political environment, the joint venture between the
two energy giants TNK and BP demonstrated Russia‟s emerging openness to foreign investors.
Another positive example of CG implementation within energy firms is the reorganization of the
utility holding company RAO UES. GAZPROM, the second largest company in 2003 (by
capitalized market value) is seen as having huge business potential. Yukos, the largest energy
company has made progress in CG despite (or perhaps leading to) the arrests of several of its
executives on charges of tax evasion and economic crimes. Yukos has been releasing financial
statements prepared in accordance with US Generally Accepted Accounting Principles (GAAP)
10
since 2001 and was audited by the international accounting firm PriceWaterhouseCoopers (PwC)
(Yukos website).
Given the availability of the T&D indices for the period 2003-2007, as compiled by S&P,
we first consider the sample for 2003-2007. In doing so, we not only distinguish between energy
and non-energy sector firms, but also distinguish between utility and oil-and-gas sector firms
within the energy sector with a view to compare the effect of CG codes across sectors. We also
check the robustness of our results in various ways (see further discussion in Section 3). We
further extend our analysis to consider the overall effect of the introduction of CG code in 2002
(which was made effective from 2004) on firm performance in our sample for 2000-2008 (which
includes years before and after the official introduction of CG codes). In this case, we are also
able to account for the differential effect, if any, of the CG reform for internationally listed
Russian firms (relative to those listed domestically one). This is motivated by the fact that
international listing of Russian firms requires much greater transparency than required by
Moscow stock exchange and did not coincide with the introduction of CG reform in 2004.
Some Russian companies moved towards greater T&D, providing opportunities for
foreign investors to acquire an interest in the company and adopting international management
practices like international accounting standards, listings on international stock exchanges and
thus improved standards of CG. Despite advances by these few CG adopters, however, Russia is
still characterized by general lack of transparency in a political environment plagued by
centralized state bureaucracy, corruption, and an inefficient judicial system where state
machinery often prey on private businesses.
3. Data
The data used in this analysis have been obtained primarily from OSIRIS firm-level data for
Russian energy companies, which has been widely used in the related academic literature (see
e.g., Black, 2001; Klapper and Love, 2002; Goetzmann, Spiegel and Ukhov, 2004; Black, et al.,
2006; and Black, Love and Rachinsky, 2006). OSIRIS is a fully integrated public listed company
database and analytical information solution produced by Bureau van Dijk, an electronic data-
publishing company. In this respect, we consider the listed Russian firms between 2000 and
2008, which has been a period of rapid economic recovery and subsequent growth under the
leadership of President Putin. OSIRIS data was then merged with the firm-level T&D data
obtained from S&P (see Appendix 1 for further details on the construction of these indices).
We apply GICS 4-digit code to classify firms in our sample. As we focus on energy
industry, GICS allowed us to identify 9 main energy subsectors within the energy industry. We
have selected utilities and oil and gas producers as the two largest ones consisting 64% of overall
energy sector. The two largest energy sectors consist of 23 companies. The remaining energy
11
sector companies are labelled as „other energy‟ sector (which consists of 13 companies).
Appendix 2 provides some summary statistics for the selected sectors and subsectors. Given that
S&P‟s T&D indices focus on the largest energy sector firms, we considered the 36 largest firms
in 2007. While 181 Russian energy firms are available in the OSIRIS, the 36 within S&P‟s
database are the largest ones. Further, we distinguish energy sector firms from leading non-
energy sectors, which include firms operating in telecommunications, metallurgy, banking, food,
consumer and retails and IT engineering.
Russia‟s stock market is dominated by the natural resources sectors, which comprises
about two-thirds of the market (Lazareva, et al., 2007). Russia has the largest proven natural gas
reserves in the world (1,688 trillion cubic feet) and the seventh-largest proven oil reserves (60.0
billion to 74.4 billion barrels) (BP review, 2007). Europe depends on Russian energy – Russia
provides 33.5% of the oil consumed in the EU and 42% of its gas usage (Erixon, 2008). The
importance of the energy sector in our study can further be highlighted by two following
observations. First of all, the Russian energy companies are significant because of how much
they contribute to the economy. When Russia began implementing its CG mechanism, five
energy giants, namely, Yukos, Gazprom, Lukoil, Surgutneftegaz and Sibneft, cumulatively
represented 56% of the value of all the stocks listed on the Russian Stock Market: USD 106,408
million out of USD 189,029 millions in 2003 (Expert RA, 2004). Foreign investors often
considered stock in Russian energy firms to be a key holding in their international portfolio.
Further, a comparison of total sales by companies in these two sectors between 2003 and 2007
clearly highlights the importance of energy sector firms in Russia. Percentage of total sales by
energy industry varies between 82%-85% during this period; in other words, only about 15%-
18% of total sales pertain to the non-energy sector of the country.
Firm-level balance sheet data from OSIRIS pertains to profit and loss accounts and cash
flow statements for all existing firms. Although we use the comprehensive firm-level database to
analyse effects within the energy sector, the consistency of information from OSIRIS and S&P
allows us to be confident of the descriptive statistics and regression analyses we produce.
3.1. Transparency & Disclosure Indices
We obtained a number of different T&D indices from S&P covering various aspects of corporate
financial behavior. This allows us to assess the predictive power of different measures of T&D.
It is important to choose the most acceptable T&D measures. Unlike much of the existing
literature, we have access to S&P‟s T&D indices consistently constructed for the 80 largest listed
Russian companies with the most liquid stocks (80% of cumulative market capitalisation of
Russian stock market, in 2007) over the period 2003-2007 (S&P‟s reports, 2003-2007).
12
A clarification is in order before we begin: while there are more than 300 public
companies in Russia (who are all subject to the new CG codes), we focus on the largest
companies covered by S&P; this sample may not be representative of all Russian companies.
Because the larger companies tend to be more transparent than the smaller ones, our sampling
method is likely to generate an upward bias in assessing transparency of the entire population of
public Russian companies. In contrast, since the companies included in this survey account for
about 80% of the cumulative capitalization of the Russian stock market, they represent the major
part of the Russian economy in terms of assets and operations. Subject to these clarifications, we
considered the following T&D indices6:
T&D financial and operational information
T&D ownership structure and shareholders rights
T&D board and management structure
We used the T&D overall score, which measures general implementation of the CG code.
As defined by S&P, T&D‟s „financial & operational‟ index measures openness and availability
of accounting data, employment standards, consistency with regulations, explanation and
description of the firm and its market position, etc. The T&D‟s „ownership‟ index demonstrates
the availability of data on the ownership structure. The T&D‟s „board & shareholders‟ index
shows the disclosure of the management structure. S&P measures T&D score in percentages
with a maximum 100%; a higher score means better T&D within the company. The same T&D
indices were used by Black, Love and Rachinsky (2006) though their sample covered a period up
to 2005 only.
Using this available data, the present research first investigates the possible effect of
T&D rules on firm‟s value (firm performance) for top listed companies in Russia. Our research
not only covered the energy sector, but was also extended to non-energy sectors firms covering
telecommunications, retail, communications, and real estate among others. Our results clearly
show that the energy industry generally underperformed relative to the non-energy related
sectors (see Figure 1 and Table 1). Despite its lower performance initially, the T&D overall
index for the energy sector corporations subsequently moved up so that they are now on are in
line with the other industries.
6 S&P applied two criteria to select the companies in the study: size and liquidity. As a rule, the liquidity of stocks
positively depends on the size of the company, but there are exceptions, especially in cases of minor free-float. Each
T&D index is based on about 30 survey questions for each of the sections: T&D financial and operational
information, T&D ownership structure and shareholders rights, T&D board and management structure. These
questionnaires were circulated to the top Russian firms from various industries like telecommunications, energy,
manufacturing, and advertising. S&P analysis accounts for information included in the three major sources of public
information: annual reports, Web-based disclosures, and public regulatory reporting. S&P views corporate
transparency as an important factor affecting a firm‟s attractiveness to investors and an important element of
corporate governance. The study includes around 80 largest Russian stock companies with the most liquid assets.
The companies included in the survey account for about 90% of the cumulative capitalization of the Russian stock
and market and they represent the major part of the Russian economy in terms of assets and operations.
13
Next we considered the trend in T&D indices over the sample years as shown in Figure 1.
It follows that the energy sector‟s T&D overall index increased from 40% in the first two years
after the CG policy implementation to around 55% in 2007, which moves into line with the
average level for the country as a whole.
Although the non-energy companies started at a higher level of T&D than the energy
companies in 2003, by 2007 they were at the same level as energy companies, indicating that
overall transparency increased faster for firms in the energy sector. Similar observations are
noted when we consider individual T&D indices: the progress was faster in the energy sector.
Black, Love and Rachinsky (2006) made similar observations for the period 1999-2004. Figure 1
summarises the change in various T&D measures and also the composite T&D measure over
20023-2007, which highlights a growing trend of firm-level transparency on all accounts in our
sample.
3.2. Treatment and control groups - internationally vs. domestic listed firms
Although all sample firms were listed in the stock exchange, it is important for us to find out if
some firms were listed in any international stock exchange; the latter may sometimes be labeled
as cross-listing as these firms were not only listed in Russian stock exchange, but also in some
other foreign stock exchanges. This is particularly important for the post-2000 period, which was
the period of economic recovery that subsequently gave rise to rapid economic growth in Russia.
During this period many of the largest Russian firms went into listing on foreign stock exchanges
(often in London stock exchange). While we can extract information from OSIRIS as to whether
a firm was listed in the international stock exchange in the latest year of the survey,
unfortunately, this information has not been available for other years during 2000 and 2007.
However, given that listing is relatively time invariant, we use this 2008 information to assess if
internationally listed Russian firms behave differently from other domestically listed firms (see
further discussion in Sections 4.2 and 5.2) because they were subject to more stringent
international CG codes. In other words, we consider domestically listed Russian firms as the
treatment group as they were primary guided by the Russian CG codes introduced in 2002 and
made effective from 2004 onwards. In contrast, internationally listed Russian firms constitute the
control groups as they are guided by different international rules.
4. Methodology
Our first objective has been to identify the causal effect of introduction of T&D rules on firm
performance in Russia. To do so, we first explored the role of each T&D index on firm value for
the post-reform period 2003-2007, using panel data fixed effects models. Given the shortcoming
of fixed effects models to control for unobserved time-varying heterogeneity, if any, we next
14
consider the effect of introduction of corporate governance codes in Russia in 2002 (which was
made effective from 2004), with a view to identify the effect of CG code in general, if possible.
Next, we assess the impact of the introduction of CG codes in 2004 by exploiting the variation in
the adoption of corporate governance codes between domestic and foreign listed companies with
a view to identify a causal effect of CG before and after the introduction of CG code.
4.1. OLS fixed effects estimates of firm value, 2003-2007
To start with, we employ a panel-data fixed-effects model using Ordinary Least Squares (OLS).
Our sample is a balanced panel data arranged for a group of firms observed over the years 2003-
2007. Choice of the sample period is guided by the fact that the T&D indices are available only
for 2003-2007. The measure of firm performance is Tobin‟s Q. After controlling for other
possible covariates, namely, firms size, age, Herfindahl index, performance of i-th firm in year t
is given by:
Qit = βT&D T&Dit + βS Sizeit + βAAgeit + βHHerfindahlit + βLLeverageit + αi + θt + vit Eq. (1)
where, t = 2003-2007,
αi = firm-specific unobserved factor
θt = Year specific unobserved factor
vit= firm (i) and year (t) specific error term (independently and identically distributed).
The advantage of using fixed-effects model is that it allows us to minimize estimation
bias arising from any possible time-invariant unobserved heterogeneity. The parameter αi
accounts for the firm-specific time-invariant unobserved factors, e.g., effects of corporate taxes
and also tax enforcement as well as other government policies affecting the sample firms,
inclusion of which is likely to minimise the potential estimation bias arising from firm-specific
unobserved heterogeneity. Further, in order to minimize the bias generated by reverse causality,
we have lagged all explanatory variables by one period. We use a fixed effects panel data model
to estimate Eq. (1). Further we cluster all standard errors at the firm-level to minimize any
estimation bias arising from interdependence of errors over time for each firm.
Tobin‟s Q is a widely used measure of firm performance in the literature (e.g., Mueller
and Reardon 1993; Blanchard et al., 1993; Denis and McConnell, 2003 and La Porta et al.,
2002). In our study, we constructed two alternative measures of Tobin‟s Q:
firm market capitalisation divided by total assets
15
firm market capitalisation plus total debt divided by total assets7
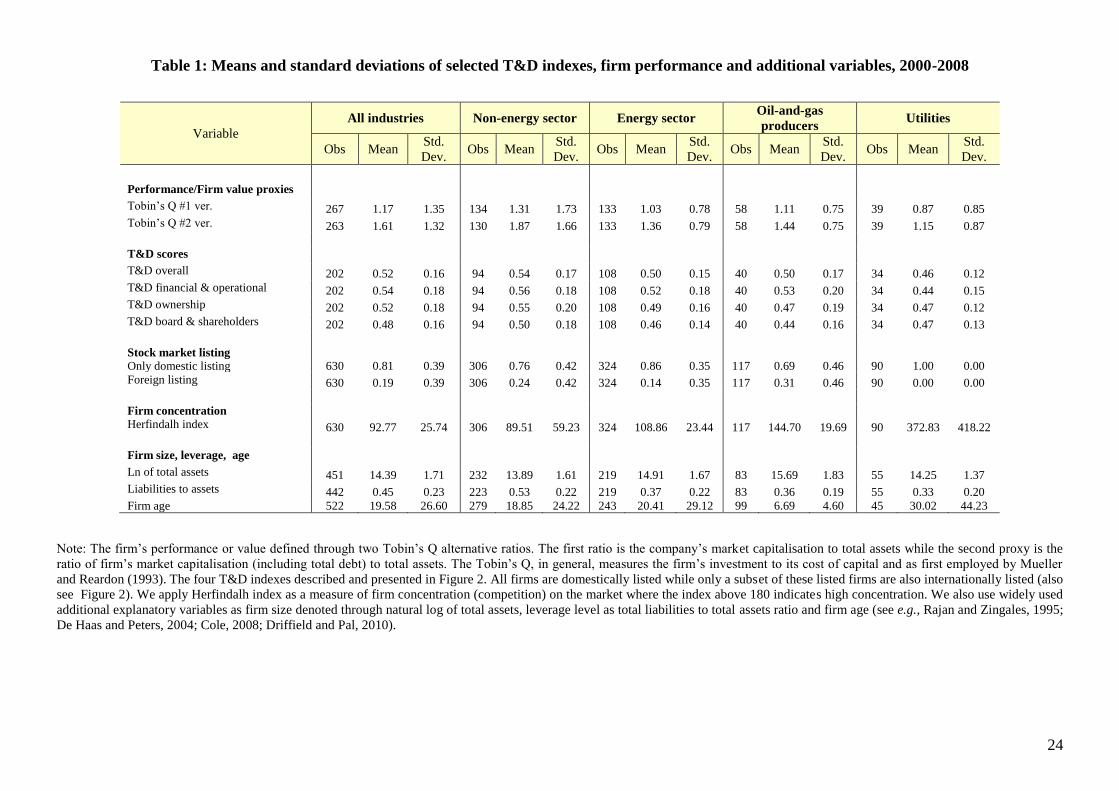
Table 1 shows the descriptive statistics for all the regression variables in our sample.
Note that the average value of Tobin‟s Q varies between 0.87 and 2.27, depending on the
particular definition of the variable and also the sector in which they were operating. Researchers
have suggested that the largest Russian companies find themselves overvalued, since the market
value of a company is greater than the recorded assets (e.g., Tobin and Brainard, 1977). In our
investigation, utility firms have the smallest performance index, around 1.00, which still points
towards overvaluation.
In order to identify the effect of T&D on Tobin‟s Q, we controlled for additional firm-
level characteristics, which are likely to influence firm performance. These control variables
include firm age, Herfindahl index of market concentration, company size (as the natural
logarithm of total assets) and leverage (the ratio of total liabilities to total assets). Choice of these
variables is guided by the literature, e.g., Franks and Mayer (2002), Rajan and Zingales (1995),
and Booth, et al. (2001), de Haas and Peters (2004), Cole (2008) and Driffield and Pal (2010).
We measured market concentration using the Herfindahl index, named after its original
proponent Herfindahl (1950). Essentially, the Herfindahl index measures how concentrated the
industry is; many competitors in a sector result in lower concentration while fewer competitors
increases the level of concentration. As a rule of thumb, a Herfindahl index below 0.10 signals
low concentration or an unconcentrated market, while a Herfindahl index above 0.18 signals
high concentration. An index falling between 0.10 and 0.18 indicates that the industry is
moderately concentrated8. Table 1 shows that the average Herfindahl index is high for all the
sectors considered in our analysis, implying a monopolistic market environment in Russia.
We also included how long the firm had been in existence. In general, Table 1
demonstrates that the average age of all the firms in our study is 20 years. The most recently
established firms in the oil-and-gas production sector average 7 years old; the oldest companies
in the utilities sector average 30 years old. The average ratio of total liabilities to total assets is
about 0.45. It follows that, compared to the utilities; firms in the oil-and-gas subsector are not
only larger on average, but also more leveraged.
7 We also tried other profitability parameters such as return on assets and earnings before interest and taxes divided
by total assets, but were unable to find any significant evidence with these alternative measures.
8 In our analysis we have multiplied Herfindahl index by 100 in order to standardize the variable. U.S. Department
of Justice and the Federal Trade Commission in the „Horizontal Merger Guidelines‟ apply Herfindahl indexation up
to 1002 or in 10‟000s. (http://www.justice.gov/atr/public/guidelines/hmg.htm#N_17_).
16
5. Difference-in-Difference estimates of firm value
Although we do not have access to any T&D indices for the period before 2003, (T&D
information is available only for 2003-2007), we generate a binary variable indicating
introduction of corporate governance rules in the country. Recalling that Russia introduced CG
mechanism in 2002, the first reporting year under these new rules was 2003, for which the
financial reports did not become available until 2004. Accordingly we constructed a dummy
variable CG2004 that takes a value 1 for year 2004 and beyond and zero for the years before
2004. The rationale for doing this is to exploit the exogenous introduction of CG reform as an
instrument for T&D rules in our sample. Impact assessment also necessitated us to identify a
control group of firms who were not necessarily affected by the introduction of CG codes in
2004. As a result, we are also able to consider the larger sample of 2000-2008 in this case. Given
that many Russian firms got internationally listed in post-2000 years, a period of rapid economic
recovery and subsequent growth in Russia, we treat these firms as our control (untreated by the
CG codes) group. Accordingly, we create a second binary variable LI that takes a value 1 if a
sample firms was listed during 2000-2008 and 0 otherwise. Internationally listed Russian firms
were subject to more stringent CG rules and as such we can exploit this variation across
domestically and internationally listed firms to identify the differential effect of CG reform, if
any, on internationally listed firms (this is captured by the inclusion of the interaction between
CG2004 and LI). Accordingly, we specify a Difference-in-Difference (DID) model determining
Tobin‟s Q of the i-th firm as follows:
Qi = βCG CG2004 + βLI LI + βCGLI CG2004*LI+ βX X + ui Eq. (2)
The DID method has become popular in empirical economics since its genesis in
Ashenfelter (1978) and is probably the most widely used method for impact evaluation. In effect,
DID is largely a two-period panel data model with fixed effects, assumed for the treatment status
and time period (before/after the introduction of reform).
As before, we included other covariates X which includes firm size, age, Herfindahl
index and leverage to identify the causal effect of T&D rules on Tobin‟s Q. Further, we include
sector control as we pool all industries together.9The sector control would capture the effects of
the unobserved sector level factors including taxes, tax-enforcement and/or any shocks. Since we
do not have time-varying information on internally listed Russian firms, we use pooled
estimates. However note that all estimates are clustered around firms with a view to minimize
any estimation bias arising from inter-dependence of firm specific errors over time.
9 We do not produce industry specific estimates in this case as the sample size is significantly reduced, if we do so.
17
Ceteris paribus, the estimated coefficient of the period dummy CG2004 would highlight
the effect of introduction of corporate governance codes on firm value for all sample firms. Note
however that the CG2004 dummy incorporates the overall effect of all corporate governance
reform and not just the effect of the T&D rules which we considered in Section 4.1. The
estimated coefficient of LI (internationally listed Russian firms) would however highlight the
effect of international listing LI on Tobin‟s Q in our sample. The variable of particular interest to
us is βCGLI, which is the interaction term between LI and CG2004. The estimated coefficient of
the interaction term would allow us to identify the differential effect of the introduction of CG
code on internationally listed firms, if any. This is the crucial coefficient which determines the
mean impact of the introduction of the CG code in our sample. In order to check the robustness
of our estimates, we also consider the estimates of share of EBIT in an alternative specification.
6. Results and discussion
This section presents and analyses the estimates of Eq. (1) for our sample. Section 6.1 discusses
the estimates of Eq. (1) for the utilities and oil-and-gas subsectors within energy sector and also
compares the estimates for the overall energy sector firms with other non-energy sector firms.
Section 6.2 presents and analyses the estimates of Eq. (2) for the period 2000-2008.
6.1. FE-OLS estimates of firm value, 2003-2007
Table 2 summarises the FE-OLS estimates of Tobin‟s Q as in Eq. (1) using the composite T&D
index. Table 3 shows the FE-OLS estimates of Tobin‟s Q using the T&D financial and
operational information measure. The estimates using other T&D indices were not significant in
determining Tobin‟s Q in our sample. We do not show them, but will make them available on
request. Table 4 finally shows the FE-OLS estimates of the alternative firm performance index,
namely, EBIT as a share of total assets in our sample, for comparison with Tobin‟s Q estimates.
In general, estimates from Table 2 are rather similar to those in Table 3. We show
estimates for two alternative measures of Tobin‟s Q as explained in the data section. For each of
the chosen Tobin‟s Q measures, the estimated coefficient of the particular T&D index is not only
significant for the all sector taken together, but also for the energy industry (utilities and oil and
gas sector) pooled together. After controlling for all other factors, the significant positive effect
of T&D rules appears when considering composite T&D and T&D financial & operational
information availability (although the level of significance varies somewhat among different
subsamples). These findings support John and Senbet (1998), Errunza and Mazumdar (2001),
Roberts (2004), and Yeoh (2007), who argued that recognised accounting and corporate integrity
within companies can stimulate investment incentives and, in the end, financial markets, thus
explaining higher firm value. If, however, we compare the estimates between the two major
18
energy sub-sectors, utilities and oil-and-gas producers, the T&D effect is significant only for
utilities. It thus appears that the estimate for the overall energy sector (in column 3 of Table 2)
has been driven by the utilities (see columns 10 of Table 2 and columns 5 and 10 of Table 3).
A possible explanation for the lack of significance of T&D in the oil-and-gas sector may
arise from the conflict of interest between the controlling owner and the state as well as that
between the central and state governments. As indicated earlier, this is a sector dominated by the
five energy giants comprising of about 56% of total market capital of Moscow Stock Exchange,
Evidently these energy firms are significantly bigger than other non-energy sector firms (see
Table 1) and as such may be subject to greater predatory behavior of the state, thus giving rise to
a conflict of interest between the controlling owners and the state, which may counteract the
purpose of introducing T&D rules. Accordingly, the energy giants may have greater stakes from
the prying eyes of state agencies, especially when new corporate governance code requires them
to be transparent. This is because greater transparency may make them more vulnerable to higher
taxes by the state agencies (the recent high profile case of Mikhail Khodorkovsky of Yukos is a
pointer to this argument). Thus the conflict of interest between controlling owner and the state
may harm firm value in the oil and gas sector in various ways; it may be attributable to the high
bribe price paid by these large companies to shelter high revenue and/or transferring part of the
output underground to avoid tax intervention by the government (Triesman). While the positive
T&D effect for all firms in our sample tends to be in line with the existing literature about
Russian corporations (see e.g., Black, 2001; Goetzmann, Spiegel and Ukhov, 2004; Black, Love
and Rachinsky, 2006), we believe that the identification of the potential negative effect of
introduction of T&D rules, which may render total effect to be insignificant as in the case of the
Russian oil-and-gas sector is a novel contribution of our analysis and we attribute this to the
predatory behaviour of the state.
Among other results, our study shows that a firm‟s size (measured by total assets) and
leverage (calculated as the ratio of liabilities to assets) both tend to lower firm performance
irrespective of the Tobin‟s Q measure chosen. In contrast, firm performance is significantly
better for older firms. There is also a significant negative relationship between the Herfindahl
index of market concentration and firm performance for firms in the oil-and-gas production
sector and for all non-energy industries. The negative effect in non-energy firms is almost three
times as large compared to the oil-and-gas companies.
It is also interesting to compare the Tobin‟s Q estimates with the corresponding EBIT as
a share of total assets estimates. Note that Table 4 only shows the estimates for all sectors
combined where columns (1)-(4) highlights the estimates using different components of T&D
indices. After controlling for all other factors, we find that all these estimated coefficients of
various T&D indices are negative, the coefficient is only statistically significant for T&D
19
ownership. In other words, ceteris paribus, there is evidence from our sample that greater
transparency with respect to ownership information generates a negative impact on EBIT based
firm performance measure, even before taxes are deducted. Again, this result highlights potential
negative effect of the conflict of interest between the centralized state and the controlling owner
and also that between the central and the local governments.
Note however that the introduction of T&D rules is only one aspect of overall CG reform
in Russia and hence we next consider the effect of the overall CG reform on firm performance in
Russia. In doing so, we also consider the larger sample of listed firms available from Osiris in
section 6.2. In a sense, this additional exercise would allow us to test the robustness of our
results pertaining to introduction of T&D rules.
6.2. DID estimates of firm performance 2000-2008
In this section, we make use of the impact evaluation literature (i.e., difference-in-difference or
in short DID estimates) to assess the effect of CG reform on selected indices of firm performance
in Russia. Since information on whether a firm is listed on international stock exchange is
generally time-invariant, we are assuming that the 2008 information on whether a Russian firm is
listed on international stock exchange) is also pertinent for all the years between 2000 and 2008.
Accordingly, we shall, in this subsection, consider the estimates of Eq. (2) for same Russian
listed firms as in section 6.1 but for the larger period 2000-2008. The DID estimates of various
firm performance measures (Tobin‟s Q and EBIT as a share of total assets) are summarized in
Table 5. Columns (1) and (2) show the estimates for Tobin‟s Q defined as the ratio of firm‟s
market capital to total assets while columns (3) and (4) show those for a second measure of
Tobin‟s Q (ratio of market capital plus debt to total assets). Finally, column (5) and (6) show the
DID estimates of EBIT as a share of total assets. While columns (1), (3) and (5) do not control
for any other explanatory variables, estimates for the complete specifications that include other
control variables are respectively shown in columns (2), (4) and (6) for these three alternative
measures of firm performance. In this respect, our discussion is couched in terms of the complete
specifications shown in columns (2), (4) and (6) that minimize the omitted variable bias. In
particular, our analysis focuses on the estimates for CG2004, LI (a binary variable indicating if a
firm is listed in international stock exchange) and their interaction term. As before, all estimates
are clustered at the firm level to minimize any further estimation bias.
First we focus on the estimates using two alternative indices of Tobin‟s Q. Introduction
of corporate governance codes is associated with significantly higher values of Tobin‟s Q
(irrespective of the definition) in columns (1) and (3) when we do not control for any other
explanatory variables. However, it loses its significance in columns (2) and (4) as we include
other explanatory variables. In contrast, internationally listed companies tend to have
20
significantly higher Tobin‟s Q in columns (2) and (4). Since by controlling for all other factors
influencing firm value, we minimize the omitted variable bias, we prefer the estimates shown in
columns (2) and (4) for these two alternative measures. There is thus evidence from our analysis
that, ceteris paribus, internationally (relative to domestically) listed Russian firms tend to have
significantly higher firm value in our sample. However, the interaction term measuring the mean
impact of the CG reform turns out to be statistically insignificant; in other words, there is no
evidence from our sample that internationally listed Russian firms enjoyed higher firm value in
the post CG reform period in our sample, after holding other factors constant. Note however that
none of these central variables are statistically significant when we focus on EBIT as a share of
total assets. Thus there is no evidence that the reform boosted firm performance measured by
EBIT as a share of total assets.
To summarise, these DID estimates again confirm the limited effectiveness of the
introduction of CG codes in Russia, even when we pool all sectors together. Clearly the effect of
the CG reform on firm performance has been even weaker when we consider the EBIT-based
measure of performance rather than Tobin‟s Q. Given that there is evidence of increase in T&D
indices in our sample (see discussion in Section 3.1), we argue that the introduction of the CG
reform since 2004 has not been associated with a statistically significant increase in firm value;
the latter can be attributed to the conflict of interest between the controlling owner and the state,
which intervenes in private businesses through excessive taxes. It can also be attributed to the
conflict of interest between the central and local governments in a decentralized set up which
may not only impose a high bribe price for helping private businesses to evade central taxes, but
may also drive parts of some private businesses underground in a desperate attempt to avoid
paying taxes.
7. Concluding comments
Using recent firm-level panel data from Russia, this paper investigates whether an introduction
of CG codes would necessarily boost firm performance.
We argue that an understanding of corporate governance in Russia requires an
identification of the conflict of interests not only between the controlling and minority owners,
but also that between the controlling owners and the centralized state as well as that between the
central and local governments in a decentralized set-up. State may not only act as the stakeholder
of a company, but also has the tax-setting power. While introduction of CG codes may increase
firm value by resolving the conflict of interest between the controlling and minority owners in
Russia‟s highly concentrated ownership structure, introduction of tax reform, stringent tax
enforcement and decentralisation may counteract the CG reforms. So the net effect of
21
introduction of CG codes may be positive, negative or no effect at all, when the positive and
negative effects exactly outweigh each other.
Unlike many existing studies, our analysis has been facilitated by the recent availability
of S&P data on T&D for the top listed firms in Russia for the period 2003-2007. We were able
not only to consider Russian energy firms, but also to compare the specific cases of Russia‟s
non-energy sector companies. Even within the energy sector, we have been able to compare the
cases of the utilities and oil-and-gas subsectors for their obvious contributions (significance) to
the Russian economy. There is evidence from our fixed effects panel data estimates that the
various T&D rules has been met with only limited success to boost firm value especially for the
all important oil and gas sector. This is because CG reforms initiated a conflict of interest
between the large energy giants and the centralized state while the tax reform and
decentralization generates the conflict of interest between the central and local governments. The
impact of the introduction of CG code is even weaker when we examine the impact of
introduction of corporate governance codes (which include broader measures over and above
T&D rules) of 2002 (which was made effective from 2004 onwards) on various indices of firm
performance, after exploiting the variation in the impact of the code between domestic and
internationally listed Russian firms in our sample for 2000-2008: while CG dummy remains
insignificant in determining firm value, ceteris paribus, internationally listed Russian firms tend
to have significantly higher market value. There is however no significant differential positive
effect of CG reform on firm value among internationally listed firms so that the average impact
effect turns out to be insignificant. We argue that these results support our central hypothesis and
also complement Desai, Dyck and Zingales (2007) who argued that a stringent tax enforcement
can increase the amount outside shareholders will receive, even accounting for increased levels
of taxation. We argue that higher taxes, stringent tax enforcement and fiscal decentralisation may
generate a conflict of interest between the controlling owner and the state and also that between
the central and local governments, which may counteract the effectiveness of other CG reforms.
Although this is a case study of Russia, the results from this study has wider implications beyond
the country, especially, in other central and eastern European countries as well as the countries
from the community of independent states (CIS), where state control on private businesses often
remains firm even after radical privatisation programmes.
This conflict of interest between Russian corporate oligarchs and the state has induced
many Russian oligarchs to invest abroad. The latter, in turn, has gradually been paving the way
for increasing inward foreign investment in Russia, as highlighted by the recent BP deal in the
oil-and-gas sector of the country. It would be interesting to see whether and how inward foreign
multinational investment can resolve the conflict of interest between the state and the controlling
private owners, thus contributing to sustained improvement in firm value in Russia.
22
References
Aggarwal, R., Isil, E., Stulz, R., and Williamson, R., 2007. Differences in governance practice
between u.s. and foreign firms: measurement, causes, and consequences.Working Paper, Ohio
State University.
Ashbaugh, H., Collins, D. W.,La Fond, R., 2004. Corporate governance and the cost of equity
capital. Working paper, University of Wisconsin-Madison
Ashbaugh-Skaife, H., Collins, D.W., La Fond, R., 2006. The effects of corporate governance on
firms‟ credit ratings. Journal of Accounting and Economics 42,203-243.
Ashenfelter, O. 1978.
Black, B.S., Coudert Brothers, Shin & Kim, International Development Law Institute, 2000.
Corporate governance in Korea at the millennium: enhancing international competitiveness. Final
report and legal reform recommendations, consulting services for corporate governance reform in
Korea.
Black, B., 2001. The corporate governance behavior and market value of Russian firms. Emerging
Markets Review 2, 89-108.
Black, B.S., Love, I., Rachinsky, A., 2006. Corporate governance and firms' market values: time
series evidence from Russia. Emerging Markets Review 7, 361-379.
Blasi, J.R., Shleifer, A., 1996. Corporate governance in Russia: an initial look. In: Frydman, Gray,
and Rapaczynski (editors), Corporate governance in Central Europe and Russia: insiders and the
state. Central European University, Budapest.
Bollard, A., 2003. Corporate governance in the financial sector. (Governor of the Reserve Bank of
New Zealand, to The Annual Meeting of the Institute of Directors in New Zealand, Christchurch,
7 April 2003).
Visited: 3rd
January 2011, http://www.rbnz.govt.nz/speeches/0132484.html
Booth, L., Aivazian, V., Demirguc-Kunt, A., Maksimovic, V., 2001. Capital structure in developing
countries. The Journal of Finance 56, 87-130.
British Petroleum (BP) Statistical Review, 2007. World proved reserves of oil and natural gas, most
recent estimates., U.S. Department of Energy, Energy Information Administration, Ibid.:6 -22.
Accessed at www.eia.doe.gov/emeu/international/reserves.html (August 20, 2007).
Brown, L., Caylor, M., 2006. Corporate governance and firm performance. Journal of
Accounting and Public Policy, 25 issue 4, 409-434.
Cole, R.A., 2008. What do we know about the capital structure of privately held firms? Evidence
from the surveys of small business finances. SBA Government, SBAHQ-06-Q-0013.
de Haas, R.T.A., Peters, H.M.M., 2004. Firms' dynamic adjustment to target capital structures in
transition economies. WO Research Memoranda (discontinued) 761, Netherlands Central Bank,
Research Department.
Desai, M., A. Dyck and L. Zingales. 2007. Theft and Taxes. Journal of Financial Economics, 84,
591-623
Driffield, N.L., Pal, S., 2010. Evolution of capital structure in East Asia – corporate inertia or
endeavours? Journal of the Royal Statistical Society (series A) 173 part 1, 1–29.
Erixon, F., 2008. Europe‟s energy dependency and Russia‟s commercial assertiveness. European
Centre for International Political Economy No. 07, ISSN 1653-8994.
Errunza, V.R., Mazumdar, S.C., 2001. Privatization: a theoretical framework. Journal of
International Financial Markets, Institutions and Money 11, issues 3-4, 339-362.
Expert RA, 2004. Entrepreneurial Ethics and Corporate Governance in Russia: Investor Perceptions
and Business Reality.
Financial Times. 2006.‟ Back in business – how Putin's allies are turning Russia into a corporate
state‟, June 19.
Franks, J., Mayer, C., 2002.Governance as a source of managerial discipline. Research series 200205-
12, National Bank of Belgium.
Goetzmann, W.N., Spiegel, M.I., Ukhov, A., 2004. Modelling and measuring Russian corporate
governance: the case of Russian preferred and common shares (English version). Yale School of
Management Working Papers, Yale School of Management.
Gompers, P., Ishii, J. and Metrick, A. 2003. Corporate governance and equity prices. Quarterly
Journal of Economics 118, issue 1, 107-155.
Heinrich, A., 2006. International implications of increased state control over the Russian oil and gas
sector. Eastern European Day 2006, ”Russian Challenges – Between Freedom and Energy”,
Fribourg, Switzerland, 23 June 2006.
23
Herfindahl, O.C., 1950. Concentration in the U.S Steel industry. Unpublished doctoral dissertation,
Columbia University.
Jensen, M.C., Meckling, W.H., 1976. Theory of the firm: managerial behaviour, agency costs and
ownership structure. Journal of Financial Economics, vol. 3(4), pp. 305-360.
John, K., Senbet, L., 1998.Corporate governance and board effectiveness. Journal of Banking and
Finance 22, No.4, 371-403.
Kakabadse, A., Kakabadse, N., 2001. The geopolitics of governance: the impact of contrasting
philosophies. Basingstoke, Palgrave.
Klapper L., Love, I., 2002. Corporate governance, investor protection, and performance in emerging
markets. Policy Research Working Paper No. 2818, World Bank, Washington, DC.
La Porta, R., Lopez-De-Silanes, F., Shleifer, A., Vishny R., 2002. Investor protection and corporate
valuation. The Journal of Finance 57, No. 3, 1147-1170.
La Porta, R., Lopez-de-Silanes, F., Shleifer, A., Vishny, R., 1998. Law and finance. Journal of
Political Economy 106, pp. 1113-1155.
Lazareva, O., Rachinsky, A., Stepanov, S., 2007. A survey of corporate governance in Russia.
CEFIR/ NES Working Paper, No. 103.
McKinsey & Company, 2002. Global investor opinion survey: key findings. New York.
Mueller, D.C., Reardon, E.A., 1993. Rates of return on corporate investment. Southern Economic
Journal 60, No. 2, 430-453.
Patel, S.A., Dallas, G., 2002. Transparency and disclosure: overview of methodology and study
results – United States, Standard & Poor‟s.
Pistor, K., Raiser, M., Gelfer, S., 2000. Law and finance in transition economies. The Economics of
Transition 8, 325–368.
Rajan, R., Zingales, L., 1995. What do we know about capital structure? Some evidence from
international data. Journal of Finance 50, 1421-1460.
Roberts, J., 2004. The modern firm: organizational design for performance and growth. Oxford
University Press.
Shleifer, A., Vishny, R.W., 1997. A Survey of corporate governance. The Journal of Finance 52, No.
2, 737-783.
Standard & Poor‟s, 2003. Russian Transparency and Disclosure survey 2003: positive changes in
practices of Russian companies. Standard & Poor‟s Governance Services.
Standard & Poor‟s, 2004. Russian Transparency and Disclosure survey 2004: positive trend continues
despite political obstacles. Standard & Poor‟s Governance Services.
Standard & Poor‟s, 2005. Russian Transparency and Disclosure survey 2005: continuing progress in
transparency, but mainly among weaker disclosers. Standard & Poor‟s Governance Services.
Standard & Poor‟s, 2006. Transparency and Disclosure by Russian companies 2006: modest progress
amid the IPO deal. Standard & Poor‟s Governance Services.
Standard & Poor‟s, 2007. Transparency and Disclosure by Russian companies 2007: high turnover in
the top 10. Standard & Poor‟s Governance Services.
Tobin, J., 1969. A general equilibrium approach to monetary theory. Journal of Money Credit and
Banking 1, No. 1, 15-29.
Tobin, J., Brainard, W.C., 1977. Asset markets and the cost of capital. Economic Progress, Private
Values and Public Policy.
Treisman, D. 2000. „Decentralization, Tax Evasion and the Underground Economy: A Model with
Evidence from Russia‟, mimeo, University of California Los Angeles.
Yeoh, P., 2007. Corporate governance models: is there a right one for transition economies in Central
and Eastern Europe? Managerial Law 49 issue 3, 57-75.
Yu, F., 2005. Accounting transparency and the term structure of credit spreads. Journal of Financial
Economics 75, 53-84.
24
Table 1: Means and standard deviations of selected T&D indexes, firm performance and additional variables, 2000-2008
Variable
All industries Non-energy sector Energy sector Oil-and-gas
producers Utilities
Obs Mean Std.
Dev. Obs Mean
Std.
Dev. Obs Mean
Std.
Dev. Obs Mean
Std.
Dev. Obs Mean
Std.
Dev.
Performance/Firm value proxies
Tobin‟s Q #1 ver. 267 1.17 1.35 134 1.31 1.73 133 1.03 0.78 58 1.11 0.75 39 0.87 0.85
Tobin‟s Q #2 ver. 263 1.61 1.32 130 1.87 1.66 133 1.36 0.79 58 1.44 0.75 39 1.15 0.87
T&D scores
T&D overall 202 0.52 0.16 94 0.54 0.17 108 0.50 0.15 40 0.50 0.17 34 0.46 0.12
T&D financial & operational 202 0.54 0.18 94 0.56 0.18 108 0.52 0.18 40 0.53 0.20 34 0.44 0.15
T&D ownership 202 0.52 0.18 94 0.55 0.20 108 0.49 0.16 40 0.47 0.19 34 0.47 0.12
T&D board & shareholders 202 0.48 0.16 94 0.50 0.18 108 0.46 0.14 40 0.44 0.16 34 0.47 0.13
Stock market listing
Only domestic listing 630 0.81 0.39 306 0.76 0.42 324 0.86 0.35 117 0.69 0.46 90 1.00 0.00
Foreign listing 630 0.19 0.39 306 0.24 0.42 324 0.14 0.35 117 0.31 0.46 90 0.00 0.00
Firm concentration
Herfindalh index 630 92.77 25.74 306 89.51 59.23 324 108.86 23.44 117 144.70 19.69 90 372.83 418.22
Firm size, leverage, age
Ln of total assets 451 14.39 1.71 232 13.89 1.61 219 14.91 1.67 83 15.69 1.83 55 14.25 1.37
Liabilities to assets 442 0.45 0.23 223 0.53 0.22 219 0.37 0.22 83 0.36 0.19 55 0.33 0.20
Firm age 522 19.58 26.60 279 18.85 24.22 243 20.41 29.12 99 6.69 4.60 45 30.02 44.23
Note: The firm‟s performance or value defined through two Tobin‟s Q alternative ratios. The first ratio is the company‟s market capitalisation to total assets while the second proxy is the
ratio of firm‟s market capitalisation (including total debt) to total assets. The Tobin‟s Q, in general, measures the firm‟s investment to its cost of capital and as first employed by Mueller
and Reardon (1993). The four T&D indexes described and presented in Figure 2. All firms are domestically listed while only a subset of these listed firms are also internationally listed (also
see Figure 2). We apply Herfindalh index as a measure of firm concentration (competition) on the market where the index above 180 indicates high concentration. We also use widely used
additional explanatory variables as firm size denoted through natural log of total assets, leverage level as total liabilities to total assets ratio and firm age (see e.g., Rajan and Zingales, 1995;
De Haas and Peters, 2004; Cole, 2008; Driffield and Pal, 2010).
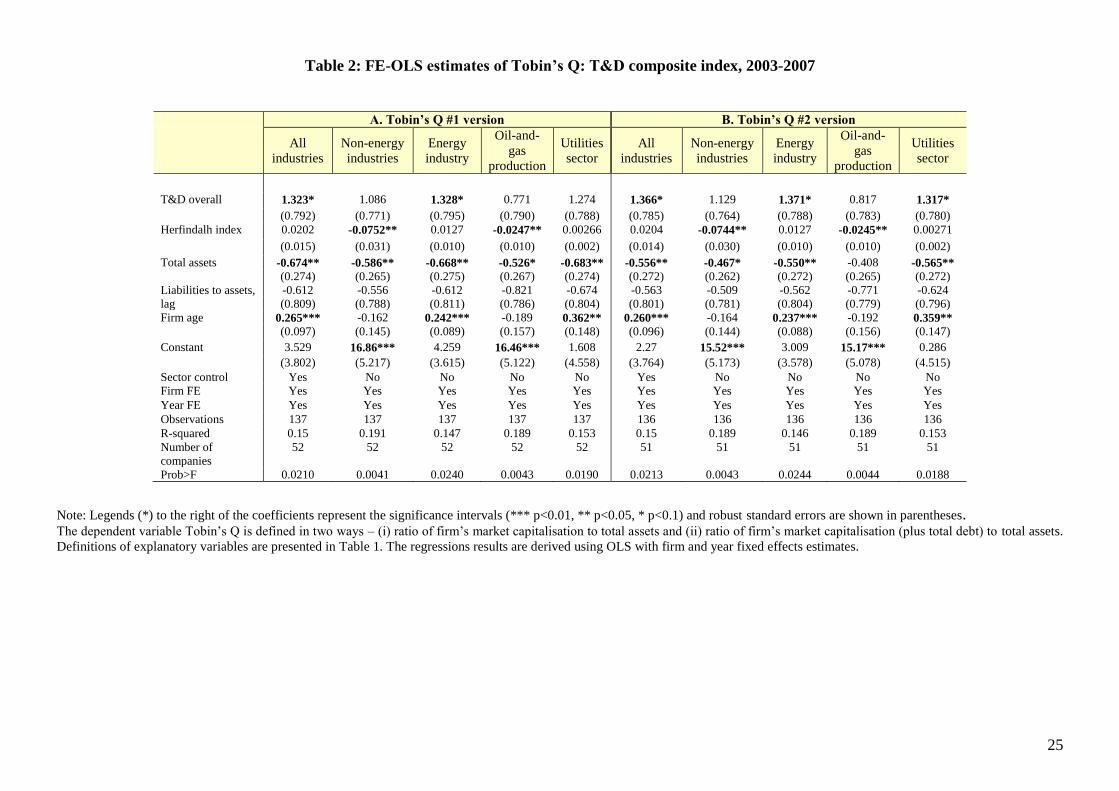
25
Table 2: FE-OLS estimates of Tobin’s Q: T&D composite index, 2003-2007
A. Tobin’s Q #1 version B. Tobin’s Q #2 version
All
industries
Non-energy
industries
Energy
industry
Oil-and-
gas
production
Utilities
sector
All
industries
Non-energy
industries
Energy
industry
Oil-and-
gas
production
Utilities
sector
T&D overall 1.323* 1.086 1.328* 0.771 1.274 1.366* 1.129 1.371* 0.817 1.317*
(0.792) (0.771) (0.795) (0.790) (0.788) (0.785) (0.764) (0.788) (0.783) (0.780)
Herfindalh index 0.0202 -0.0752** 0.0127 -0.0247** 0.00266 0.0204 -0.0744** 0.0127 -0.0245** 0.00271
(0.015) (0.031) (0.010) (0.010) (0.002) (0.014) (0.030) (0.010) (0.010) (0.002)
Total assets -0.674** -0.586** -0.668** -0.526* -0.683** -0.556** -0.467* -0.550** -0.408 -0.565**
(0.274) (0.265) (0.275) (0.267) (0.274) (0.272) (0.262) (0.272) (0.265) (0.272)
Liabilities to assets,
lag
-0.612 -0.556 -0.612 -0.821 -0.674 -0.563 -0.509 -0.562 -0.771 -0.624
(0.809) (0.788) (0.811) (0.786) (0.804) (0.801) (0.781) (0.804) (0.779) (0.796)
Firm age 0.265*** -0.162 0.242*** -0.189 0.362** 0.260*** -0.164 0.237*** -0.192 0.359**
(0.097) (0.145) (0.089) (0.157) (0.148) (0.096) (0.144) (0.088) (0.156) (0.147)
Constant 3.529 16.86*** 4.259 16.46*** 1.608 2.27 15.52*** 3.009 15.17*** 0.286
(3.802) (5.217) (3.615) (5.122) (4.558) (3.764) (5.173) (3.578) (5.078) (4.515)
Sector control Yes No No No No Yes No No No No
Firm FE Yes Yes Yes Yes Yes Yes Yes Yes Yes Yes
Year FE Yes Yes Yes Yes Yes Yes Yes Yes Yes Yes
Observations 137 137 137 137 137 136 136 136 136 136
R-squared 0.15 0.191 0.147 0.189 0.153 0.15 0.189 0.146 0.189 0.153
Number of
companies
52 52 52 52 52 51 51 51 51 51
Prob>F 0.0210 0.0041 0.0240 0.0043 0.0190 0.0213 0.0043 0.0244 0.0044 0.0188
Note: Legends (*) to the right of the coefficients represent the significance intervals (*** p<0.01, ** p<0.05, * p<0.1) and robust standard errors are shown in parentheses. The dependent variable Tobin‟s Q is defined in two ways – (i) ratio of firm‟s market capitalisation to total assets and (ii) ratio of firm‟s market capitalisation (plus total debt) to total assets.
Definitions of explanatory variables are presented in Table 1. The regressions results are derived using OLS with firm and year fixed effects estimates.
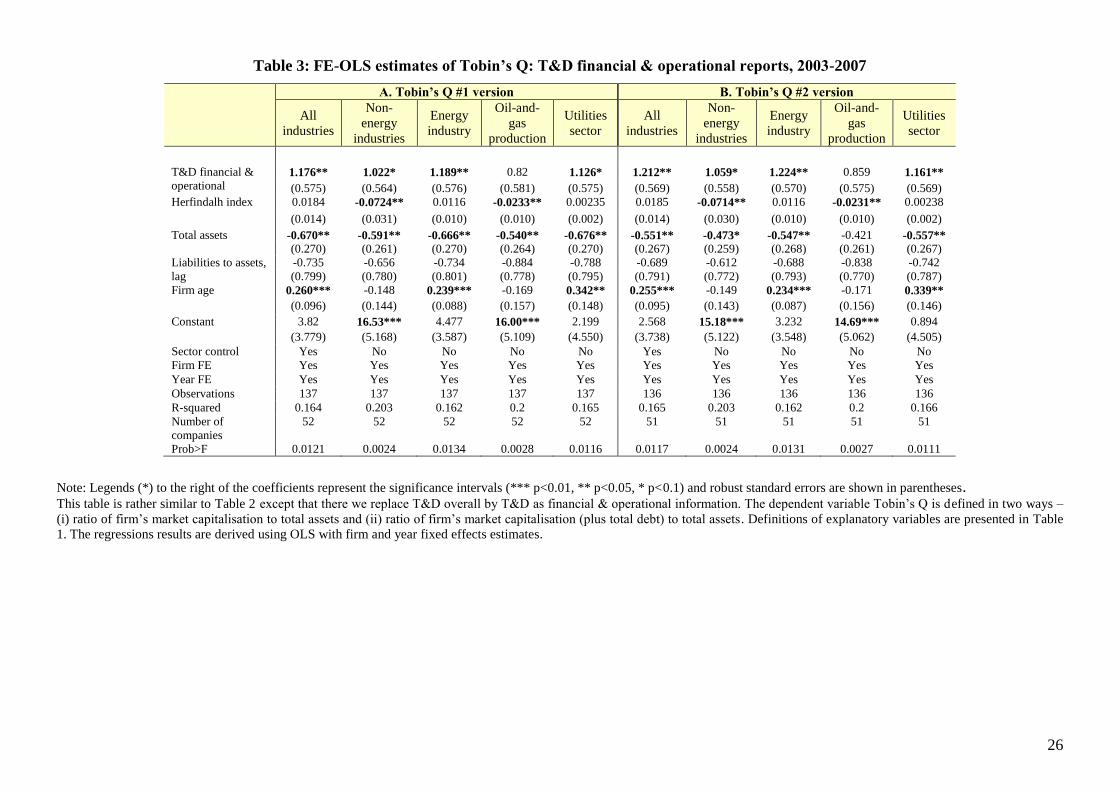
26
Table 3: FE-OLS estimates of Tobin’s Q: T&D financial & operational reports, 2003-2007
A. Tobin’s Q #1 version B. Tobin’s Q #2 version
All
industries
Non-
energy
industries
Energy
industry
Oil-and-
gas
production
Utilities
sector
All
industries
Non-
energy
industries
Energy
industry
Oil-and-
gas
production
Utilities
sector
T&D financial &
operational 1.176** 1.022* 1.189** 0.82 1.126* 1.212** 1.059* 1.224** 0.859 1.161**
(0.575) (0.564) (0.576) (0.581) (0.575) (0.569) (0.558) (0.570) (0.575) (0.569)
Herfindalh index 0.0184 -0.0724** 0.0116 -0.0233** 0.00235 0.0185 -0.0714** 0.0116 -0.0231** 0.00238
(0.014) (0.031) (0.010) (0.010) (0.002) (0.014) (0.030) (0.010) (0.010) (0.002)
Total assets -0.670** -0.591** -0.666** -0.540** -0.676** -0.551** -0.473* -0.547** -0.421 -0.557**
(0.270) (0.261) (0.270) (0.264) (0.270) (0.267) (0.259) (0.268) (0.261) (0.267)
Liabilities to assets,
lag
-0.735 -0.656 -0.734 -0.884 -0.788 -0.689 -0.612 -0.688 -0.838 -0.742
(0.799) (0.780) (0.801) (0.778) (0.795) (0.791) (0.772) (0.793) (0.770) (0.787)
Firm age 0.260*** -0.148 0.239*** -0.169 0.342** 0.255*** -0.149 0.234*** -0.171 0.339**
(0.096) (0.144) (0.088) (0.157) (0.148) (0.095) (0.143) (0.087) (0.156) (0.146)
Constant 3.82 16.53*** 4.477 16.00*** 2.199 2.568 15.18*** 3.232 14.69*** 0.894
(3.779) (5.168) (3.587) (5.109) (4.550) (3.738) (5.122) (3.548) (5.062) (4.505)
Sector control Yes No No No No Yes No No No No
Firm FE Yes Yes Yes Yes Yes Yes Yes Yes Yes Yes
Year FE Yes Yes Yes Yes Yes Yes Yes Yes Yes Yes
Observations 137 137 137 137 137 136 136 136 136 136
R-squared 0.164 0.203 0.162 0.2 0.165 0.165 0.203 0.162 0.2 0.166
Number of
companies
52 52 52 52 52 51 51 51 51 51
Prob>F 0.0121 0.0024 0.0134 0.0028 0.0116 0.0117 0.0024 0.0131 0.0027 0.0111
Note: Legends (*) to the right of the coefficients represent the significance intervals (*** p<0.01, ** p<0.05, * p<0.1) and robust standard errors are shown in parentheses. This table is rather similar to Table 2 except that there we replace T&D overall by T&D as financial & operational information. The dependent variable Tobin‟s Q is defined in two ways –
(i) ratio of firm‟s market capitalisation to total assets and (ii) ratio of firm‟s market capitalisation (plus total debt) to total assets. Definitions of explanatory variables are presented in Table
1. The regressions results are derived using OLS with firm and year fixed effects estimates.
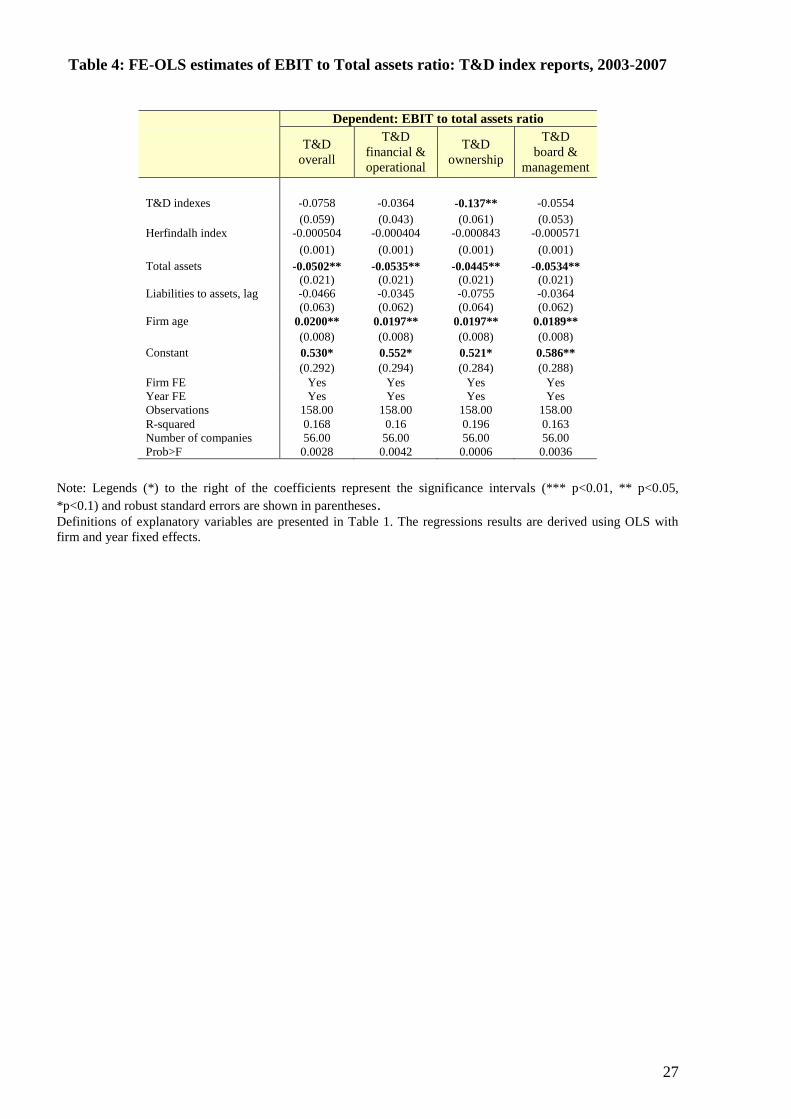
27
Table 4: FE-OLS estimates of EBIT to Total assets ratio: T&D index reports, 2003-2007
Dependent: EBIT to total assets ratio
T&D
overall
T&D
financial &
operational
T&D
ownership
T&D
board &
management
T&D indexes -0.0758 -0.0364 -0.137** -0.0554
(0.059) (0.043) (0.061) (0.053)
Herfindalh index -0.000504 -0.000404 -0.000843 -0.000571
(0.001) (0.001) (0.001) (0.001)
Total assets -0.0502** -0.0535** -0.0445** -0.0534**
(0.021) (0.021) (0.021) (0.021)
Liabilities to assets, lag -0.0466 -0.0345 -0.0755 -0.0364
(0.063) (0.062) (0.064) (0.062)
Firm age 0.0200** 0.0197** 0.0197** 0.0189**
(0.008) (0.008) (0.008) (0.008)
Constant 0.530* 0.552* 0.521* 0.586**
(0.292) (0.294) (0.284) (0.288)
Firm FE Yes Yes Yes Yes
Year FE Yes Yes Yes Yes
Observations 158.00 158.00 158.00 158.00
R-squared 0.168 0.16 0.196 0.163
Number of companies 56.00 56.00 56.00 56.00
Prob>F 0.0028 0.0042 0.0006 0.0036
Note: Legends (*) to the right of the coefficients represent the significance intervals (*** p<0.01, ** p<0.05,
*p<0.1) and robust standard errors are shown in parentheses. Definitions of explanatory variables are presented in Table 1. The regressions results are derived using OLS with
firm and year fixed effects.
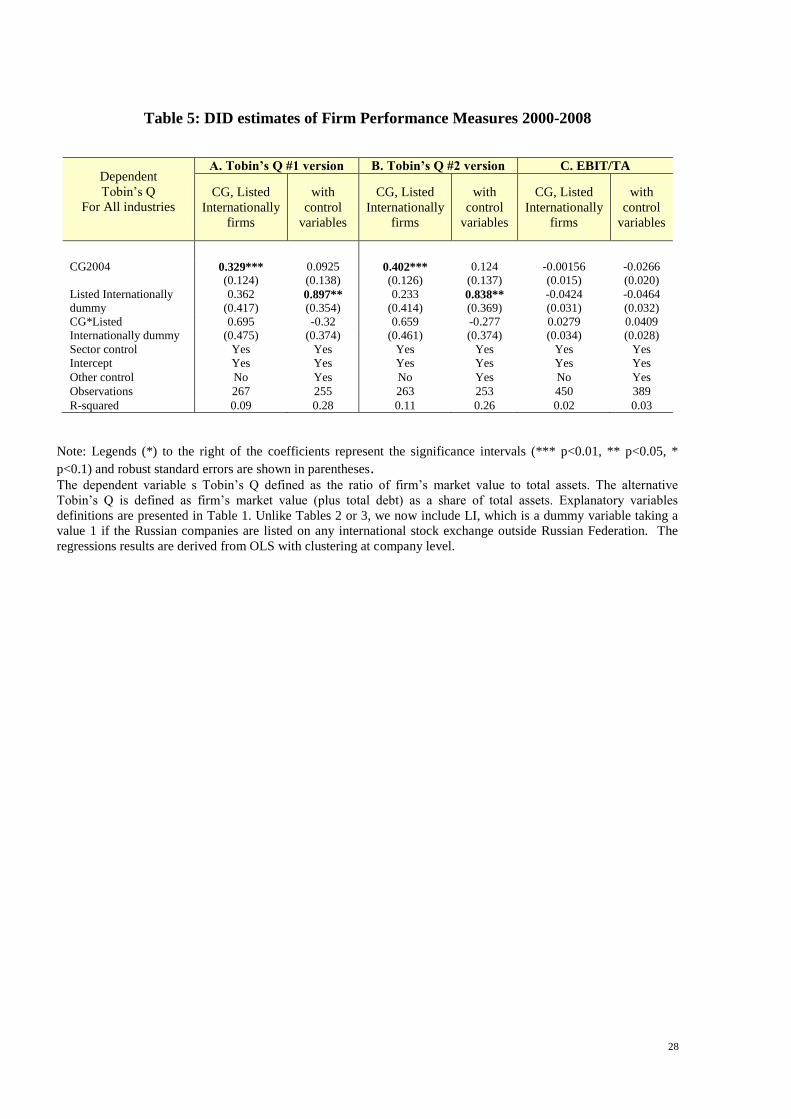
28
Table 5: DID estimates of Firm Performance Measures 2000-2008
Dependent
Tobin‟s Q
For All industries
A. Tobin’s Q #1 version B. Tobin’s Q #2 version C. EBIT/TA
CG, Listed
Internationally
firms
with
control
variables
CG, Listed
Internationally
firms
with
control
variables
CG, Listed
Internationally
firms
with
control
variables
CG2004 0.329*** 0.0925 0.402*** 0.124 -0.00156 -0.0266
(0.124) (0.138) (0.126) (0.137) (0.015) (0.020)
Listed Internationally
dummy
0.362 0.897** 0.233 0.838** -0.0424 -0.0464
(0.417) (0.354) (0.414) (0.369) (0.031) (0.032)
CG*Listed
Internationally dummy
0.695 -0.32 0.659 -0.277 0.0279 0.0409
(0.475) (0.374) (0.461) (0.374) (0.034) (0.028)
Sector control Yes Yes Yes Yes Yes Yes
Intercept Yes Yes Yes Yes Yes Yes
Other control No Yes No Yes No Yes
Observations 267 255 263 253 450 389
R-squared 0.09 0.28 0.11 0.26 0.02 0.03
Note: Legends (*) to the right of the coefficients represent the significance intervals (*** p<0.01, ** p<0.05, *
p<0.1) and robust standard errors are shown in parentheses. The dependent variable s Tobin‟s Q defined as the ratio of firm‟s market value to total assets. The alternative
Tobin‟s Q is defined as firm‟s market value (plus total debt) as a share of total assets. Explanatory variables
definitions are presented in Table 1. Unlike Tables 2 or 3, we now include LI, which is a dummy variable taking a
value 1 if the Russian companies are listed on any international stock exchange outside Russian Federation. The
regressions results are derived from OLS with clustering at company level.
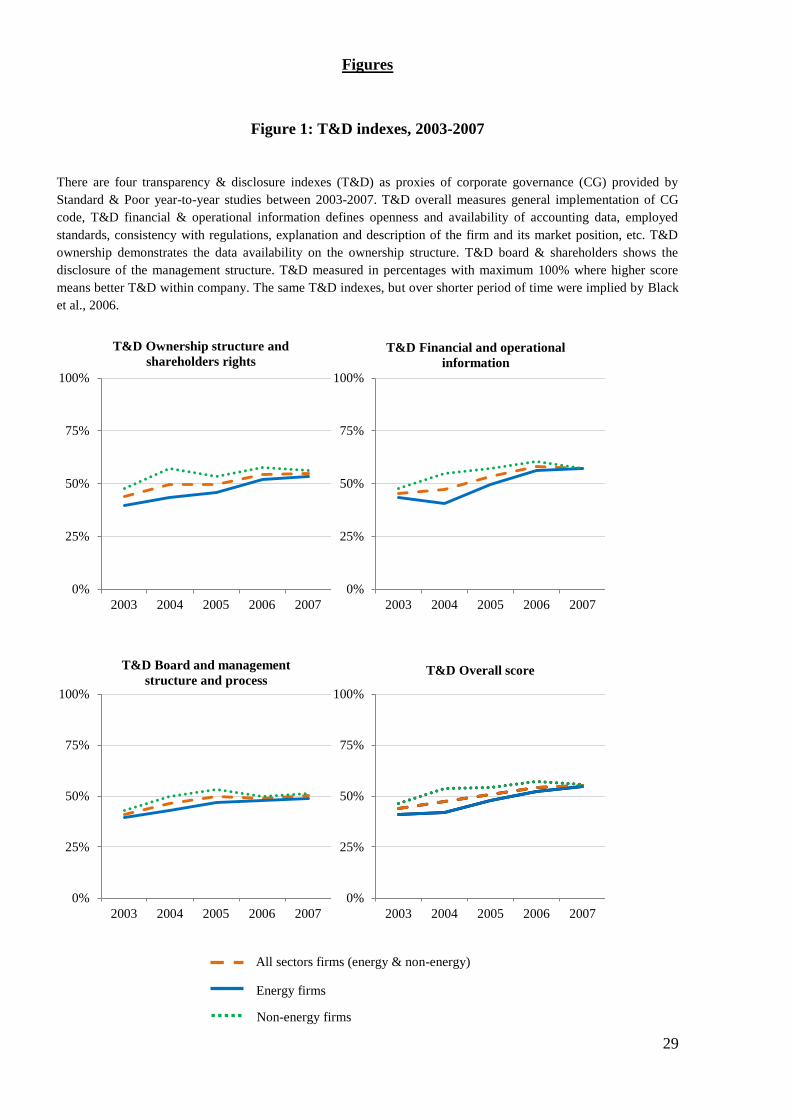
29
Figures
Figure 1: T&D indexes, 2003-2007
There are four transparency & disclosure indexes (T&D) as proxies of corporate governance (CG) provided by
Standard & Poor year-to-year studies between 2003-2007. T&D overall measures general implementation of CG
code, T&D financial & operational information defines openness and availability of accounting data, employed
standards, consistency with regulations, explanation and description of the firm and its market position, etc. T&D
ownership demonstrates the data availability on the ownership structure. T&D board & shareholders shows the
disclosure of the management structure. T&D measured in percentages with maximum 100% where higher score
means better T&D within company. The same T&D indexes, but over shorter period of time were implied by Black
et al., 2006.
0%
25%
50%
75%
100%
2003 2004 2005 2006 2007
T&D Ownership structure and
shareholders rights
0%
25%
50%
75%
100%
2003 2004 2005 2006 2007
T&D Financial and operational
information
0%
25%
50%
75%
100%
2003 2004 2005 2006 2007
T&D Board and management
structure and process
0%
25%
50%
75%
100%
2003 2004 2005 2006 2007
T&D Overall score
All sectors firms (energy & non-energy)
Energy firms
Non-energy firms
30
Appendix 1: Construction of T&D indices 2003-2007 by S&P
The survey was conducted by the Standard & Poor‟s (S&P in short). It uses only publicly available
information, thus emphasizing that, a company‟s transparency score should not be compared with its
corporate governance score (CGS), or otherwise interpreted as a measure of governance standards. A
CGS is our assessment of a company‟s corporate governance practices, which is not limited to
information disclosure. In addition, these scores are assigned on the basis of an in-depth, interactive
analytical process involving both public and non-public data.
Number of companies included
The latest 2007 study covers 80 largest public Russian companies with the most liquid stock. In
2006, S&P analysed 70 companies. In 2005, 2004 and 2003 years the survey covered 54, 50 and 45
respectively.
Criteria to select companies
S&P used two criteria to select the companies in the study: size and liquidity. As a rule, the
liquidity of stocks positively depends on the size of the company, but there are exceptions, especially in
cases of minor free-float. There are more than 300 public companies in Russia, and this sample may not
be representative of all Russian public companies. As the larger companies tend to be more transparent
than smaller ones, our sampling method is likely to cause an upward bias in assessing transparency of the
entire population of public Russian companies. On the other hand, as the companies included in the
survey account for about 80% of the cumulative capitalization of the Russian stock market, they represent
the major part of the Russian economy in terms of assets and operations.
S&P’s industries covered
S&P covers such industries as Telecommunications, metallurgy, utilities, oil-and-gas, banking,
food, consumer and retails and IT engineering. In our analysis we classify these industries between
energy and non-energy sectors and compare those with all-industries together. We apply Classification
Standard (GICS) codes to classify firms in our sample. As we focus on energy industry, GICS allowed us
to identify 9 main energy subsectors within the energy industry. We have selected utilities and oil-and-gas
producers as the two largest ones consisting 64% of overall energy sector. We provide the fill firms
sample in the Appendix 2.
Components of T&D indices and scoring
S&P have introduced six components and grouped these in three T&D scores. Subject to these
clarifications, these are:
T&D ownership structure and shareholders rights
T&D financial and operational information
T&D board and management structure
The first T&D consists of “ownership structure” and “shareholder rights” which represented by 17
questions each. The next T&D is a composition of „financial information” and “operational information”
disclosure. These are based on 31and 16 questions respectively. The last third T&D scoring consists of
“board and management information” and “board and management remuneration”, based on 16 and 8
questions. S&P then calculated the scores for each answer in every section and provided with the total
scores for each T&D for the observed companies. The score has a range of minimum 0% and maxim
100% for the best transparency & disclosure. S&P does not explain the methodology behind the
percentage score as it uses specially designed method. We show the T&D scorings for each
observed company in Appendix 2.
Component 1. Ownership structure
Disclosure of:
1. The number and par value of issued ordinary shares.
2. The number and par value of issued other types of shares disclosed.
3. The number and par value of authorized but unissued shares of all types.
4. The identity of the largest shareholder.
5. The identity of holders of all large stakes (blocking: > 25%; controlling:> 50%).
31
6. The identity of shareholders holding at least 25% of voting shares in total.
7. The identity of shareholders holding at least 50% of voting shares in total.
8. The identity of shareholders holding at least 75% of voting shares in total.
9. The number and identity of each shareholder holding more than 10%.
10. The indication that management is not aware of the existence of anystake exceeding 5% in except for
those that are reported.
11 .Shareholding in the company by individual senior managers.
12. Shareholding in the company by individual directors.
13 .The description of share classes.
14. A review of shareholders by type.
15. The percentage of cross-ownership.
16. Information about listings on exchanges.
17. Information about indirect ownership (e.g., convertible instruments).
Component 2. Shareholder rights
Disclosure of:
18. Corporate governance charter or corporate governance guidelines.
19. Evidence of existence of a code of business conduct and ethics.
20. The contents of the code of business conduct and ethics.
21. Articles of association (including changes).
22. Voting rights for each voting or nonvoting share.
23. The way that shareholders nominate directors to the board.
24. The way that shareholders convene an extraordinary general meeting (EGM).
25. Procedure for initiating inquiries with the board.
26. Procedure for putting forward proposals at shareholders meetings.
27. Formalized dividend policy.
28. Announcement of recommended dividends before the record date.
29. Review of the last shareholders meeting.
30. Full general shareholder meeting (GSM) minutes.
31 .Calendar of important shareholder future dates.
32. GSM materials published on the Web site.
33 .Detailed press releases covering last corporate events.
34. Policy on information disclosure.
Component 3. Financial information
Disclosure of:
35. The company‟s accounting policy.
36. The accounting standards it uses for its accounts.
37. Accounts according to local standards.
38. Annual financial statements according to an internationally recognized accounting standard
(IFRS/U.S. GAAP).
39. Notes to annual financial statements according to IFRS/U.S. GAAP.
40. Independent auditor‟s report on annual financial statements according to IFRS/U.S. GAAP.
41. Unqualified (clean) audit opinion on annual financial statements according to IFRS/U.S. GAAP.
42. Audited IFRS/U.S. GAAP financial statements published before the end of April.
43. Unaudited IFRS/U.S. GAAP financial statements published before the end of April.
44. Audited IFRS/U.S. GAAP financial statements published before annual general meeting.
45. Unaudited IFRS/U.S. GAAP financial statements published before the end of June.
46. Disclosure of related-party transactions (RPTs): sales to/purchases from payables to/receivables from
related parties.
47. Indication that RPTs are made on market or nonmarket terms.
48. Exact terms of RPTs.
49. Interim (quarterly or semi-annual) financial statements according to an internationally recognized
accounting standard (IFRS/U.S. GAAP).
50. Notes to these financial statements.
51. Whether these financial statements are audited or at least reviewed.
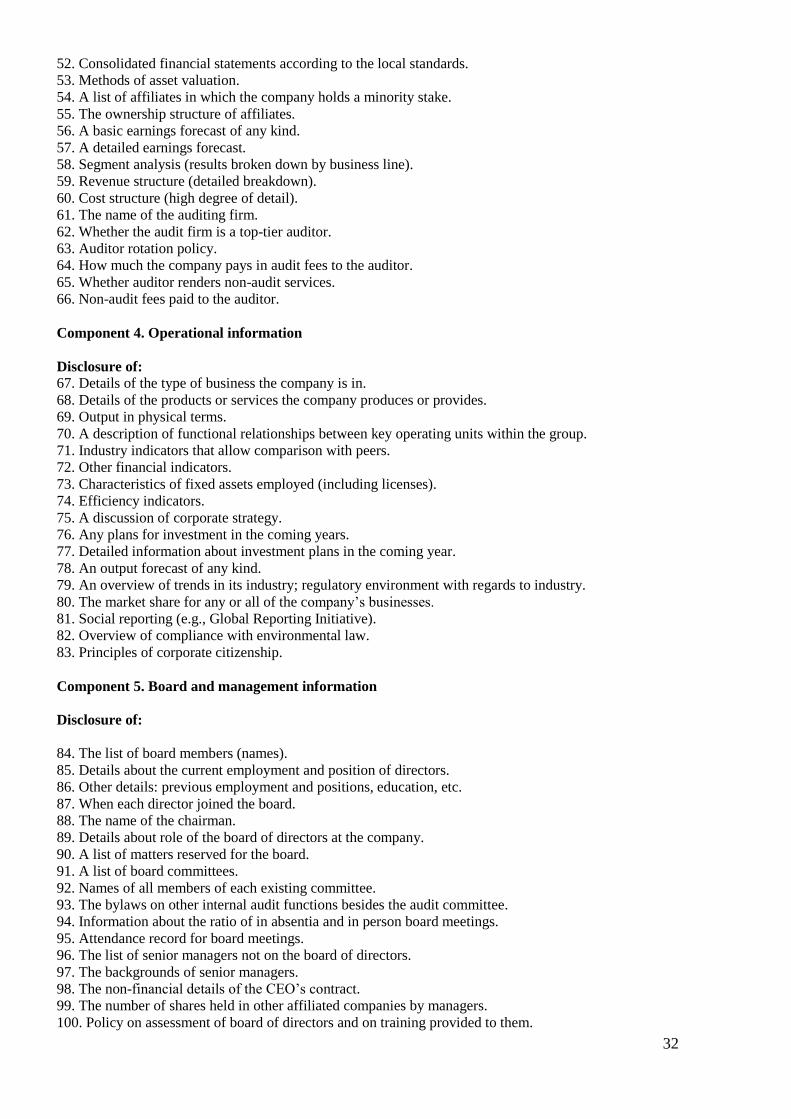
32
52. Consolidated financial statements according to the local standards.
53. Methods of asset valuation.
54. A list of affiliates in which the company holds a minority stake.
55. The ownership structure of affiliates.
56. A basic earnings forecast of any kind.
57. A detailed earnings forecast.
58. Segment analysis (results broken down by business line).
59. Revenue structure (detailed breakdown).
60. Cost structure (high degree of detail).
61. The name of the auditing firm.
62. Whether the audit firm is a top-tier auditor.
63. Auditor rotation policy.
64. How much the company pays in audit fees to the auditor.
65. Whether auditor renders non-audit services.
66. Non-audit fees paid to the auditor.
Component 4. Operational information
Disclosure of:
67. Details of the type of business the company is in.
68. Details of the products or services the company produces or provides.
69. Output in physical terms.
70. A description of functional relationships between key operating units within the group.
71. Industry indicators that allow comparison with peers.
72. Other financial indicators.
73. Characteristics of fixed assets employed (including licenses).
74. Efficiency indicators.
75. A discussion of corporate strategy.
76. Any plans for investment in the coming years.
77. Detailed information about investment plans in the coming year.
78. An output forecast of any kind.
79. An overview of trends in its industry; regulatory environment with regards to industry.
80. The market share for any or all of the company‟s businesses.
81. Social reporting (e.g., Global Reporting Initiative).
82. Overview of compliance with environmental law.
83. Principles of corporate citizenship.
Component 5. Board and management information
Disclosure of:
84. The list of board members (names).
85. Details about the current employment and position of directors.
86. Other details: previous employment and positions, education, etc.
87. When each director joined the board.
88. The name of the chairman.
89. Details about role of the board of directors at the company.
90. A list of matters reserved for the board.
91. A list of board committees.
92. Names of all members of each existing committee.
93. The bylaws on other internal audit functions besides the audit committee.
94. Information about the ratio of in absentia and in person board meetings.
95. Attendance record for board meetings.
96. The list of senior managers not on the board of directors.
97. The backgrounds of senior managers.
98. The non-financial details of the CEO‟s contract.
99. The number of shares held in other affiliated companies by managers.
100. Policy on assessment of board of directors and on training provided to them.

33
Component 6. Board and management remuneration
Disclosure of:
101. The decision-making process for directors‟ pay.
102. The specifics of directors‟ pay, including the salary levels.
103. The form of directors‟ salaries, such as whether they are in cash or shares.
104. The specifics of performance-related pay for directors.
105. The decision-making process for determining managerial (not board) pay.
106. The specifics of managers‟ (not board) pay, such as salary levels and bonuses.
107. The form of managers‟ (not board) pay.
108. The specifics of performance-related pay for managers.
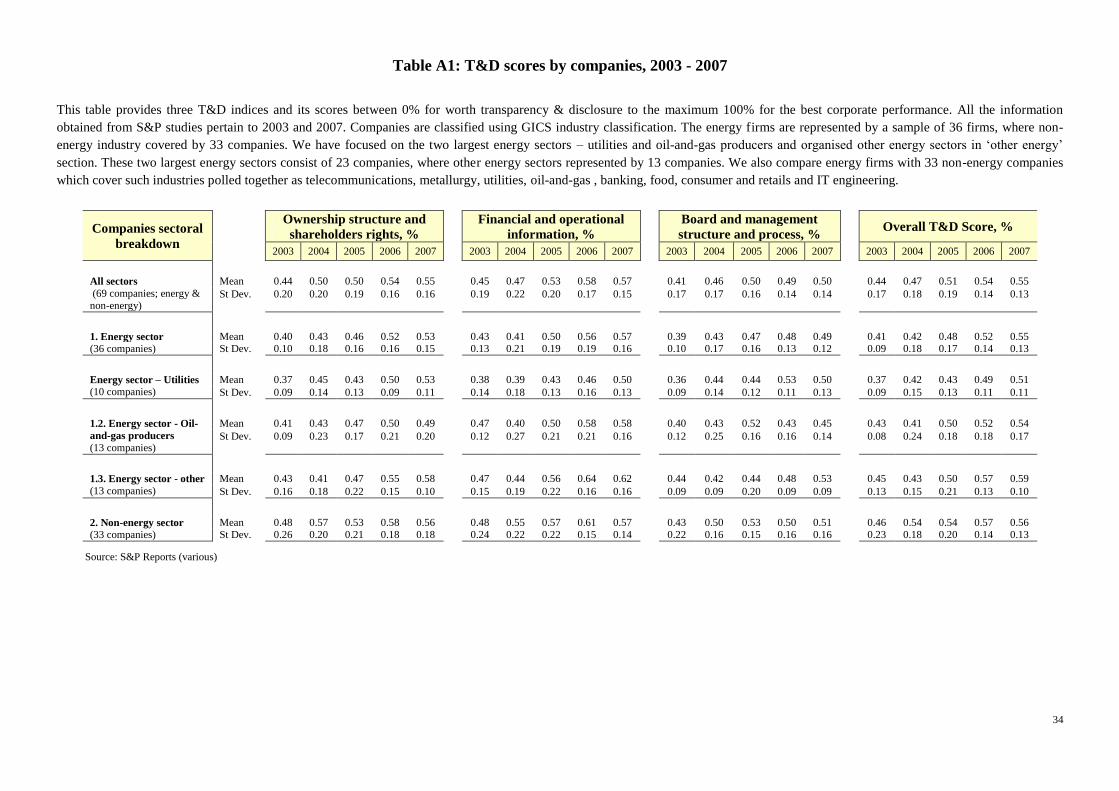
34
Table A1: T&D scores by companies, 2003 - 2007
This table provides three T&D indices and its scores between 0% for worth transparency & disclosure to the maximum 100% for the best corporate performance. All the information
obtained from S&P studies pertain to 2003 and 2007. Companies are classified using GICS industry classification. The energy firms are represented by a sample of 36 firms, where non-
energy industry covered by 33 companies. We have focused on the two largest energy sectors – utilities and oil-and-gas producers and organised other energy sectors in „other energy‟
section. These two largest energy sectors consist of 23 companies, where other energy sectors represented by 13 companies. We also compare energy firms with 33 non-energy companies
which cover such industries polled together as telecommunications, metallurgy, utilities, oil-and-gas , banking, food, consumer and retails and IT engineering.
Companies sectoral
breakdown
Ownership structure and
shareholders rights, %
Financial and operational
information, %
Board and management
structure and process, %
Overall T&D Score, %
2003 2004 2005 2006 2007
2003 2004 2005 2006 2007
2003 2004 2005 2006 2007
2003 2004 2005 2006 2007
All sectors
(69 companies; energy & non-energy)
Mean 0.44 0.50 0.50 0.54 0.55
0.45 0.47 0.53 0.58 0.57
0.41 0.46 0.50 0.49 0.50
0.44 0.47 0.51 0.54 0.55
St Dev. 0.20 0.20 0.19 0.16 0.16 0.19 0.22 0.20 0.17 0.15 0.17 0.17 0.16 0.14 0.14 0.17 0.18 0.19 0.14 0.13
1. Energy sector Mean 0.40 0.43 0.46 0.52 0.53 0.43 0.41 0.50 0.56 0.57 0.39 0.43 0.47 0.48 0.49 0.41 0.42 0.48 0.52 0.55 (36 companies) St Dev. 0.10 0.18 0.16 0.16 0.15 0.13 0.21 0.19 0.19 0.16 0.10 0.17 0.16 0.13 0.12 0.09 0.18 0.17 0.14 0.13
Energy sector – Utilities
(10 companies) Mean 0.37 0.45 0.43 0.50 0.53 0.38 0.39 0.43 0.46 0.50 0.36 0.44 0.44 0.53 0.50 0.37 0.42 0.43 0.49 0.51
St Dev. 0.09 0.14 0.13 0.09 0.11 0.14 0.18 0.13 0.16 0.13 0.09 0.14 0.12 0.11 0.13 0.09 0.15 0.13 0.11 0.11
1.2. Energy sector - Oil-
and-gas producers
(13 companies)
Mean 0.41 0.43 0.47 0.50 0.49 0.47 0.40 0.50 0.58 0.58 0.40 0.43 0.52 0.43 0.45 0.43 0.41 0.50 0.52 0.54
St Dev. 0.09 0.23 0.17 0.21 0.20 0.12 0.27 0.21 0.21 0.16 0.12 0.25 0.16 0.16 0.14 0.08 0.24 0.18 0.18 0.17
1.3. Energy sector - other
(13 companies)
Mean 0.43 0.41 0.47 0.55 0.58 0.47 0.44 0.56 0.64 0.62 0.44 0.42 0.44 0.48 0.53 0.45 0.43 0.50 0.57 0.59
St Dev. 0.16 0.18 0.22 0.15 0.10 0.15 0.19 0.22 0.16 0.16 0.09 0.09 0.20 0.09 0.09 0.13 0.15 0.21 0.13 0.10
2. Non-energy sector
(33 companies) Mean 0.48 0.57 0.53 0.58 0.56 0.48 0.55 0.57 0.61 0.57 0.43 0.50 0.53 0.50 0.51 0.46 0.54 0.54 0.57 0.56 St Dev. 0.26 0.20 0.21 0.18 0.18 0.24 0.22 0.22 0.15 0.14 0.22 0.16 0.15 0.16 0.16 0.23 0.18 0.20 0.14 0.13
Source: S&P Reports (various)
Recommended